Genome-scale annotation of protein binding sites via language model and geometric deep learning
- School of Computer Science and Engineering, Sun Yat-sen University, China
Figures
Figure 1
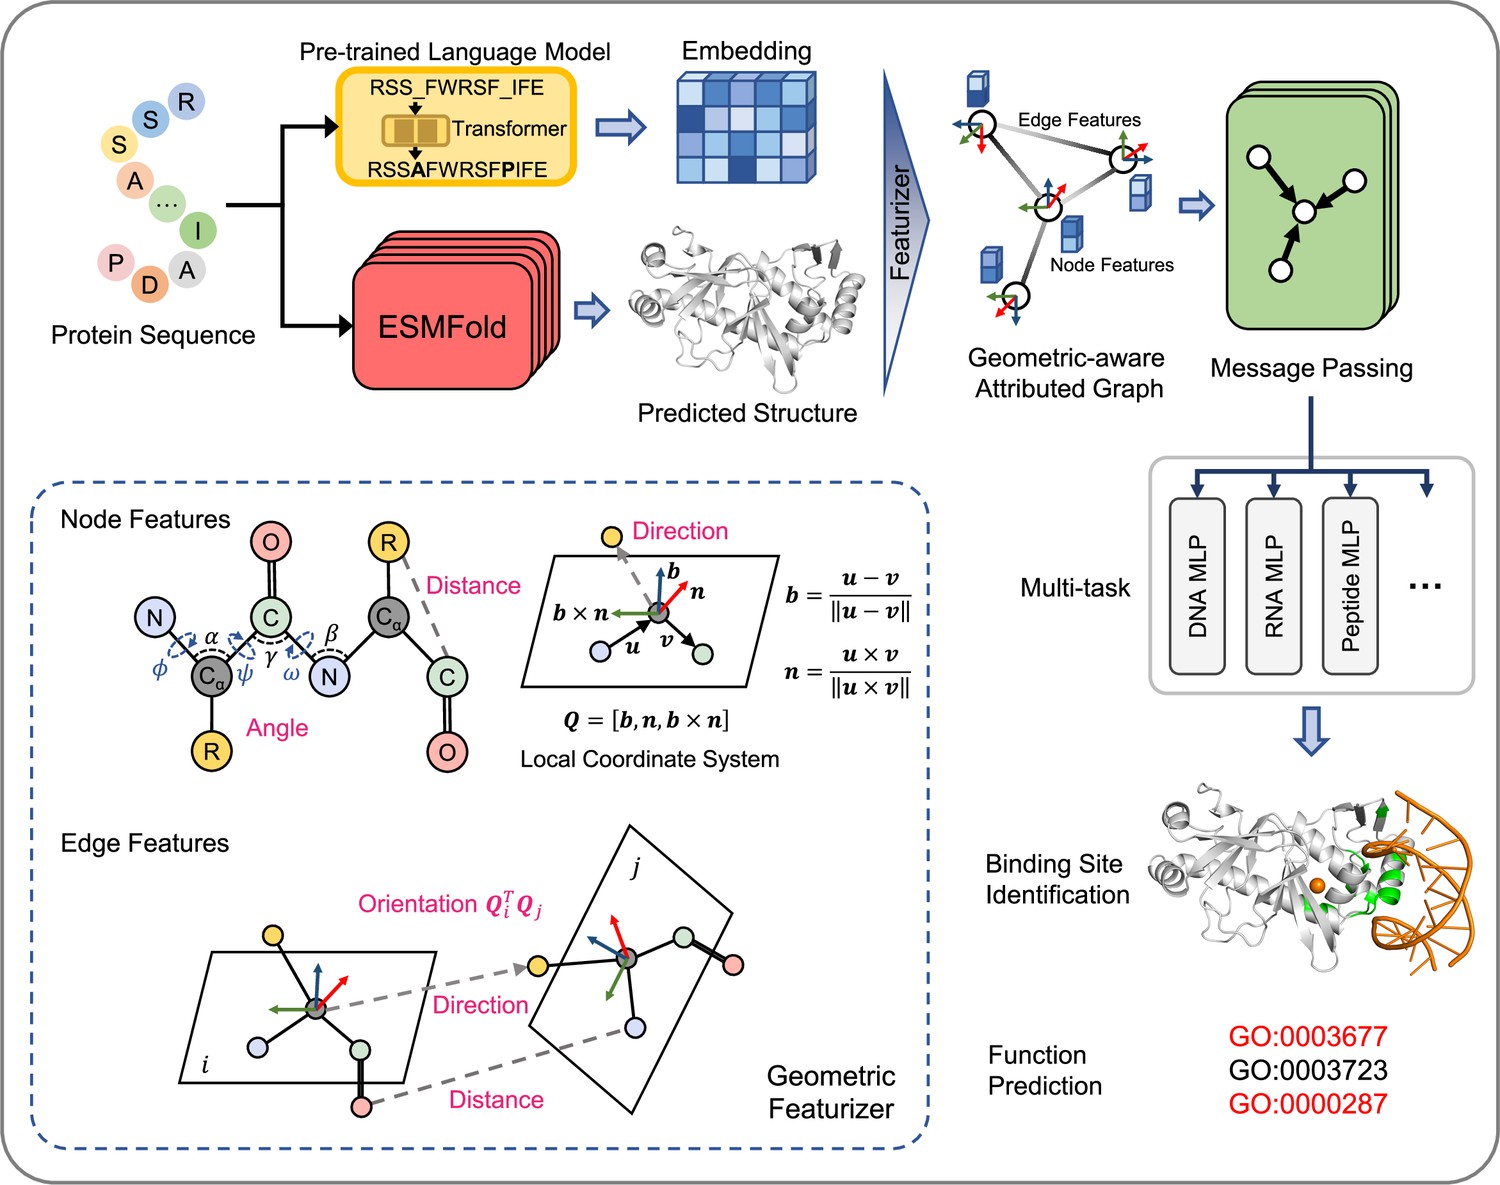
The overview of GPSite.
The protein sequence is input to the pre-trained language model ProtTrans and the folding model ESMFold to generate the sequence embedding and predicted structure, respectively. According to the structure, a protein radius graph is constructed where residues constitute the nodes and adjacent nodes are connected by edges. In addition to the pre-computed residue features of ProtTrans embedding and DSSP structural properties, a comprehensive, end-to-end geometric featurizer is employed to extract the geometric node features including distance, direction and angle, as well as geometric edge features between residues including distance, direction and orientation. Here, the R group denotes the centroid of the heavy sidechain atoms. The resulting geometric-aware attributed graph is input to a shared GNN to perform edge-enhanced message passing for capturing the common binding-relevant characteristics among different molecules. Finally, 10 ligand-specific MLPs are adopted to learn the binding patterns of particular molecules in a multi-task manner. Examples of the applications of GPSite include binding site identification and protein-level Gene Ontology (GO; Ashburner et al., 2000) function prediction.
Figure 2
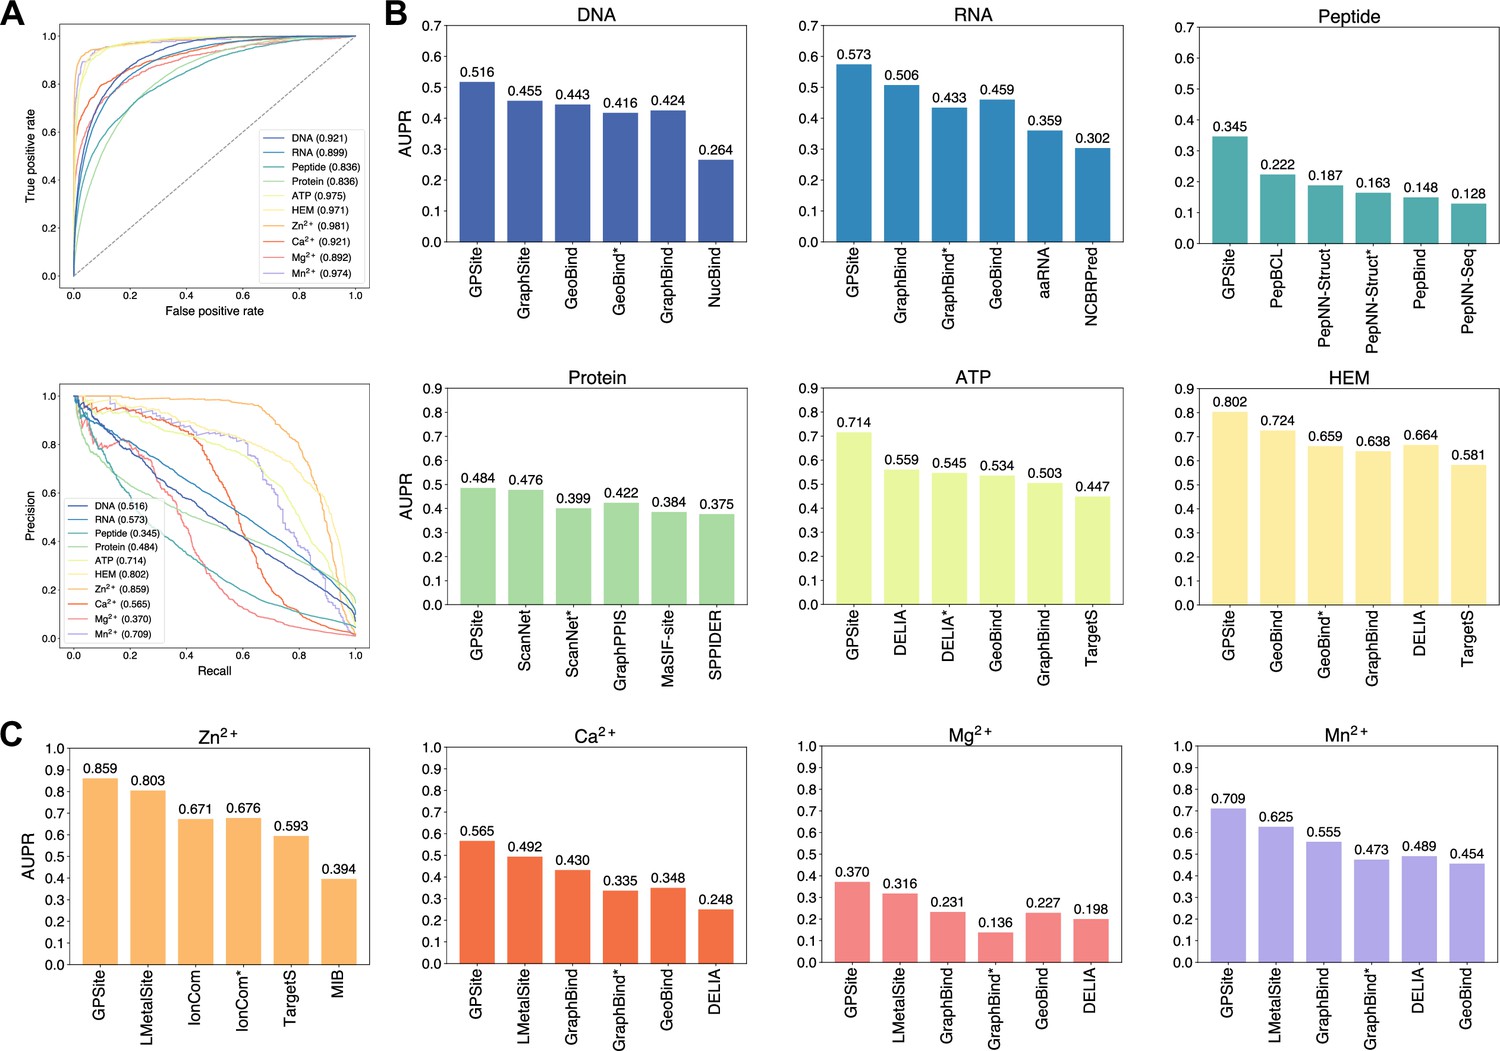
The performance of GPSite and the state-of-the-art methods.
(A) The ROC and precision-recall curves of GPSite on the 10 binding site test sets. The numbers in the legends are areas under the curves. (B–C) The AUPR values of the top-performing methods in each test set. The methods marked with * denote evaluations using the ESMFold-predicted structures as input.
Figure 3
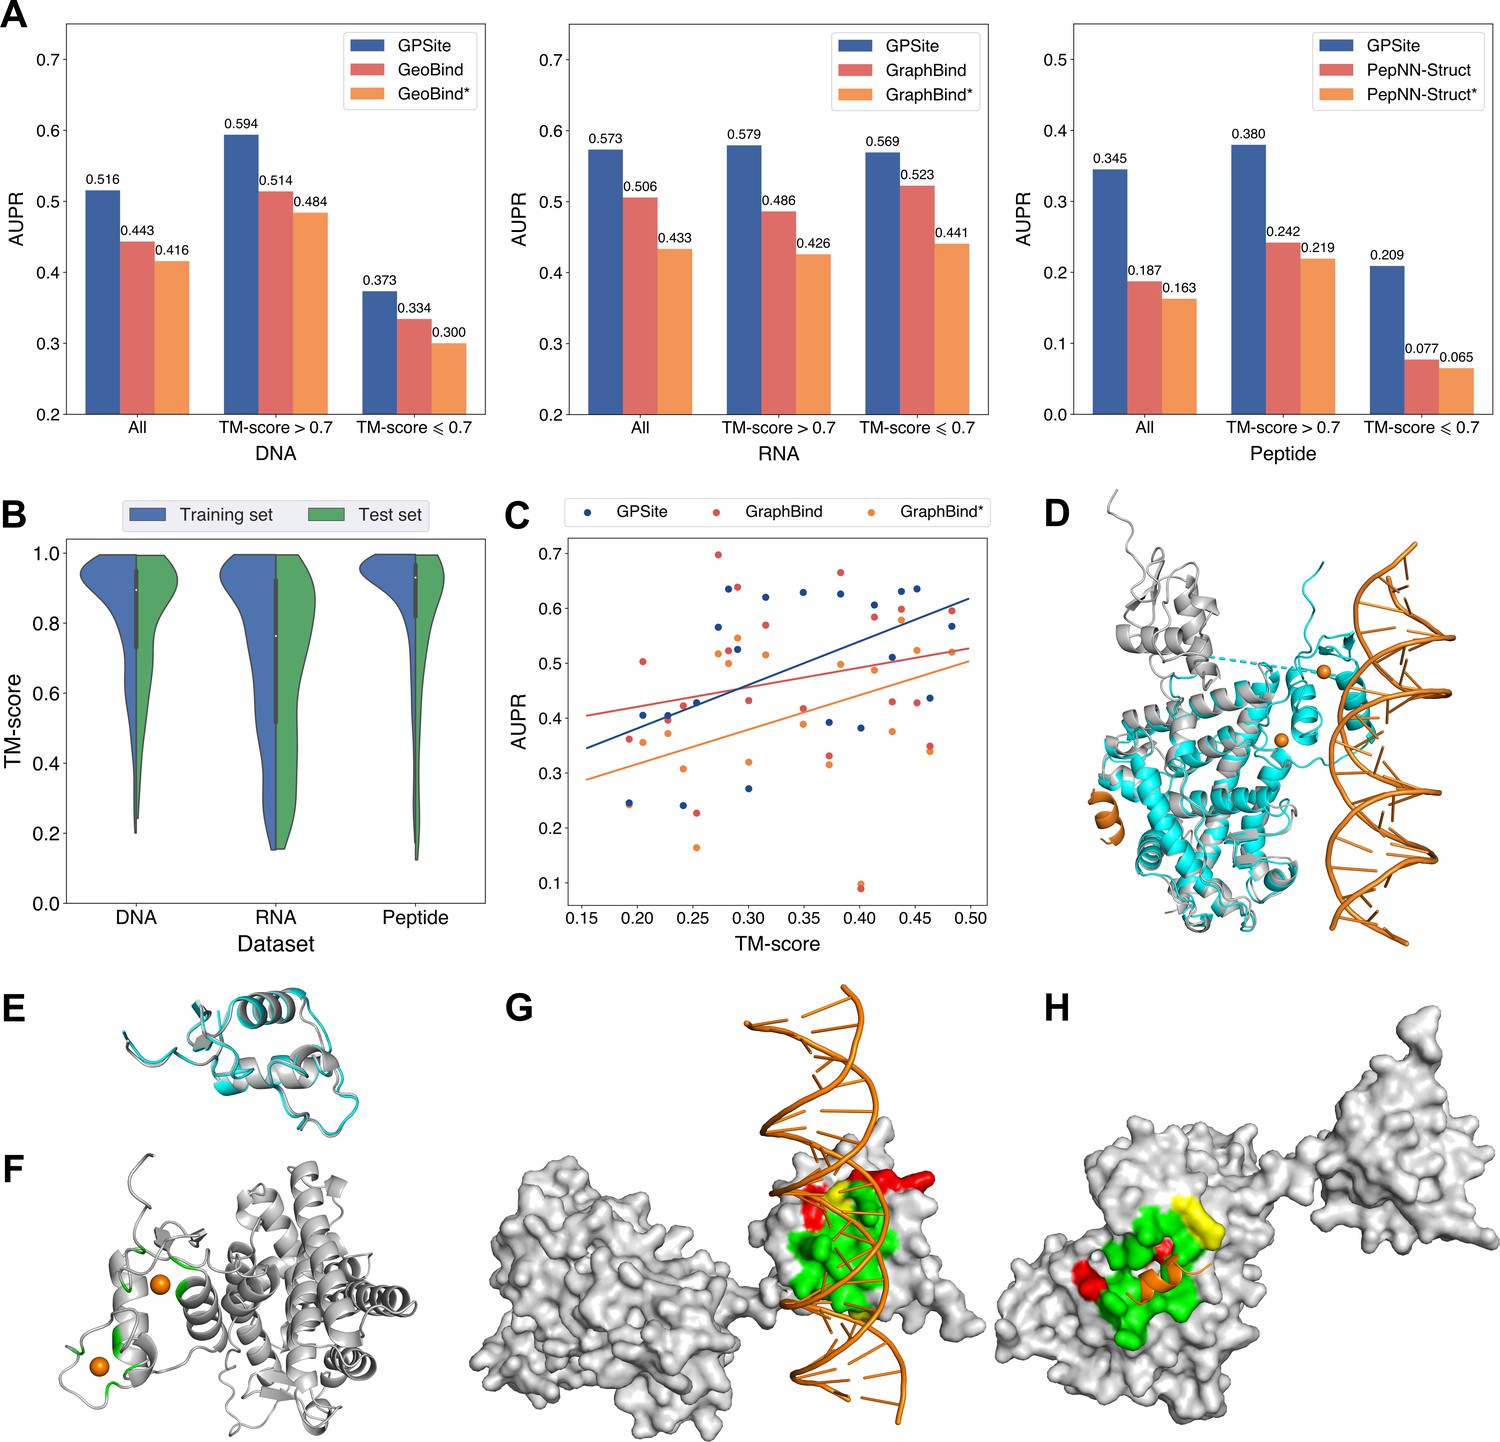
The performance of GPSite on low-quality predicted structures.
(A) The performance of GPSite on structures of different qualities, and the comparisons with the best experimental structure-based methods in the test sets of DNA, RNA, and peptide. The experimental structure-based methods input with ESMFold-predicted structures are marked with *. (B) Distributions of the TM-scores between native and predicted structures in the DNA, RNA and peptide datasets. (C) The correlations between the prediction quality of ESMFold and the performance of GPSite and GraphBind on the RNA-binding site test set when TM-score <0.5. The scatters denote the average TM-score and AUPR for each bin after sorting the proteins according to the TM-scores and evenly dividing them into 20 discrete bins. The lines are fit to the original data (without binning) using linear regression. (D) The glucocorticoid receptor (GR) in complex with DNA, a coactivator peptide, and Zn2+ ions (PDB: 7PRW). The ESMFold-predicted protein structure (gray) is superimposed to the native structure (cyan) using US-align (TM-score=0.72). The ligands are colored in orange. (E) Superposition of the native (cyan) and predicted (gray) DNA-binding domains of GR (TM-score=0.96). (F–H) The Zn2+, DNA and peptide binding site predictions by GPSite for the predicted GR structure in cartoon or surface view. True positives, false positives and false negatives are colored in green, red and yellow, respectively. The ligands in orange were subsequently added based on the native complex structure to show the quality of the predictions by GPSite.
Figure 4
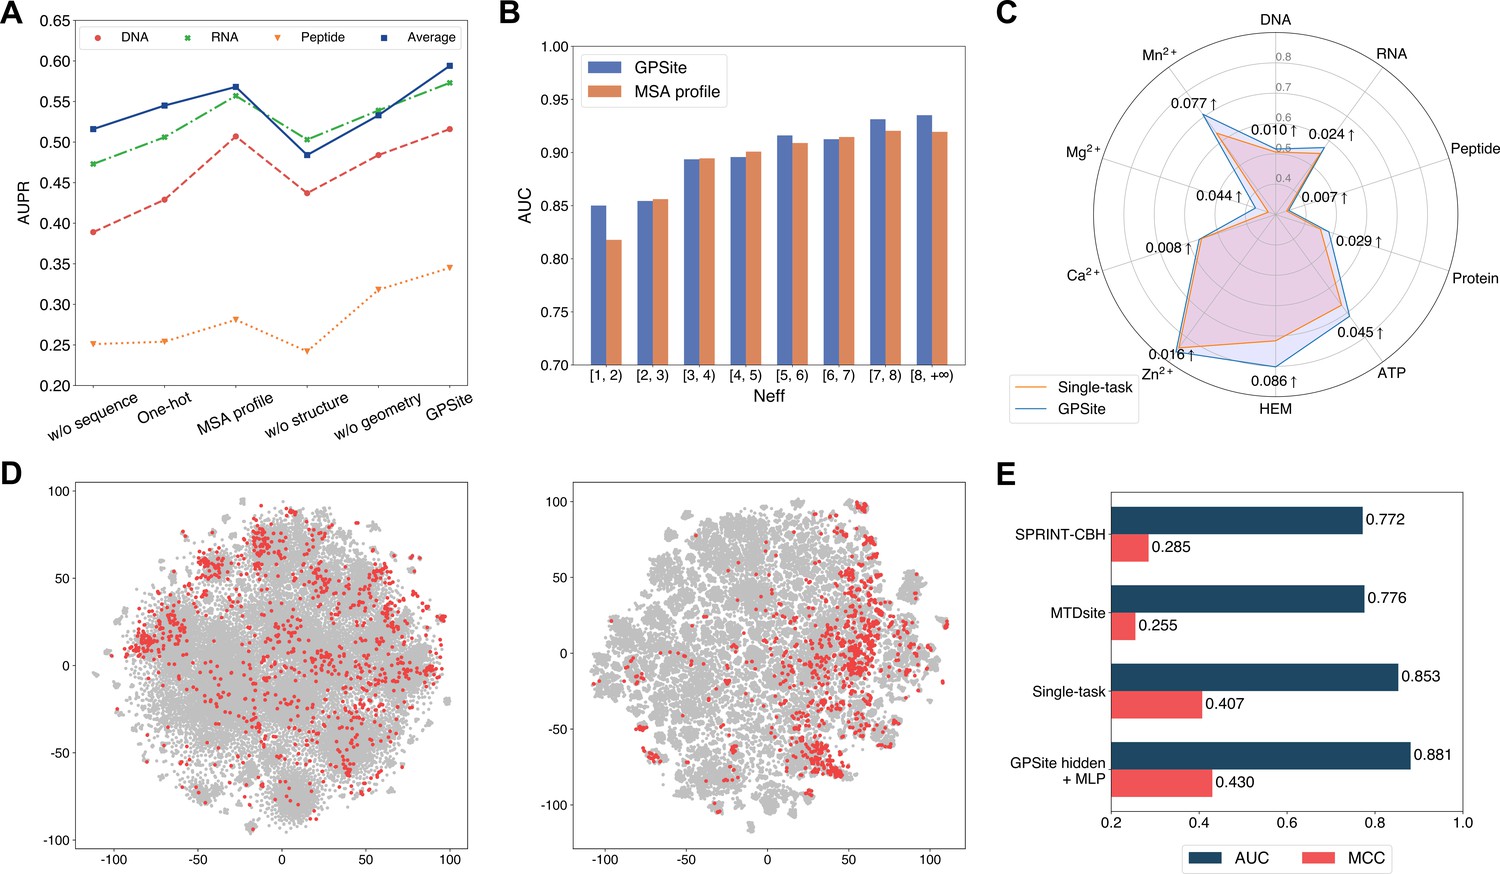
The effects of protein features and model designs.
(A) Ablation studies on sequence and structure information in the DNA, RNA, and peptide test sets. The average performance of the 10 test sets is also shown. (B) Performance comparison between GPSite and the baseline model using MSA profile for proteins with different Neff values in the combined test set of the 10 ligands. (C) Performance boosts in AUPR using GPSite compared to the single-task baseline. (D) Visualization of the distributions of residues encoded by raw feature vectors (left) or hidden embedding vectors from the pre-trained shared network in GPSite (right) for the unseen carbohydrate-binding site dataset using t-SNE. The binding and non-binding residues are colored in red and gray, respectively. (E) The performance when using the hidden embeddings from GPSite as input features to train an MLP for carbohydrate-binding site prediction, and its comparisons with other methods.
Figure 5
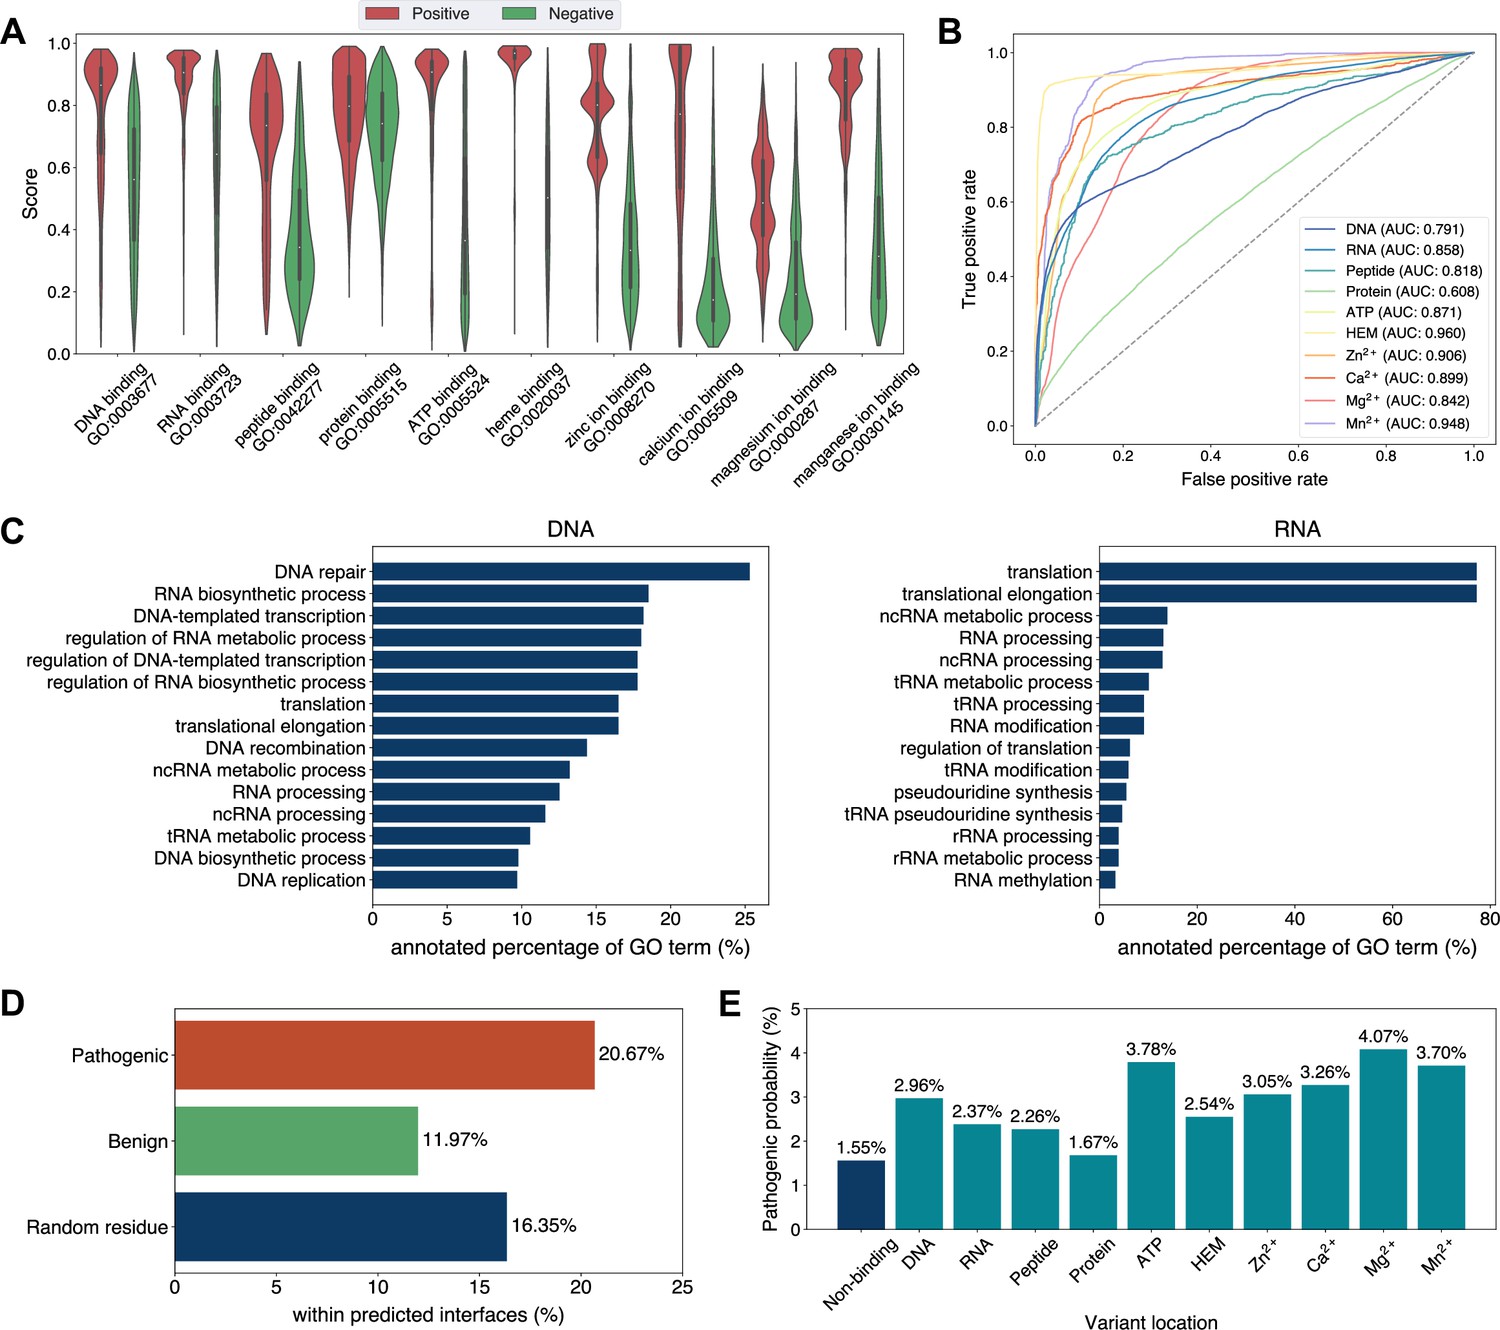
Analyses of Swiss-Prot based on the binding site annotations by GPSite.
(A) The distributions of the binding scores assigned by GPSite for proteins with or without certain ligand-binding molecular function in GO. (B) The ROC curves when using the GPSite binding scores to distinguish between binding and non-binding proteins of various ligands. (C) The percentage of proteins predicted as binding to DNA and RNA by GPSite to be annotated with certain biological process in Swiss-Prot. Only the specific biological process terms with depth ≥8 in the GO directed acyclic graph are considered, among which the top 15 terms with the highest percentages are displayed. (D) The percentage of surface pathogenic or benign natural variant sites within GPSite-predicted interfaces. The baseline is the probability of a random surface residue being annotated as an interface residue. (E) The pathogenic probabilities of variants located in non-binding sites or different types of binding sites predicted by GPSite.
Appendix 3—figure 1
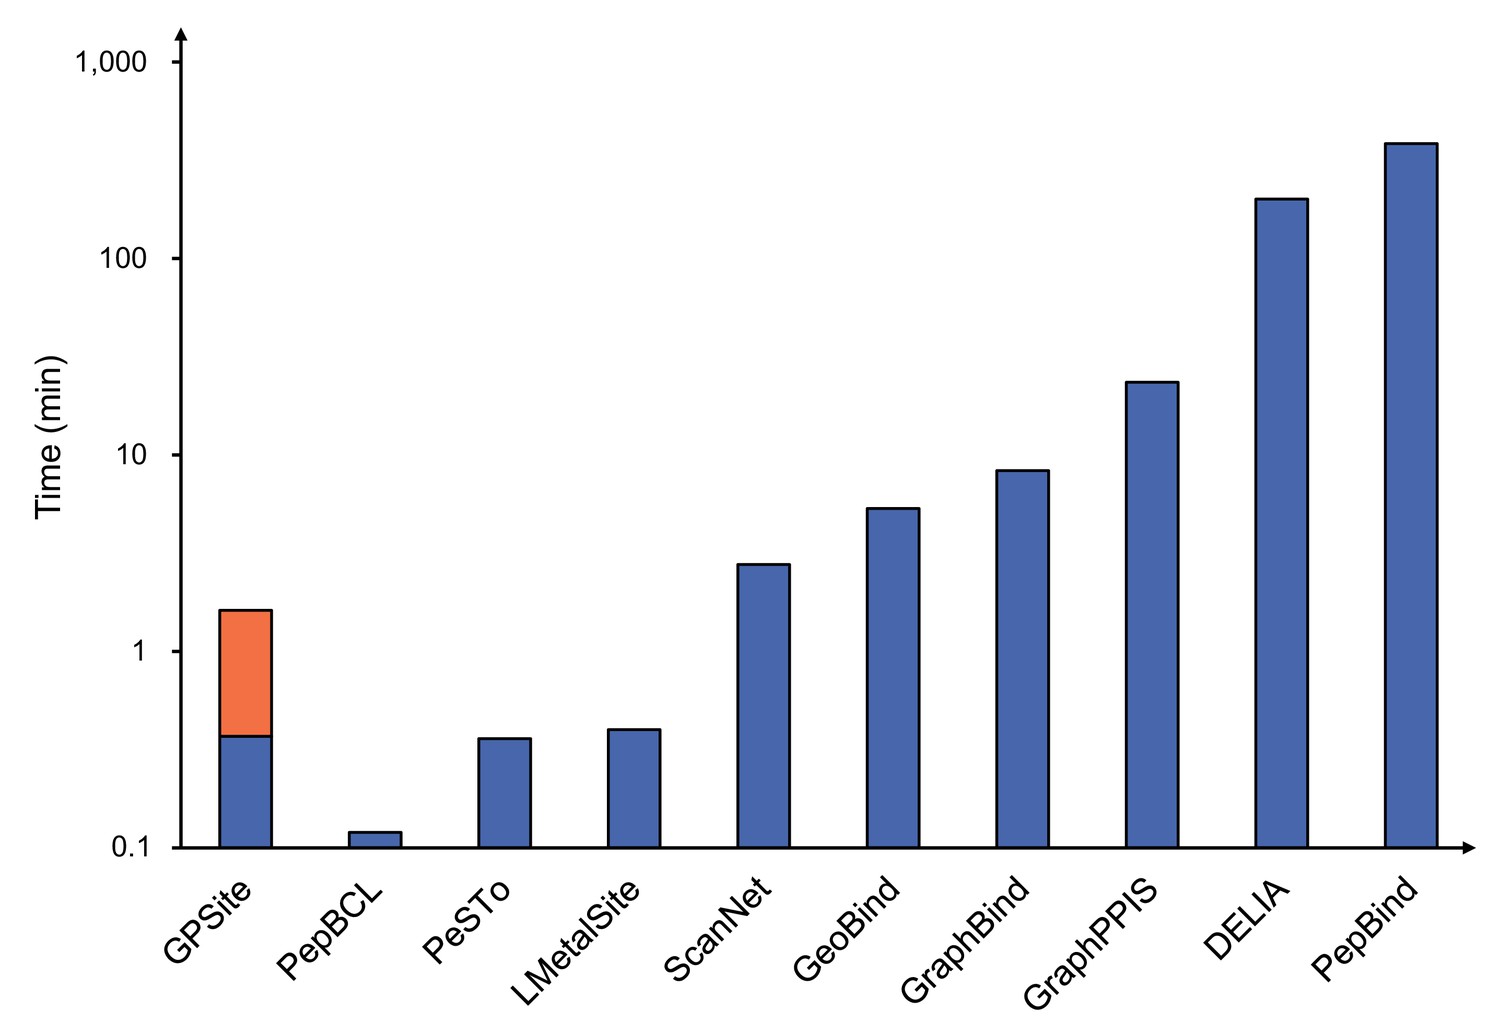
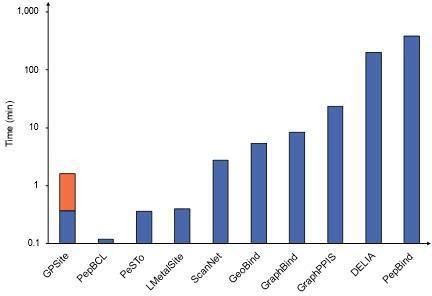
Runtime comparison of the GPSite webserver with other top-performing servers.
Five protein chains (i.e. 8HN4_B, 8USJ_A, 8C1U_A, 8K3V_A, and 8EXO_A) comprising 100, 300, 500, 700, and 900 residues, respectively, were selected for testing, and the average runtime is reported for each method. Note that a significant portion of GPSite’s runtime (75 s, indicated in orange) is allocated to structure prediction using ESMFold.
Appendix 3—figure 2
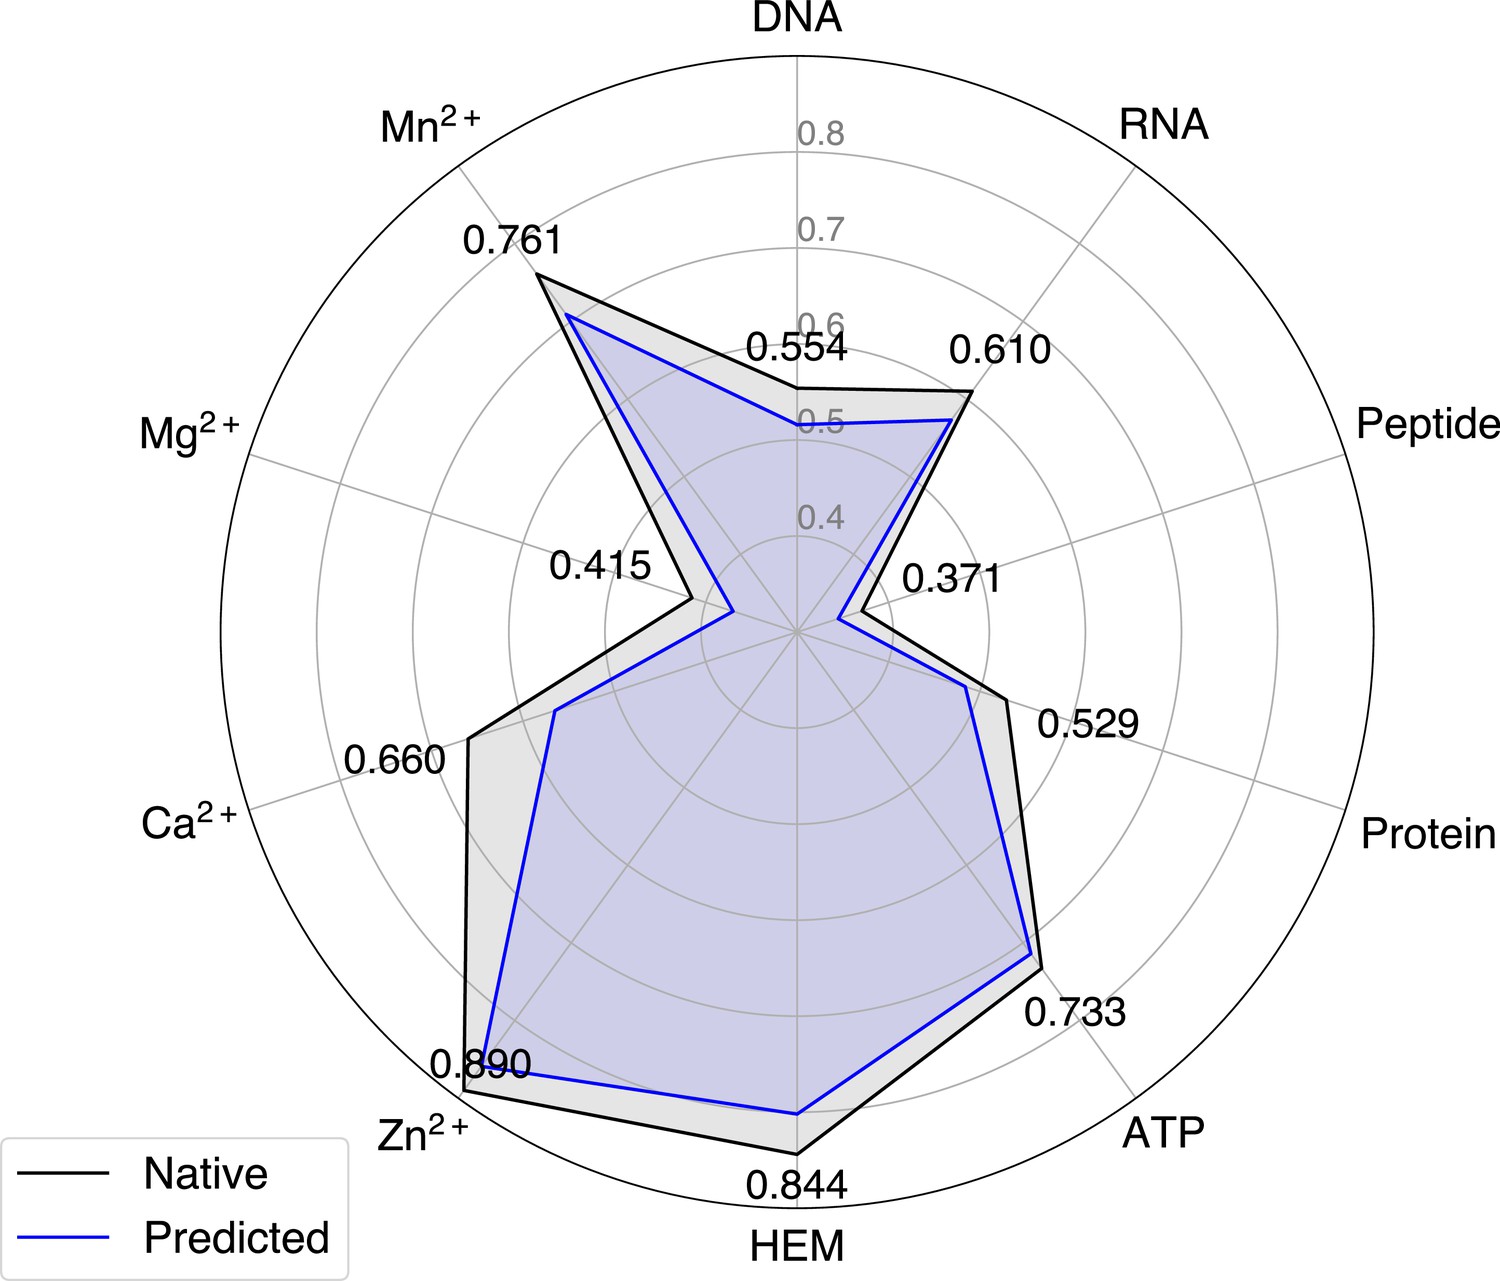
The performance of GPSite when using native or predicted structures as input during the test phase.
Appendix 3—figure 3
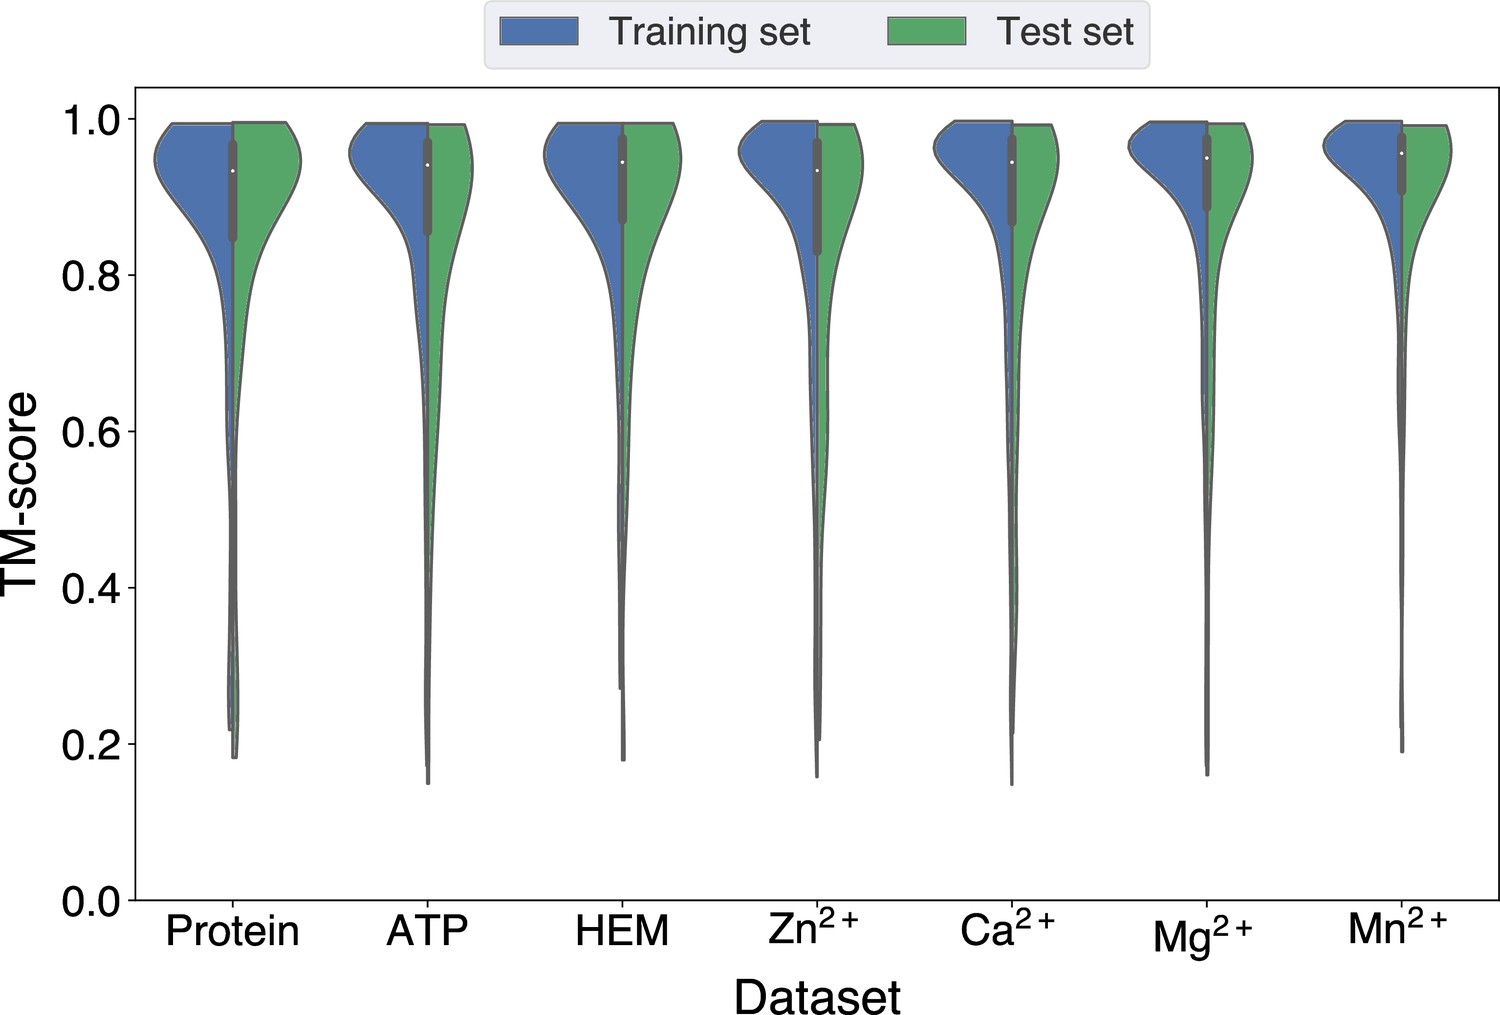
Distributions of the TM-scores between native and predicted structures in the protein, ATP, HEM, Zn2+, Ca2+, Mg2+, and Mn2+ datasets.
Appendix 3—figure 4
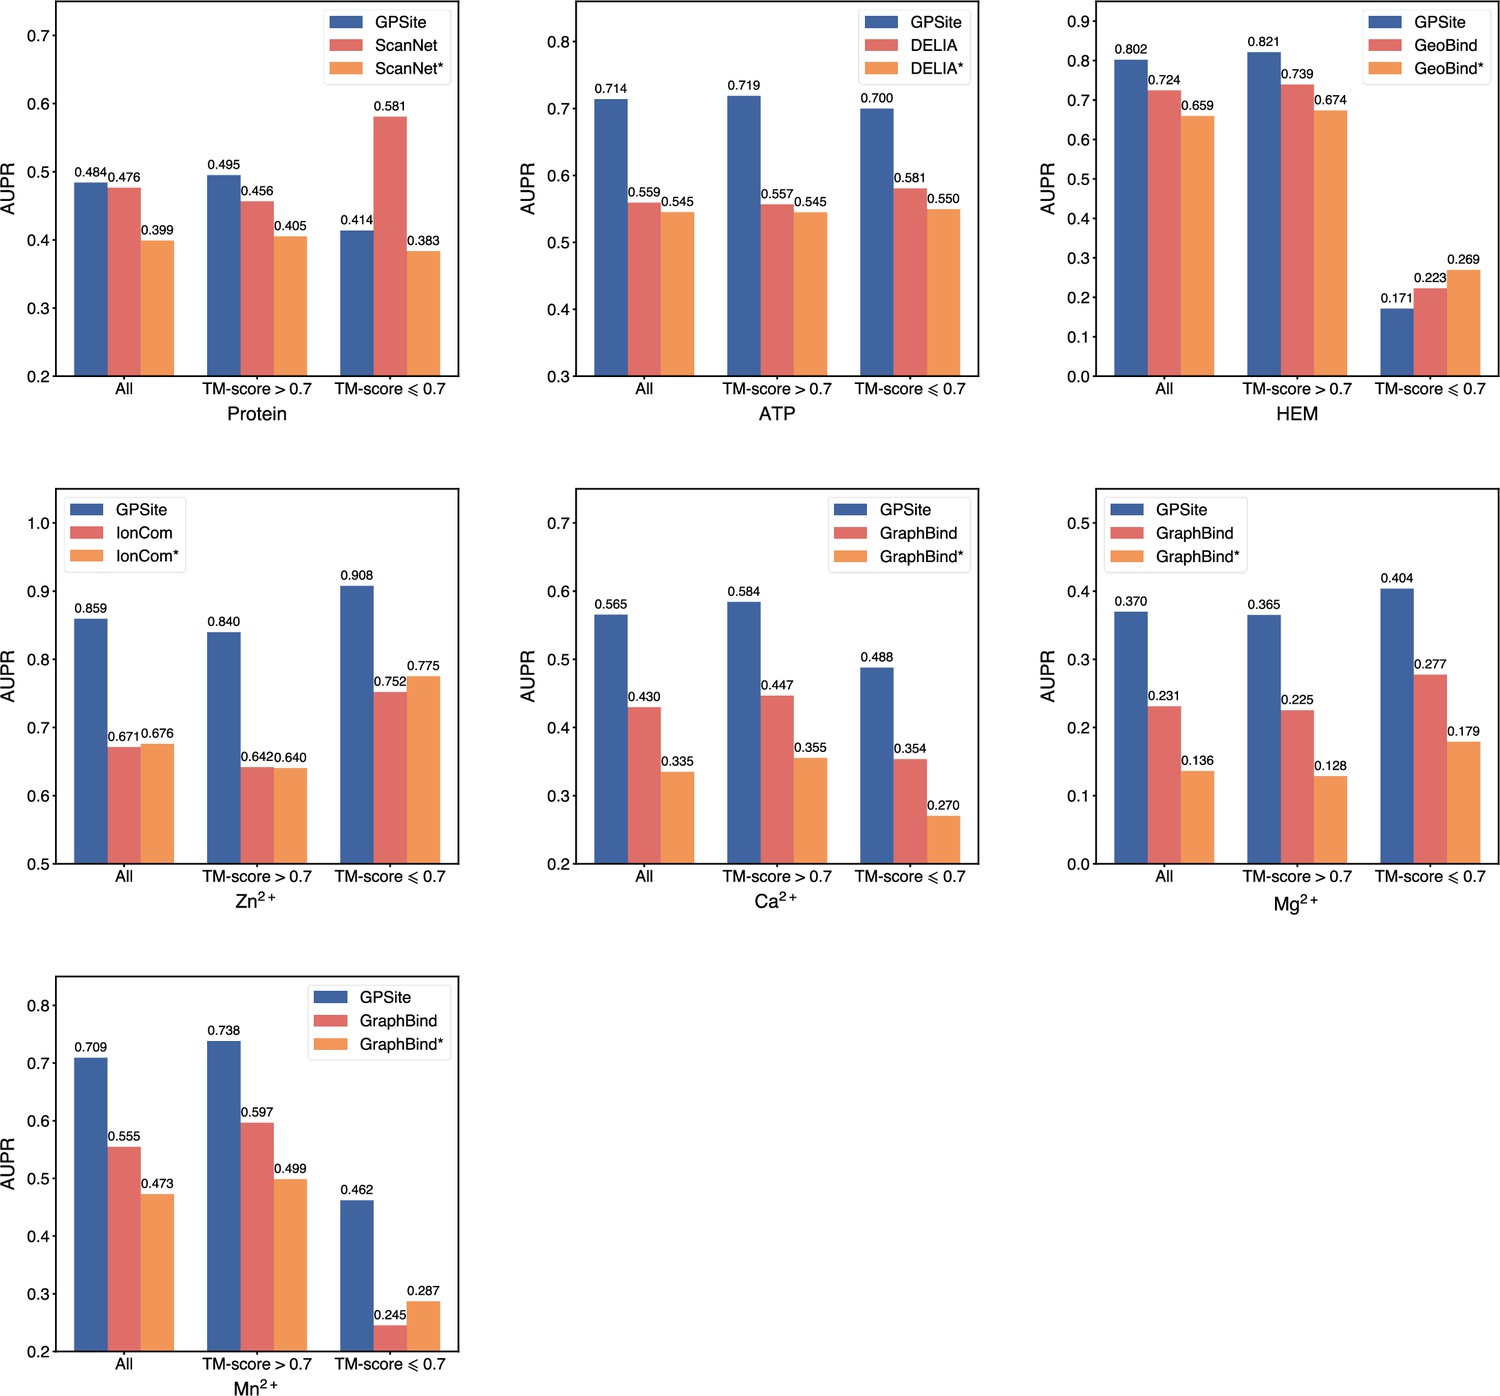
The performance of GPSite on structures of different qualities, and the comparisons with the best experimental structure-based methods in the test sets of protein, ATP, HEM, Zn2+, Ca2+, Mg2+, and Mn2+.
The experimental structure-based methods input with ESMFold-predicted structures are marked with *. Since there are only 5 proteins with TM-score ≤0.7 in the HEM and Mn2+ test sets (details shown in Appendix 2—table 5), the corresponding results may not be statistically significant.
Appendix 3—figure 5
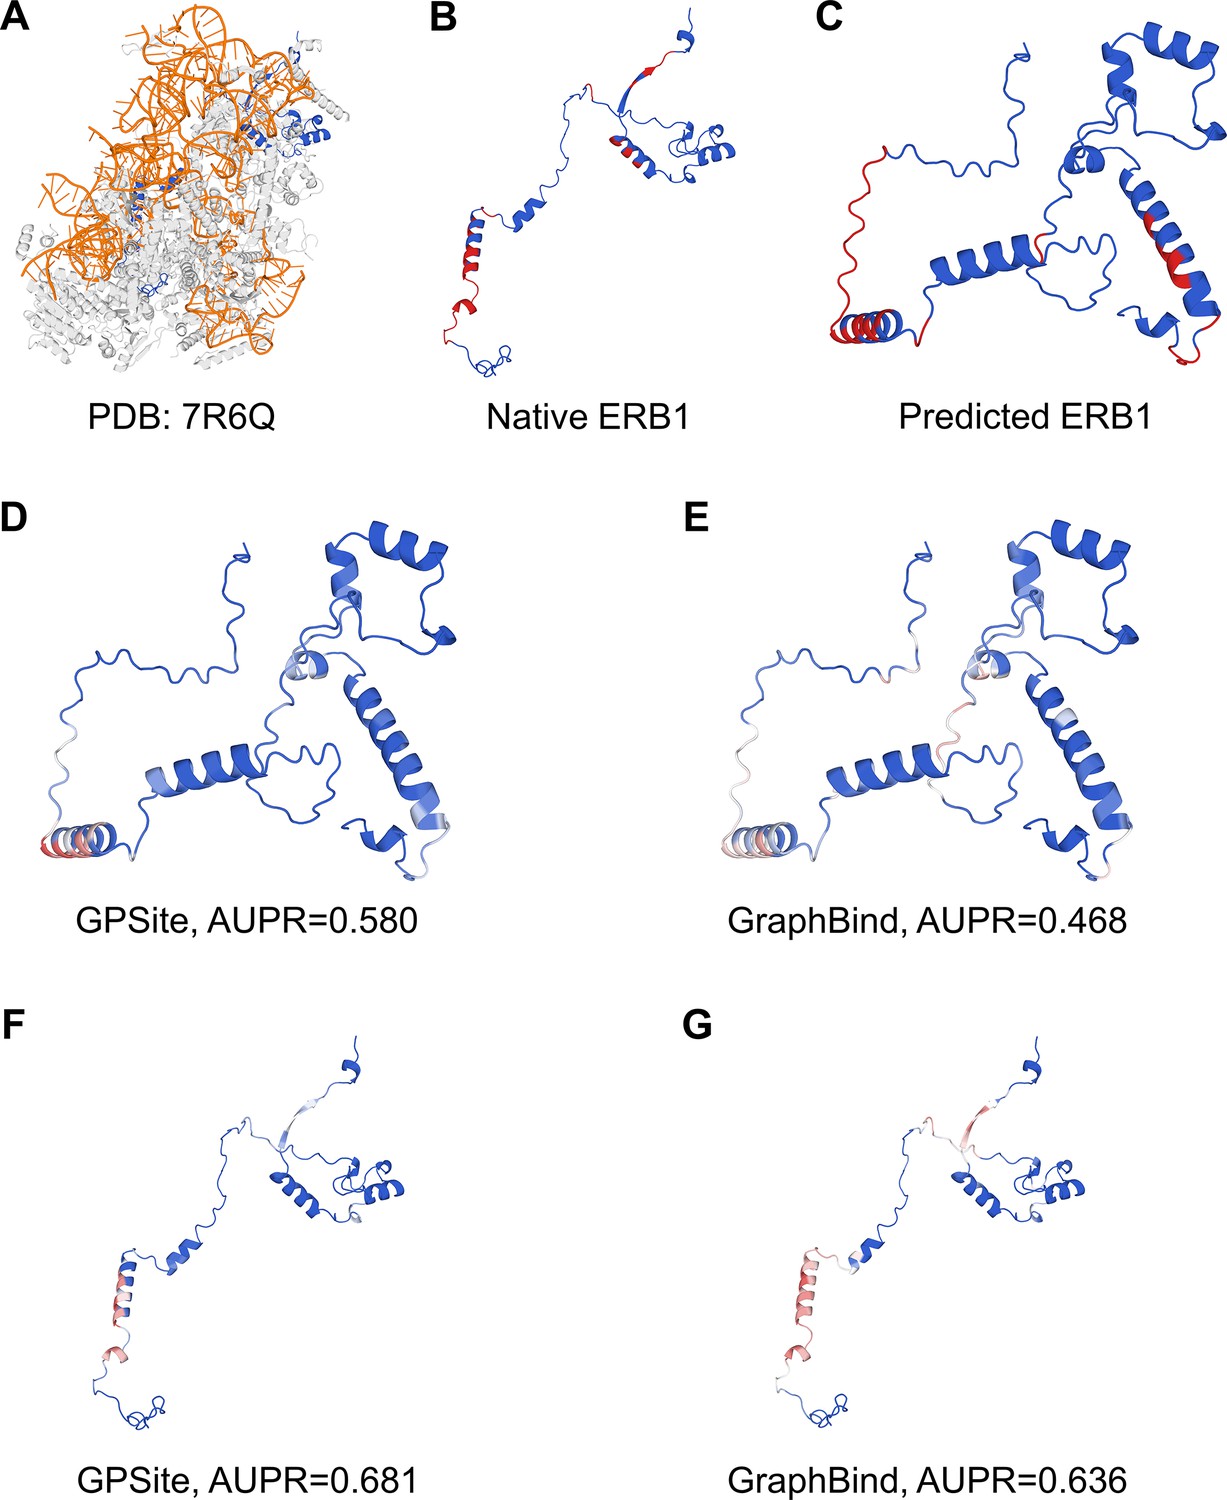
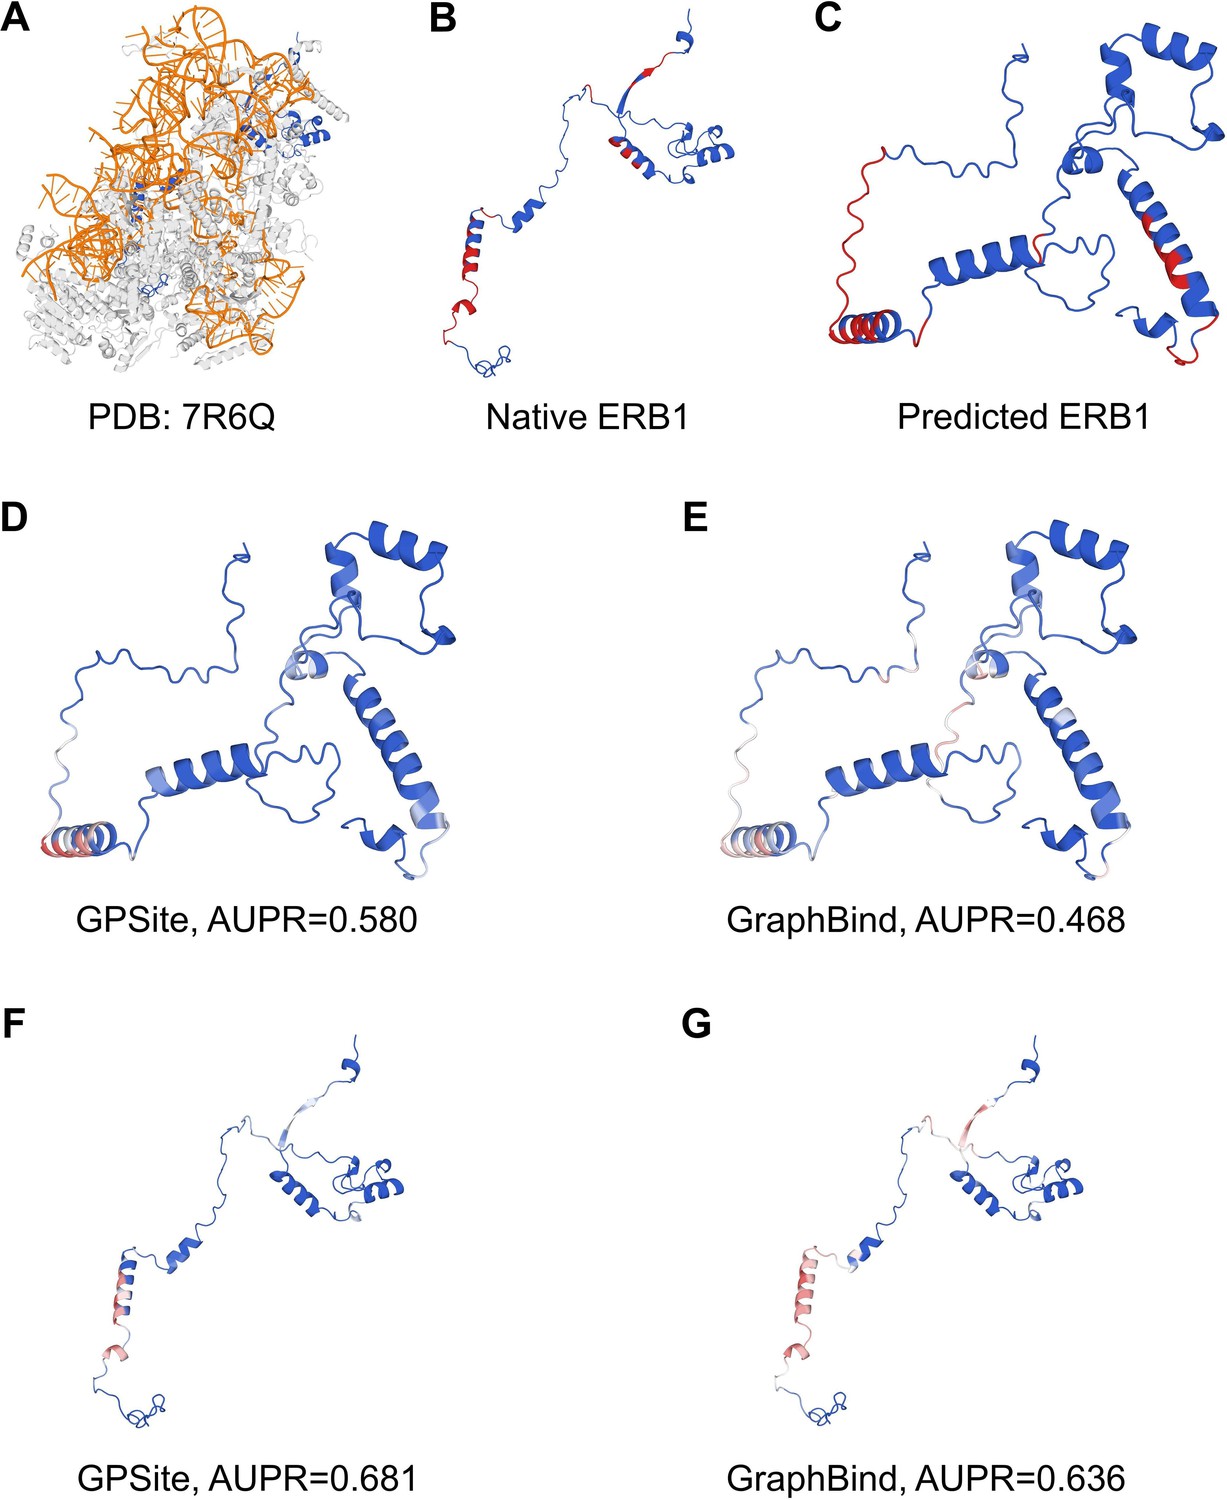
The prediction results of GPSite and GraphBind for the ribosome biogenesis protein ERB1.
(A) The state E2 nucleolar 60S ribosome biogenesis intermediate (PDB: 7R6Q). The ribosome biogenesis protein ERB1 (chain m) is highlighted in blue, while other protein chains are colored in gray. The RNA chains are shown in orange. (B) The RNA-binding sites on ERB1 (colored in red). (C) The ESMFold-predicted structure of ERB1 (TM-score=0.24). The RNA-binding sites are also mapped onto this predicted structure (colored in red). (D–G) The prediction results of GPSite and GraphBind for the predicted and native ERB1 structures. The confidence of the predictions is represented with a gradient of color from blue for non-binding to red for binding.
Appendix 3—figure 6
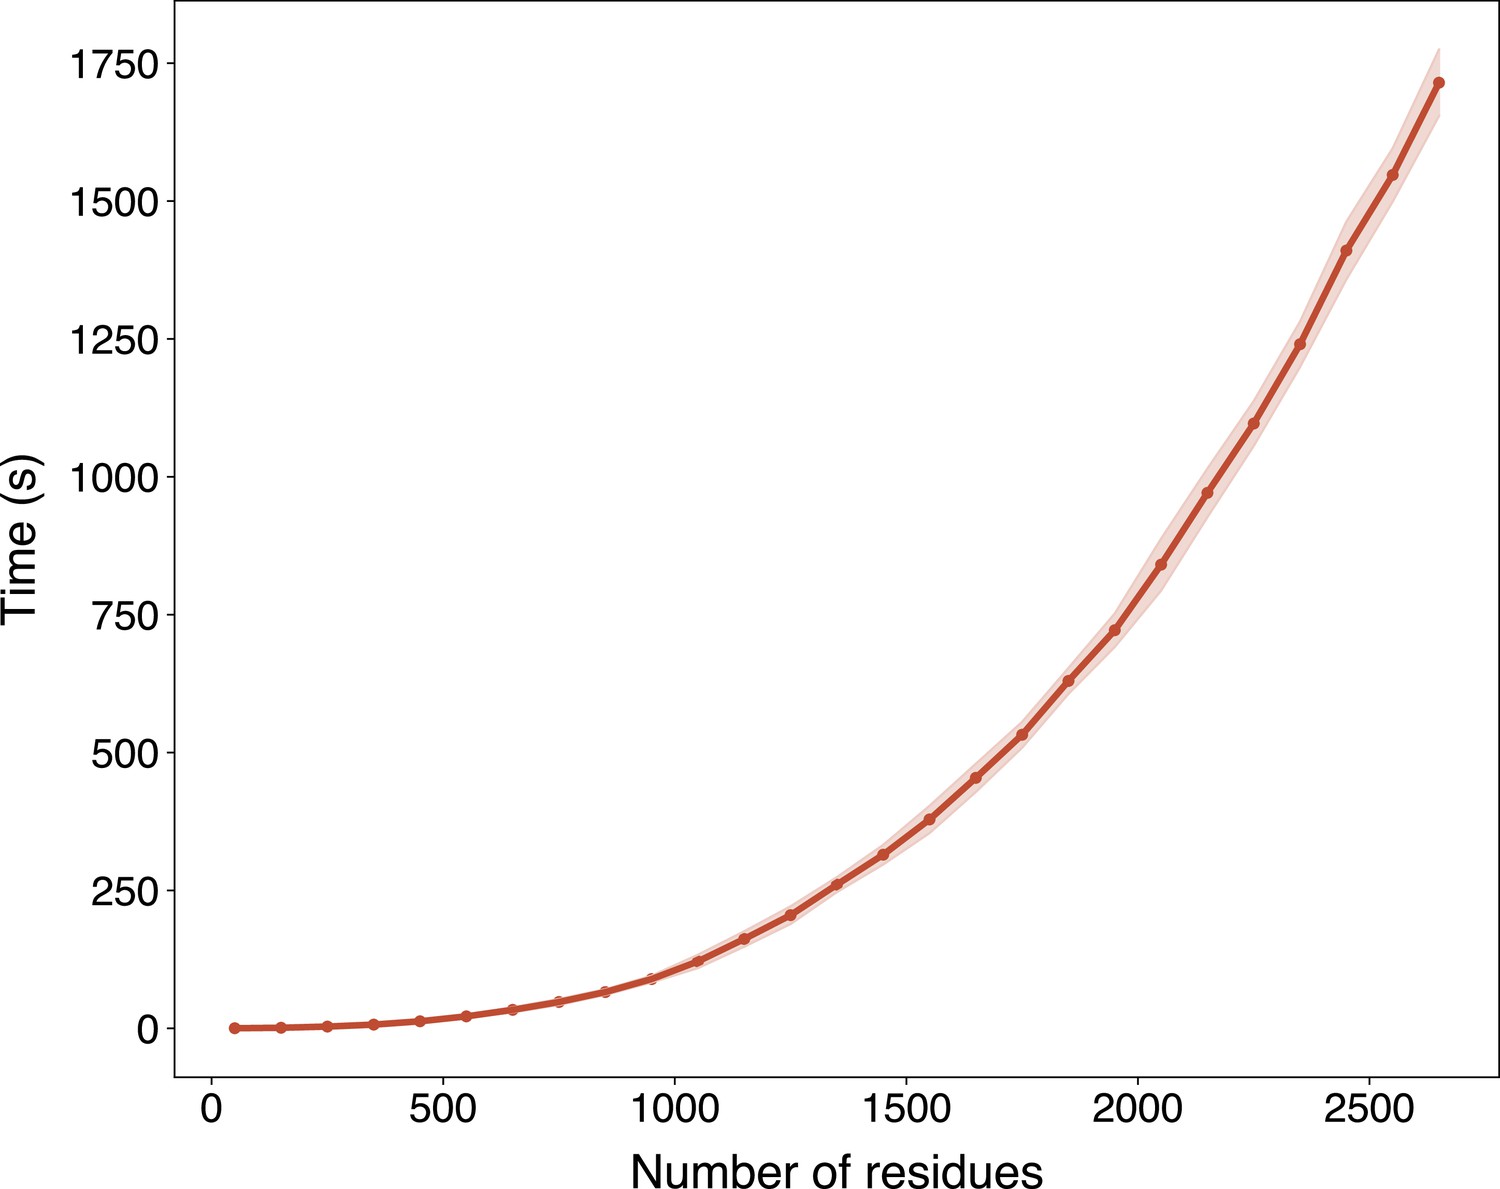
The run time of ESMFold with respect to the sequence length in Swiss-Prot evaluated on an NVIDIA A100 GPU.
The run time is presented as mean ± standard deviation per range of number of residues (range size equals 100).
Appendix 3—figure 7
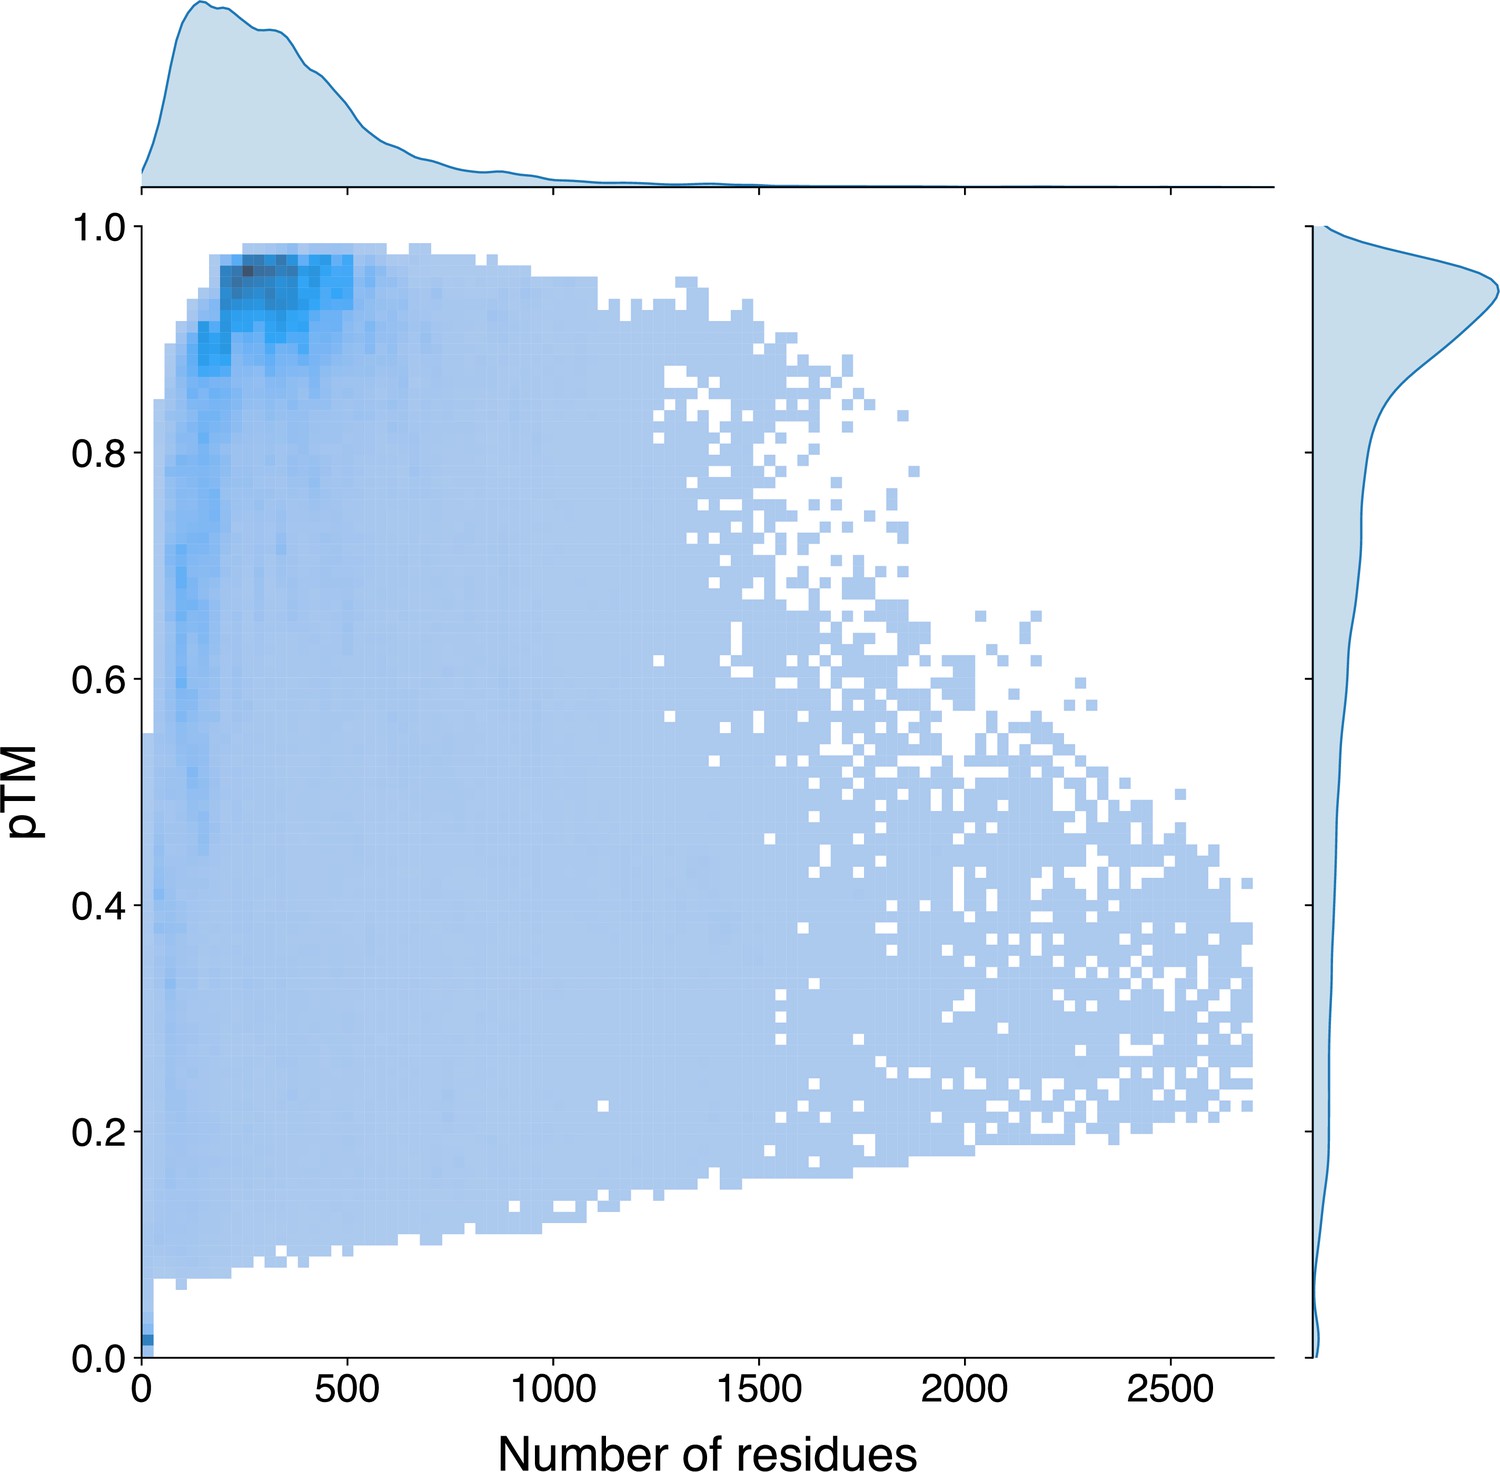
The univariate and bivariate distributions of the protein length and the pTM estimated by ESMFold of the Swiss-Prot sequences.
The probability density curves are fit using kernel density estimation. The darker region in the bivariate heatmap corresponds to a higher number of samples.
Appendix 3—figure 8
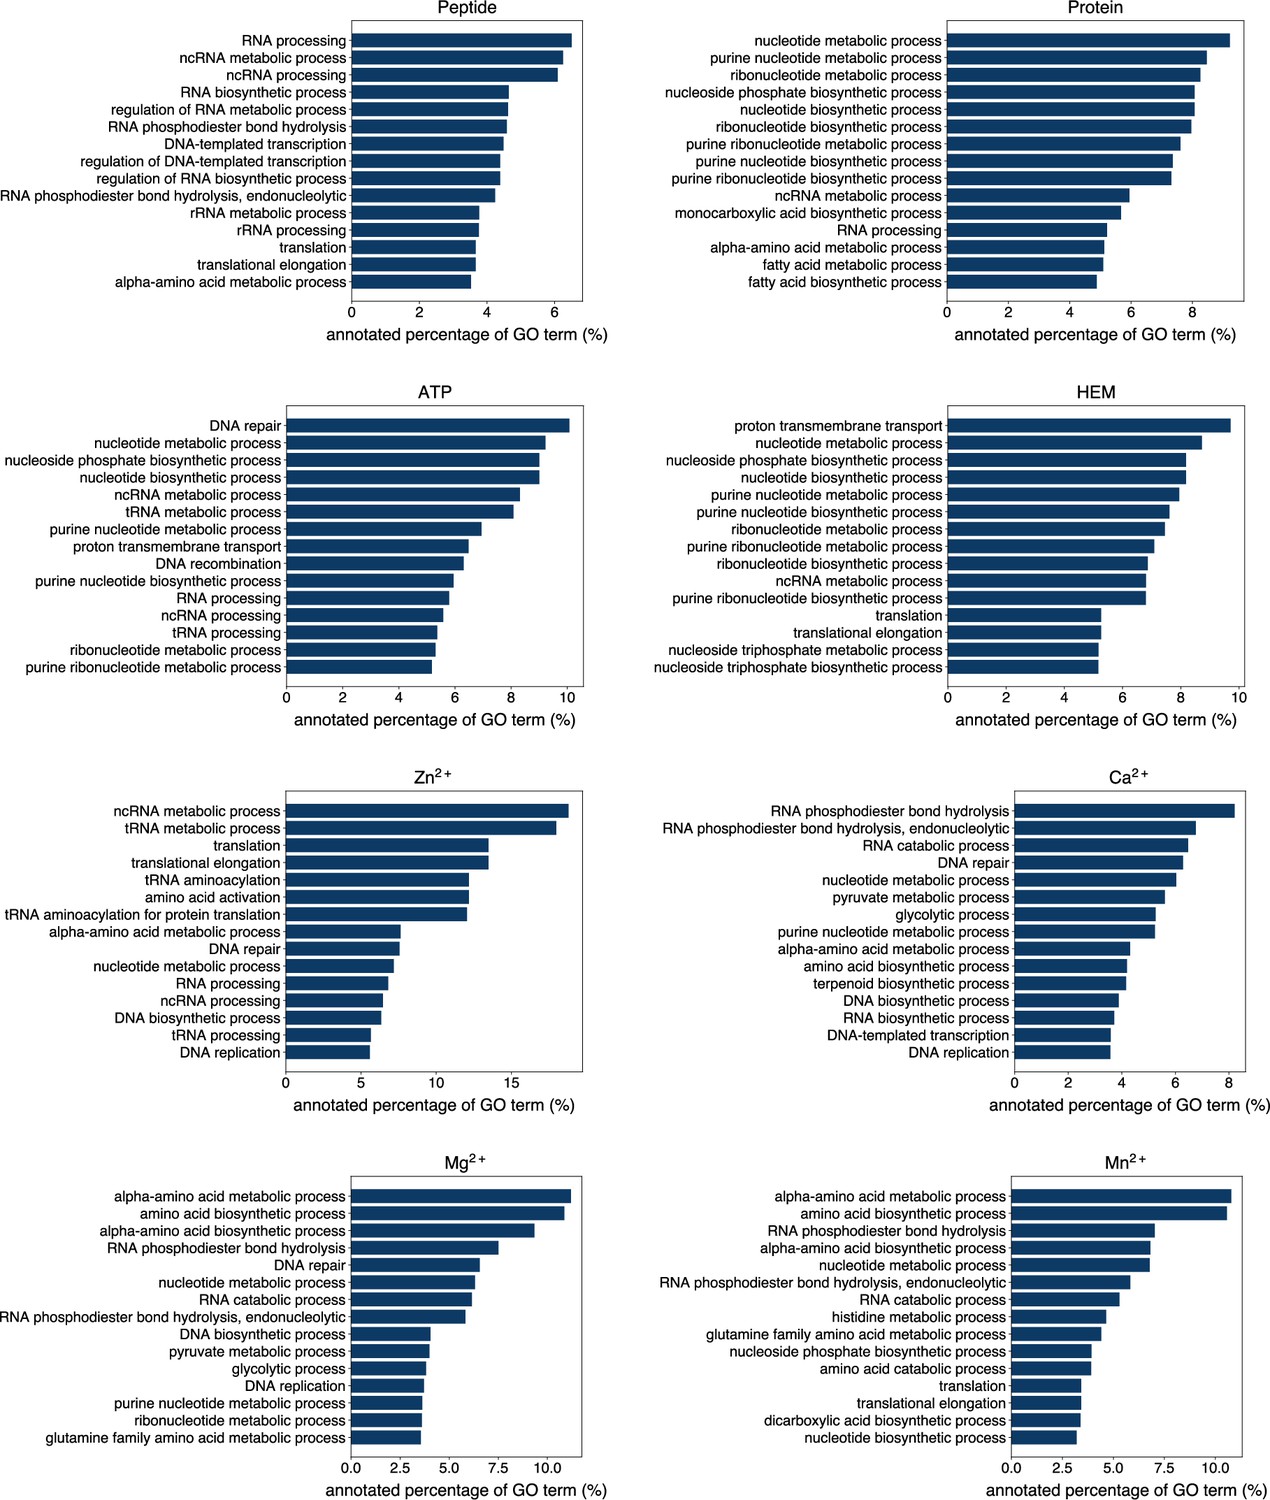
The percentage of proteins predicted as binding to peptide, protein, ATP, HEM, Zn2+, Ca2+, Mg2+ and Mn2+ by GPSite to be annotated with certain biological process in Swiss-Prot.
Only the specific biological process terms with depth ≥8 in the GO directed acyclic graph are considered, among which the 15 terms with the highest percentage are displayed.
Appendix 3—figure 9
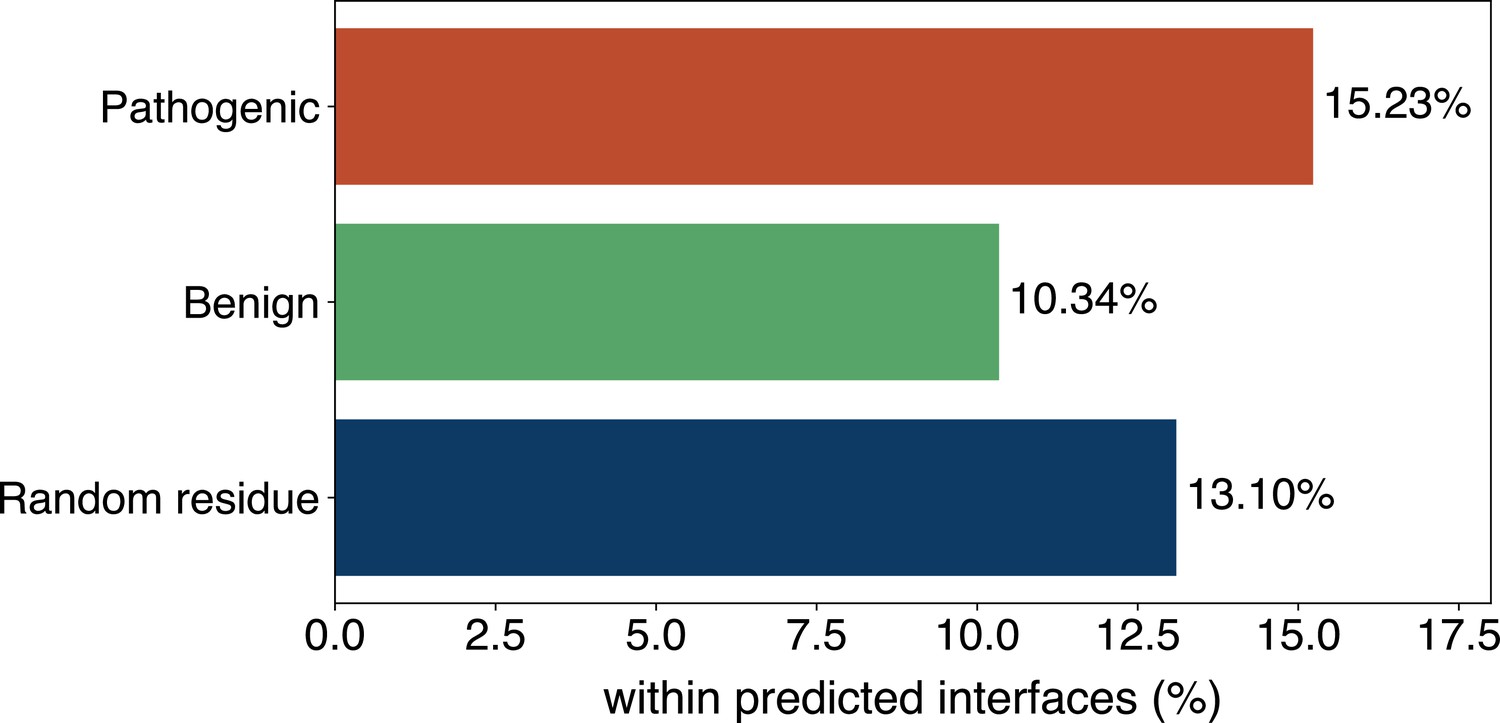
The percentage of pathogenic or benign natural variant sites within GPSite-predicted interfaces.
The baseline is the probability of a random residue being annotated as an interface residue.
Author response image 1

The structures of 4XQK (A) and 4KYW (B) in PDB.
Author response image 2
The prediction results of GPSite and GraphBind for the ribosome biogenesis protein ERB1.
(A) The state E2 nucleolar 60S ribosome biogenesis intermediate (PDB: 7R6Q). The ribosome biogenesis protein ERB1 (chain m) is highlighted in blue, while other protein chains are colored in gray. The RNA chains are shown in orange. (B) The RNA-binding sites on ERB1 (colored in red). (C) The ESMFold-predicted structure of ERB1 (TM-score = 0.24). The RNA-binding sites are also mapped onto this predicted structure (colored in red). (D-G) The prediction results of GPSite and GraphBind for the predicted and native ERB1 structures. The confidence of the predictions is represented with a gradient of color from blue for non-binding to red for binding.
Author response image 3
Runtime comparison of the GPSite webserver with other top-performing servers.
Five protein chains (i.e., 8HN4_B, 8USJ_A, 8C1U_A, 8K3V_A and 8EXO_A) comprising 100, 300, 500, 700, and 900 residues, respectively, were selected for testing, and the average runtime is reported for each method. Note that a significant portion of GPSite’s runtime (75 s, indicated in orange) is allocated to structure prediction using ESMFold.
Tables
Appendix 2—table 1
Statistics of the 10 binding site benchmark datasets used in this study.
| Molecule type | Training set | Test set | ||||
|---|---|---|---|---|---|---|
| Sequences | Residues | % of binding residues | Sequences | Residues | % of binding residues | |
| DNA | 661 | 185,796 | 8.06 | 146 | 57,914 | 5.75 |
| RNA | 689 | 205,648 | 10.55 | 346 | 105,230 | 9.78 |
| Peptide | 1251 | 348,370 | 5.39 | 235 | 74,788 | 4.50 |
| Protein | 335 | 66,366 | 15.63 | 375 | 78,475 | 14.57 |
| ATP | 347 | 130,655 | 3.91 | 79 | 39,459 | 3.12 |
| HEM | 176 | 47,063 | 8.55 | 48 | 15,618 | 6.21 |
| Zn2+ | 1646 | 474,855 | 1.63 | 211 | 56,020 | 1.85 |
| Ca2+ | 1554 | 504,146 | 1.67 | 183 | 66,854 | 1.55 |
| Mg2+ | 1729 | 575,732 | 1.10 | 235 | 88,806 | 1.01 |
| Mn2+ | 547 | 181,699 | 1.41 | 57 | 20,419 | 1.10 |
-
Note: We combined the two test sets (Test_60 and Test_315) from Yuan et al., 2021 to establish our final protein-protein binding site test set.
Appendix 2—table 2
The performance of GPSite on the five-fold cross-validation and independent test sets.
| Molecule type | Five-fold cross-validation | Test set | ||
|---|---|---|---|---|
| AUC | AUPR | AUC | AUPR | |
| DNA | 0.933 | 0.620 | 0.921 | 0.516 |
| RNA | 0.910 | 0.615 | 0.899 | 0.573 |
| Peptide | 0.858 | 0.406 | 0.836 | 0.345 |
| Protein | 0.819 | 0.491 | 0.836 | 0.484 |
| ATP | 0.960 | 0.688 | 0.975 | 0.714 |
| HEM | 0.963 | 0.778 | 0.971 | 0.802 |
| Zn2+ | 0.984 | 0.808 | 0.981 | 0.859 |
| Ca2+ | 0.901 | 0.515 | 0.921 | 0.565 |
| Mg2+ | 0.889 | 0.379 | 0.892 | 0.370 |
| Mn2+ | 0.964 | 0.734 | 0.974 | 0.709 |
| Average | 0.918 | 0.603 | 0.921 | 0.594 |
Appendix 2—table 3
Performance comparison of GPSite with state-of-the-art methods on the 10 binding site test sets.
| Test set | Method | Rec | Pre | Acc | F1 | MCC | AUC | AUPR |
|---|---|---|---|---|---|---|---|---|
| DNA | DRNApred | 0.258 | 0.159 | 0.879 | 0.197 | 0.140 | 0.698 | 0.129 |
| COACH-D | 0.247 | 0.315 | 0.926 | 0.277 | 0.241 | 0.674 | 0.197 | |
| NCBRPred | 0.225 | 0.316 | 0.927 | 0.263 | 0.230 | 0.763 | 0.229 | |
| SVMnuc | 0.319 | 0.319 | 0.922 | 0.319 | 0.277 | 0.806 | 0.259 | |
| NucBind | 0.333 | 0.329 | 0.923 | 0.331 | 0.290 | 0.806 | 0.264 | |
| GraphBind | 0.607 | 0.355 | 0.914 | 0.448 | 0.422 | 0.884 | 0.424 | |
| GeoBind* | 0.481 | 0.427 | 0.933 | 0.452 | 0.417 | 0.891 | 0.416 | |
| GeoBind | 0.520 | 0.442 | 0.935 | 0.478 | 0.445 | 0.896 | 0.443 | |
| GraphSite | 0.493 | 0.450 | 0.936 | 0.470 | 0.437 | 0.910 | 0.455 | |
| GPSite | 0.463 | 0.525 | 0.945 | 0.492 | 0.464 | 0.921 | 0.516 | |
| RNA | COACH-D | 0.073 | 0.210 | 0.882 | 0.108 | 0.071 | 0.463 | 0.111 |
| DRNApred | 0.092 | 0.236 | 0.882 | 0.133 | 0.093 | 0.530 | 0.142 | |
| NucBind | 0.185 | 0.344 | 0.886 | 0.241 | 0.195 | 0.649 | 0.226 | |
| SVMnuc | 0.227 | 0.371 | 0.887 | 0.282 | 0.232 | 0.742 | 0.275 | |
| NCBRPred | 0.234 | 0.471 | 0.899 | 0.312 | 0.284 | 0.660 | 0.302 | |
| aaRNA | 0.422 | 0.360 | 0.870 | 0.389 | 0.318 | 0.803 | 0.359 | |
| GeoBind | 0.562 | 0.455 | 0.891 | 0.503 | 0.446 | 0.804 | 0.459 | |
| GraphBind* | 0.576 | 0.342 | 0.850 | 0.429 | 0.365 | 0.828 | 0.433 | |
| GraphBind | 0.633 | 0.400 | 0.871 | 0.491 | 0.436 | 0.861 | 0.506 | |
| GPSite | 0.557 | 0.541 | 0.910 | 0.549 | 0.499 | 0.899 | 0.573 | |
| Peptide | PepNN-Seq | 0.289 | 0.153 | 0.896 | 0.200 | 0.158 | 0.729 | 0.128 |
| PepBind | 0.062 | 0.576 | 0.956 | 0.112 | 0.178 | 0.655 | 0.148 | |
| PepNN-Struct* | 0.351 | 0.180 | 0.899 | 0.238 | 0.202 | 0.765 | 0.163 | |
| PepNN-Struct | 0.337 | 0.210 | 0.913 | 0.259 | 0.222 | 0.783 | 0.187 | |
| PepBCL | 0.168 | 0.389 | 0.951 | 0.234 | 0.233 | 0.758 | 0.222 | |
| GPSite | 0.257 | 0.481 | 0.954 | 0.335 | 0.330 | 0.836 | 0.345 | |
| Protein | DeepPPISP | 0.607 | 0.211 | 0.612 | 0.314 | 0.157 | 0.657 | 0.258 |
| SPPIDER | 0.603 | 0.309 | 0.746 | 0.409 | 0.292 | 0.778 | 0.375 | |
| MaSIF-site | 0.584 | 0.330 | 0.767 | 0.421 | 0.308 | 0.777 | 0.384 | |
| GraphPPIS | 0.670 | 0.320 | 0.745 | 0.434 | 0.328 | 0.794 | 0.422 | |
| ScanNet* | 0.551 | 0.361 | 0.792 | 0.436 | 0.326 | 0.788 | 0.399 | |
| ScanNet | 0.568 | 0.442 | 0.832 | 0.497 | 0.403 | 0.832 | 0.476 | |
| GPSite | 0.490 | 0.473 | 0.846 | 0.481 | 0.391 | 0.836 | 0.484 | |
| ATP | TargetS | 0.451 | 0.549 | 0.971 | 0.495 | 0.483 | 0.855 | 0.447 |
| GraphBind | 0.529 | 0.473 | 0.967 | 0.499 | 0.483 | 0.901 | 0.503 | |
| GeoBind | 0.614 | 0.479 | 0.967 | 0.538 | 0.526 | 0.927 | 0.534 | |
| DELIA* | 0.452 | 0.669 | 0.976 | 0.539 | 0.538 | 0.914 | 0.545 | |
| DELIA | 0.453 | 0.689 | 0.977 | 0.547 | 0.548 | 0.918 | 0.559 | |
| GPSite | 0.618 | 0.742 | 0.981 | 0.675 | 0.668 | 0.975 | 0.714 | |
| HEM | TargetS | 0.504 | 0.756 | 0.959 | 0.605 | 0.598 | 0.892 | 0.581 |
| GraphBind | 0.733 | 0.505 | 0.939 | 0.598 | 0.578 | 0.926 | 0.638 | |
| DELIA | 0.604 | 0.670 | 0.957 | 0.636 | 0.614 | 0.928 | 0.664 | |
| GeoBind* | 0.646 | 0.625 | 0.954 | 0.635 | 0.611 | 0.920 | 0.659 | |
| GeoBind | 0.707 | 0.710 | 0.964 | 0.709 | 0.689 | 0.932 | 0.724 | |
| GPSite | 0.715 | 0.762 | 0.968 | 0.738 | 0.722 | 0.971 | 0.802 | |
| Zn2+ | MIB | 0.744 | 0.219 | 0.946 | 0.339 | 0.385 | 0.935 | 0.394 |
| TargetS | 0.454 | 0.749 | 0.987 | 0.566 | 0.578 | 0.874 | 0.593 | |
| IonCom* | 0.849 | 0.145 | 0.904 | 0.248 | 0.327 | 0.939 | 0.676 | |
| IonCom | 0.852 | 0.137 | 0.898 | 0.236 | 0.317 | 0.937 | 0.671 | |
| LMetalSite | 0.681 | 0.859 | 0.992 | 0.760 | 0.761 | 0.976 | 0.803 | |
| GPSite | 0.700 | 0.914 | 0.993 | 0.793 | 0.797 | 0.981 | 0.859 | |
| Ca2+ | MIB | 0.338 | 0.078 | 0.928 | 0.126 | 0.135 | 0.775 | 0.103 |
| TargetS | 0.121 | 0.490 | 0.984 | 0.194 | 0.238 | 0.776 | 0.163 | |
| IonCom | 0.297 | 0.247 | 0.975 | 0.269 | 0.258 | 0.698 | 0.166 | |
| DELIA | 0.172 | 0.633 | 0.986 | 0.271 | 0.325 | 0.785 | 0.248 | |
| GeoBind | 0.279 | 0.515 | 0.985 | 0.362 | 0.372 | 0.895 | 0.348 | |
| GraphBind* | 0.290 | 0.537 | 0.985 | 0.377 | 0.388 | 0.836 | 0.335 | |
| GraphBind | 0.371 | 0.623 | 0.987 | 0.465 | 0.475 | 0.888 | 0.430 | |
| LMetalSite | 0.413 | 0.724 | 0.988 | 0.526 | 0.542 | 0.905 | 0.492 | |
| GPSite | 0.435 | 0.820 | 0.990 | 0.569 | 0.593 | 0.921 | 0.565 | |
| Mg2+ | MIB | 0.246 | 0.043 | 0.938 | 0.074 | 0.082 | 0.675 | 0.053 |
| TargetS | 0.118 | 0.491 | 0.990 | 0.190 | 0.237 | 0.724 | 0.148 | |
| IonCom | 0.240 | 0.250 | 0.985 | 0.245 | 0.237 | 0.688 | 0.184 | |
| DELIA | 0.129 | 0.650 | 0.991 | 0.215 | 0.287 | 0.744 | 0.198 | |
| GeoBind | 0.181 | 0.475 | 0.990 | 0.263 | 0.289 | 0.840 | 0.227 | |
| GraphBind* | 0.246 | 0.205 | 0.983 | 0.224 | 0.216 | 0.750 | 0.136 | |
| GraphBind | 0.273 | 0.414 | 0.989 | 0.329 | 0.331 | 0.776 | 0.231 | |
| LMetalSite | 0.245 | 0.728 | 0.991 | 0.367 | 0.419 | 0.865 | 0.316 | |
| GPSite | 0.303 | 0.644 | 0.991 | 0.412 | 0.438 | 0.892 | 0.370 | |
| Mn2+ | MIB | 0.462 | 0.096 | 0.946 | 0.159 | 0.193 | 0.856 | 0.168 |
| IonCom | 0.511 | 0.245 | 0.977 | 0.331 | 0.344 | 0.833 | 0.304 | |
| TargetS | 0.271 | 0.496 | 0.989 | 0.351 | 0.362 | 0.864 | 0.322 | |
| GeoBind | 0.569 | 0.479 | 0.988 | 0.520 | 0.516 | 0.938 | 0.454 | |
| DELIA | 0.502 | 0.665 | 0.992 | 0.572 | 0.574 | 0.902 | 0.489 | |
| GraphBind* | 0.378 | 0.644 | 0.991 | 0.476 | 0.489 | 0.928 | 0.473 | |
| GraphBind | 0.427 | 0.706 | 0.992 | 0.532 | 0.545 | 0.930 | 0.555 | |
| LMetalSite | 0.613 | 0.719 | 0.993 | 0.662 | 0.661 | 0.966 | 0.625 | |
| GPSite | 0.613 | 0.807 | 0.994 | 0.697 | 0.701 | 0.974 | 0.709 |
-
Note: The best/second-best AUC and AUPR values are indicated by bold/underlined fonts. For the best experimental structure-based method (measured by AUPR) in each test set, its corresponding result when using ESMFold-predicted structures as input is denoted with *.
Appendix 2—table 4
Performance comparison of GPSite with ScanNet and PeSTo on the protein-protein binding site test set from PeSTo (Krapp et al., 2023b).
| Method | AUPR | AUC | MCC |
|---|---|---|---|
| ScanNet | 0.720 | 0.897 | 0.510 |
| PeSTo* | 0.691 | 0.886 | 0.451 |
| PeSTo | 0.797 | 0.929 | 0.636 |
| GPSite | 0.824 | 0.942 | 0.637 |
-
Note: The performance of ScanNet and PeSTo are directly obtained from Krapp et al., 2023b. PeSTo* denotes evaluation using the ESMFold-predicted structures as input. The metrics provided are the median AUPR, median AUC and median MCC. The best/second-best results are indicated by bold/underlined fonts.
Appendix 2—table 5
The numbers of proteins with TM-score >0.7 or ≤0.7 between native and ESMFold-predicted structures in the 10 binding site datasets.
| Molecule type | Training set | Test set | ||
|---|---|---|---|---|
| >0.7 | ≤0.7 | >0.7 | ≤0.7 | |
| DNA | 520 | 141 | 104 | 42 |
| RNA | 428 | 261 | 175 | 171 |
| Peptide | 1074 | 177 | 175 | 60 |
| Protein | 293 | 42 | 321 | 54 |
| ATP | 314 | 33 | 62 | 17 |
| HEM | 159 | 17 | 43 | 5 |
| Zn2+ | 1428 | 218 | 160 | 51 |
| Ca2+ | 1377 | 177 | 150 | 33 |
| Mg2+ | 1565 | 164 | 195 | 40 |
| Mn2+ | 512 | 35 | 52 | 5 |
Appendix 2—table 6
The prediction quality of ESMFold measured by TM-score between native and predicted structures in the 10 binding site datasets.
| Molecule type | Training set | Test set | Total | |||
|---|---|---|---|---|---|---|
| Median | Mean | Median | Mean | Median | Mean | |
| DNA | 0.90 | 0.82 | 0.88 | 0.79 | 0.89 | 0.82 |
| RNA | 0.79 | 0.73 | 0.70 | 0.65 | 0.76 | 0.70 |
| Peptide | 0.93 | 0.86 | 0.88 | 0.78 | 0.93 | 0.85 |
| Protein | 0.94 | 0.87 | 0.93 | 0.85 | 0.93 | 0.86 |
| ATP | 0.95 | 0.89 | 0.90 | 0.83 | 0.94 | 0.88 |
| HEM | 0.95 | 0.89 | 0.94 | 0.87 | 0.94 | 0.88 |
| Zn2+ | 0.94 | 0.87 | 0.91 | 0.82 | 0.93 | 0.86 |
| Ca2+ | 0.95 | 0.88 | 0.93 | 0.85 | 0.94 | 0.88 |
| Mg2+ | 0.95 | 0.90 | 0.93 | 0.86 | 0.95 | 0.89 |
| Mn2+ | 0.96 | 0.92 | 0.95 | 0.91 | 0.96 | 0.91 |
Appendix 2—table 7
The ablation studies on protein features and model designs in the 10 binding site test sets.
| Method | DNA | RNA | Pep | Pro | ATP | HEM | Zn2+ | Ca2+ | Mg2+ | Mn2+ | Avg |
|---|---|---|---|---|---|---|---|---|---|---|---|
| w/o sequence | 0.389 | 0.473 | 0.251 | 0.396 | 0.646 | 0.726 | 0.791 | 0.503 | 0.338 | 0.646 | 0.516 |
| One-hot | 0.429 | 0.506 | 0.254 | 0.427 | 0.645 | 0.755 | 0.840 | 0.564 | 0.359 | 0.673 | 0.545 |
| MSA profile | 0.507 | 0.557 | 0.281 | 0.463 | 0.671 | 0.791 | 0.814 | 0.540 | 0.369 | 0.683 | 0.568 |
| w/o structure | 0.437 | 0.503 | 0.242 | 0.394 | 0.544 | 0.565 | 0.793 | 0.468 | 0.288 | 0.607 | 0.484 |
| w/o geometry | 0.484 | 0.539 | 0.318 | 0.439 | 0.631 | 0.670 | 0.813 | 0.489 | 0.313 | 0.638 | 0.533 |
| Single-task | 0.506 | 0.549 | 0.338 | 0.455 | 0.669 | 0.716 | 0.843 | 0.557 | 0.326 | 0.632 | 0.559 |
| GPSite | 0.516 | 0.573 | 0.345 | 0.484 | 0.714 | 0.802 | 0.859 | 0.565 | 0.370 | 0.709 | 0.594 |
-
Note: The numbers in this table are AUPR values. Bold fonts indicate the best results. ‘Pep’ and ‘Pro’ denote peptide and protein, respectively. ‘Avg’ means the average AUPR values among the 10 test sets. ‘One-hot’ denotes replacing the ProtTrans embedding with one-hot sequence encoding. The generation of the MSA profile (PSSM and HMM) is detailed in Generation of the evolutionary features from MSA. ‘w/o structure’ means using a transformer model only input with the ProtTrans sequence features. ‘w/o geometry’ means removing the geometric featurizer in GPSite.
Appendix 2—table 8
Performance comparison between GPSite and the baseline model using MSA profile for proteins with different Neff values in the combined test set of the 10 ligands.
| Neff | Sequences | Residues | MSA AUC | GPSite AUC | p-value |
|---|---|---|---|---|---|
| [1, 2) | 67 | 18,236 | 0.818 | 0.850 | 4.3×10⁻⁸ |
| [2, 3) | 32 | 9395 | 0.856 | 0.854 | 0.72 |
| [3, 4) | 71 | 18,328 | 0.895 | 0.894 | 0.13 |
| [4, 5) | 133 | 30,392 | 0.901 | 0.896 | 4.0×10⁻⁴ |
| [5, 6) | 182 | 39,858 | 0.909 | 0.916 | 9.8×10⁻⁴ |
| [6, 7) | 226 | 60,128 | 0.915 | 0.913 | 0.10 |
| [7, 8) | 257 | 92,791 | 0.920 | 0.931 | 1.1×10⁻⁹ |
| [8, +∞) | 947 | 334,455 | 0.919 | 0.935 | 7.0×10⁻¹⁰ |
-
Note: Significance tests are performed following the procedure in Yan and Kurgan, 2017; Xia et al., 2021. If p-value <0.05, the difference between the performance is considered statistically significant.
Appendix 2—table 9
Performance comparison on the 10 binding site test sets under different training and evaluation settings.
| Setting | DNA | RNA | Pep | Pro | ATP | HEM | Zn2+ | Ca2+ | Mg2+ | Mn2+ | Avg |
|---|---|---|---|---|---|---|---|---|---|---|---|
| Train: native Test: native | 0.587 | 0.634 | 0.368 | 0.552 | 0.746 | 0.846 | 0.905 | 0.705 | 0.428 | 0.786 | 0.656 |
| Train: native Test: predicted | 0.497 | 0.554 | 0.311 | 0.459 | 0.704 | 0.784 | 0.826 | 0.546 | 0.352 | 0.694 | 0.573 |
| Train: predicted Test: native | 0.554 | 0.610 | 0.371 | 0.529 | 0.733 | 0.844 | 0.890 | 0.660 | 0.415 | 0.761 | 0.637 |
| Train: predicted Test: predicted (GPSite) | 0.516 | 0.573 | 0.345 | 0.484 | 0.714 | 0.802 | 0.859 | 0.565 | 0.370 | 0.709 | 0.594 |
-
Note: The numbers in this table are AUPR values. ‘Pep’ and ‘Pro’ denote peptide and protein, respectively. ‘Avg’ means the average AUPR values among the 10 test sets. ‘native’ and ‘predicted’ denote applying native and predicted structures as input, respectively.
Appendix 2—table 10
Cross-type performance by applying different ligand-specific MLPs in GPSite for the test sets of different ligands.
| Ligand-specific MLP | Ligand-binding site test set | |||||||||
|---|---|---|---|---|---|---|---|---|---|---|
| DNA | RNA | Pep | Pro | ATP | HEM | Zn2+ | Ca2+ | Mg2+ | Mn2+ | |
| DNA | 0.516 | 0.461 | 0.158 | 0.327 | 0.123 | 0.425 | 0.032 | 0.033 | 0.028 | 0.072 |
| RNA | 0.381 | 0.573 | 0.170 | 0.332 | 0.189 | 0.549 | 0.038 | 0.049 | 0.037 | 0.093 |
| Pep | 0.170 | 0.199 | 0.345 | 0.410 | 0.089 | 0.479 | 0.046 | 0.027 | 0.028 | 0.080 |
| Pro | 0.187 | 0.214 | 0.201 | 0.484 | 0.031 | 0.117 | 0.030 | 0.026 | 0.015 | 0.025 |
| ATP | 0.193 | 0.319 | 0.165 | 0.296 | 0.714 | 0.762 | 0.036 | 0.076 | 0.062 | 0.138 |
| HEM | 0.231 | 0.316 | 0.236 | 0.321 | 0.544 | 0.802 | 0.073 | 0.026 | 0.040 | 0.086 |
| Zn2+ | 0.076 | 0.164 | 0.069 | 0.197 | 0.077 | 0.115 | 0.859 | 0.136 | 0.111 | 0.622 |
| Ca2+ | 0.091 | 0.197 | 0.079 | 0.234 | 0.151 | 0.074 | 0.114 | 0.565 | 0.317 | 0.460 |
| Mg2+ | 0.117 | 0.206 | 0.091 | 0.232 | 0.265 | 0.208 | 0.192 | 0.468 | 0.370 | 0.597 |
| Mn2+ | 0.108 | 0.196 | 0.095 | 0.226 | 0.245 | 0.237 | 0.627 | 0.390 | 0.321 | 0.709 |
-
Note: ‘Pep’ and ‘Pro’ denote peptide and protein, respectively. The numbers in this table are AUPR values. The best/second-best result in each test set is indicated by bold/underlined font.
Author response table 1
Performance comparison of GPSite with ScanNet and PeSTo on the protein-protein binding site test set from PeSTo 24.
| Method | AUPR | AUC | MCC |
|---|---|---|---|
| ScanNet | 0.720 | 0.897 | 0.510 |
| PeSTo* | 0.691 | 0.886 | 0.451 |
| PeSTo | 0.797 | 0.929 | 0.636 |
| GPSite | 0.824 | 0.942 | 0.637 |
-
Note: The performance of ScanNet and PeSTo are directly obtained from 24. PeSTo* denotes evaluation using the ESMFold-predicted structures as input. The metrics provided are the median AUPR, median AUC and median MCC. The best/second-best results are indicated by bold/underlined fonts.
Author response table 2
Performance comparison on the ten binding site test sets under different training and evaluation settings.
| Setting | DNA | RNA | Pep | Pro | ATP | HEM | Zn2+ | Ca2+ | Mg2+ | Mn2+ | Avg |
|---|---|---|---|---|---|---|---|---|---|---|---|
| Train: native Test: native | 0.587 | 0.634 | 0.368 | 0.552 | 0.746 | 0.846 | 0.905 | 0.705 | 0.428 | 0.786 | 0.656 |
| Train: native Test: predicted | 0.497 | 0.554 | 0.311 | 0.459 | 0.704 | 0.784 | 0.826 | 0.546 | 0.352 | 0.694 | 0.573 |
| Train: predicted Test: native | 0.554 | 0.610 | 0.371 | 0.529 | 0.733 | 0.844 | 0.890 | 0.660 | 0.415 | 0.761 | 0.637 |
| Train: predicted Test: predicted (GPSite) | 0.516 | 0.573 | 0.345 | 0.484 | 0.714 | 0.802 | 0.859 | 0.565 | 0.370 | 0.709 | 0.594 |
-
Note: The numbers in this table are AUPR values. “Pep” and “Pro” denote peptide and protein, respectively. “Avg” means the average AUPR values among the ten test sets. “native” and “predicted” denote applying native and predicted structures as input, respectively.
Author response table 3
Performance comparison between GPSite and the baseline model using MSA profile for proteins with different Neff values in the combined test set of the ten ligands.
| Neff | Sequences | Residues | MSA AUC | GPSite AUC | P-value |
|---|---|---|---|---|---|
| [1,2) | 67 | 18236 | 0.818 | 0.850 | 4.3×10⁻⁸ |
| [2,3) | 32 | 9395 | 0.856 | 0.854 | 0.72 |
| [3,4) | 71 | 18328 | 0.895 | 0.894 | 0.13 |
| [4,5) | 133 | 30392 | 0.901 | 0.896 | 4.0×10⁻⁴ |
| [5,6) | 182 | 39858 | 0.909 | 0.916 | 9.8×10⁻⁴ |
| [6,7) | 226 | 60128 | 0.915 | 0.913 | 0.10 |
| [7,8) | 257 | 92791 | 0.920 | 0.931 | 1.1×10⁻⁹ |
| [8,+∞) | 947 | 334455 | 0.919 | 0.935 | 7.0×10⁻¹⁰ |
-
Note: Significance tests are performed following the procedure in 12,25. If P-value < 0.05, the difference between the performance is considered statistically significant.
Author response table 4
Cross-type performance by applying different ligand-specific MLPs in GPSite for the test sets of different ligands.
| Ligand-specific MLP | Ligand-binding site test set | |||||||||
|---|---|---|---|---|---|---|---|---|---|---|
| DNA | RNA | Pep | Pro | ATP | HEM | Zn2+ | Ca2+ | Mg2+ | Mn2+ | |
| DNA | 0.516 | 0.461 | 0.158 | 0.327 | 0.123 | 0.425 | 0.032 | 0.033 | 0.028 | 0.072 |
| RNA | 0.381 | 0.573 | 0.170 | 0.332 | 0.189 | 0.549 | 0.038 | 0.049 | 0.037 | 0.093 |
| Pep | 0.170 | 0.199 | 0.345 | 0.410 | 0.089 | 0.479 | 0.046 | 0.027 | 0.028 | 0.080 |
| Pro | 0.187 | 0.214 | 0.201 | 0.484 | 0.031 | 0.117 | 0.030 | 0.026 | 0.015 | 0.025 |
| ATP | 0.193 | 0.319 | 0.165 | 0.296 | 0.714 | 0.762 | 0.036 | 0.076 | 0.062 | 0.138 |
| HEM | 0.231 | 0.316 | 0.236 | 0.321 | 0.544 | 0.802 | 0.073 | 0.026 | 0.040 | 0.086 |
| Zn2+ | 0.076 | 0.164 | 0.069 | 0.197 | 0.077 | 0.115 | 0.859 | 0.136 | 0.111 | 0.622 |
| Ca2+ | 0.091 | 0.197 | 0.079 | 0.234 | 0.151 | 0.074 | 0.114 | 0.565 | 0.317 | 0.460 |
| Mg2+ | 0.117 | 0.206 | 0.091 | 0.232 | 0.265 | 0.208 | 0.192 | 0.468 | 0.370 | 0.597 |
| Mn2+ | 0.108 | 0.196 | 0.095 | 0.226 | 0.245 | 0.237 | 0.627 | 0.390 | 0.321 | 0.709 |
-
Note: “Pep” and “Pro” denote peptide and protein, respectively. The numbers in this table are AUPR values. The best/second-best result in each test set is indicated by bold/underlined font.
Additional files
Download links
A two-part list of links to download the article, or parts of the article, in various formats.
Downloads (link to download the article as PDF)
Open citations (links to open the citations from this article in various online reference manager services)
Cite this article (links to download the citations from this article in formats compatible with various reference manager tools)
Genome-scale annotation of protein binding sites via language model and geometric deep learning
eLife 13:RP93695.
https://doi.org/10.7554/eLife.93695.3


