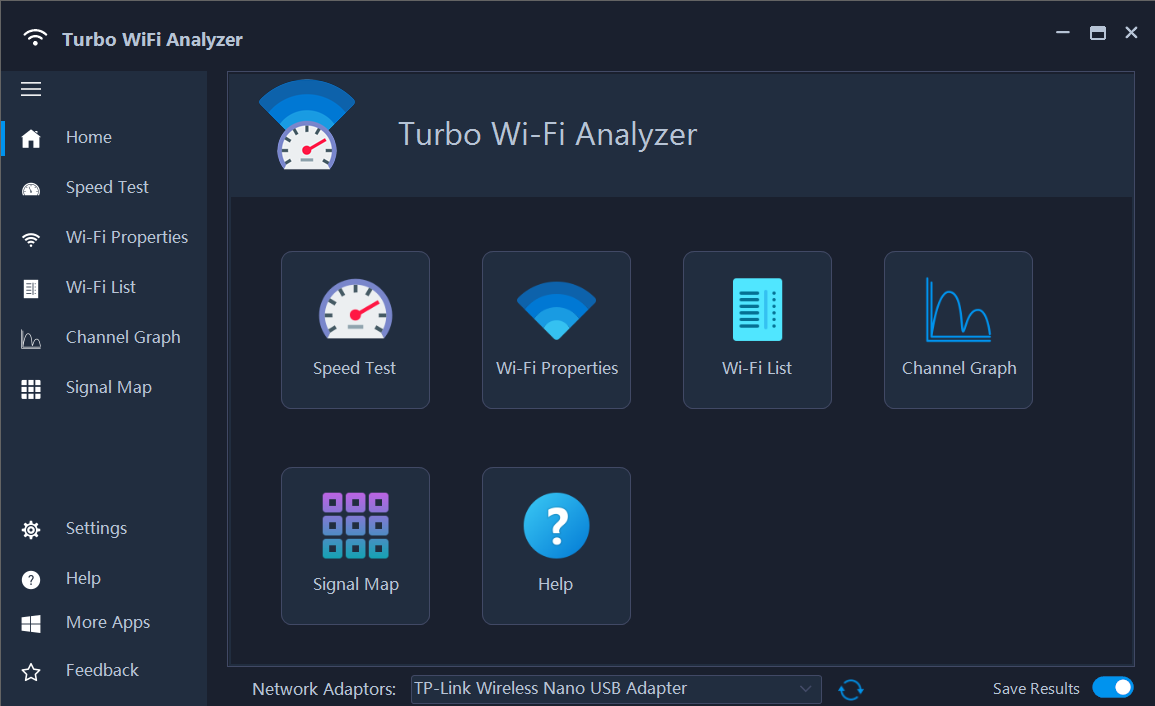
Launch the application
- Click the Windows Start button

- Type “Turbo WiFi Analyzer”
- Identify the matching application entry in search result with this icon

- Click the application entry to launch the application
Please note: an Internet connection is required to use the main functions of the app.
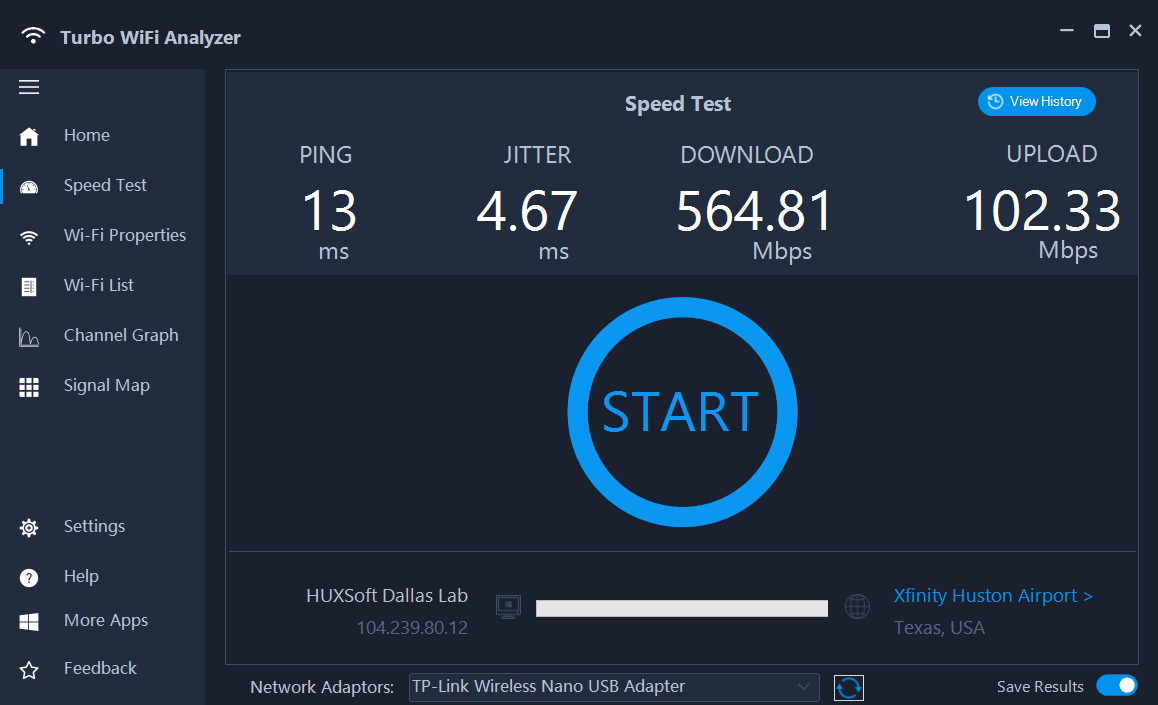
Speed Test
The Speed Test module measures your Wi-Fi bandwidth and performance through the following core criteria:
Ping: Ping measures the response time between your device and a server. It calculates the time taken for a small packet of data to travel from your device to the server and back. Lower ping values indicate better responsiveness and less latency in your network connection.
Jitter: Jitter refers to the variation in the delay of data packets during transmission. It measures the consistency of your network’s latency. A lower jitter value signifies a more stable and consistent connection, which is crucial for applications like online gaming or real-time communication.
Download speed: Download speed measures the rate at which data can be downloaded from the internet to your device. It determines how quickly you can access and retrieve content such as web pages, files, or streaming media. Higher download speeds result in faster data retrieval.
Upload speed: Upload speed measures the rate at which data can be uploaded from your device to the internet. It determines how quickly you can send files, videos, or other data to online servers or other devices. Higher upload speeds are essential for activities like video conferencing, cloud backups, or sharing large files.
These criteria provide insights into different aspects of your Wi-Fi performance. Understanding these measurements can help you assess the quality and stability of your internet connection.
Start testing
The Speed Test module is preconfigured with common default settings for your convenience, allowing you to begin testing immediately. To perform a speed test, simply click the ‘Start’ button located in the center of the window.
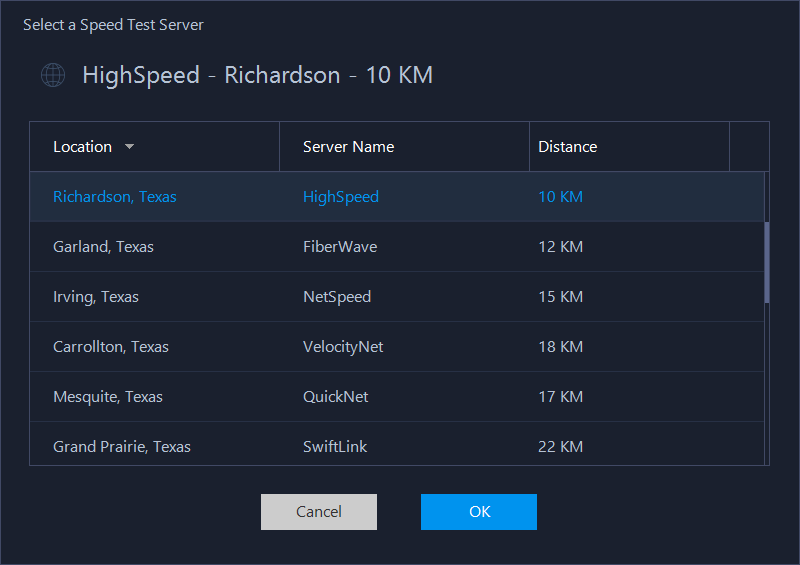
Choose a speed test server
Based on your current geolocation, the app compiles a list of speed test servers within a 100 KM radius approximately. By default, the closest server is selected.
You can also pick a different server by clicking on the label of the current server, which ends with a greater-than-symbol > to show a list of optional speed test server. Select a server from the list, and click OK to set it as the test server.
Save and view test results
Data from each speed test can be saved individually based on your preference, which is set by the Save Results toggle button ![]() , located at the bottom-right corner of the window. Toggle this button on prior to starting a test result in order to log the results.
, located at the bottom-right corner of the window. Toggle this button on prior to starting a test result in order to log the results.
To view all test results logged so far, click the View History button located at the top-right corner of the window.
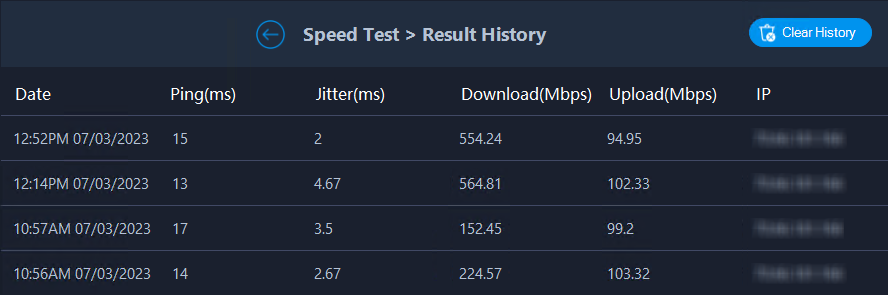
- To remove all test log entries, click the Clear History button
- To go back to the Speed Test module, click the Left arrow

Multiple Wi-Fi adaptors
In rare but not impossible circumstances, your PC may have multiple Wi-Fi adaptors. Use the Wi-Fi adaptor selection dropdown control located at the bottom of the window to set the active Wi-Fi adaptor for the test.
![]()
Wi-Fi Properties
The “Wi-Fi Properties” module presents users with a comprehensive overview of the attributes and properties of their current Wi-Fi adapter. It offers valuable information in a convenient format, allowing users to quickly access and review key details about their Wi-Fi connection.
The module is divided into several sections.
- The Device & Connection section provides insights into the network’s SSID, BSSID, protocol, channel, band, bandwidth, frequency, network type, and download/upload rates.
- The Status & Security section displays information regarding signal quality, connectivity status, encryption type, authentication type, and runtime.
- The module also offers IP information, including IPv4 and IPv6 details such as IP address, subnet mask, gateway, DHCP server, DNS server, as well as IP location attributes such as continent, country, region, city, zip code, latitude, and longitude.
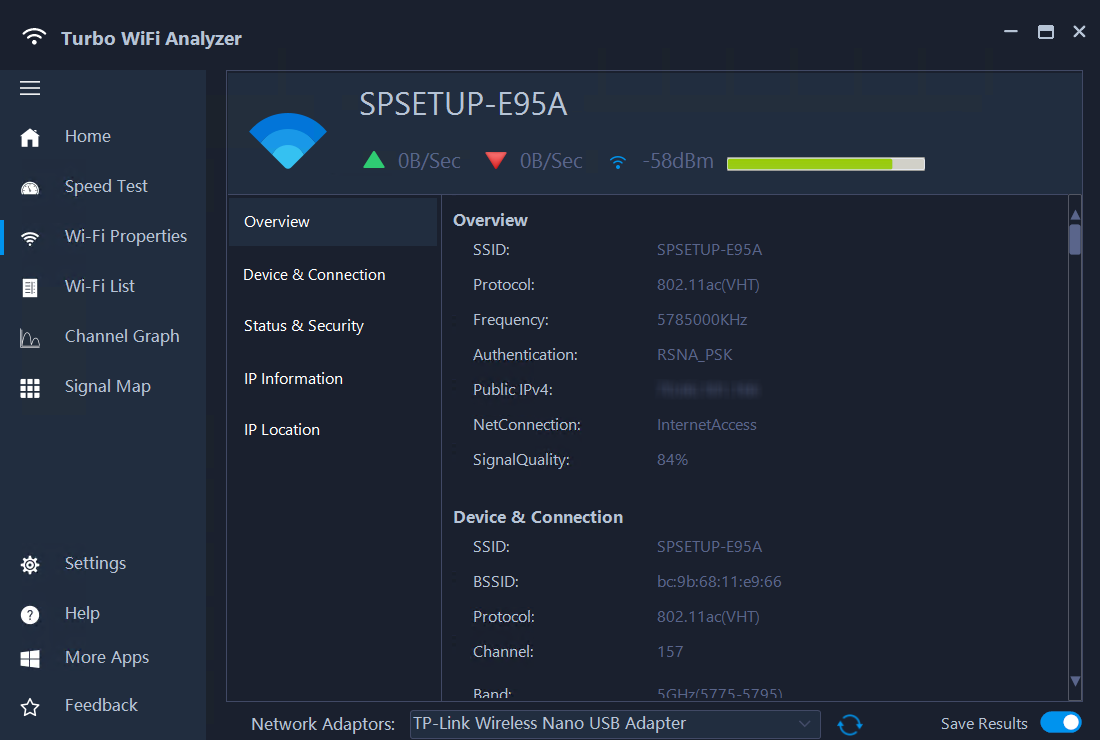
Quick info
The header area of the “Wi-Fi Properties” module offers a convenient overview of the current status of your Wi-Fi adapter. It includes essential information at a glance, such as the connection status, upload speed, download speed, and signal strength (RSSI).
Wi-Fi Network List
The Wi-Fi network list module presents a compilation of available networks in your vicinity that can be detected by your current Wi-Fi adapter. It offers a summary of essential information for each network, including the band frequency, channel ID, and received signal strength indicator (RSSI).
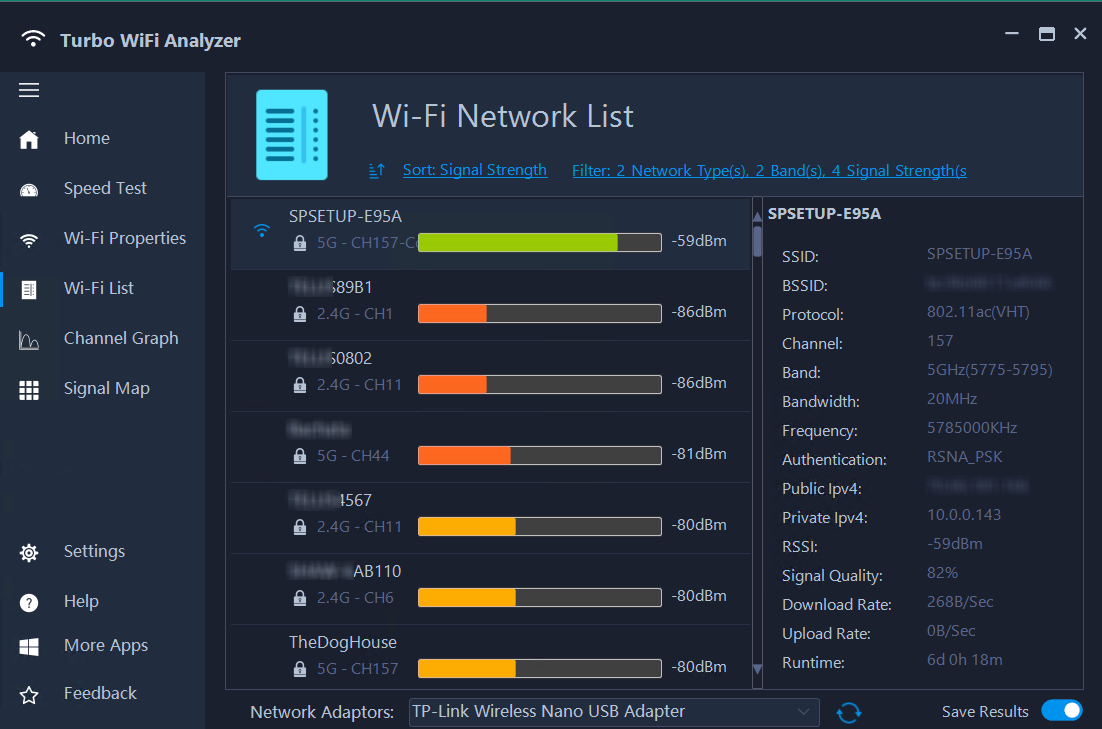
You can also select each network to view more detailed info including: network protocol, bandwidth, frequency, authentication, IP, signal quality, upload/download speed etc.
The Display Options
The network list module provides options for customizing the display and sorting of Wi-Fi networks. These options include filtering networks based on their types, such as open, secured, hidden, Wi-Fi direct, or unreachable networks. Additionally, users can choose to filter networks based on their band frequencies, such as 2.4 GHz or 5.0 GHz. Lastly, networks can be sorted based on their signal strength, with options like strong, good, fair, or weak.
Click the “Filter…” link located at the top of the list to view and access the options for displaying the networks:
Types of Wi-Fi networks
Based on their types. Here are the different types of Wi-Fi networks that can be selected:
- Open Network: An open network is a Wi-Fi network that does not require any password or authentication to connect. Users can join these networks without entering any credentials.
- Secured Network: A secured network is a Wi-Fi network that is protected with a password or encryption. Users need to provide the correct authentication credentials to connect to these networks.
- Hidden Network: A hidden network, also known as a closed network, is a Wi-Fi network that does not broadcast its SSID (Service Set Identifier). These networks are not visible in the regular list of available networks, but users can manually connect to them by entering the network name (SSID) and password.
- Wi-Fi Direct: Wi-Fi Direct allows devices to connect directly to each other without the need for a traditional wireless access point. It enables peer-to-peer communication between devices, allowing for file sharing, screen mirroring, or other direct interactions.
- Unreachable Network: An unreachable network refers to a Wi-Fi network that is currently out of range or not accessible by the Wi-Fi adapter. These networks are beyond the reach of the device and cannot be connected to at the present moment.
Band frequencies
Select to show or hide networks of different band frequencies:
- 2.4 GHz
- 5.0 GHz
Signal strength
Choose to show or hide network based their signal strength levels:
- Strong
- Good
- Fair
- Weak
The Sorting Options
The Wi-Fi network list can be sorted based on:
- Name
- Signal strength
- Band
- Channel
You can also toggle the sorting order by toggling the ascending/descending icons ![]()
![]()
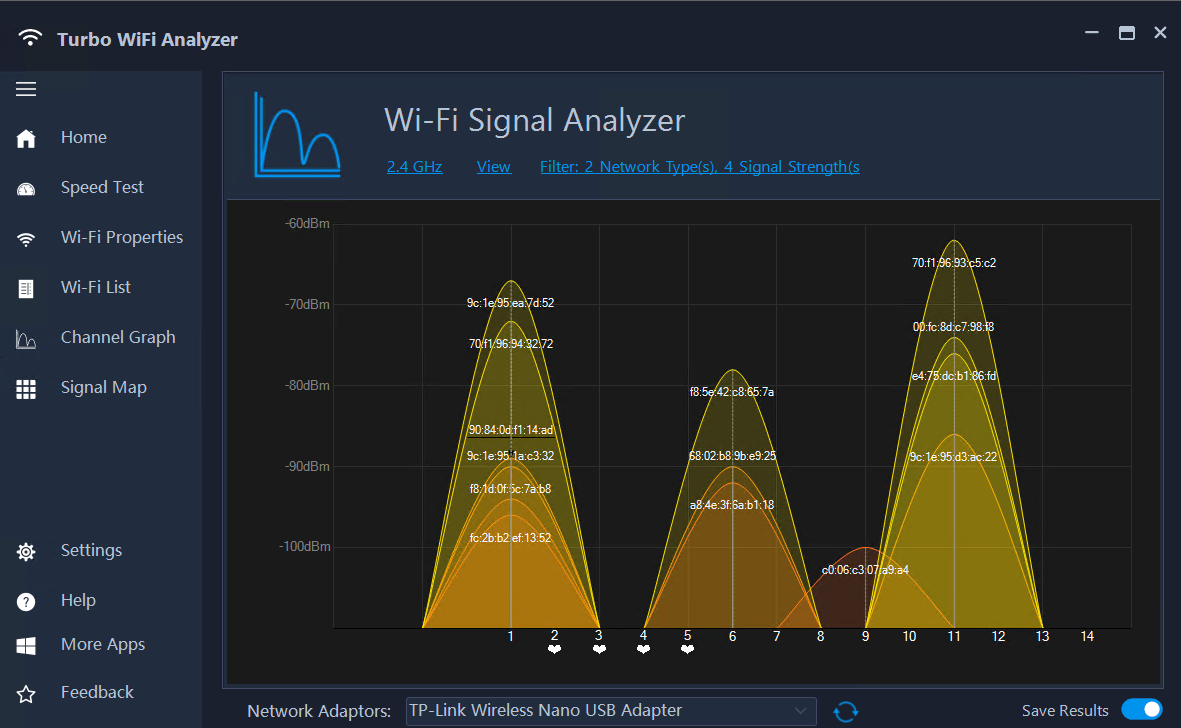
Channel Graph
The Wi-Fi Channel Graph is a visual representation that displays the utilization and congestion levels of Wi-Fi channels in a specific area. It provides valuable insights into the performance and interference on different channels, helping users optimize their Wi-Fi network settings for better connectivity.
Wi-Fi channels
Wi-Fi channels refer to the specific frequencies within the 2.4 GHz and 5 GHz frequency bands that are allocated for wireless communication. Each channel represents a different frequency on which Wi-Fi devices can transmit and receive data.
Channel graph display options
The Channel graph, or Signal Analyzer, offers the following options for display:
- Show 2.4 GHz or 5.0 GHz networks: to toggle between networks from one of the two bandwidths
- View: show/hide SSID, Mac Address, Frequency or Channel Recommendation
- Filter:
- Show/hide networks types: Open, Secured, Hidden, Wi-Fi Direct, and Unreachable networks
- Show/hide networks of different strengths raging from Strong, Good, Fair, to Weak.
Channel congestion and recommendations
Wi-Fi channels, especially in the 2.4 GHz band, can overlap and interfere with each other. This interference can degrade Wi-Fi performance and cause slower speeds or increased packet loss. Choosing non-overlapping channels or channels with less interference from neighboring networks is crucial for optimal Wi-Fi performance.
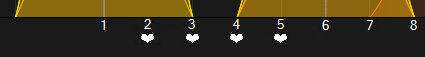
The app’s automatic channel analyzing feature evaluates the current channel congestion and identifies the top channels that offer the best signal strength. These recommended channels are conveniently highlighted with a heart icon, indicating their suitability for optimizing Wi-Fi performance. If you’re experiencing suboptimal Wi-Fi performance, it is suggested to consider switching to these recommended channels for a potential improvement in signal quality and network stability.
Learn how to use the Channel Graph i.e. Signal Analyzer to speed up your WiFi
Signal Map
Wi-Fi signal mapping, also known as Wi-Fi heat mapping or signal heat mapping, is a technique used to visualize the strength and coverage of Wi-Fi signals in a particular area. It involves creating a visual representation, often in the form of a heat map, that indicates the signal strength and quality throughout the mapped area. This can be valuable for optimizing Wi-Fi network performance, identifying areas with weak coverage, and determining the ideal placement of access points or routers.
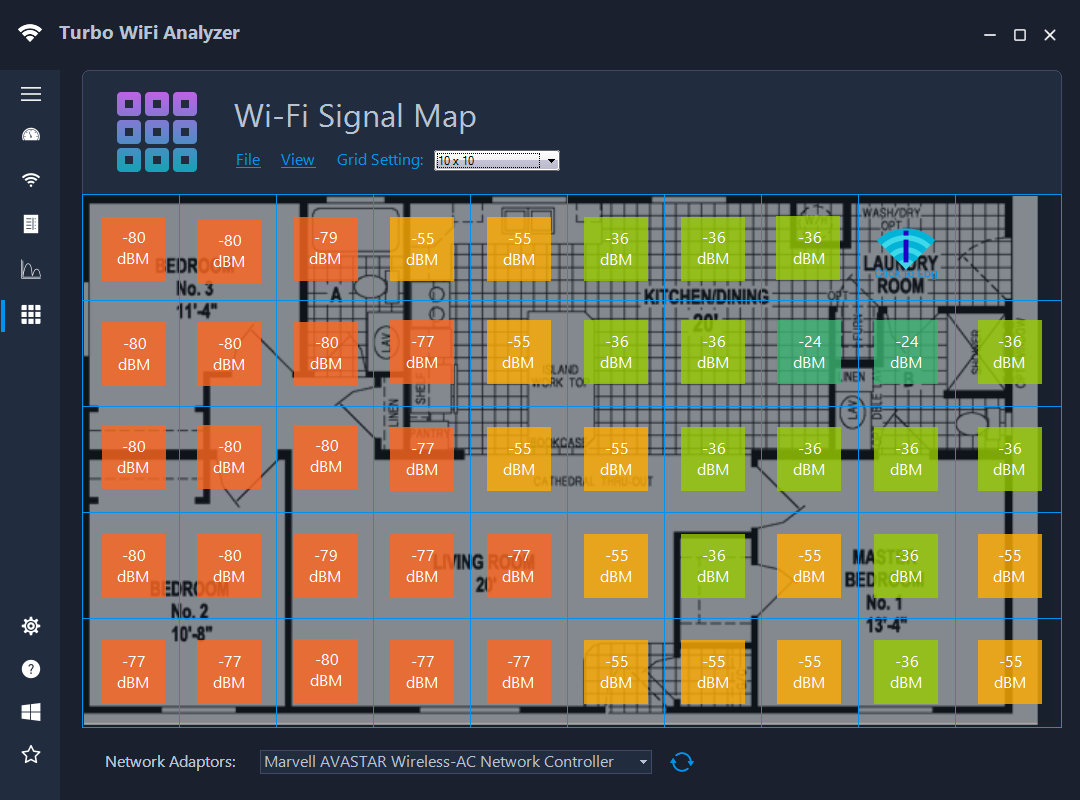
Inspired from this Verge Science YouTube video, where Becca Farsace mapped her entire apartment manually, we developed the Wi-Fi Signal Map module to make the mapping of Wi-Fi signals a breeze. The Signal mapping module provides the following features and benefits:
- Heat Map Visualization: it uses different color tone to represent the signal strength levels. Stronger signal areas are depicted with cooler colors (e.g., red or orange), while weaker signal areas are represented with warmer colors (e.g., blue or green). This visual representation allows users to quickly identify areas of strong and weak Wi-Fi coverage. (Maybe we should call it the Ice Map because the cooler the color the stronger the signals)
- Signal Strength Measurement: Signal mapping tools typically measure the received signal strength indicator (RSSI) from Wi-Fi access points or routers. RSSI is a value that represents the power level of the received Wi-Fi signal and is used to determine signal strength.
- Loading a Floor Plan: put an actual floor plan underneath the Heat Map for intuitive visualization
- Export Heat Map: save your Heat Map to PNG or PDF file for ease of sharing and markup
- Visual display options:
- Show/hide grid
- Show/hide floor plan
- Font color: Black or white
How to use the Signal Map
To utilize the Signal Map module in Turbo WiFi Analyzer effectively, follow these steps:
- Launch the Turbo WiFi Analyzer app on your device.
- Access the Signal Map module within the app.
- Choose a suitable grid option from the preset choices. This will define the granularity of the signal strength measurements on the map.
- If you have a floor plan of the area you want to analyze, upload it into the app. This will provide a visual reference for signal strength distribution.
- Begin walking around the space, ensuring you cover the entire area of interest. As you move, use the mouse or tap on the screen to record the WiFi signal strength at each spot.
- Repeat this process, capturing signal strength data at multiple locations within the space. The more data points you collect, the more accurate and detailed your signal map will be.
- As you gather the signal strength information, the app will generate a “heat map” based on the recorded data. The heat map visually represents the varying signal strengths across the analyzed area.
- Analyze the heat map to identify areas with strong and weak WiFi signal coverage. The warmer colors on the heat map indicate stronger signal strength, while cooler colors represent weaker signal strength.
- Based on the heat map analysis, you can take further actions to optimize your WiFi network. For example, if you notice areas with weak signal strength or dead zones, you may consider adjusting the router placement, adding WiFi extenders, or reconfiguring router settings.
Learn how to use the Signal Map to optimize WiFi performance.