0 C AGRICULTURE PROPERTY OF THE r, A.-~ . ,r- ,, j l·- r I n I) 1' r \.J (i i\ L l, ... l. l D I \/"\I~ Y OF OKLAHOMA CITY / MayIQ·45 R --------OKLAHOMA PLANNING AND RESOURCES BOARD ------------J \.

0 • ' J 0 0 ---------OKLAHOMA
BOARD------------' f'---.. I
PLAMMING AND RESOURCES

r ( II""""---------- DIVISION OF lt-4DUSTRIAL AND STATE PLANNING----------• TABLE OF CON mm Introduotion. • • • • • • • • • • • • • • • • • • • • • • l Agricultural Emplo;yment•••••••••••••••••• 2 Agricultural ProouotiOD 1944 ••••••••••••••• 2 lncane e.nd Production .t:xpeuea oi.' farm Opei-(:._tora •••••• 3 Wage .Ha~ea o!" farm Labor •••••••••••••••• • • I Land Utilization •••••••••• • ••••• • • • • •• ll Soila blld Land Use. . . . . . . . . . . . . . . . . . . . Heolemation Needs in Oklahoma •• • • • • . . . . . . . . . .J.1 18 Character1stioa ot· Oklahoma Soil Areas. • • • • • • • • • 20 Northern Ozarka. Southern Ozarks. Eaaterzi Prairi~•• . . . . . . . . . . . . . . . . . . . . . . . . . . . . • • • • • • • • . . . . . . . . . . . . . . . . . . Central Crosa l'ilnoera. . . . . . . . . . . . . . . . 20 ZS 2, Centr~l Prairies. 'Western Prairies. . . . • • . . . • • • • • . . . . • 26 • • • • • • • • • • • • • • • • • • Sand Hilla ••••• . .............. . ibe High Planes •• . . . . . . . . . . . . . . . . . 28 26 27 Biaok. Waxy Soila ••••••••••••••• • •• 27 Coasi;al Plains 1:>01la. • • • • • • • • • • • • • • • • Southern Cross Timbers •• • • . . . . . . . . . . . . Alluvial Soila. Granttio l>oila. . . . . . . ' . • • • • • • • • • • • • . . . . . . . . . . . . . . . . . . State Boai.rd of Agricul 1».re. . . . . . . . . . . . . . . . 28 29 29 80 State Depar'taen~ of Agriculture.. • • • • • • • • • • • !l •--------- OKLAHOMA PLANNING AND RESOURCES IOARD -------------1
,------------DIVISION OF INDUSTRIAL AND STATE PLANNING----------fAll.E oi,· CoH'J.'EN1S (Cont'd) OJclahcaa Crop Improvement Aaeooiation•• !grioul tunJ. .l:!i'xperiment Station ••••• Bxtensicm Division. . . . . . . . . . . . . . . . . • • • . . . . . • • Boil COZUJern.tion •• • • • • • • . . . . . • • . . . . . . Vooaticm.al Agriouluiral. HClllle Eoonmica Education. . . . . • • • • • • • • . . . . . . . . . • • • • • • • Four•B Clubs ot Oklahoma. ...... •.. • • . . . . . . • Agrioultural Organisations ••••••••••••• County and lloine Demoustration Agents •• • • • • • • • • • Wheat • • • • • • • . . . . . . . • • • . . • • • • Cotton• •• . . . . . . . . . . . . . . . . . . . Cottoneeea and Cottonseed froduots. • • • . . . . . • • Corn.. • • • • • . . . . . . . . . . •• • • • • • • • • • • Oats. . . . • • . . . . • 36 • 41 46 46 46 48 50 b3 60 73 ~-- • • • ••• • • • • • • • • • • • • • • • • • • • • • 80 Ba.rl•J• • • • • • • • • • • • • • • • • • • • • • • • • • 80 Sorghums • ••••••••••••••••••••••••• 86 -· • ••••••••••••••••••••••••••• 86 Altali'a euia .Alfalfa Seea. • • . . . . . . • • • • . . . . . Broomoorn. . . . . . . . . . . . . . . . . . . . •• 97 • • • • . . . . . • • • • • . . . . . • 99 Peoe.ns. 104 Tru.ok Crope. • • • • • • • • • • • • • • • • • • • • • • • 106 Jtruita. • • • • • • . . . . . . . • • • . . • • • . . 106 Cattle. • • . . . . . . . . • • • • • • • . . . . . . . 112 Swine •••• • . . . . • • • • • • • . . . . . . • • • • • J.U • ---------OKLA.HOMA., PLANNING AND RESOURCES BOARD------------' 0 .. 0
(CONT'D)
C L ,------------ DIVISION OF INDUSTRIAL AND STATE PLANNING------------. TABLJ!i o~· CON'l'd7S
Sheep • ••••••••••••• • • ••• • • • • • • • l1~ Horses and Kules. . . . . . . . . . . . . . . . . . . . . . lU 129 Poultry. . . . . . . . . . . . . ............. . Egg Production••••••••••••••••••• • 129 Hatchery Production. • • • • • • • • • • • • • • • • 129 Marketa. . . . . . . . . . . . . . . . . . . . . . . 129 'I\lrkeys. • • • • • • • • • • • • • • • • • • • • • • • • • l~ Ducts. • • • • • • • • • • • • • • • • • • • • • • • • • • uo Va1rying. • •• • • •••••• • ••• ••. • • • • ••• 1~6 1 2 4 5 6 7 l:S 9 10 ll 12 13 14 16 16 J.7 18 l~ zo d 22
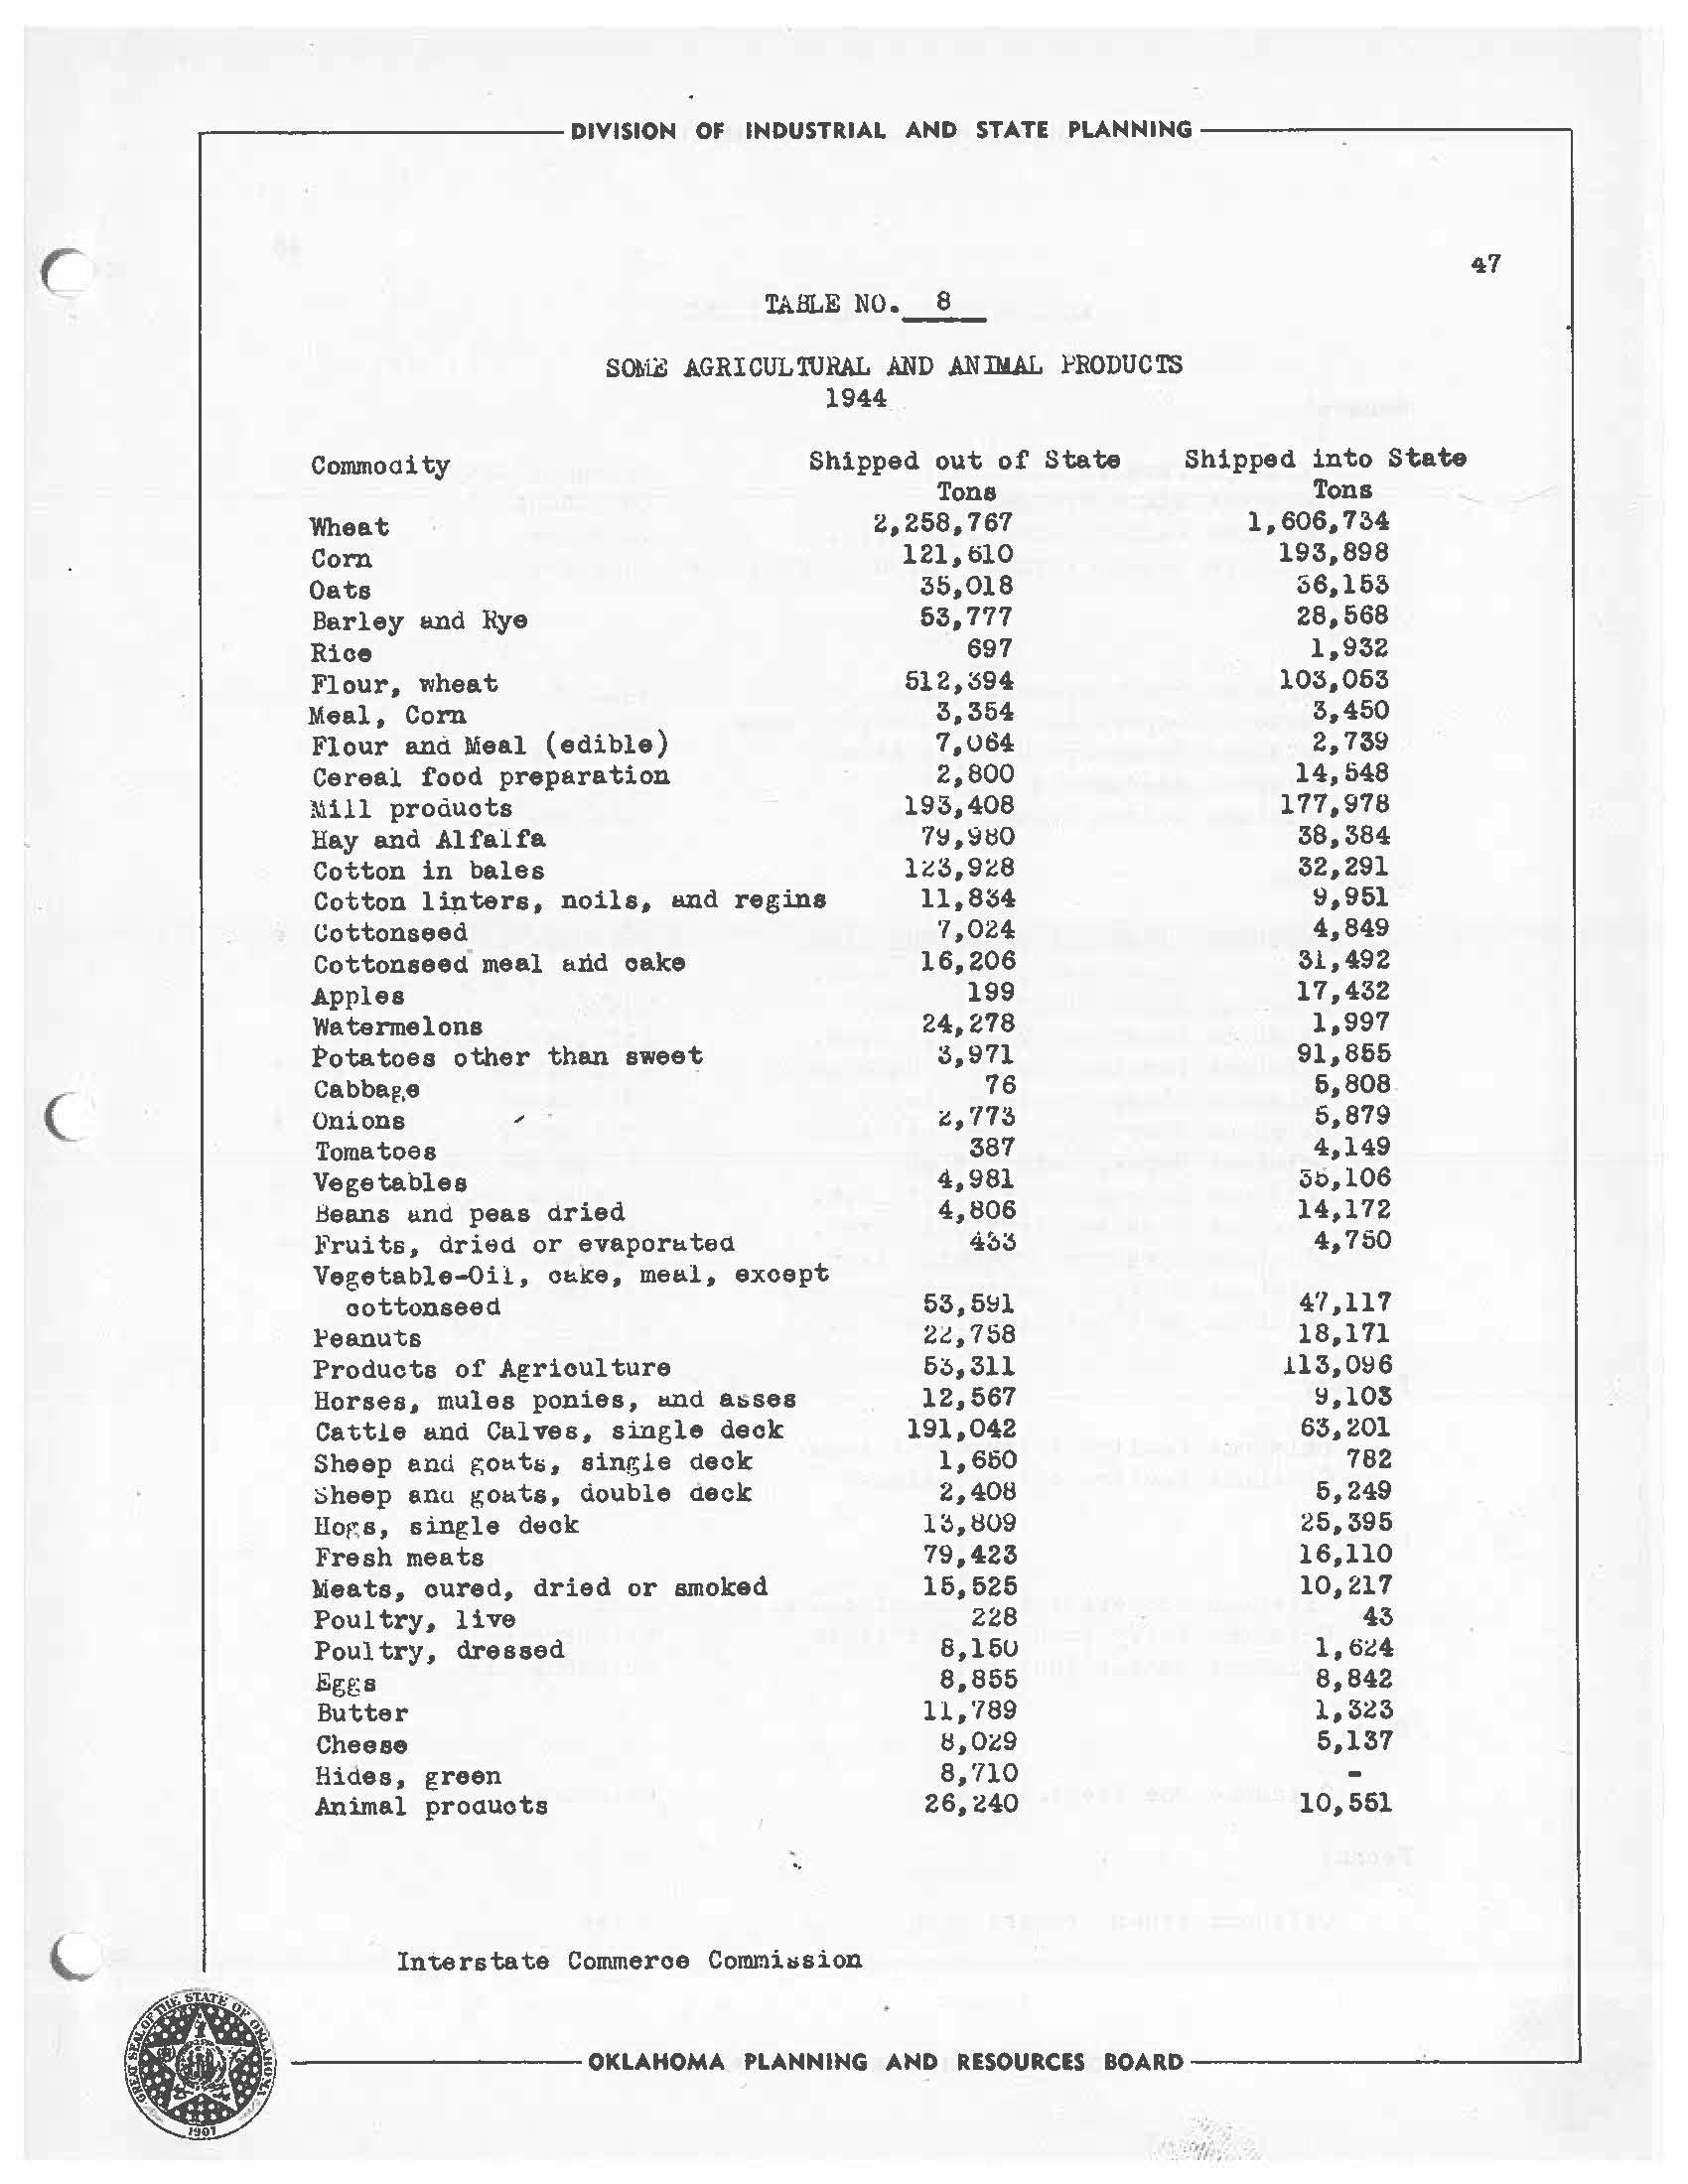
Tot~l Crop l'roduotion ana Value 19"•. • • • • • • • 5 tota1 Commercial Truok Crop Production ea Value 1~44............ 6 Oklahoma Cub 1''arm Inoome by )'.ears ana Selected C0111111oditiea. • • • • • • • • • • • • 7 Production Expenses ot J:o'ann Operators 19M. • • • • • • 9 Inocae ana Production Data. Per J:o'arm 1~44. • • • • • • 9 Incane ana Proauotion ~peneea of li·am Operatore.. • • • • • • • • • • • • • • • • • • • 10 Cash .luloeipta - Selected Crops 1944 ••••••••••• 10 S011e Agricul-cural a.na An1Jnal ~roduota 19~•• • • • • • • t7 County and liome Den.onstrat1on Agents. • • • • • • • • • bO Wheat 1894 - 19•4• •••••••••••••••• • •• 6b Wheat - 1~44 by Counties.. • • • • • • • • • • • • • • 68 Cotton 1894 - 194~ ••• • • • • • • • • • • • • • • • • 62 Cotton, 1944 by Count1ea... • • • • • • • • • • • • • 66 Com 18~9 - 1944. • • • • • • • • • • • • • • • • • • • 611 Corn, 19- by counties. • • • • • • • • • • • • • • • • 71 uats 1900 - l9"•... • • • • • • • • • • • • • • • • 76 Oa~a, l~M by Coun~iea. • • • • • • • • • • • • • • • • 1ti .nye 1900 - J.944. • • • • • • • • • • • • • • • • • • 81 Barley 19UO - J.9M ••• • ••••• • • • • • • • •• • ~i Barley 1944 by Counti••• •••••••••••••••• ~• ~orrhwna 1944 Dy Coatie•• ••••••••••••• , • ~T Sorfh\DI Calle ror ~1rup 1916 - l~ff ••••••••••• 89 OKLAHOMA ·PLANNING AND RESOURCES IOI.RD ____________1
tAll,BS
r-------- ----- DIVISION OF INDUSTRIAL AND STATE PLANNING - - - ----. TJ.BLJ:.S (Con~•e1) 0 lfo. ~age 28 All Sorghums .L92S - 1~44. • . . • • . • . • . • . • • ~o ~4 Bay. All 'J.'am~ 1~00 - ll,44 . . • . . . • . • • . . • . . 92 26 Wild Bay 1912 - 1g44. . . • . • . . • • • . • . • . . ~3 26 Alfalfa Hay .l~~4 - 11:144 • • . • . . • • . • . . . • • • 96 27 Alfalfa ~eeo 19~9 - 1~44 . • • • . . . . . . . • . • • 96 28 Broomcorn 1915 - 1~44. • • . • . • . • . • . . . . . . ~8 29 Peanuts 1919 - 11:/44 . • . . • . • . . • • • . • . • . • .LOO so Peanuts 1944 by Counties • . . . . . • . . . . . • . • 102 81 Pecans 191~ - 1~44. • . . . . • . . . • • . . . • . . lOo sz Pot.toes 1~00 - 1944 • • • . . . . . • . • . • . • • . J.08 ~s Potatoes. Sweet 1900 - 1944 . • . . • . . • . . • . • . J.09 M Fnlit 1916 • 1944 . • . . • . • • • . • . • • . • . • . 110 86 LiTestook and Poultry, 1945 by Coun-ciea • • • . • • • . :U4 86 All Cattle 1891 - 1944. • . . • • . . . . • • . • . • • 117 87 Jlilk Cows 1891 - 1944. . • . • • . . . . . • . • • . • 121 .58 Hoga 1891 - 1944 • . . . . . . . . . • . . . • . • . . 123 59 Stoolc Sheep lij9l - .l~44 • . . . . . . . . . • . . . . . 125 '° Horaea 1891 - 1944 • . • • • . • . . • • . • . . • • • 1i6 ·'1 Kules 189.l - 1944 • • • • • • • • • • • • . • • • . • u 7 ,i Poul tq Salee 1944. • • • . . . • • . • • . . • . • 131 '" Chicken• 1~24 - 194~ . • • • . • . • . • . . . . . . • 133 " Bgga Produced 19~4 - 194~ . . . . . . . . • . • . . • . 134 t6 turkeys 1929 - i~4~. . • . . . . . • • . • . . . . . . 1;,b 0 46 Daiey Produota 1944. • . . . . . . . • . . • • . . • . J.38 47 llilk Produced 1924 - 194~ • • • . • • • . . • . . . • . 139 48 Creamery aitter & Chedaar Cheese. • . • . . . . . . • . 140 FIGURt;S Bo. .l'age1 Value ot· Frinoipd Agricu .L ~ral Crops 1944. • . . . • . 4: 2 Percentage Distribution of ~ ;ricul tur&l Ce.ah Income 1944. • . • • . • • • . . . . . . . . 8 s Percent ot Land Area in 1''arn1s 1940. . . • . • • • • • . lS 4 .lffrage Va1ue of 1''arm Lands a.nd Buud.ings Per Acre 1940. • . . • . . . • • . . • . . . . . • 14 6 .lwn.ge She of Farms 1940 . . • . • . • • . • • • . • 16 6 Pr•l111inary Type oi' Fanning Map. • • . • • . • . . • . 16 7 Soil Areas oi' Okltwoma • • . . . . • • • • . • . . . • 21 8 Soil Acidity • • • • . . • • . . . • . • . • . • • . • i~ 9 8.oluble Fhosphoroua in ~oils. • • • • • • • • • . • . • 22 10 Soil Conservation Distriota. • • • • • • . • . • . • . 44 11 , Trend in. ~heat !915 - 1~4~. . • . . • . . • . . . • . . f>4 12 Distribution 01· hheat 1944 • . • . • . • • • • . • • • 57 1i Trend in Cotton l~lo - 1~4~ • . • . . . . • . • . • . • 61 0 ---------OKLAHOMA PLANNING AND RESOURCES BOARD - - - -..J
C r----------- DIVISION OF INDUSTRIAL AND STAT£ PLANNING -----------,.
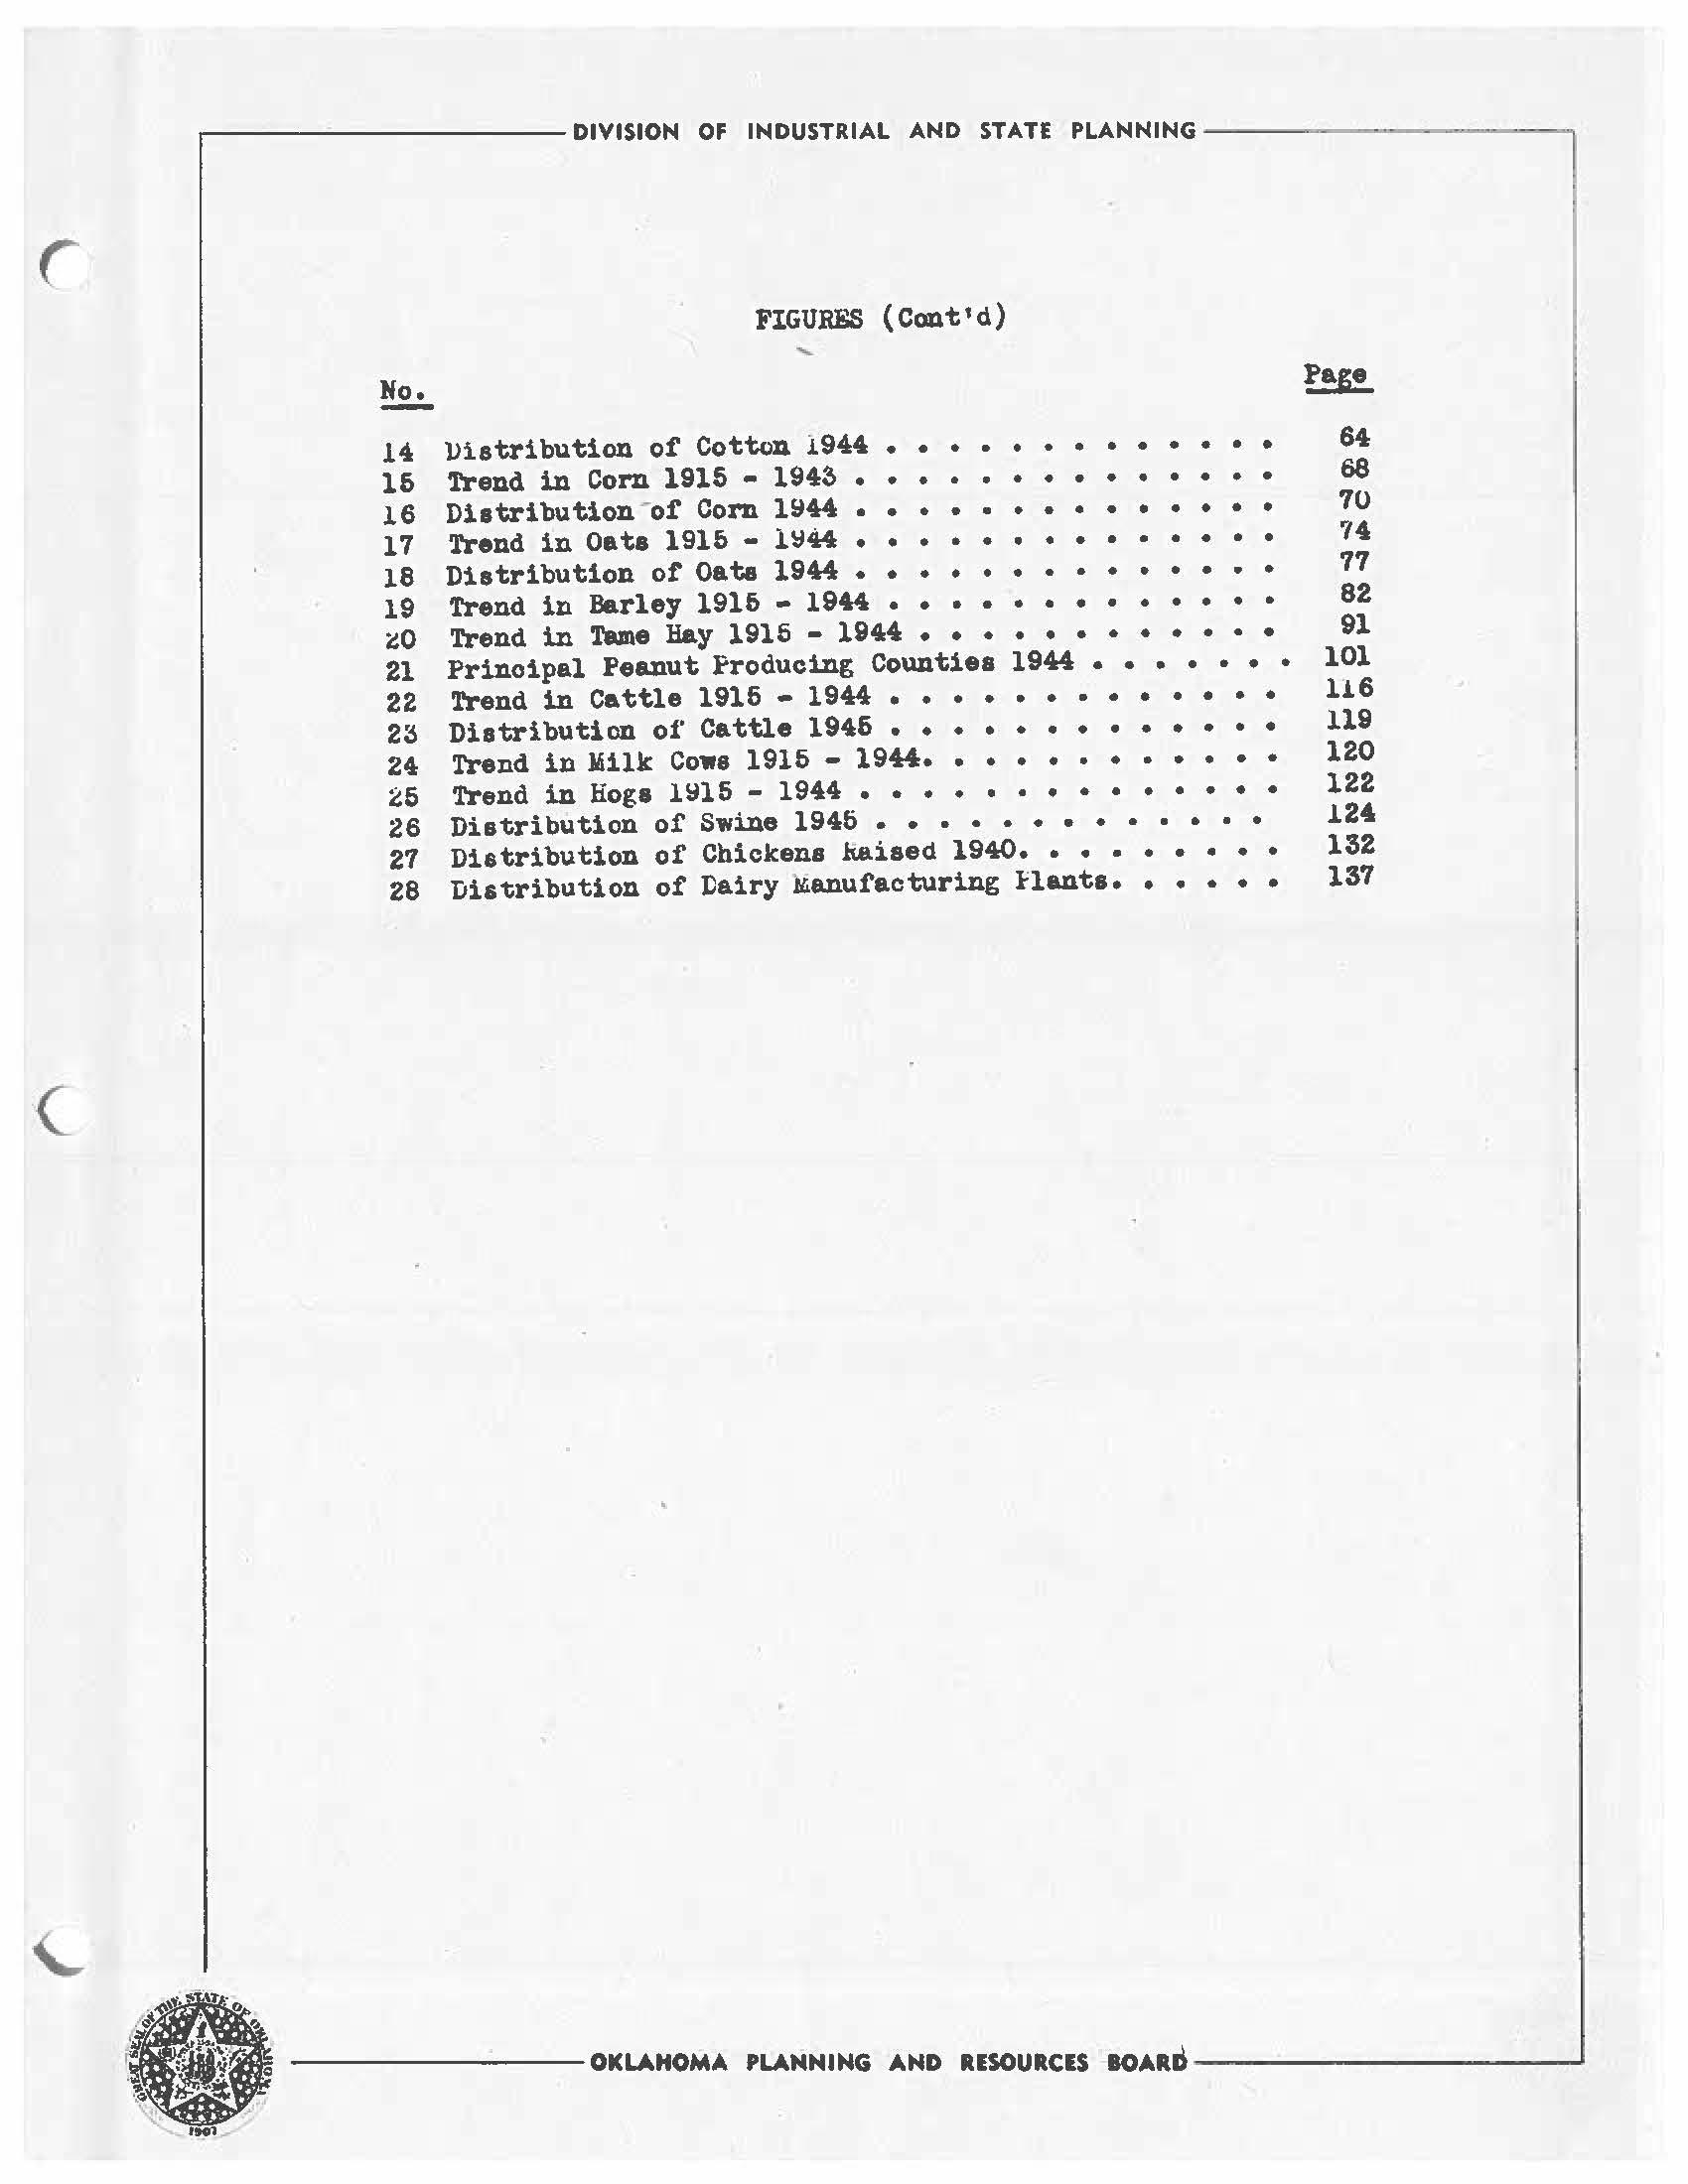
No.14 Uistribution of Cotton 1944.. • • • • • • • • • • • 64 16 Trend in Corn 1915 • 194i. • • • • • • • • • • • • • 68 16 Distribution -of Corn 1944 • • • • • • • • • • • • • • 70 17 Trend in Oat, 1916 - 1~44. • • • • • • • • • • • • • 74 18 Distribution of Oata 1944.. • • • • • • • • • • • • 77 19 Trend in Barley 1916 - 1944.. • • • • • • • • • • • 82 io Trend in Tame Hay 1916 - 1944.. • • • • • • • • • • 91 21 Principal Peanut Producing Counties 1944 ••••••• 101 22 Trend in Cattle 1916 - 1944 •••••••• • • • • • 116 23 Distribution oi' Cattle 1946 • • • • • • • • • • • • • 119 24 Trend in Milk Cows 1916 - 1944. • • • • • • • • • • • 120 26 Trend in Hoga 1~15 - 1944. • • • • • • • • • • • • • 122 26 Distribution of Swine 1946.. • • • • • • • • • • • 124 27 Diatribution of Chickens kaiaed 1940. • • • • • • • • 132 28 Distribution of Dairy ~anufacturing flanta. • • • • • 137 --------OKU.HOM.+. PLANNING AND RESOURCES BOARD - ---------_J
FIGURES (Cont'd)
0 0 0 ---------OKLAHOMA PLANNING AND RESOURCES BOARD--------- -----'
Agriculture in Oklahoma is of m~jor importance in the eoonomio lit'e of 1;he ste.,;e. In spite of the great development in the petroleum ana other industries most of the towns in the state ~till serve as centers 1·or the ool J.ection, processin~ ti.n<i distribution 01' farm crops. In 1~40, 62.410 oi' Oklahoma's populQ.t.1.on ,1;1:1.s classed as rural. the major :r:ortion or which lived on the state's 179,687 farms.

Vii th h large variety 01 soi1s ana cJ.1.matio features, a growing see.son re.ng inc from J.80 to 2bU ae.ys an.a rainfa l l v1::.ryin1~ from 15 to 50 inches practically alJ. tYF' S of cr~ps may be grown.
Oklahoma is adapted to divt:trsified crop a:od livestock farming.
'!'he prairie sec'tions of the north e.nct west constitu"te a creat wheat belt. The southern 'tWo-thircis or the state ranks h i r,h in the proauction of cotton. lhe rich iwias td on::: the rivers ano their numerous tributaries i ro a uce yield~ .:>f corn thti.t ccmptu·e favorably with those o f the corn beJ. t. The black prairies 01' the eastern and southern coun,aes ., ive bif yie ! as oi Olits. Al1'alfa proauces 1·rorn three -co five cuttiJl?: s a. m:, is :: row~1 i n every county. All over the state, but more esµecially in th e western half. the ~ra.in sorghums y i eld an &.buno anoe ol' g rain ti.no r ,~ u r,. ha 6e. ln the cen~ra.i. t1n u eastern coun ~ ies a.re com.-nercitd orchards 01· peaches, apples, pee.rs and berries. \'Hi.ternielons g rown in r.he :dush ~prin g s, Calvin, and Lamont areas of the state are lolown throughout the United States. Tomatoes from Broken bow along with the livestock inaustry bring recognition to the southeast corn~r, £no m&.ny carloads and truckloaos are shipped from the Arkt.nsas River Valley 1n the east central portion.
C DIVISION OF INDUSTRIAL AND STATE PLANNING-----------,
AuRICUL'.ltlkE
l
li' Oklahoma is 1;o mt:1.inte.in ita present high ste.naara. of· living, agriou.i.. ture a.nu inuus Gry mut1 c; progress si11e by siae. eaoh complemtonting the other, whereb) inaustry can process ana sell more products from thet i'ILl"ma.

AuR1CULTUi<AL EJ/1PLOY~1•
In terms oi' th~ number employed Agricul t1.11·a.l ia Oklahoma 1 s gr<::11:1.test industry. Census figures for 1940 show 218,130 persQns engaged. in agricul tu1·•• 'lht1 co, rt,sponaing i'ig ure f'or m~nui'...cturing was so, ·,~t:s. Since 1940 thi~ picture h~s chtlllgea greb.tly. Many fal'lll workers were lost to the Armed Forc@s t1.nC1 to war in<1ustries which on·ered at.;ractive wages. Undoubtedly there h now a much 11uproved 011.J.anoe between agricultural and industrial employment.
AGRICULTUML PHODOCTION 1~44
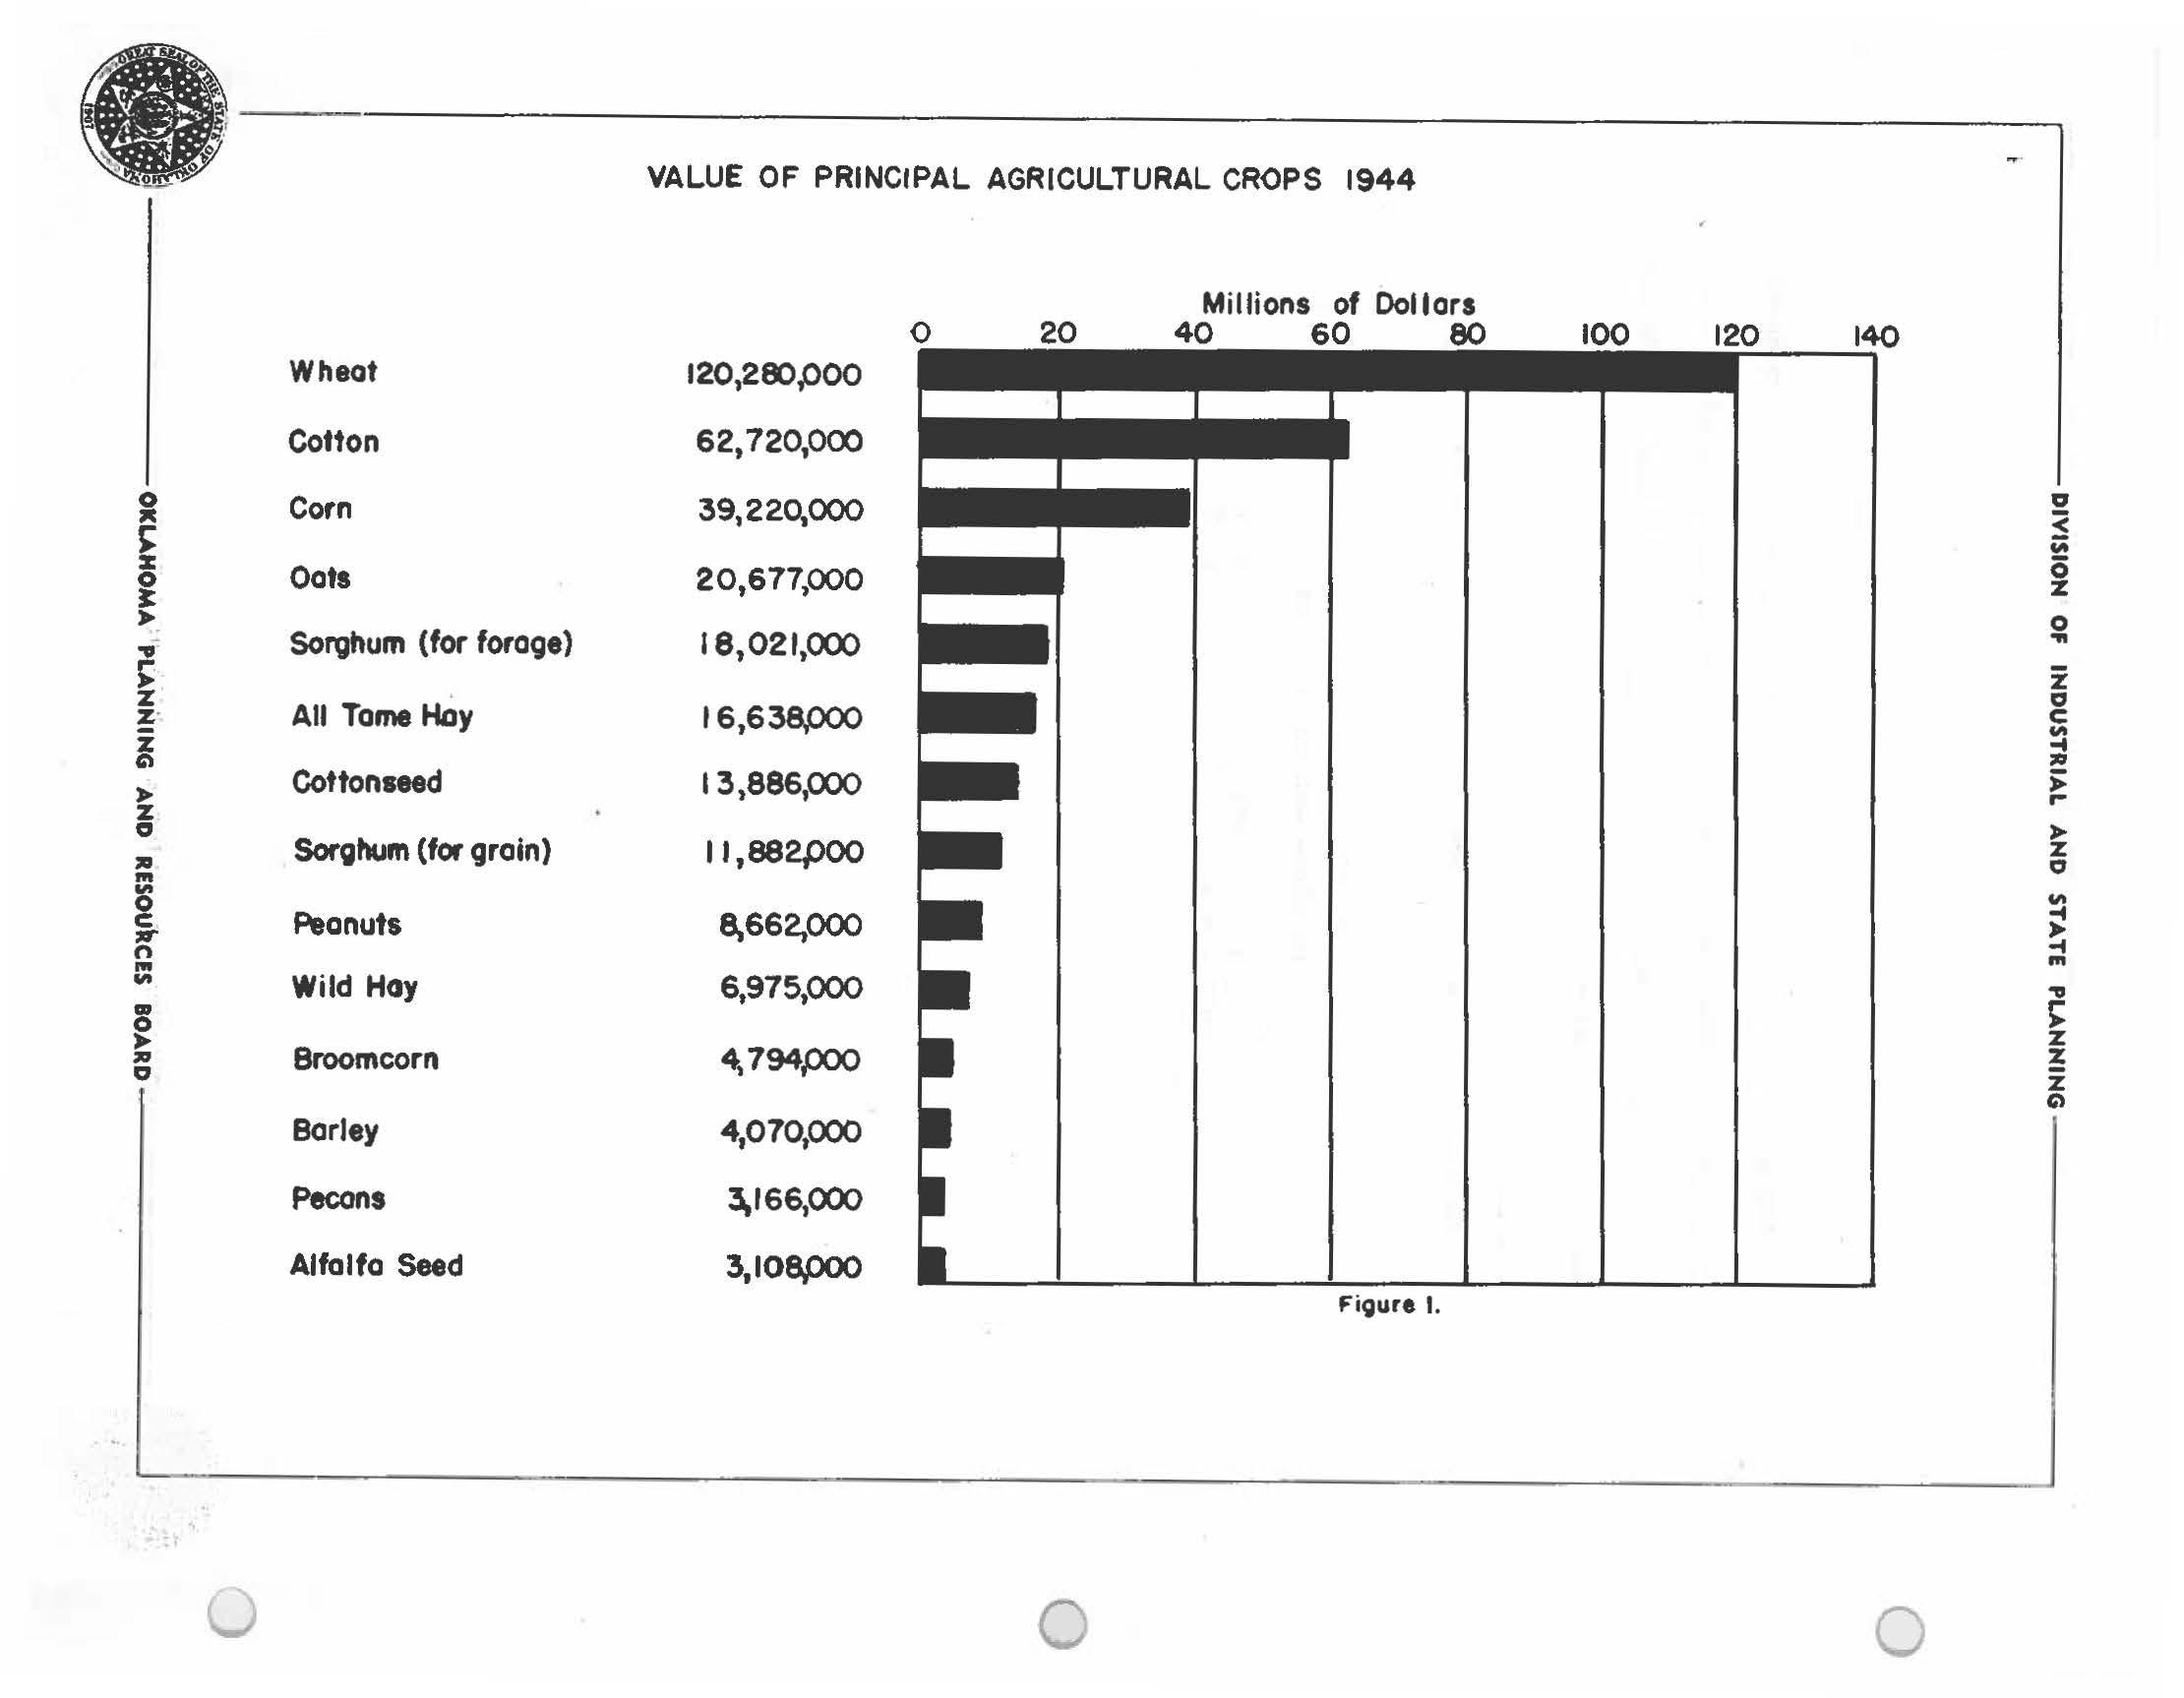
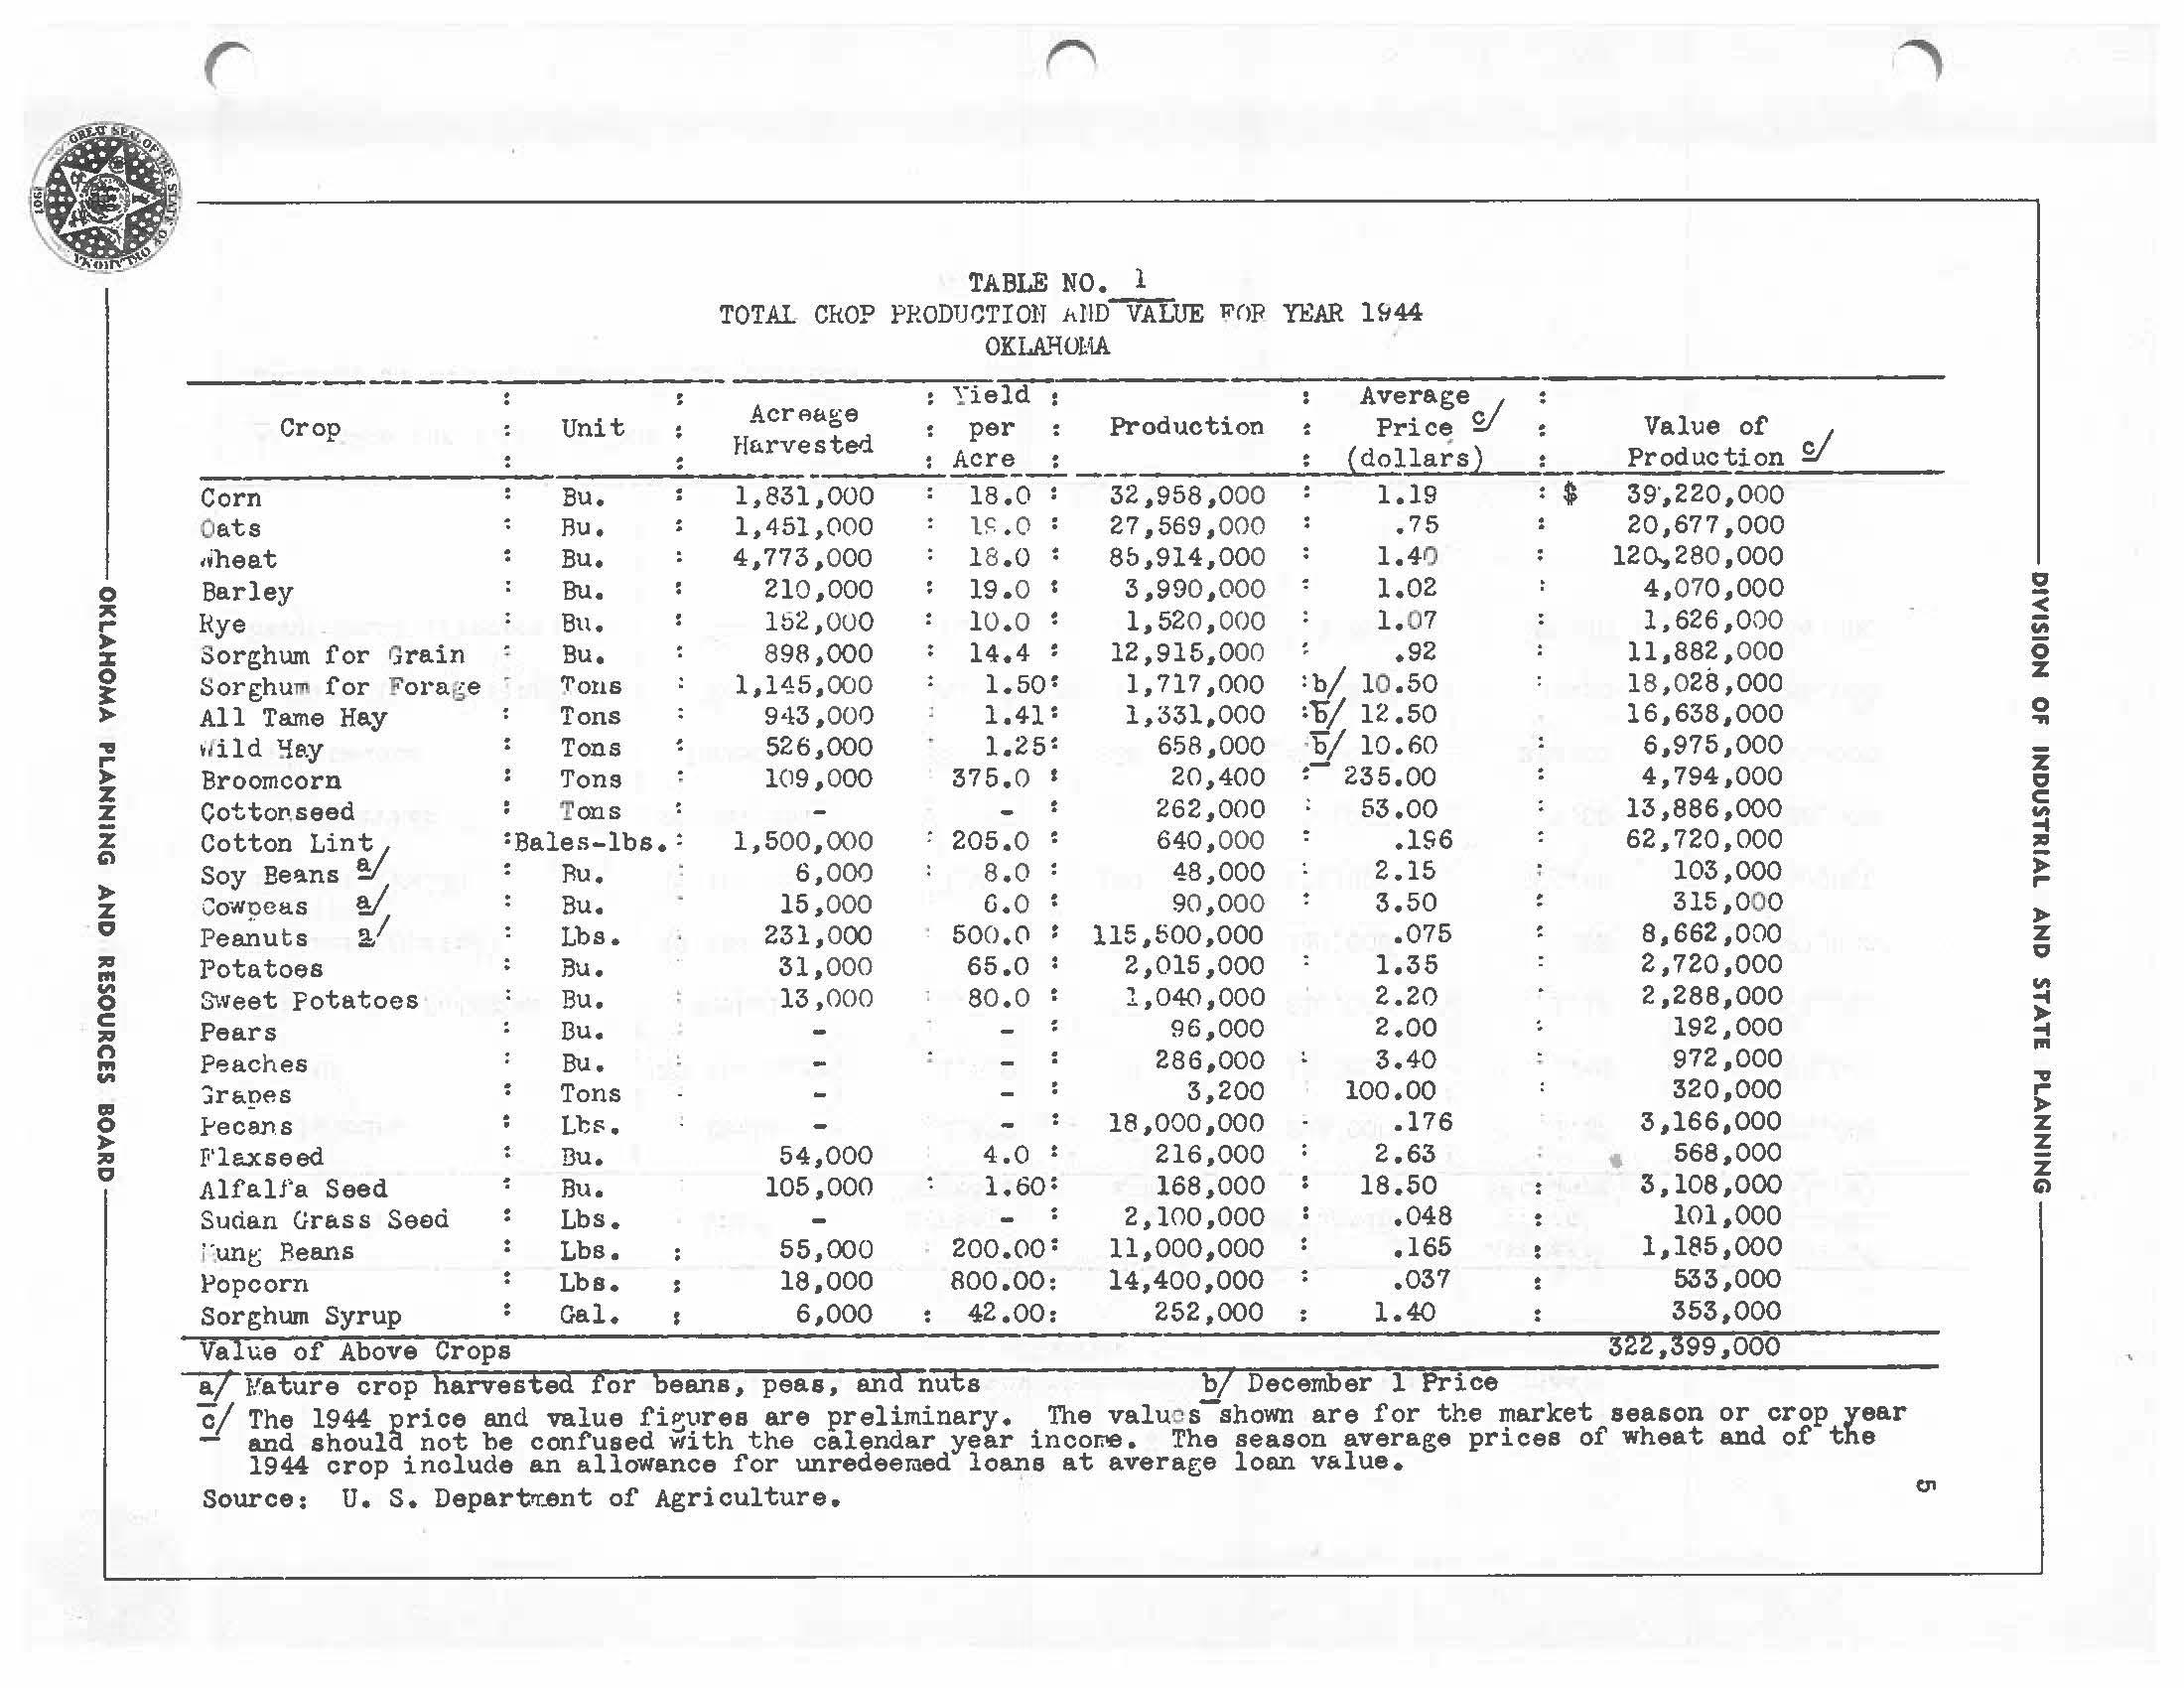
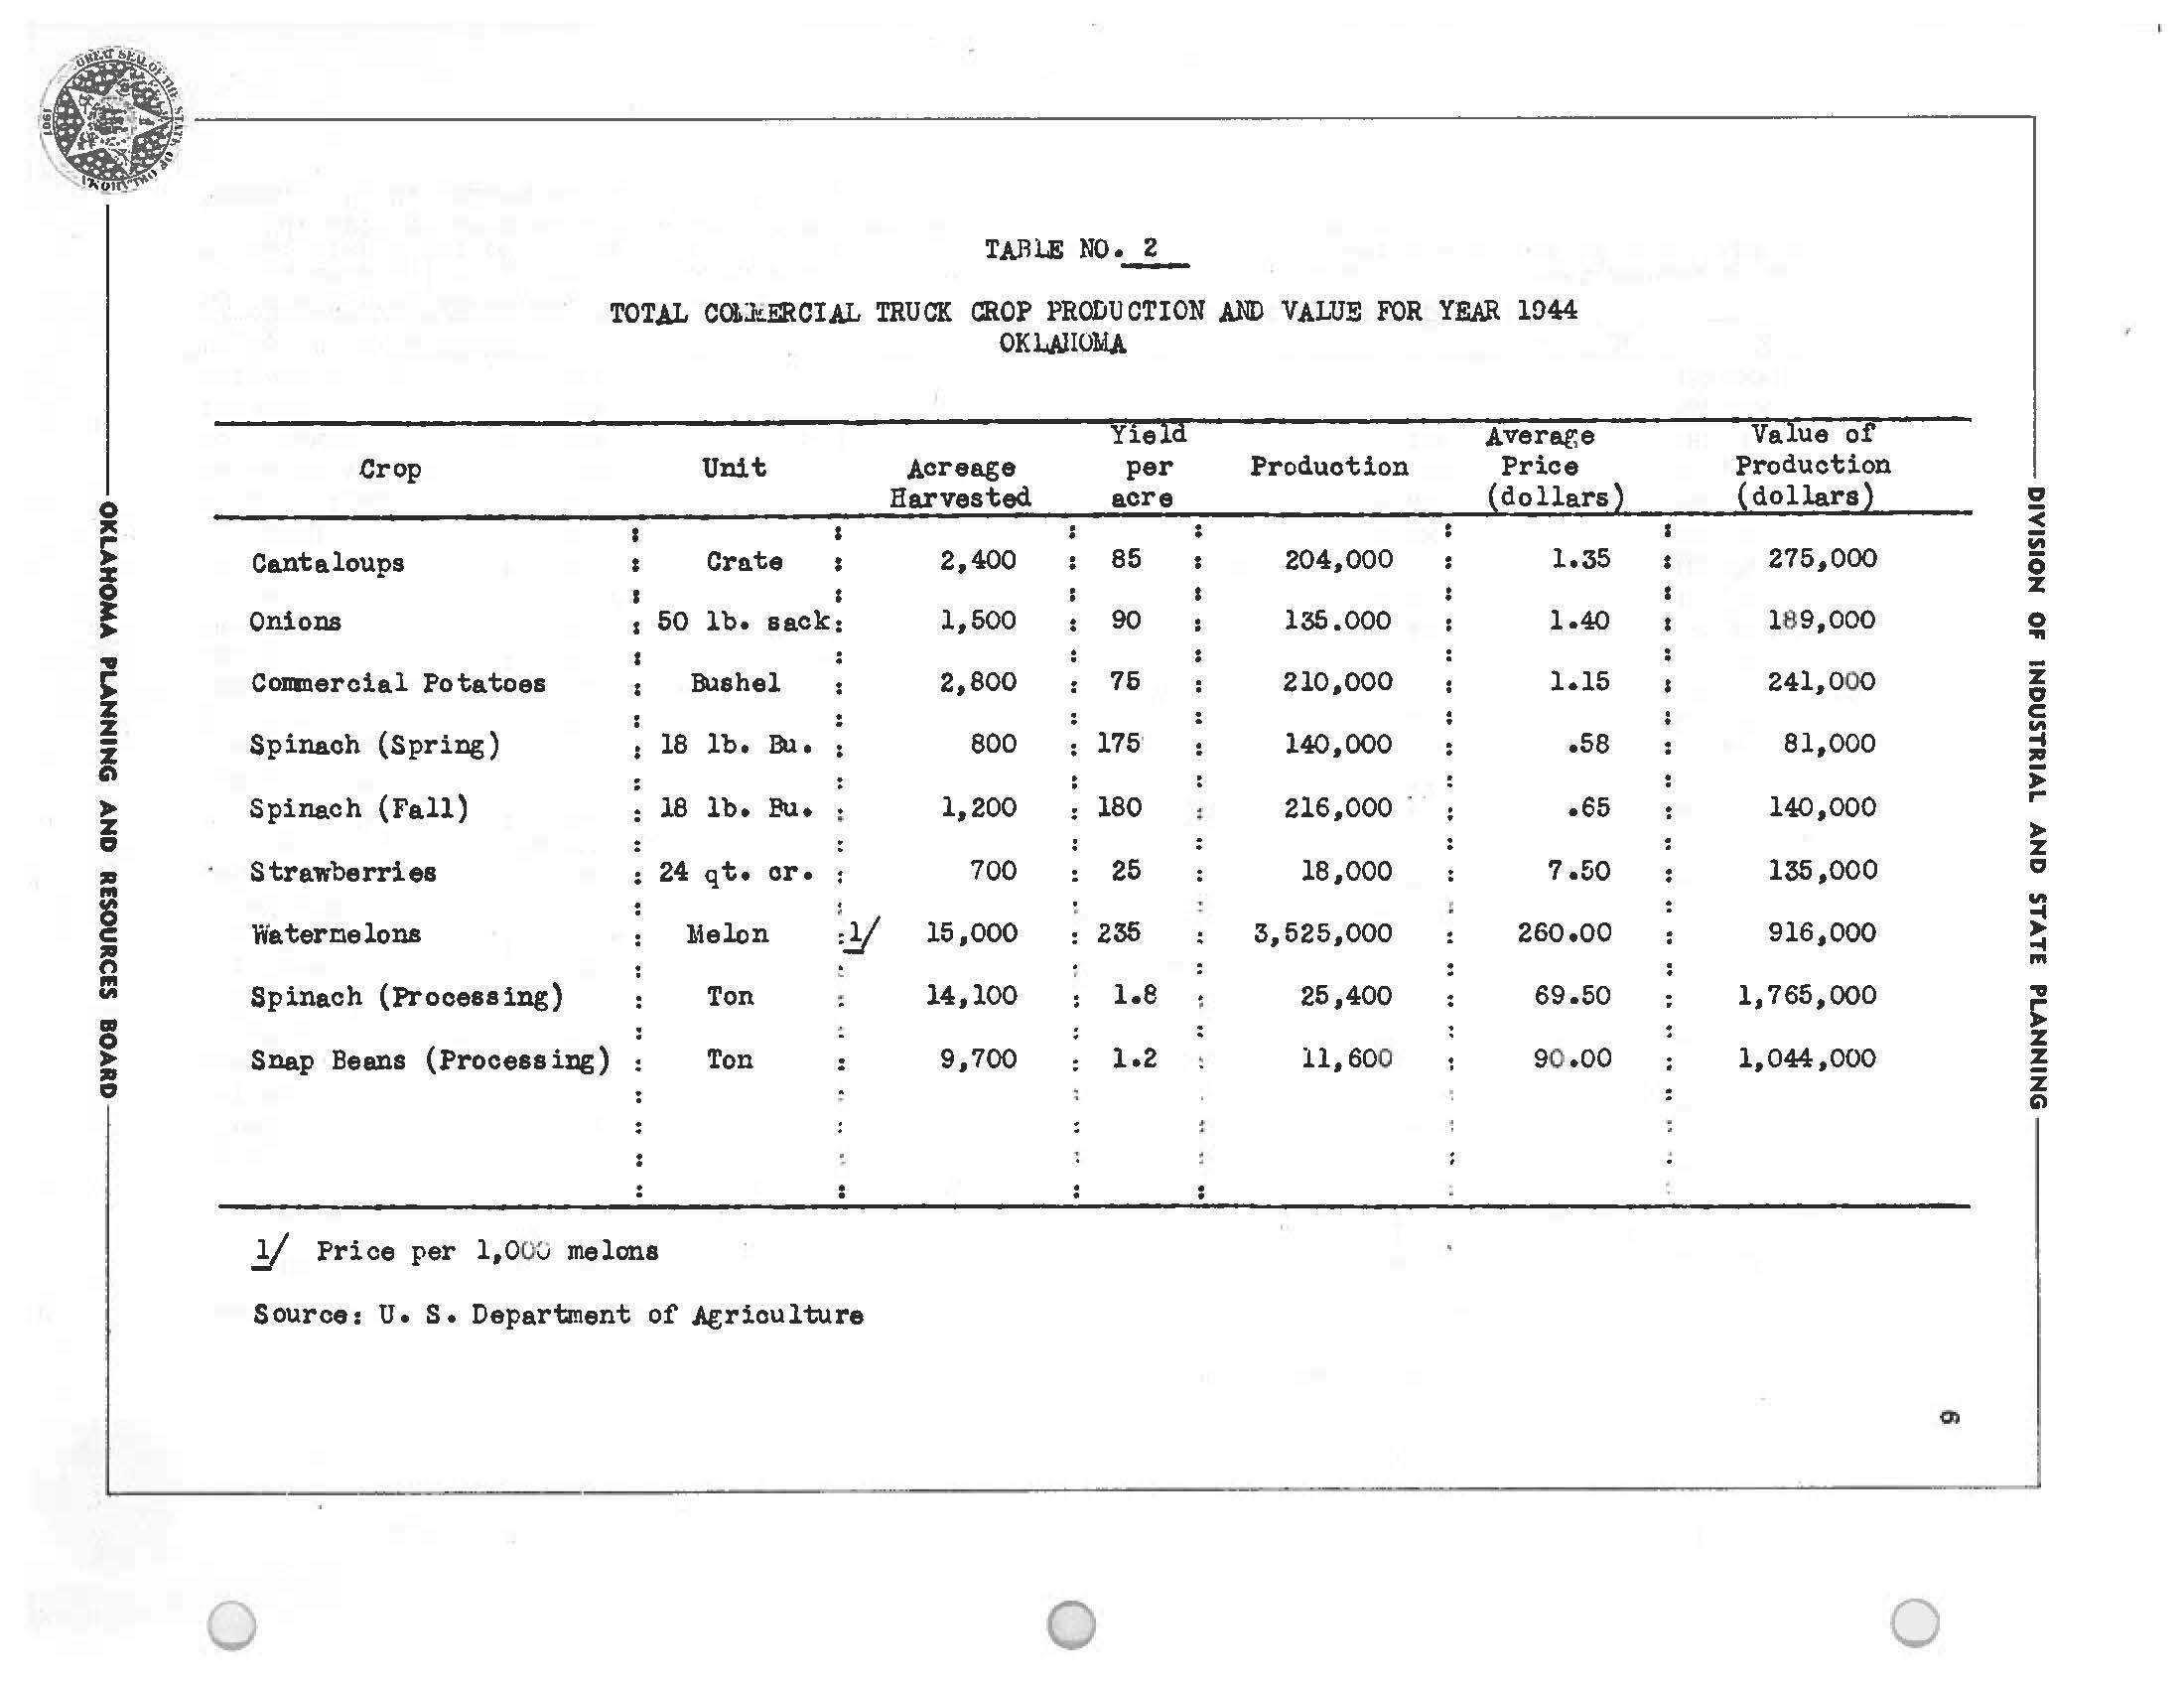
'Yhe Agrioul \.Un• .1 prouuotiun i'or Oklahomli. in 19-'t-4 ii. uetliiied in i'ablea No. .l .nd 2 • Figure No.-1:.._shows graph1ca1ly the more impo.1·tant crops ~a their va.1.ues ro,· 1944. ·nnea c. Wb.S "t;tio:, high money oi·op l'o; -che sttLte, 101:oweci oy ootc::on., corn t>.llo oa-cs • .Amonlb the tru.ok: orops spinach ho.a 1;he gret.i.test cash value 1·011owed by sDt:1.p beans.
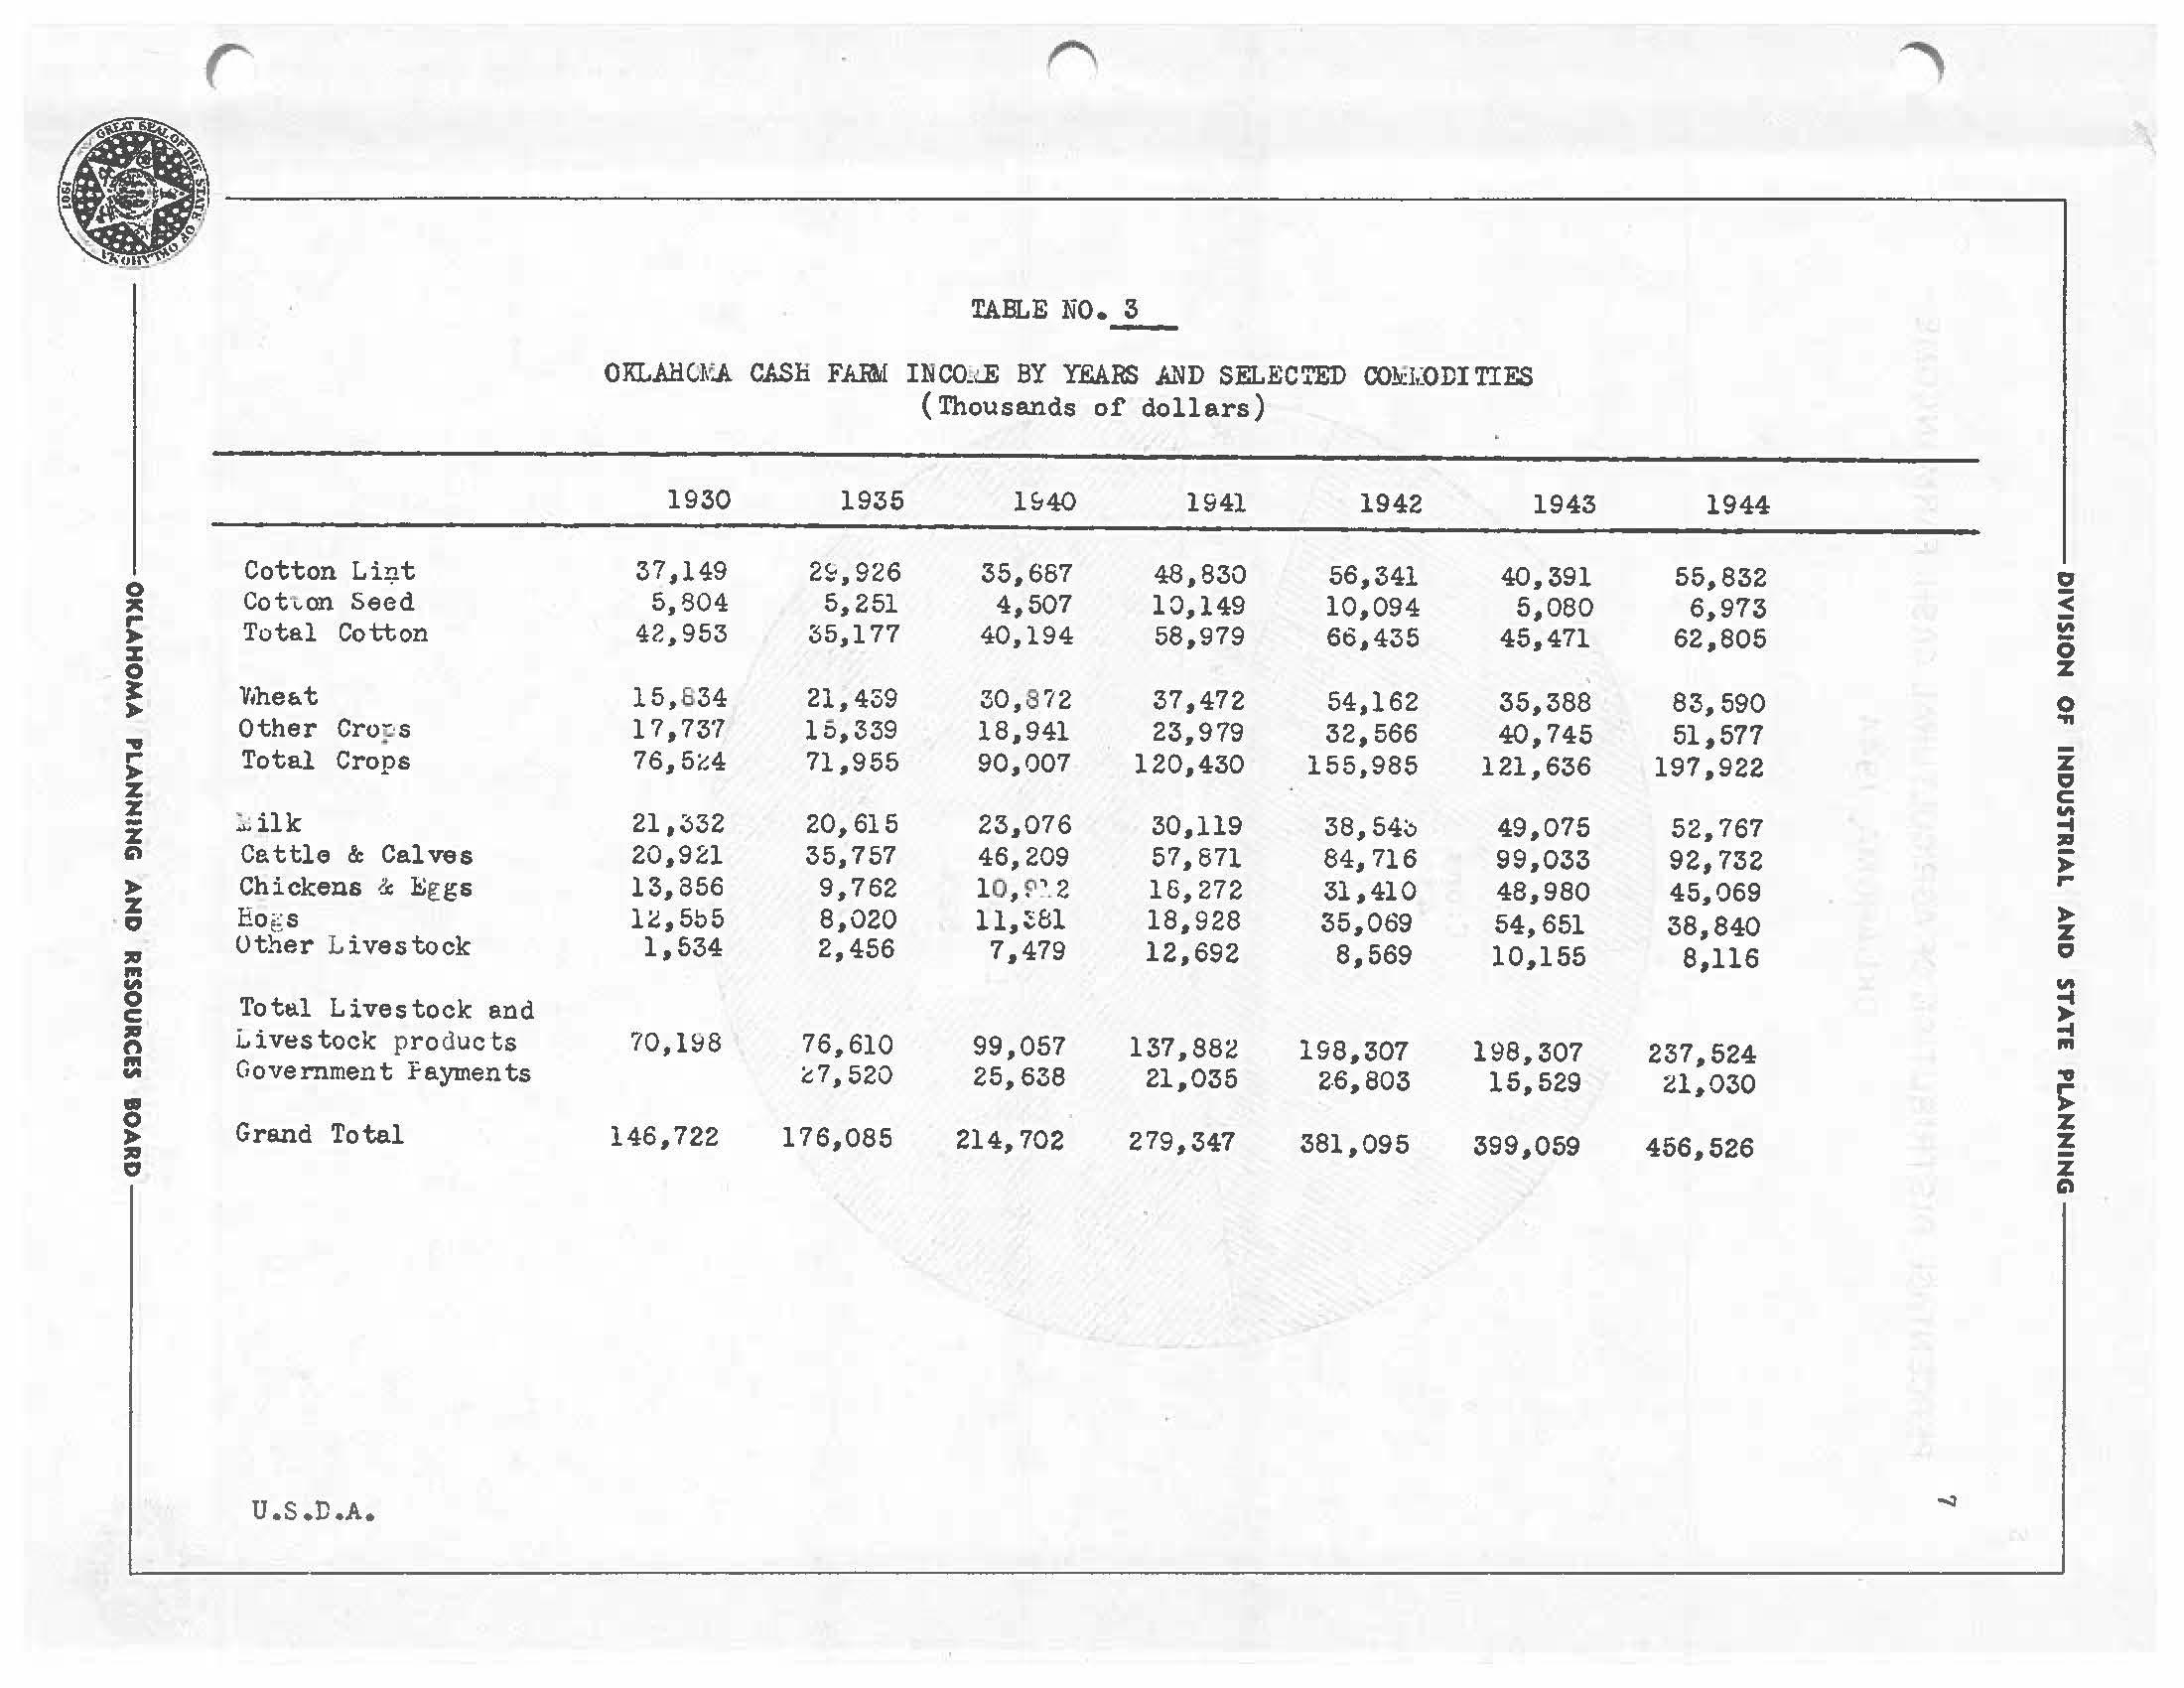
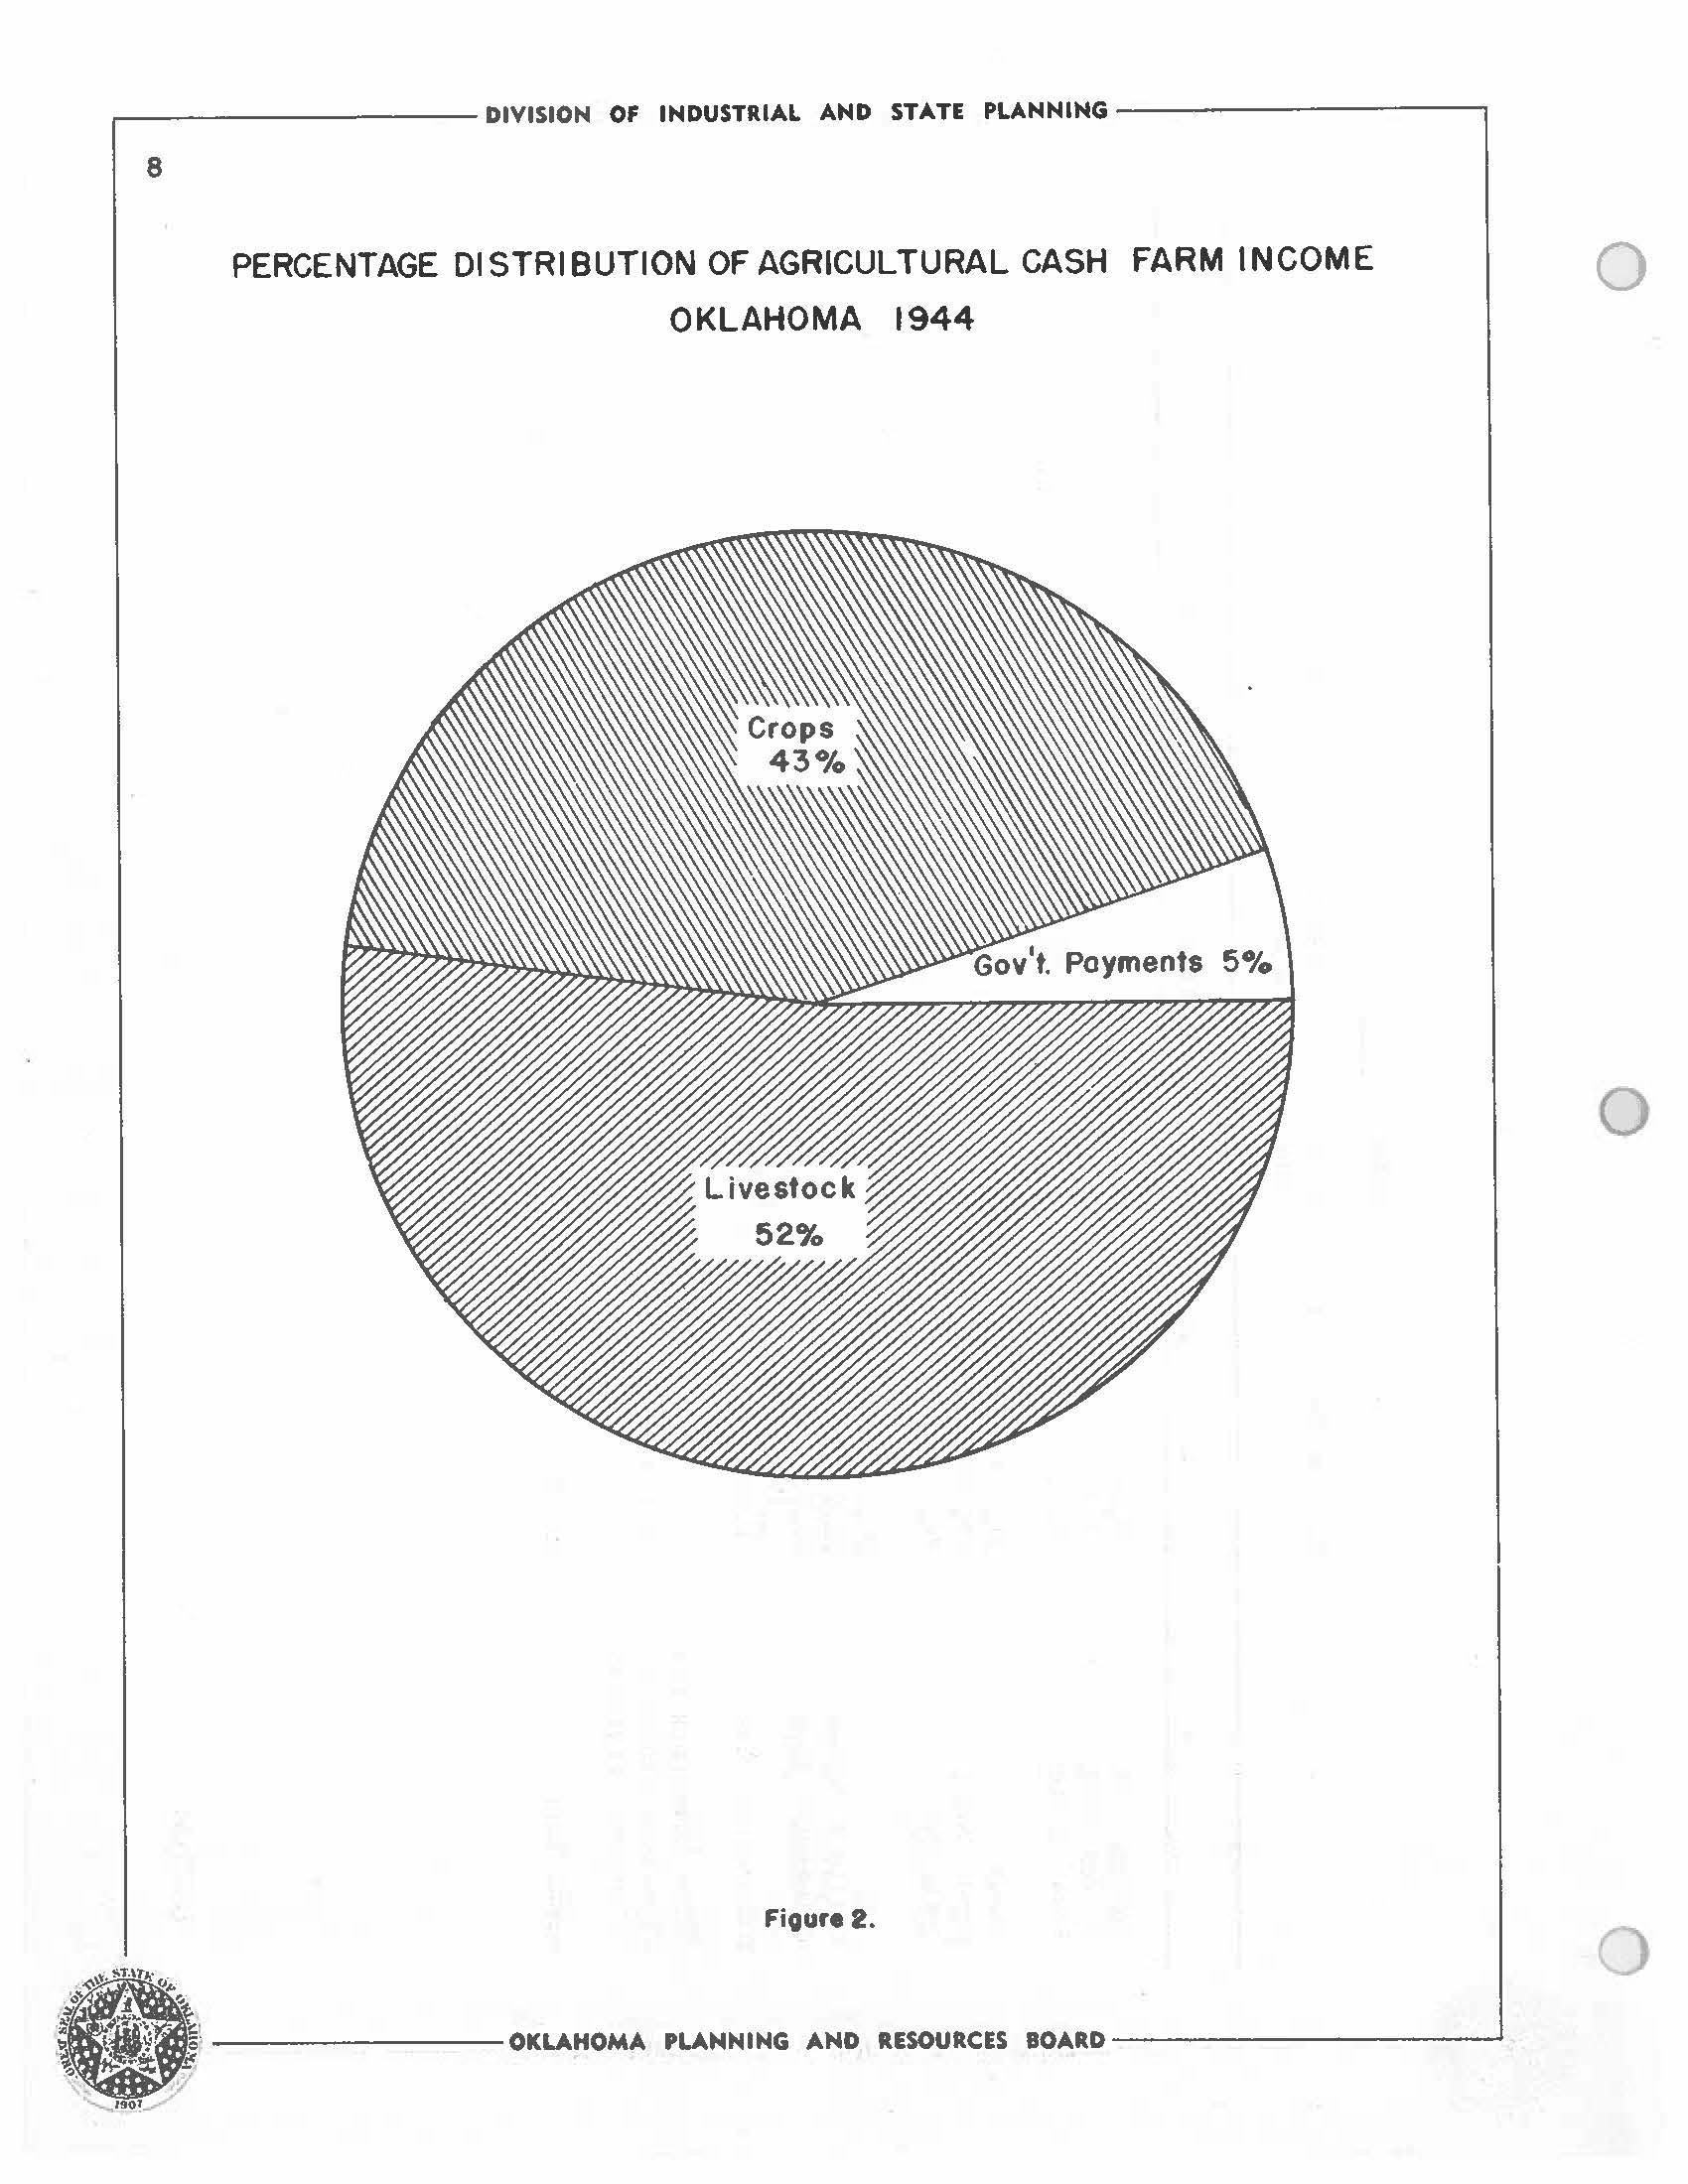
'J.'he 1944 cash r na inoomt1 01 4:>o mi.1 u on ctolla.n, 1s the 6 re1:1.-cea.~ oi" reoord. Tab.Le No. 3 de-caiis ~he cash .uu'ill income t'or reoent --years ano. Figure No. 2 shows tht1 p ... roentar;e dl.S-Criou1;ion or the 1944 Ag rioul tura.1 Cash 1-·al'lll Inoome acooruing to 11vo 1:,\;0olc, o ro:ps -and govermnen~ pQymenta.
DIVISION OF INDUSTRIAL AND STATE PLANNING ------------,_
2 ---------OKLAHOMA PLANNING AND RESOURCES BOARD ------------' 0 0 0
INCOME AHl.J .r.ltODUCTION J!XPEN~.1!.S OF l<'Al<M OP.t:RA'.IORS
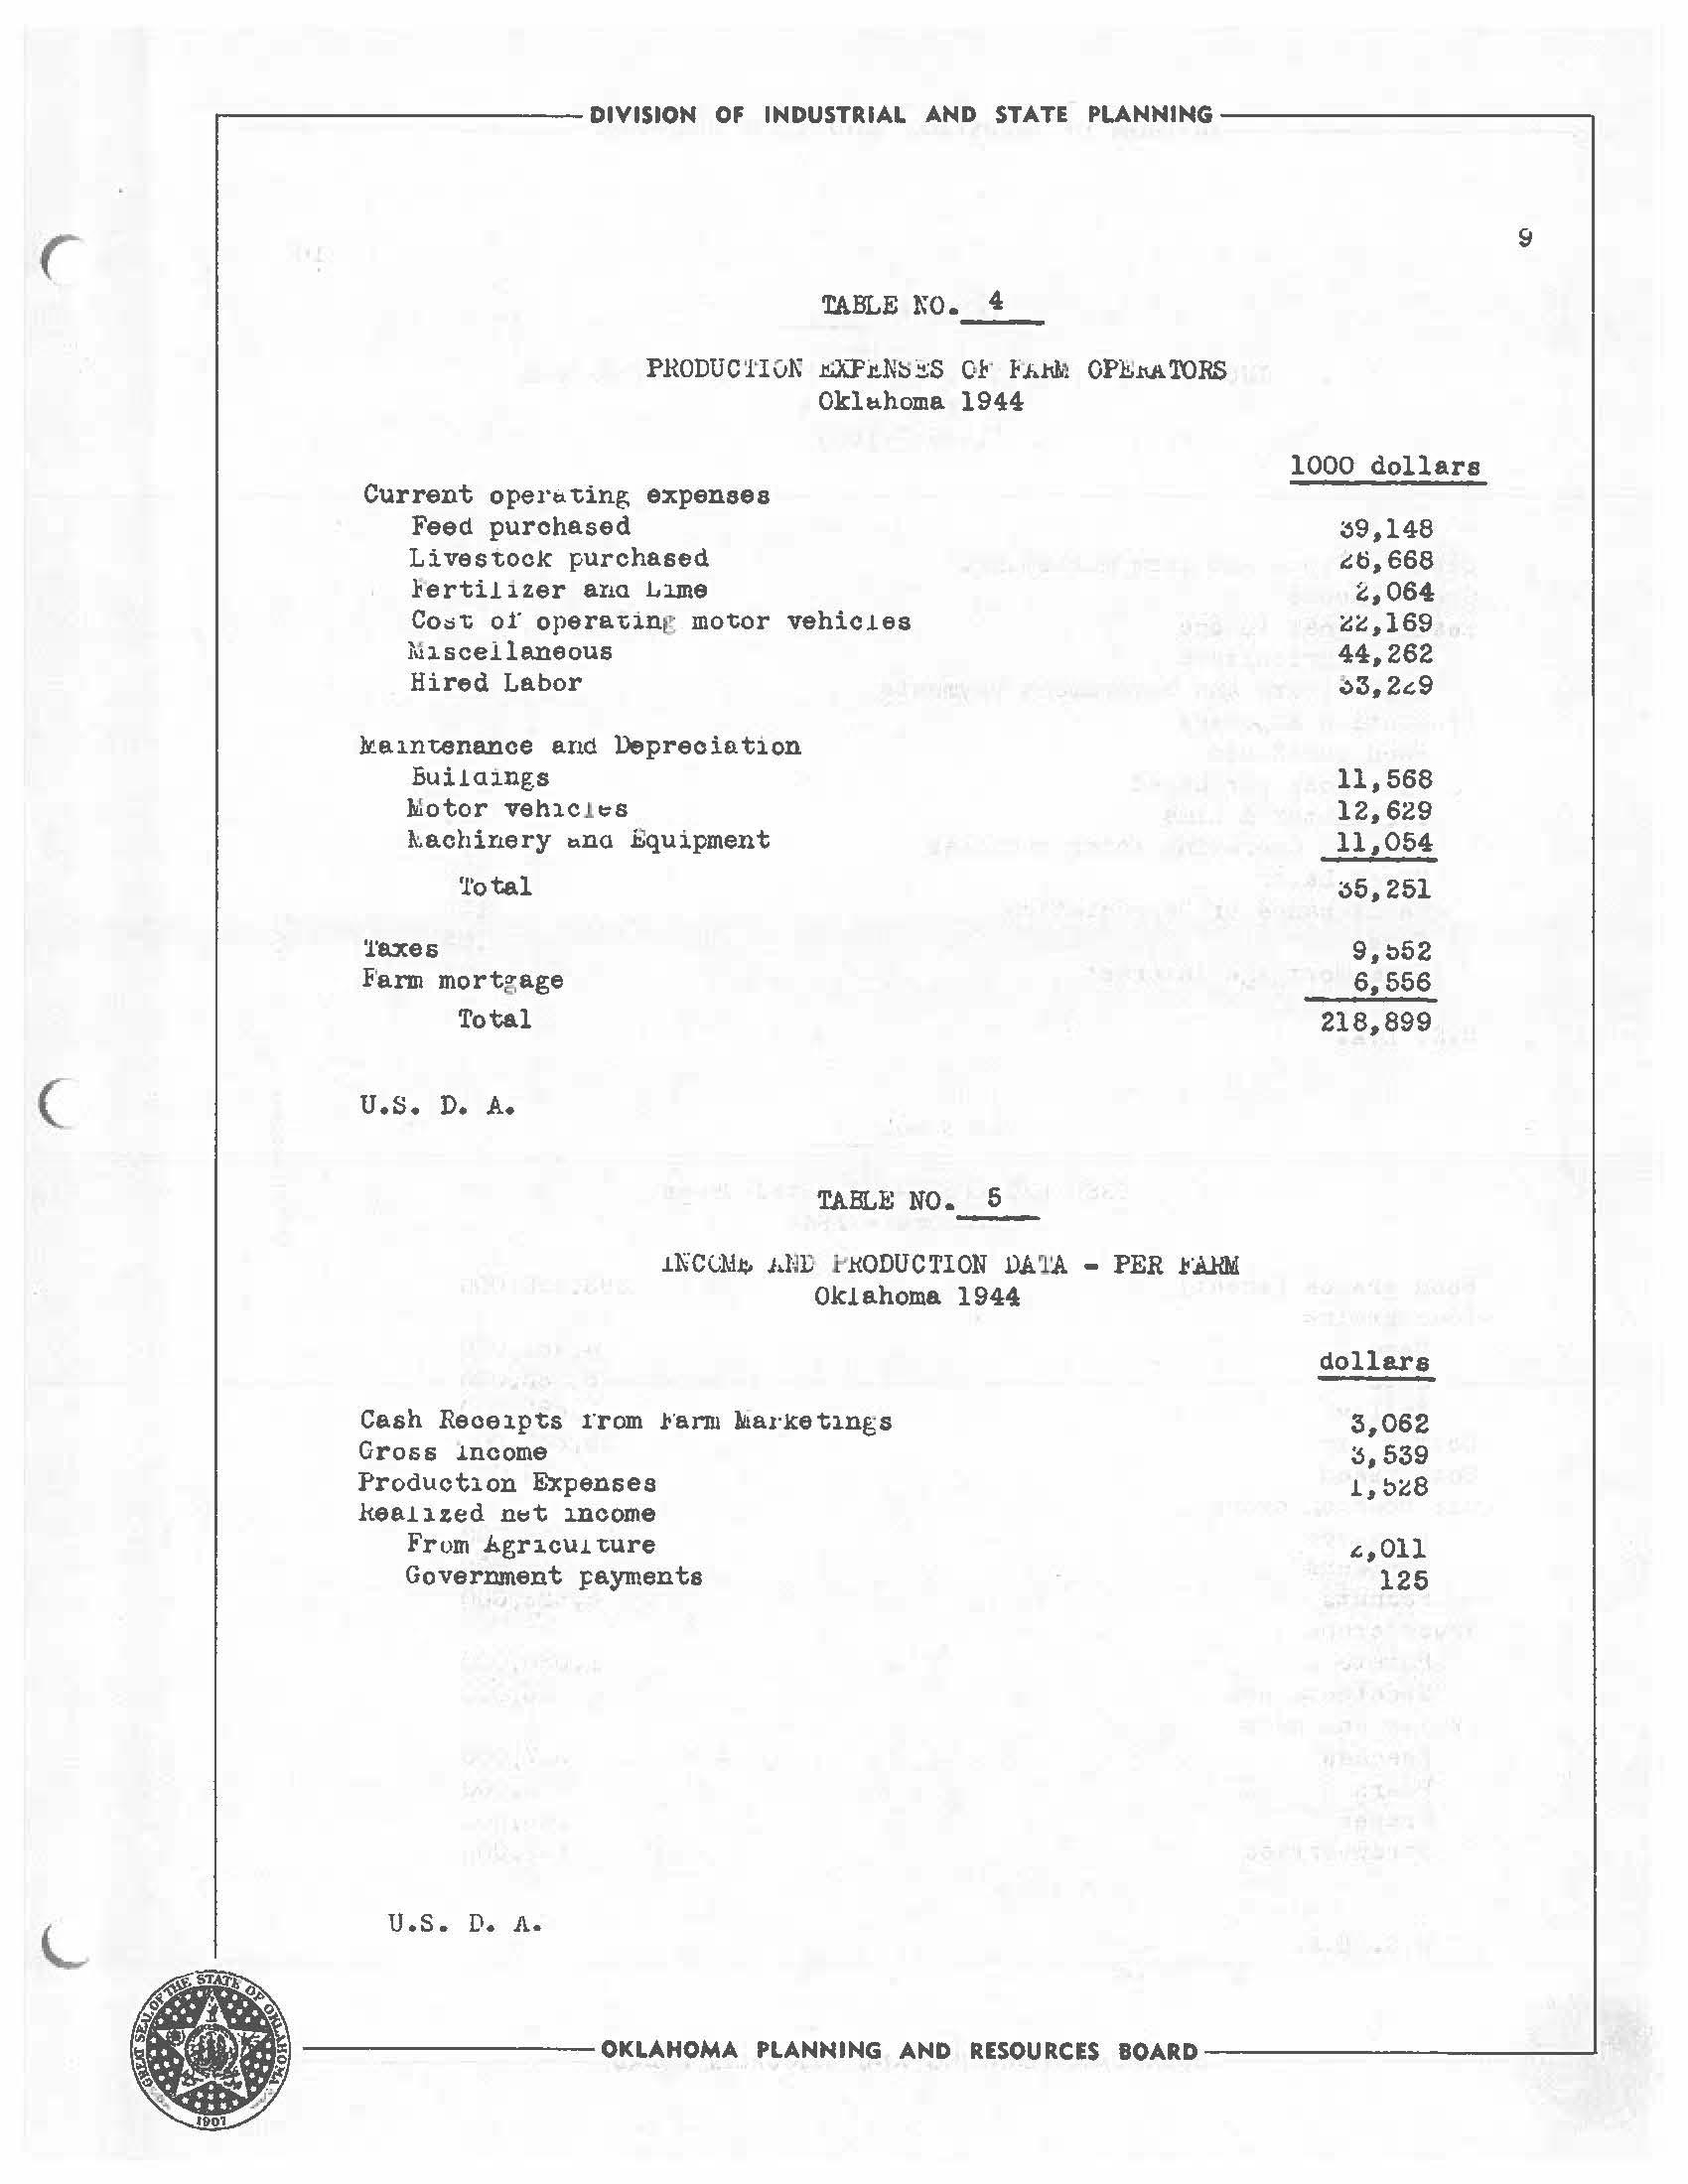
Table No. 4 summarizes the pi oduotion expenses of' farm opera"t;ors in 1944 i'or the stti.te as a whole. Income a.nc1 production on a p--• l'o..tlll oasis 1~ shown 1n '.l.'t1.bl1:1 No. __b_. The rel a tiOll of 1~44 income anu production expenses as co~parec1 to 1939 are given in Table No. 7 •
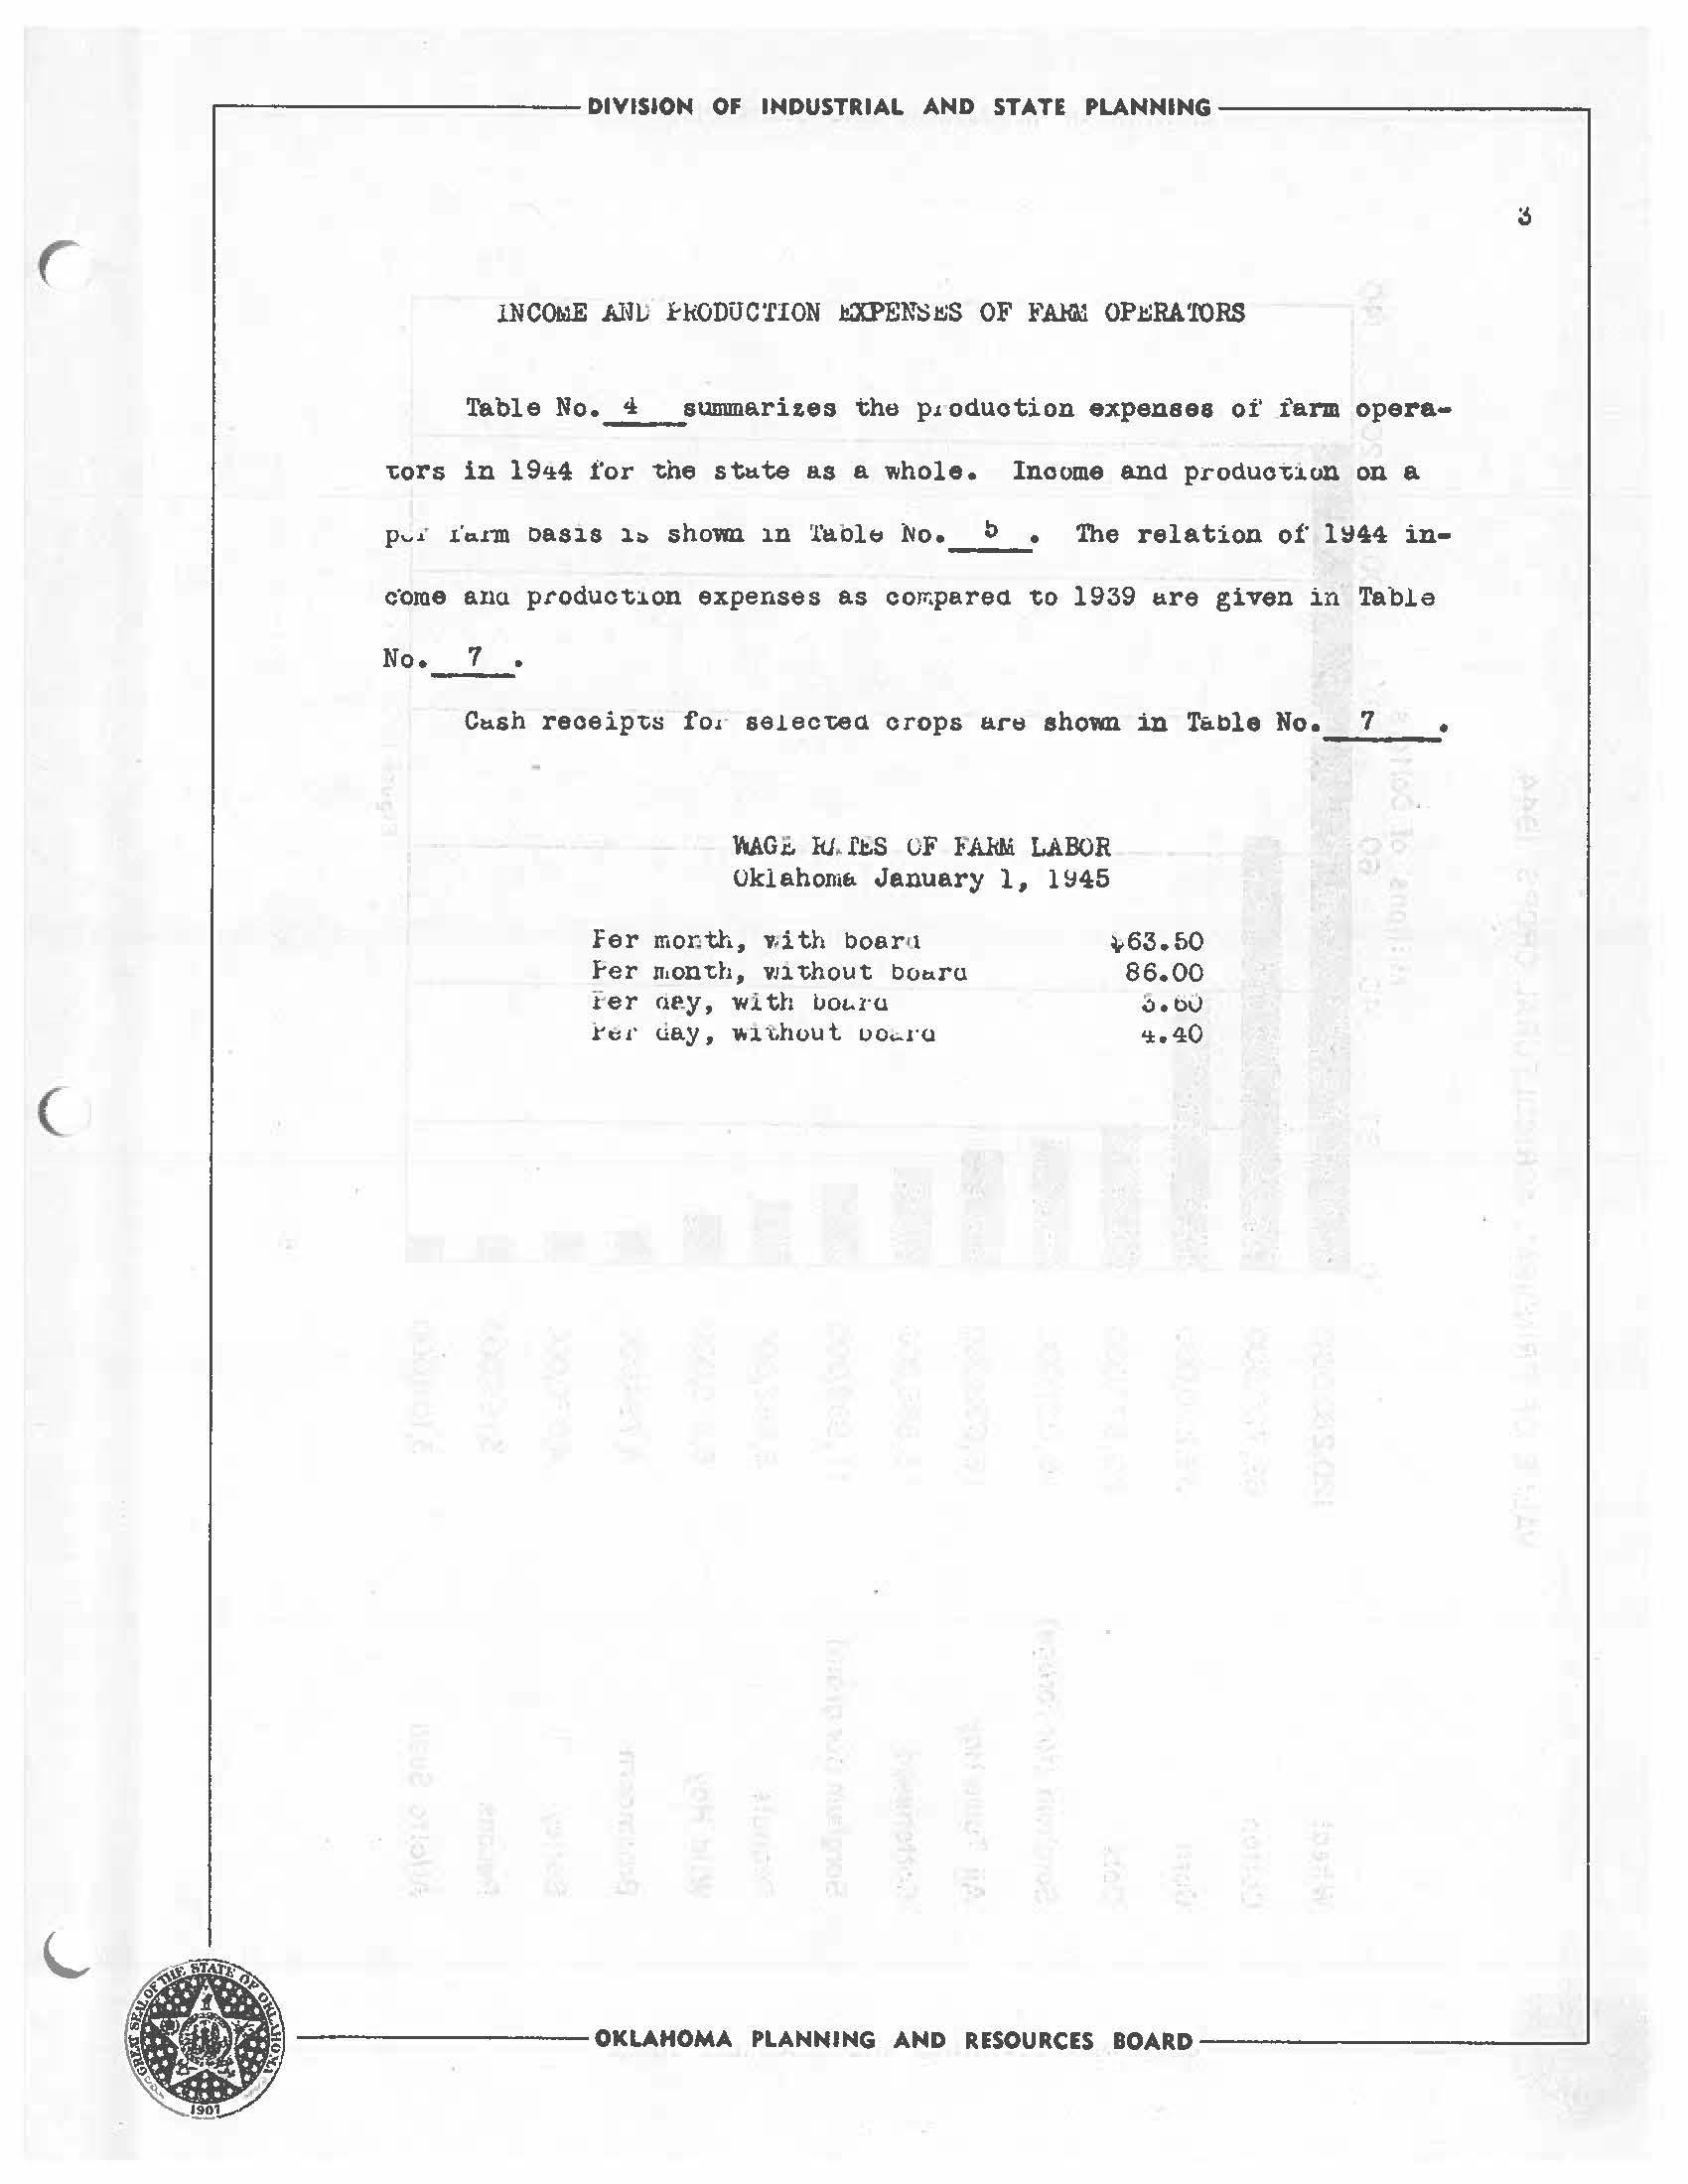
Cto.sh reoeip'ts foi · se1ec'tieC1 orops are shown in Table No. 7 •----
YtAGi. kl , f.t.S OF 1'"A.l& LABOR OklahomEL January 1, 1~45
C .------------ DIVISION OF INDUSTRIAL AND STATE PLANNING-------------.
fer I-er Fer :a:.,r
month, v,i th boaru ~63.60 month, vathout bo11ru 86.00 ue y, with llot.z-<.1 ~ .biJ <lay, \llll. hou t 00.:.l'U 't.40 --- ------OKLAHOMA PLANNING AND RESOURCES BOARD------------'
VALUE OF PRINCIPAL AGRICULTURAL CROPS 1944
• ---
Millions of Ool lors 0 20 40 60 80 100 120 140 Wheat 120,280,000 Cotton 62,720,000 I 0 Corn 39,220,000 0 JIC < ii. z Oats 20,677,000 0 0 z 0 Sorghum (for forage} I8,021,0CX) ,. .,, i;:: z z All Tome Hoy g ! " 16,638P()O C "' z -t " ,, Cottonseed 13,886,000 ,- z 0 SorQhum (for groin} I I ,882,000 z :Ill 0 Ill "' "' 0 Peanuts 8,662,000 C --t n ffl Ill "' Wild Hoy 6,975,(X)O .,, - i;:: 0 z ,, Broomcorn 4, 794{XX) ! lg z - I I " Barley 4,070,0CXJ Pecans 3-166,000 Alfalfa Seed 3,108,000 FiQure I 0 0 0
~r!ature crop harvested for beans, peas, and nuts
b/ December-T~Pr1oe
c/ The 1944 prioe and value fi~ures are preliminary. The valu e s-shown are for the market season - and shoula not be confused with the calendar year incor.ie. The season average prices of wheat 1944 crop include a.n allowance for wiredeeraed loans at average loflll value.
Source: U. s. Departrr~nt of Agriculture.
0 :ii-. r% i .,, z z % G\ z C, ,, Ill .,, 0 C ::,,:, n .., .,, g ::,,:, C, r r-. l ---------Corn Oats Crop ,iheat Barley Hye Sorghum for Grain Sorghum for F o1·ag e · All Tame Hay 1fild ~e.y Broomcorn Unit Bu. Hu. Bu. Bu. Bu. Bu. '.l'ons Tons Tons Tons Tons Cottol"'.seed Cotton Lin~ 1 Soy Be'l.ns !-' Cowoeas Y :Bales-lbs.: Pe~uts
Potatoes
Potatoes Pears Peaches '.irapes l:'ecan.s F'le..xseed Alfalfa Seed
Grass Seed ;-,unt,; Beans Popcorn Sorghum Syrup Value of Above Crops Ru. Bu. Lbs. Bu. Bu. 13u. Bu • Tons Lb~. nu. Bu. Lbs. Lbs. Lbs. Gal.
TOTAL CftOP PP.ODTJGTIOH
OKLA.liO!::tA :.·ield -= : Average A.crflcwe . c / • 0t-~ : per Production : Price~ : Value of g/ Harve s ~.. ' ) . c ~----Acre _ _!____ : {dollars : Production 1,831,000 18.0 : 32,958,000 1.19 $ 39·,220,000 1,451,000 lS.O 27,569,000 .75 : 20,677,000 4,773,000 18.0 : Sb,914,000 1.40 120.,280,000 210,000 19.0: 3,990,000 1.02 4,070,000 152,0UO 10.0 : 1,520,000 1. 0 7 1,626,000 898,000 14.4: 12,915,000 .92 11,882,000 1,145,ooo 1.so= 1,111,000 :b/ 10 .so 1s,02s,ooo 943,ooo 1.41: 1,331,000 ~l;'/ 12.so 16,638,ooo 526,ooo 1.2s: 658,ooo ·b/ 10.60 6,975,ooo 109,000 375.0 s 20,400 :- 235.00 4,794,000 1,500,000 6,000 15,000 231,000 31,000 13,000 54,000 105,000 55,000 18,000 6,000 205.0 8.0 G.O 500.() 65.0 80.0 4.0 1.so: 200.00: 800.00: 42,00: 262,000 53.00 13,886,000 640,000 .156 62,720,000 48,000 2.15 103,000 90,000 : 3.50 : 315,00 0 115,500,000 .075 : 8,662,000 2,015,000 1.35 2,720,000 1,040,000 2.20 2,288,000 96,000 2.00 192,000 286,000 3.40 972,000 3,200 100.00 320,000 18,000,000 .176 3,166,000 216,000 2.63 • 568,000 168,000 : 18.50 3,108,000 2,100 .ooo .048 : 101,000 11,000,000 .165 : 1,185,000 14,400,000 .037 : 533,000 252,000 : 1.40 : 353,000 322,399,000
2,,I
Sweet
Sudan
TABLE NO. l
1dlD""iiA'i:UE 'lrOP YEAR 1~44
or crop year and of the (11 0 < ;;; 0 % 0 ... z 0 C ,., rz C, E "' .,, .z z z G)
TABLE NO._!_
TOTAL C01JiERCIAL TRUCK CROP PRODUCTION AND VALUE FOR YEAR 1044
. ~ .,·~!l-------------------------------------i ~ r e ;tt..:.•· .,5' . ..
OKl.JJIOM.A Yield Average Value of Crop Unit ,Acreage per Production Price Production 0 Harvested acre ~dollars} ~dollars} 0 I I : : : s < Cantaloups Crate 2,400 85 204,000 1.35 275,000 "' z ' I : : : s 0 i s I I : s z Onions s 50 lb. sack: l,500 : 90 : 135 .ooo : 1.40 s 18 9,000 0 > ... .., s : : : : : Comnercial Potatoes I Bushel : 2,800 : 76 210,000 : 1.15 ' 241,0 00 z 0 % : : : : C z . Ill - Spinach (Spring) : 18 lb. ai • : 800 : 175' 140,000 : .58 : 81,000 -t z :D Q : : > > S pi nae h (Fall) 18 lb. Bu. 1,200 180 216,000 - .65 140,000 ,: i : : z C, % :D Strawberries : 24 qt. or. 700 25 18,000 7.50 . 135,000 101 Ill . g : "' ;y -t C: Wateroelona Melon 15,000 235 3,525,000 260.00 : 916,000 > :D -t n : : '" Ill Spinach (Processing) 14,100 1.e "' Ton 25,400 69.50 ; l, 765,000 .,, ID : 0 z > Snap Beans (Processing) Ton : 9,700 1.2 11,600 : 9 0 .00 ; 1,044,000 z :D C, ! z Q }j Price per l,O O'J melons Source: u. s. Department of ~rioulture 0) 0 0 0
TABLE NO. 3
r r-,.. l
1930 1935 1£140 1941 1942 1943 1944 Cotton Li!,lt 37,149 2~.926 35,687 48,830 56,341 40,391 55,832 0 0 Cot·..,on Seed 5,904 5,251 4,507 10,149 10,094 5,080 6,973 :Ill: ,- Tote.l Cotton 42,953 35,177 40,194 58,979 66,435 45,471 62,805 0 ::c z 0 Y1he6.t 15, 6 34 21,439 30, 8 72 37,472 54,162 35,388 83,590 0 ... .,, Other Cro p s l 7,737 15,339 18,941 23,979 32,566 40,745 51,577 ,- Total Crops 76,5r.4 71,955 90,007 120,430 155,985 121,636 197,922 z 0 % C X "' :.:ilk 21,332 20,615 23,076 30,119 38,54;; 49,075 52,767 ... i :,,:, " Cattle &: Calves 20,9!::l 35,757 46,209 57,871 84,716 99,033 92,732 Chickens &: Btgs 13,856 9,762 1 0 , $'?. 2 16,272 31,410 48,980 45,069 ,:z Eofs l~,5b5 8,020 11,~81 18,928 35,069 54,651 38,840 · o z Other Livestock 1,534 2,456 7.,479 12,692 8,569 10,155 8,116 0 :,,:, "' "' 0 Tot~l Livestock and C ... 111 Livestock products 70,198 76,610 99,057 137,882 198,307 198,307 237,524 "' n "' Government Fa.ymen ts G7, 520 25,638 21,035 2-6,803 15,529 21,.030 'O 11;1 • z 0 Grand Total 146,722 176,085 214,702 279,347 381,095 399,059 456,.526 % :,,:, z C, "
OKL.AliU':.A CASE FAm.:l INCO..LE BY YE.A.RS A.~D SELECTED cma,:oDITIFS (Thousands or dollars)
u.s.D.A.
PERCENTAGE DISTRIBUTION OF AGRICULTURAL CASH FARM INCOME
OKLAHOMA 1944 Fioure 2.
~--------- DIVISION OF INDUSTRIAL AND STATE PLANNING ---------~ 8
\ --------OKLAHOMA PLAMMIHG AMO RESOURCES BOARD--------- ----' 0 0 0
TABLE KO .. 4
P.lWDUC'l'IvN ~i!.N::i:!:S oi,· FJ..W. OPl!;MTORS Okh.homa 1944
Current operti. "ting expenses
Feed purohased
Livestock purchased
}ertil1zer ana LlBle
Co.;i; or opera.1;i.n1;, motor vehic.tes
Misceila.neous
Hired Labor
lta1ntenanoe and Depreoia. tion
Eui.to.ings
Motor veh1c .t ~s
kacbinery ..no .Equipment
'.!'otal
mortg age
TABLE NO. 5
J,.ND i'HODUCTION l)Al'.A - PER !':A.HM Oklahoma 1944
Cash Receipts rrom ,t,·arm J.iia1·1eet1nf!;s
income
n~t income
r C l.. ,____________ DIVISION OF INDUSTRIAL AND STATE PLAMMIHG ------------.
'l'axes
Total U.S. D. A.
F'e.rm
.tKCCM.i:,
Gross
Production
kea.t1zed
From
Government
U.S. D. A. 1000 dollars ~9,148 ~ti,668 ~,064 .::~.,169 44.,262 ~3.,2G9 11,568 12.,629 11.,054 ;)5.,251 9,~52 6.,556 218.,899 dollars 3.,062 ~,539 1., :,~8 .:;.,OU 125 OKLAHOMA PLANNING AMD RESOURCES BOARD------------'
Expenses
Agr1cu11;ure
payments
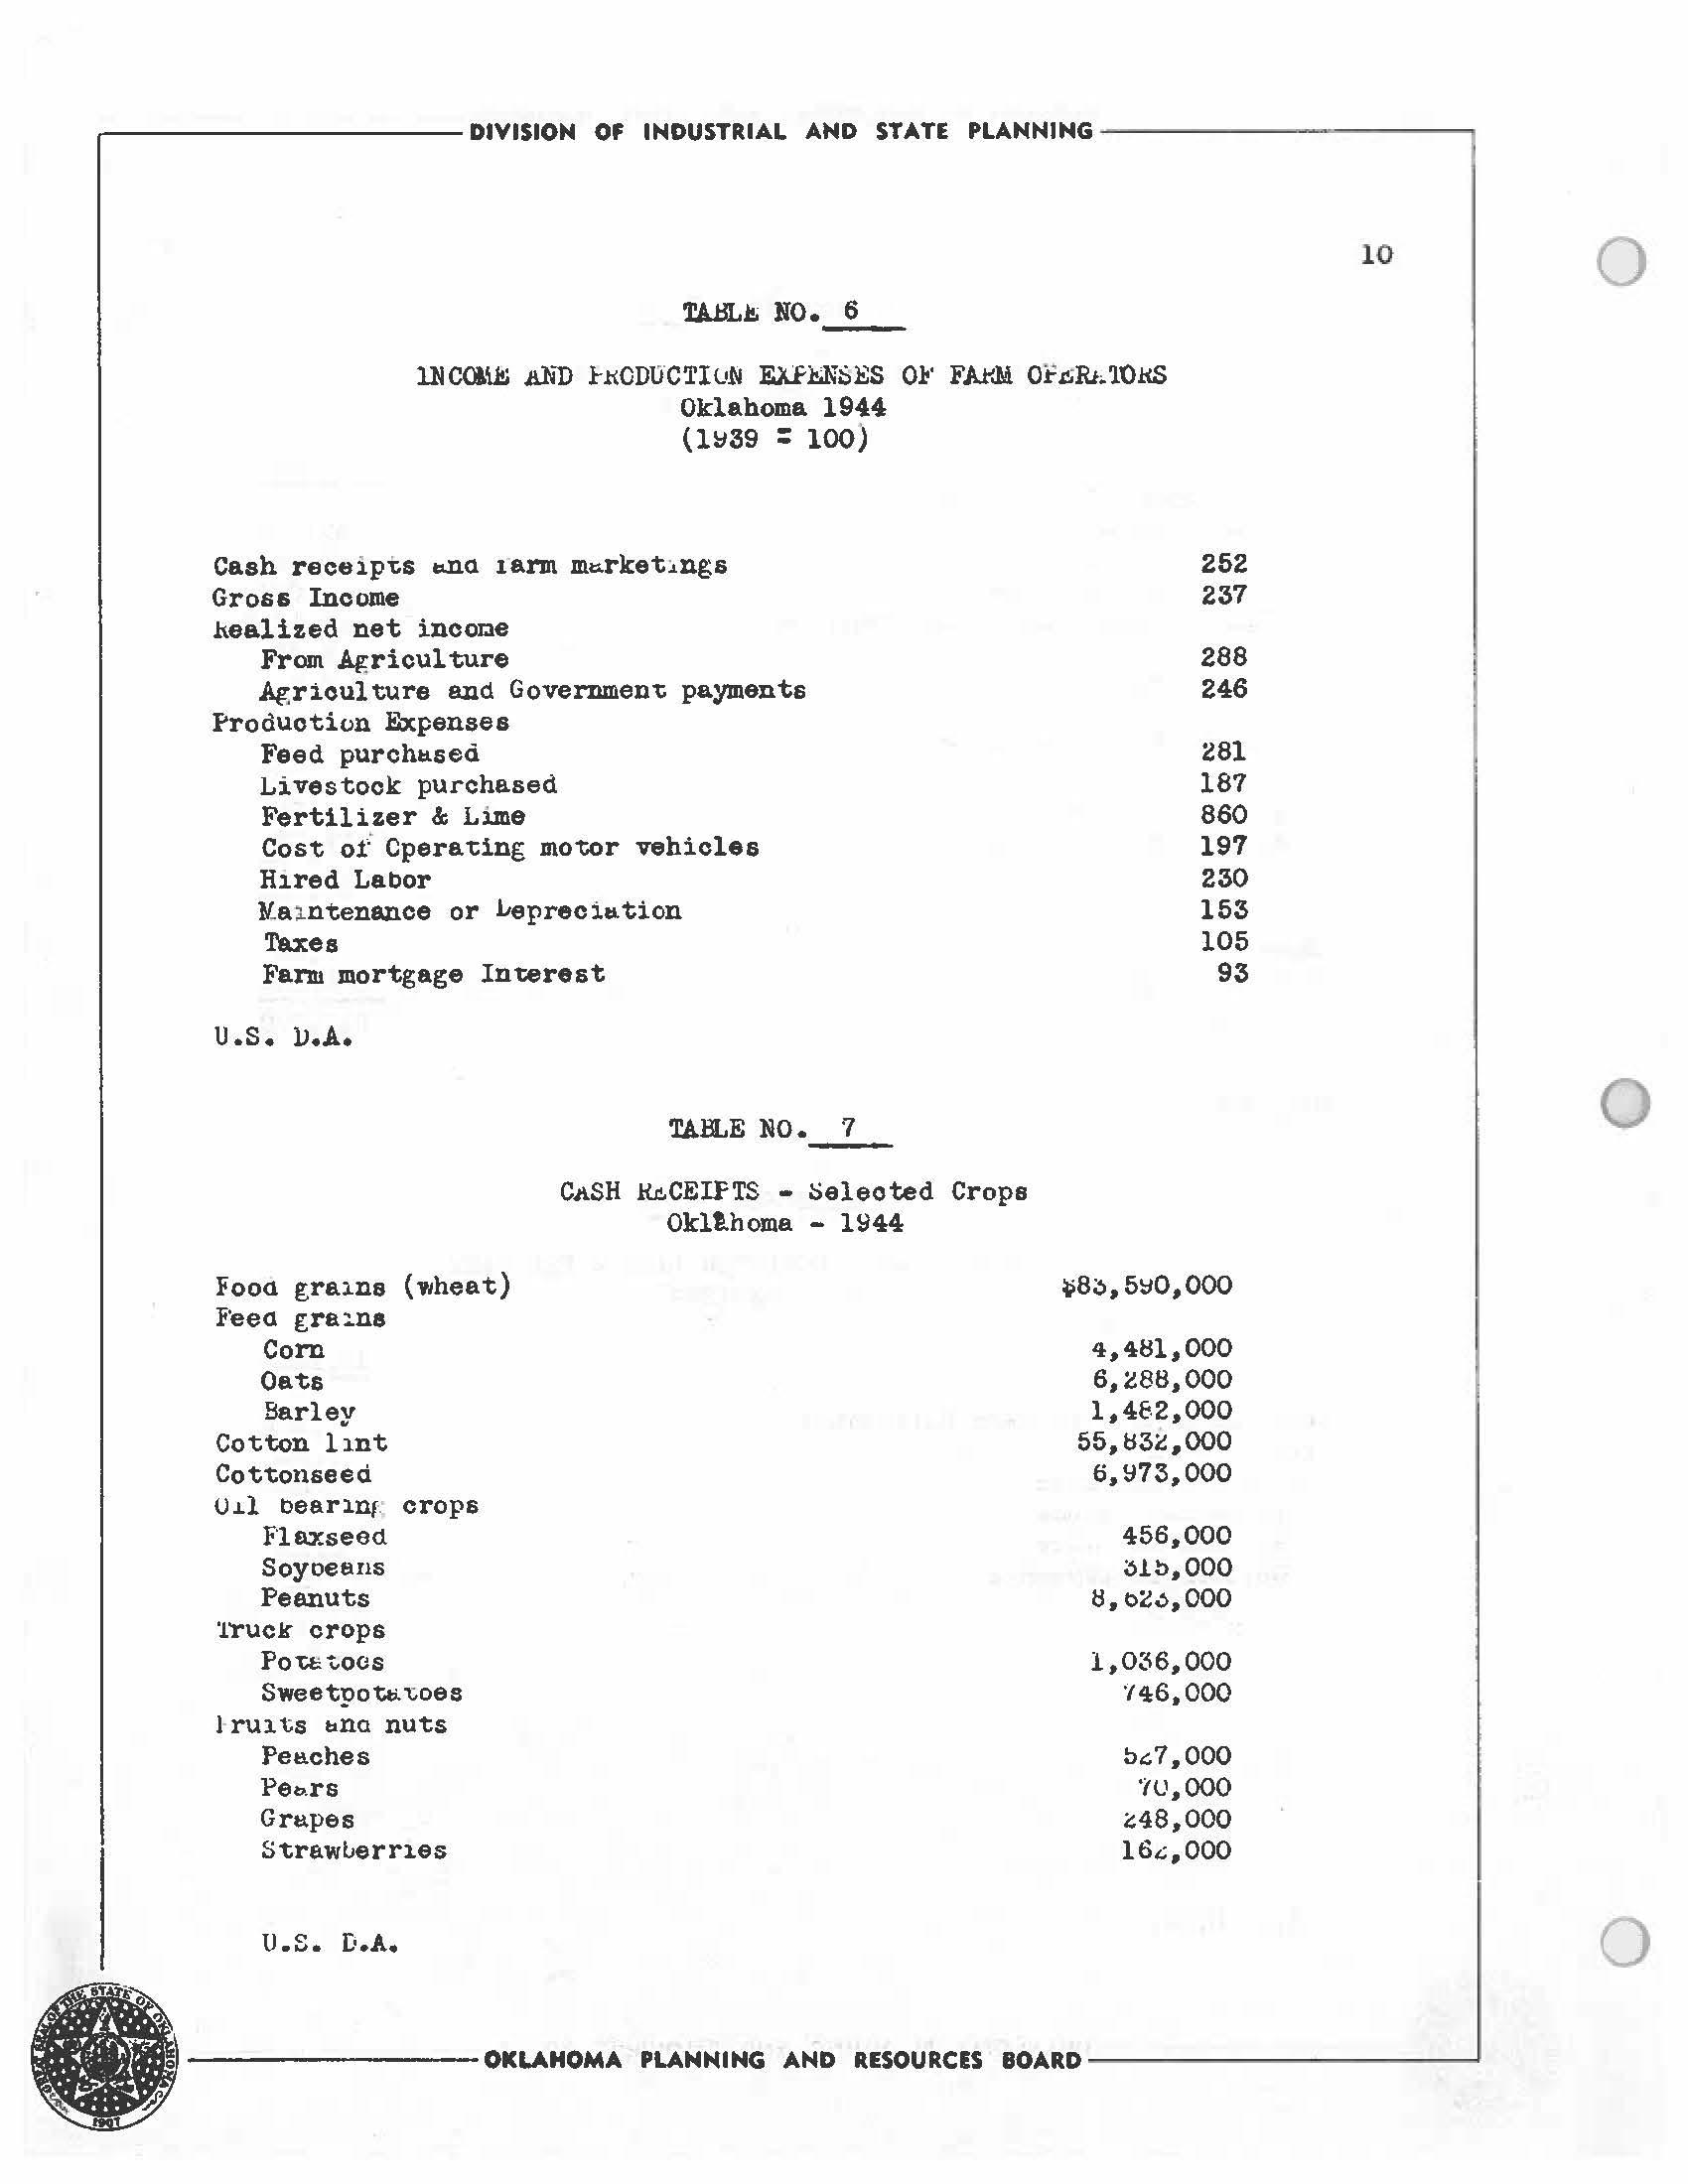
lNmU!i .a,hl) h0DUCTiu.N EA:fhN~li:S 01'' FA.t'.M 0F.c;Rt '1O.l<S Oklahoma. 1944 {1~39 : 100)
Ca.sh rectiipts ~a 1ann m~rket~ngs
Gross lncOllle
healized net incOL1e From Agriculture
Agriculture and Governmen't payments
Production Expenses
Feed purch1:1.sed
Livestock purchased
Fertilizer & Lime
Cost of Cpera'ting motor vehicles
Hired Labor
Y-a i ntenance or ~epreci1:1.tion
Taxes
Fann mortgage Interest
U.S. lJ.A.
TABLE NO. 7 CaSH iu.CEIFTS - l:)eleoted Crops
- 1~44
Fooa grains (~heat)
F'eea gra:.na
Barley
Cotton lint
Cottonseed
0.Ll bearlllf crops
Flaxseed. Soyoeans
Peanuts
Truck crops
Pou;.t.oos
Sweetpott;.,:,oes
l· nu ts tina nu ts
Pet1.ches
..----------- DIVISION OF INDUSTRIAL AND STATE PLANNING ------------, TAJ:n...l!. NO.~
Corn Oats
Peo.rs
Strawuerr1.es U.S.
Grt.1.pes
D.A.
Okllhoma
252 237 288 246 281 187 860 197 230 153 105 93 4,481,000 6,288,000 1,4£--2,000 55,1:$3G,.000 6,~n3,ooo 456,000 ~lb,000 I:!, t:>2~,000 1,036,000 '/4:6,000 b(.7,000 ·w,ooo ~48,000 16t.:,OOO 10 •---------OKLAHOMA PLANNING AND RESOURCES
------------' 0 0 0
BOARD
LAND UTIL IZJ..'1'10N
In 1~40 the i.enci in f'&.nns cor 1pri:.ea '/8. 5ic or ·che total. area of the state. Correspon.o:.. in;>: i'i f ures l'or 1~10 auc. 19~5 were 65;~ a1id 69.5J•• The counties Yii i;h tha lE,rt.:,est r,.ercentat, es of .11...nd in 1'tsrn,s ( riture t-•v.
3 ) ar!:l loca. te;a me.illly ir. the we,,tern h1:1.l f' of tt,e st~te ana in a majority of the:;e counties ti.e rerceni; of' the lt:.nd 1n !'t.rms, exceeds 85~<• 1.() the (Juuchi t&. Lountail 1 e.ree. ir.. southea. t C..klt.hon:a wb~ru the lowest percenta<C,e of .1an<i Ha u..rrns occurs, cr.e le.nd i:, roubh t!..Ild timbered with the tirr. t.i er coin, unies hi:-vir.~ larre hold1np;. lr, o-;;her £,rei;.s of the state cor.,pt:inhs t nu inc.:i.v1cuo.ls hi.we a.cv,uii-ed lar€,_e holdine,s in conr,ecti1,n v u;h oil a a cas srecuJ.E,:c1c,u thereby rer,, ovin[ the lE.1.d f·rom farming. hl so rauch h.110 is held uy lndihl'ls anc is not i11c .l\Jctea in 1·a.rru la.no. J>aoi-c1one. J non-i'til'r:, a.nus it.c.1.uc:e tl',&t for m1.11 uu y rest.rvatiol"s, stnte ere. m,tione.l parks, cii;ies, roi,.o:, flllc. hifhv.t,.ys.
"!'ht: pro p ortion 01· le.no in f1::.rms (.rl t \.lre 11.1.J.2..__) 1·0,· coun't1.es ranges rrom a lo'\\ 01' ~6.;;, in La•..:in.er countJ· 'to hith l>l practically lOO'i~ in Jefrerscn count~••
'lhe percentEt._e c1' le.u c, uti.lizea. e.s rarms 1.n a given e.ros. 1s e. good index 01 tt.e quaJ 11.,y ol' the lti.nCI v.na 1c.01c1::. tes to sor.e extent the abi J.i ty c;u: the 1 e..nners to muke ex p eno1 c1.11 es l'or lt.bor, feed, 1·erti J. izer, ml-lcl:1.nery, 1nt:ere:,t t.tc.
J. stuay of .t"l E, ures Ico.~ana 5 sr.o~s tht,,t 'the location of the lart1,e,n: size 1arms do nv 't necesshri l y correspona 1n location \1ti'th those farms havin[ the hl c her £.vertt~e ve.1ue t:i t'oT · lrul<ls 6Hct buildill f S per acre.
'l'he nverv.1 e size ol' i'i.nn.:: Ly coun;; ies is sl.o\'\u in l•1r,ure to. 5 •
( L r------------ DIVISION OF INDUSTRIAL AND STATE PLAMMING -----------....... 11
---------OKLAHOMA PLANNING AND RESOURCES BOARD------------'
1'he area of the sme.ller 1'arms is ruunct in the eastern p:.rt oI' "the stfl"{;8 along; "the boraer. 'l'he 16.l"Lest farJJ1s 6.re located in the panhll.llctle area where v;hes.t f,row1n t; 1s "tt.e L1ost iD1portttt crop.
-----------DIVISION OF INDUSTRIAL AND STATE PLANNING------------,
12 • · - --------OKLAHOMA 'PLANNING AND RESOURCES BOARD-------0 0 0
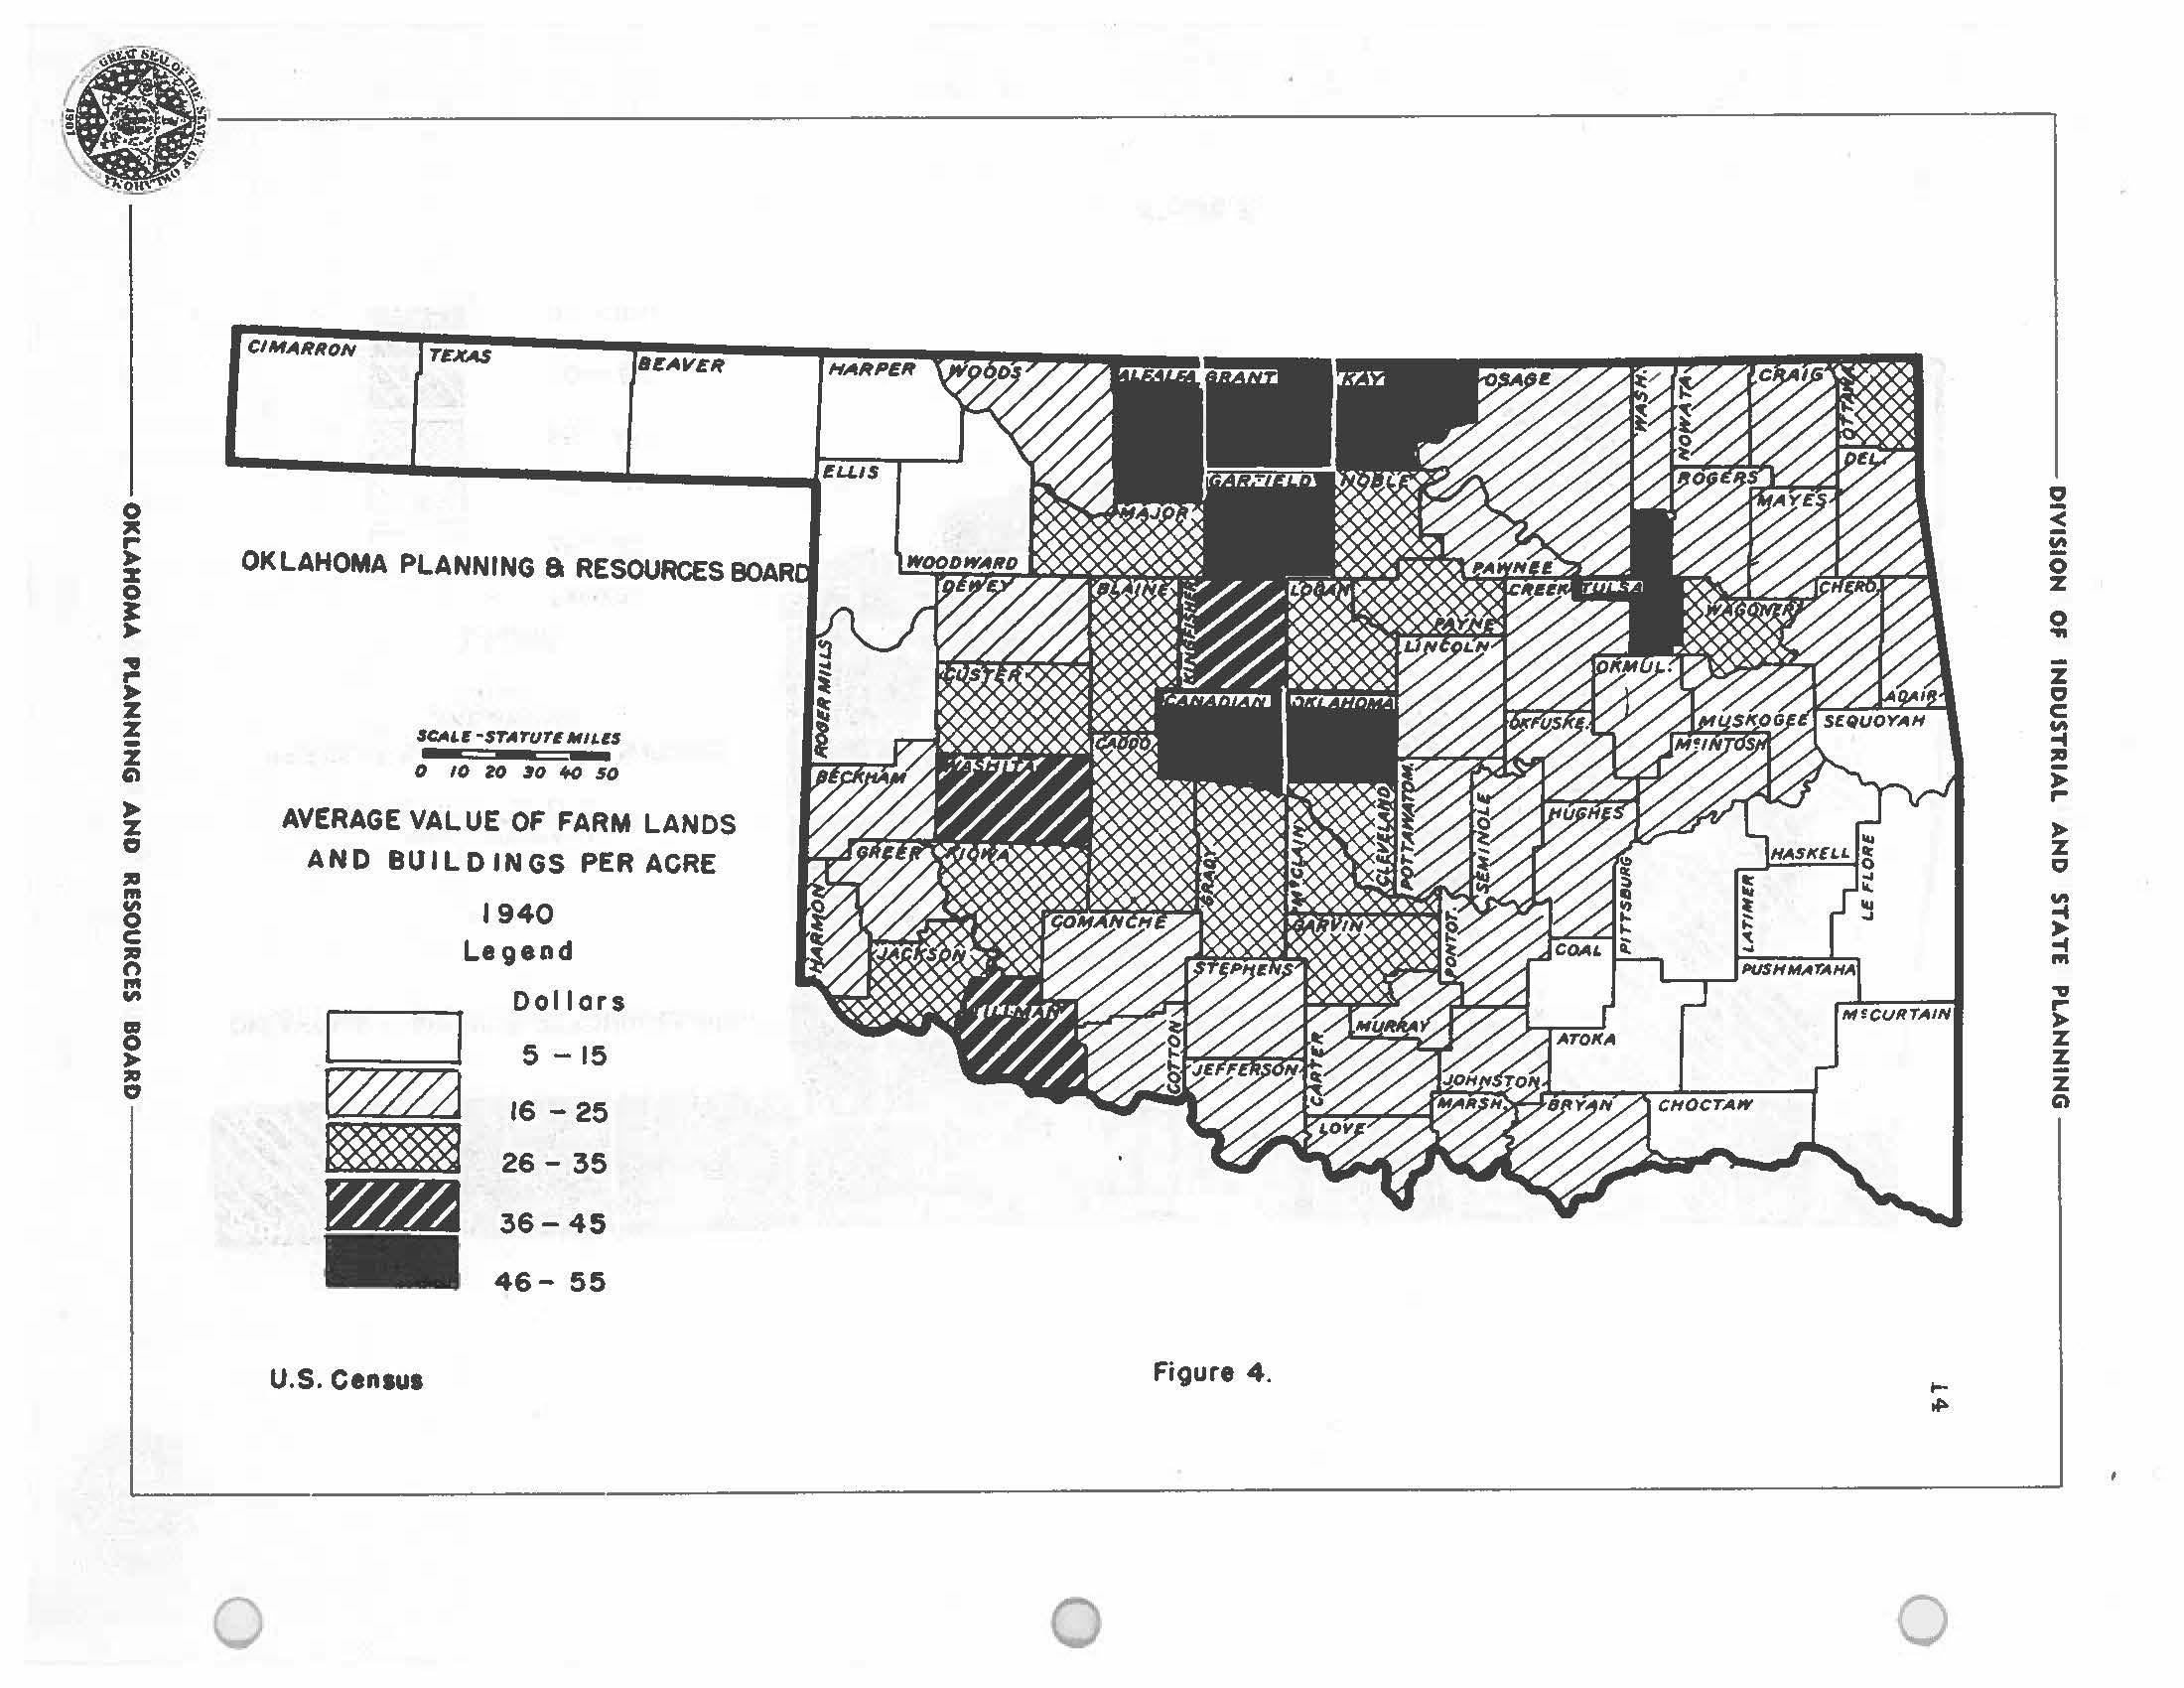
i ;. ' ~ ~1 .l'i<otl"0 llll: :z i ,. ,z % i G'I % C, ,u Ill g "' .,,. Ill 0 :!It 0 CIMARRON TEXAS 'BEAVER • I ' ,rus" OKLAHOMA PLANNING 8 RESOURCES BOARI 0 .SC.-Ll!' •$TArUTE MILi'$ --0 ,o ,o ~o +o so AVERAGE VALUE OF FARM LANDS AND BUILDINGS PER ACRE 1940 Legead Doi I ors I I 5 -15 w~ 16 - 25 26- 35 - 36-45 - 46- 55 U.S. Census
4. 0 I,,. 0 C, < 0 z z 0 C ,u ,z 0 .,,. -( "' 'V z !: z G'I
Figure
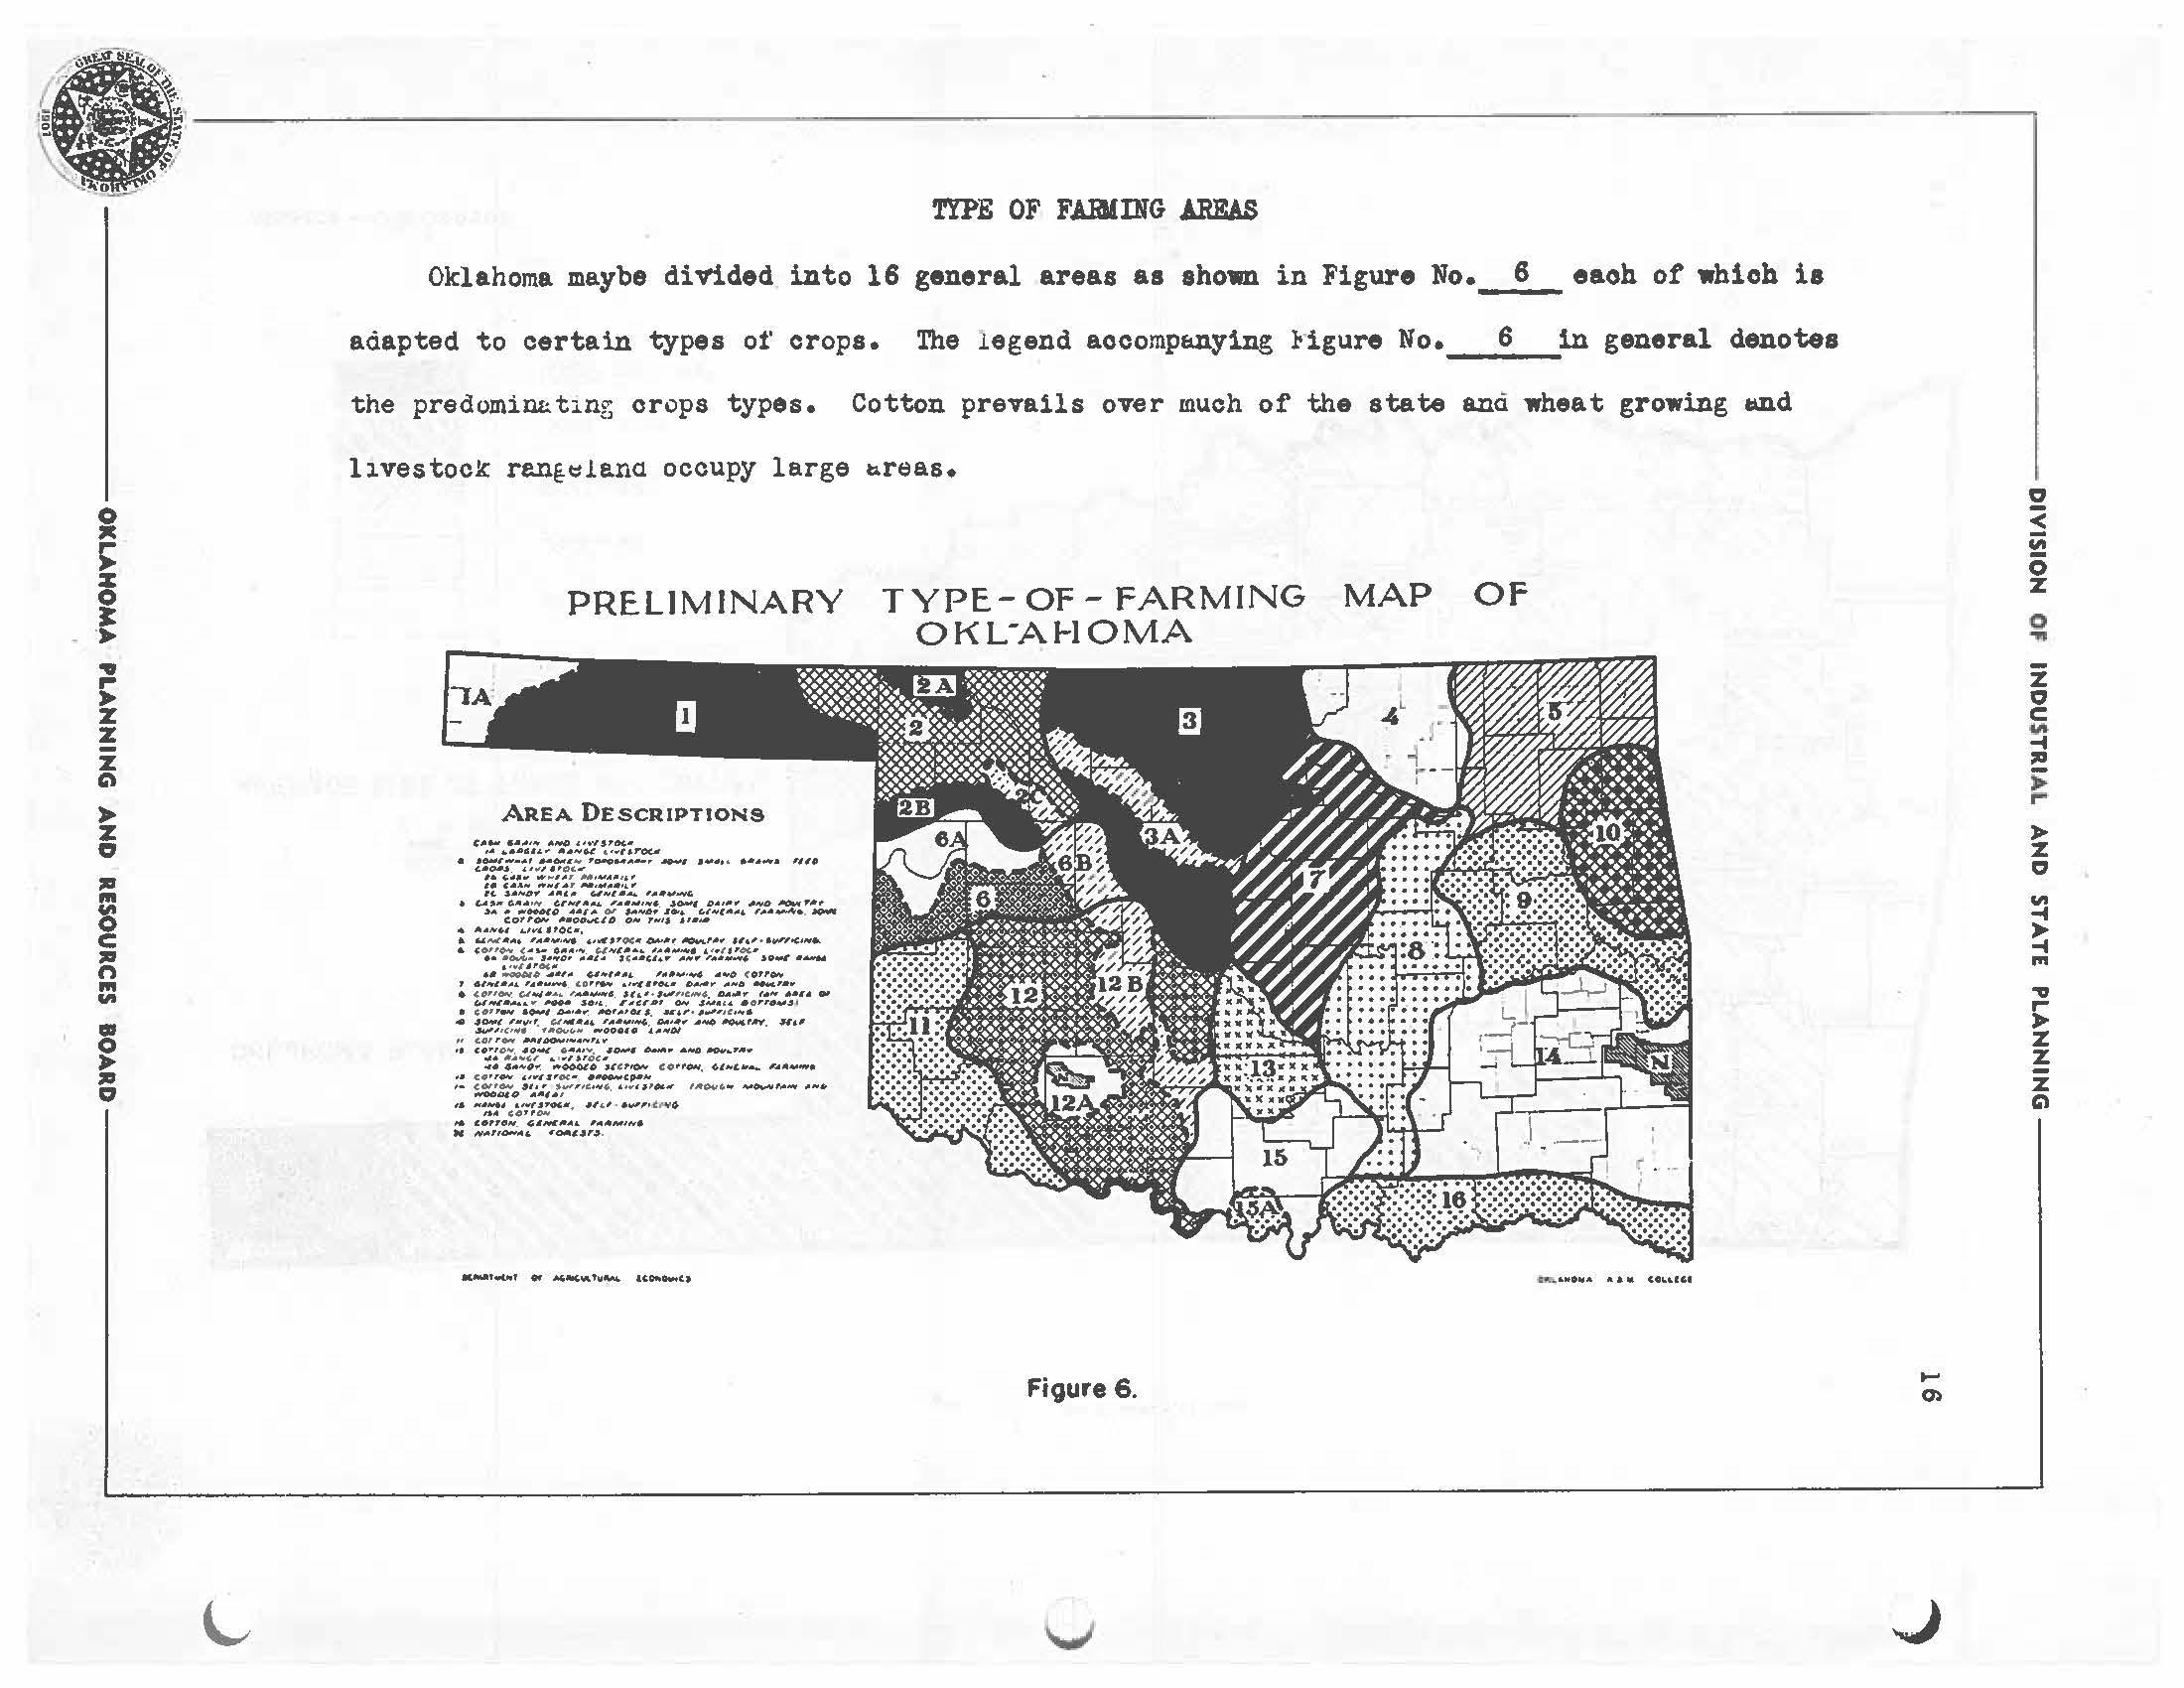
TYPE OF FABIING AREAS
Oklahoma maybe dirlded into 16 general areas as shoe in Figure No.__!__eaoh ot which is adapted to certain types 01' crops. The 1egend aocomp&.nying 1-igure No. 6 1n general denotes the predomiw.:.t1ng crops types. Cotton prevails over much of the state an<i wheat growing IID.d livestock re.n~~lana occupy large &raas •
-n'n~~..., ;: !; ...,.,.,_..,~-,, ___ ~--------- --, ::! 0 z 0 .f ... ,.. z z z " z " :Ill Ill 0 C: "' 1111 g :Ill "
AREA DESCRIPTIONS '"::' ~~-:. /•":f.!V~~~:TOu . :~1il~If{~~ii~-:.:: ,~...···-· t "°'"' Cl-•••..., G-r-•""'- ,,..,..,,.,._ .J-« D•••• - "'°"""~""' - ••....," •• 0,, ,,__, ""'"'··· •• __. Cr:,ttt,,,,,, -oo.,t,,lt, - 1,1•"' A•NN ._,"41POC•, : ~.,~:...··,:-::i::: /·~!~:'..'".. o;;::,:::.~.~~-:··.,,,~·.... •• •-~ 11••0• ••1.. r<••c1• .- ,.,,,,, ,.,.,...,.. ao,-1 ••• ""''"""• ,,.,,,.,,,..,. """' , .,,..,., , ,,1r1 '··,••,... ,""''~· ,,_,. ,.,..,, _,•• • ,.,,-. w w•,.. __ ,_ '" • · ,.,,,,,,,,,.,.___ ,..Y ,.,,, ••r• ., w-- .. .,.s.,, . ,,,,,••.,..,,., •••,,_., , • c••- ,...., ,,,,..._ _,,,.;0.,,,1 _,, f::j,/::-'. ,_ro..,~:••-~:-:~:..!:.t" ~,...... Hir ,. c.., , _ , __,.,.,.,I' •• '~!o,."";,.~"'",.- : ::~~,:- - •- -.,.,,.., o1• ,,,,.,.,,.._ ""'OOOI'• ,,cr,o,.. co ,,..,.. ~,,.,,_ ,..,.,.._, •• co••- ,,.,.,,., • • •-c,,.,., •• <.6'•- ,II•, ,_,,C,N 6, " '"' , _, IAO.,lf, "" -..,...,,_..,. ••• -•o ,.,.,,,,., ,, .,..=, ,:,~:..,,..,,,.,, .,,,...,,,, t,,,.,o .. ,..,,.,., ,;.._,..,,.,. ,_,,,_,,,,, N _,,__ OIIIIC,IT,I __ ,_,,,, ,,,.._,"''"¥4 U~11¥tU TYPE-OF- FARMING OKL-AHOMA
6. V MAP OF .... 0) J " < iii 0 z 0 ... z " C ,, ,.. :z ic, .,, -t '" 'V ,.. z z z "
PRELJMINARY
Figure
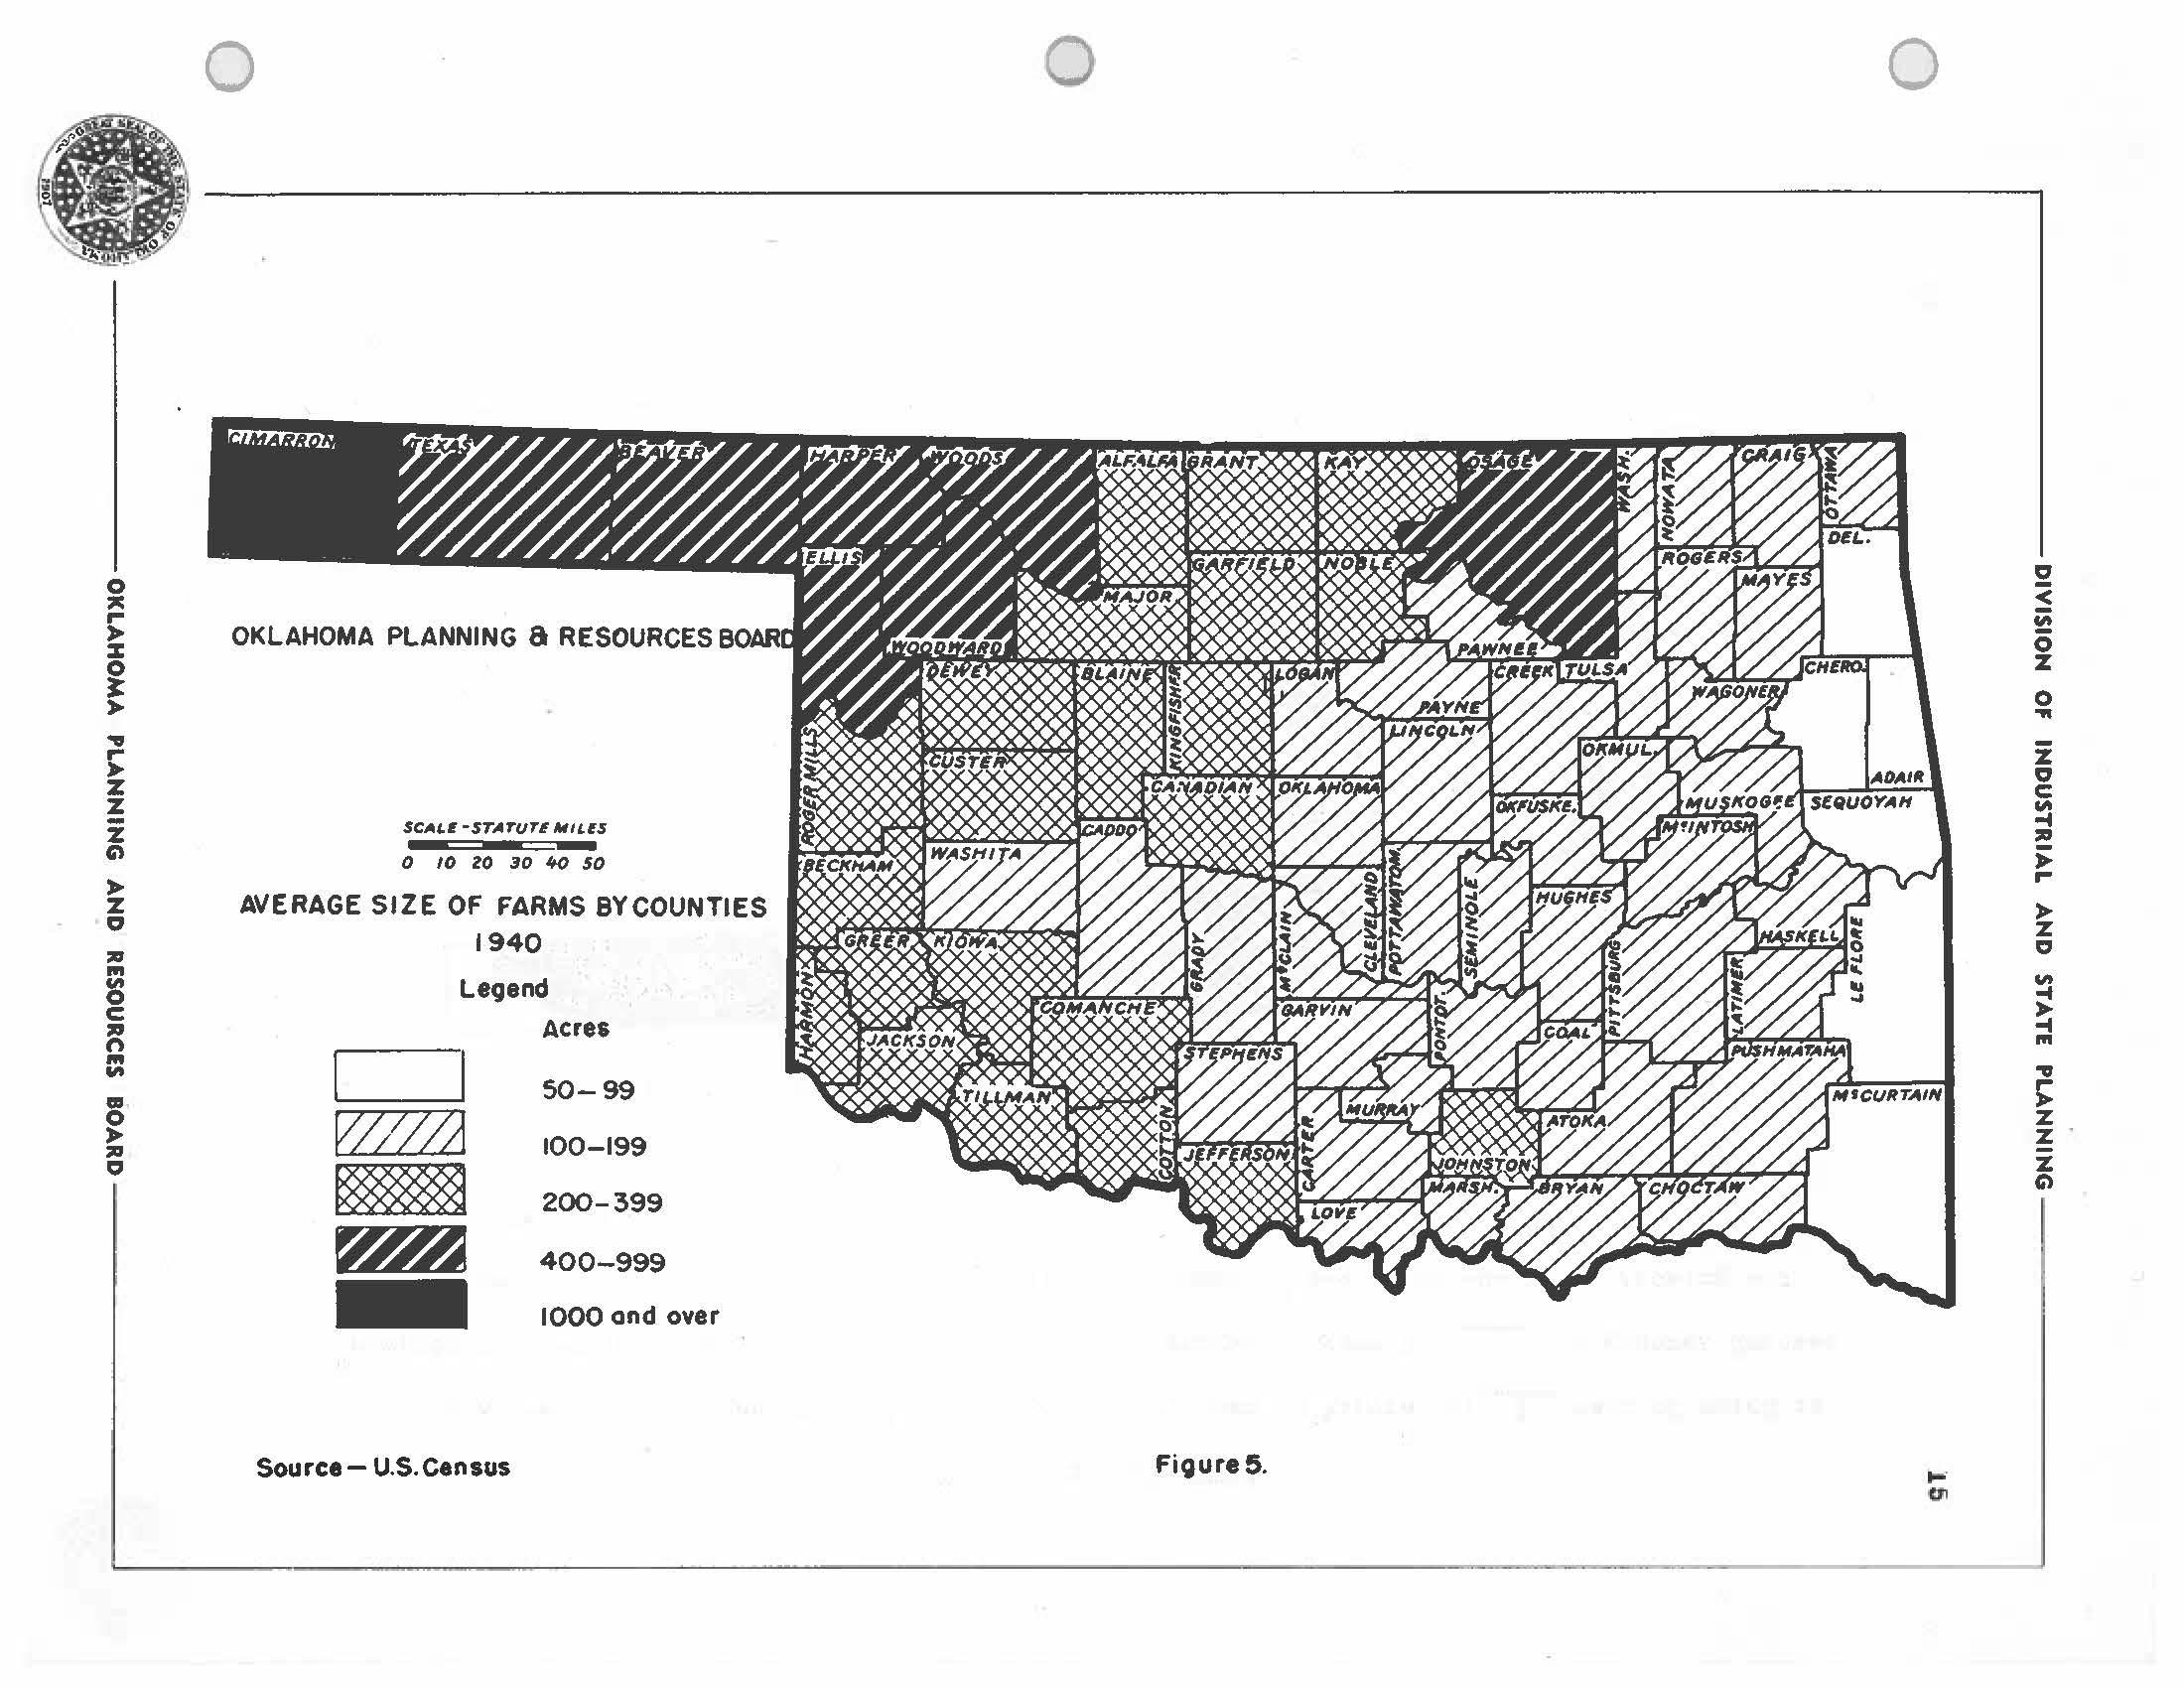
0 0 ,-: rOKLAHOMA PLANNING & RESOURCES BOAR : 0 .. ,% % z SCAill-STATUTE MIU/S w Gl 0 10 zo 30 +o so AVERAGE SIZE OF FARMS BYCOUNTIES % 0 1940 ,, ffl Legend C ACr86 ,, n ffl I I .,. 50-99 a, V/Z0l 0 100-199 ,, ICII ™ 200 - 399 - 400-999 - 1000 and over Source- U.S.Census 0 Fioure5. 0 .... c,, ICII 3 .,. 0 % 0 ... i ICII C ,, rz ICII .,. -f -t ffl .. z z z Gl
Land in Oklahoma is used prl.noipr.lly ror pt.sture ta.nu ou.1.tivatee1 orops. A limited area. 01· rou g h, broken H,nd in the southea;:Jtern p"'-rt of the state is sui t11ble 1'or use as a commerci&.l forest. Post timber can be grown on deep san<1y soi.LS in oen"tnt.l and eastern Oklahoma. and on many bottom lands where 1·requen't overilow is a serious hazard in the production of cultiVb.'ted orops.
Present Condi'tions
intermingling or shallow and deep soils is favorable for the production 01· lives"toc.k in many parts 01· Oklahoma beoause "the areas of shallow soil can be used only fo r pasture. '!he acreage of land in Oklahoma which is used for pasture is about twice the area used for cultivta.ted crops. The ratio between the lb.nd t.rea suitable for crvps and the acreage which should be used f"or €;razing will have an important ini'1uenoe on the "type or l'&>rmi ng which is folloY.ed on a particular tract of land. lµ some areai; smal l grain or oot"ton is pb.nted on a. hil!;h peroentag e 01' the h.nd. b.ll<1 the n.&.jor po1·tion 01· the farm inoome is derived from "these crops. In other t.t.rea.s, a high percentage oi' the sale of Jivestock or livestooK products.
Fe.rm experience ht.t.s been largely responsible for the determination or cro p lidt.\pte.tion in dit'f'eren"t ptt.rts or the state. Soil depleting crops ma1ee up a hi g h percen~g e of the crop acreage un<i very little c o nsideration ht1s been g ive.i to the problem ol' mti.intuininE; soil fert1. Li i;y. '!'his is one or the i n,por"tant problems which must be solvea ou a l -i h pe roenta e 0 1 th e cu ! tin "te d 1.wid or prori tao le crop yields
( L r----------- DIVISION OF INDUSTRIAL AND STATE PLANNING------------,
17
Lr. J. J. Harper, Soi l s Dept. A & M College •--------- OKLAHOMA PLANNING AND RESOURCES BOARD ·--~--------__J 19 01
will not oe produoed auring the nex-c generation or nu-ming. Poor soils m~nagement has resu1ted in serious de.mt1.ge to a l~rge acreage of cu.:. tivatea 1and in central and southet1.stern Okl1a.homa 1·roin soil erosion. t,~any or "Ghese so1ls were shallow under virgin conditions and crop production declined rapid!~ from to. smt1.lJ. loss or surface soil. Al though 1;hese soils oan be plantea to 6 rass, incv1lie frolli these soils will always be low as comparea with similar 1noome which would have been aerivea from grass unaer virgin conditions because the topsoil is gone anti it will take a long period 01· time -co replaoe it as a result ol' natural weathering processes and soil development. Improving: the ch1:1.raoter of the vegetation on large areas 01· abandoned lana and our.trolled grazing on many areas of good pasture land are important problems in the development of' better pto.stures in many localities.
Control or water erosion on sloping lt>-Ods when row crops are grown, c ontrol or wina erosion on ~undy lt:i.nd, oonserv~tion of raint'all in the western part of the state, are also important problems which must be considered in connection with better ma..,agement of cu.L tivl:l.teu land.
Reclamation Needs in Oklahoma
There are many bottom 1and soils in Oklahoma affeoted by overrlow which ta.re not poorly drta.ined. There are other bottom lan<i soils and. some terrace soils where runoff water collects on low lyinl> t.rsas and poor crop yields ta.re obtained because of both inaaequate surface and. subsurface dro.inag;e. The major portion of the poorly dra..ined soils in Uklo.home. occur in the cen'tral ~nd eastern part 01· the state.
.----------- DIVISIOM OF INDUSTRIAL AND STATE PLANNING------------, 18
•---------OKLAHOMA PLANNING AND RESOURCES IOARD ____________, 0 0 0
In western Oklahoma stream gradients are high enouth so mat overflow water usualiy aoes not stay on the iwid for~ long period or time.
Some of the stream channels on wl.ich overflow is tL serious hazard in crop p1oduo1aon inc.Lu<1e i'ialnut Bayou Creek in Love County, Blue R1ver 1r Hryar, County. CletJ.r l:Jorny tillG ~iuddy Bo [ t:Y i n Clioctaw ar..ri .ntoka Counties, Li-ct.le River in 1:cGurtt. in County, ioteb.l.l ltiver in Lel:"lore County, l::t,;.l t r ork t:nu Li t,,le hi ver 1r: Fot i. e.v,Eltomie 1:1nc.. bemiriole Counties, v.ewok~ CreeK in l:lu 6 hes ar.c. Semh1ole Counties, Deep l'ork or the North Ct.nactian ui ver throui;hout the 111«jor pcrtivll or l. ts lene, th, Polecat Creek in Cree1e County• Pryor {;reek in i.\iayes County, Bira Creek and it&> tributaries in 'lulsa anu Osf•t'= Counties t •.1;0 the Cane~, t-.na Verdigris River valleys. Cn practically ail of these streams some areas wil! be found which are poorly drained because of the co:-1st.ructic.n of natural levees by 'the st,ret.m channel. Y,hert; it. ilows 1 rom one side of the vnlley to 'the other. The moi;t i'i..vorabJe lanu fc,r cu1tivi:..;ion occurs adje.oent to the s tre6JJl che.nne l on the na tu i·al levee• which is usually sandier in character t<nct Ho.; :;UbJect to as freque~t uvert'low as l&nd i:. t some ctiitance rrcm the st:re1:.rr.. Sumri:t;r crops us t:. ru i e ar£i not affeoted by rloods, which norm~.lly occur in hpnl an ci }bt- y ur early in June.
Plan1:int!: sunur,er crc;ps 6.i·ter 1'1000 hti.zv.rus are pl:lst, or 1;he use 01' fell crops whl.ch ct..n be pi:.stured .Ln ec.rlr sprint, if, une of the oest methods c f" e 1 imin1:1.tir1&, crop o &.LW!:,O rr-.:: flood Y&ter un i: hi:.. t,; •pe cl' lan e. A cor:-.bi.m:.tion 01 rye,~rass l:na lespeo.ezn can oe recoi:unc.mea i·or pe.st1.1 re on low t)ottoli: 11:i11c. soils • .r.yerrtis~ v..1.11 t.urv 1 ve t:...!.thouf:.h coven,d with water 1 or severu1 c. i;.~1 s. LeqJ€;aeztt :;tsea r:,1.-y be v,1:. sh.eu
L ..-----------DIVISION OF INDUSTRIAL AMD STATE PLANNING------------
19 ---------OKLAHOMA PLANNING AND RESOURCES BOARD------------'
away by certain types 01' 1·1oous 1:.D.u rt:1-seeding, r-.ay be requireel. et:.ch year. Le.:.peueza seri.:e& c&.n also be :-. rov.n 0.1. this type oi' lanu. bJlci. in m&ny t..rt::11.s Johnson e_rr.ss Wl u wi thste..r.a considen.b1e i'looaing i1' aubsur1t:.ce cirtunat:,e 1s IJ.ot too poor.
Some of the poorly are.ined soils ar6 very low in na.turi;.l fertility, oonsequent1y oel'ore eny rt1clEU1u1tion project is s'liartea. soil tests should be macie to oet£;r111ine whether or r.o~ the l a.no will oe productive after drs.inr.ie syst6rr.s a.re established to remove the ~;:;.cess \'iater.
Ut1.LA1-.U1,A SC lLS
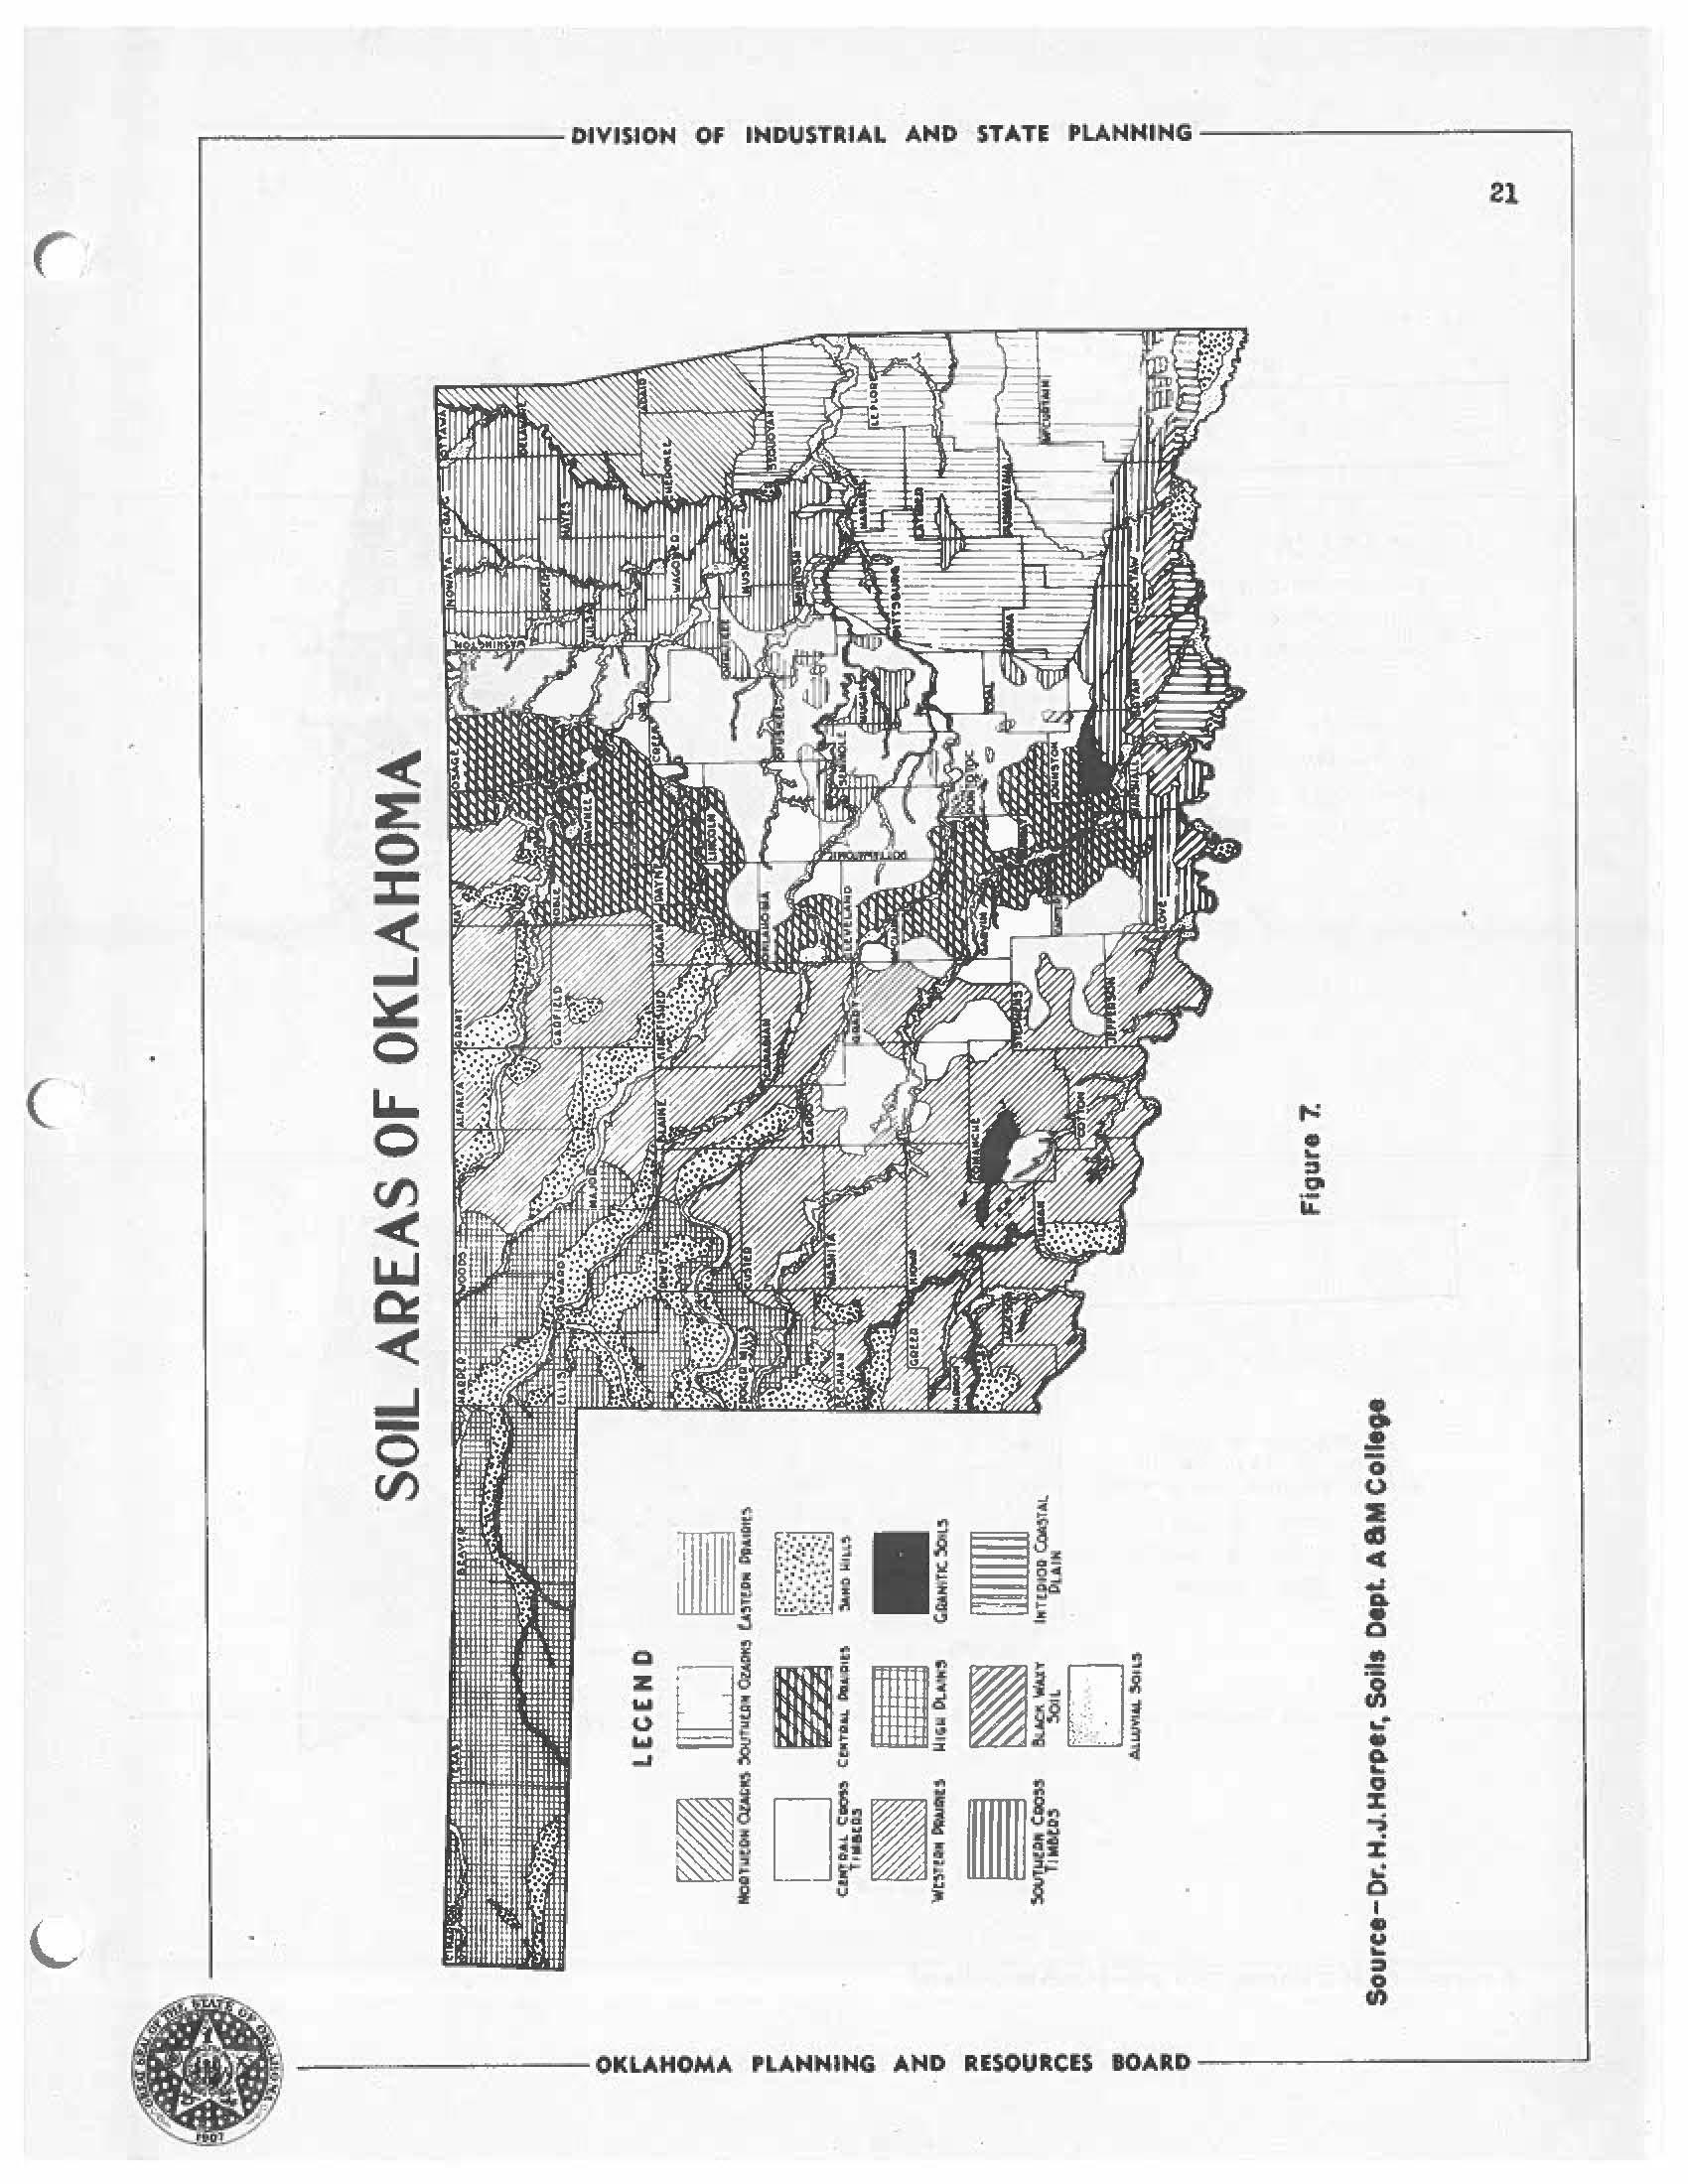
Ok1&.ho1na soih (h c ure : :o • .J__) he ve been tentatively classified into thirteen areas oecause of c..11'1'erencies iz:. physical ana/or chemical ch.artActel·is tics produced as e. result of the ccm:.inea e.i'reot of rain1e.ll, vet,ett.tion, topo r raphy s.na the ch1,re..:tc,r 01' 6 eolo ~ic6.l .materia l on sou oevelO !IDt; l!to
F1t,ure Ko. 8 w1a 9 preseut aau;. on the acic,i 'tj' &.na solucle ___, phosphorous cc,r.iai tion of 1..-kle.homtt sol.ls.
(,n1:.1.rt1.cter1.l>tl.cs or ukH~£!!!! ~oil .t-...rea&. : or i;hern vzarl:s
'l'he northern vzark t:.ree. oi (;kl1;.homfl. occu1 s in '\".he northeastern I,art ol' the state. i:rinc :i. 1,c.lly east c1' 1.rn.r1<1 niver e.nu north ol' Sequoyah County. '.i'hi6 e.ree. was orl.tin&.lly covered with post oak tixncer, al thou~h a i"~w ~&:tt.ered e.reas of gre1.ss lana v.ere i;resent under vircin ~onaitions. 1b~ soils h~ve c~vclo~ed pr1ccipully on resiau~s derived i'rom tht:1 Yicti.'t.i,erin,= of lime tone rock, ,.hi1.,h c1.1L1.&l.nea much cherty material. Sir.ca chert is very resi~t&nt 'to weatherin~, l.t oocurs 1n
r-----------DIVISIOM OF IMDUSTRIAL AMD STATE PLANNING------------,
20
• ---------OICU.HOMA PLANNING AND RUOURCES IOARD- ---------------' ' 0 0 0
( L ,......________ DtVIS10N Of IMDUSTIUAL AHO STATE PLANNING -----------, < z: 0 :c -< ...I 0 LI.. 0 <.n < LLJ8 Q:: < ...I0 en ..: • t 0 = "' % g I • :I 21 •-- - -OKLAHOMA PLAHNlNG AND RESOURCES IO,\RD----1 -----J
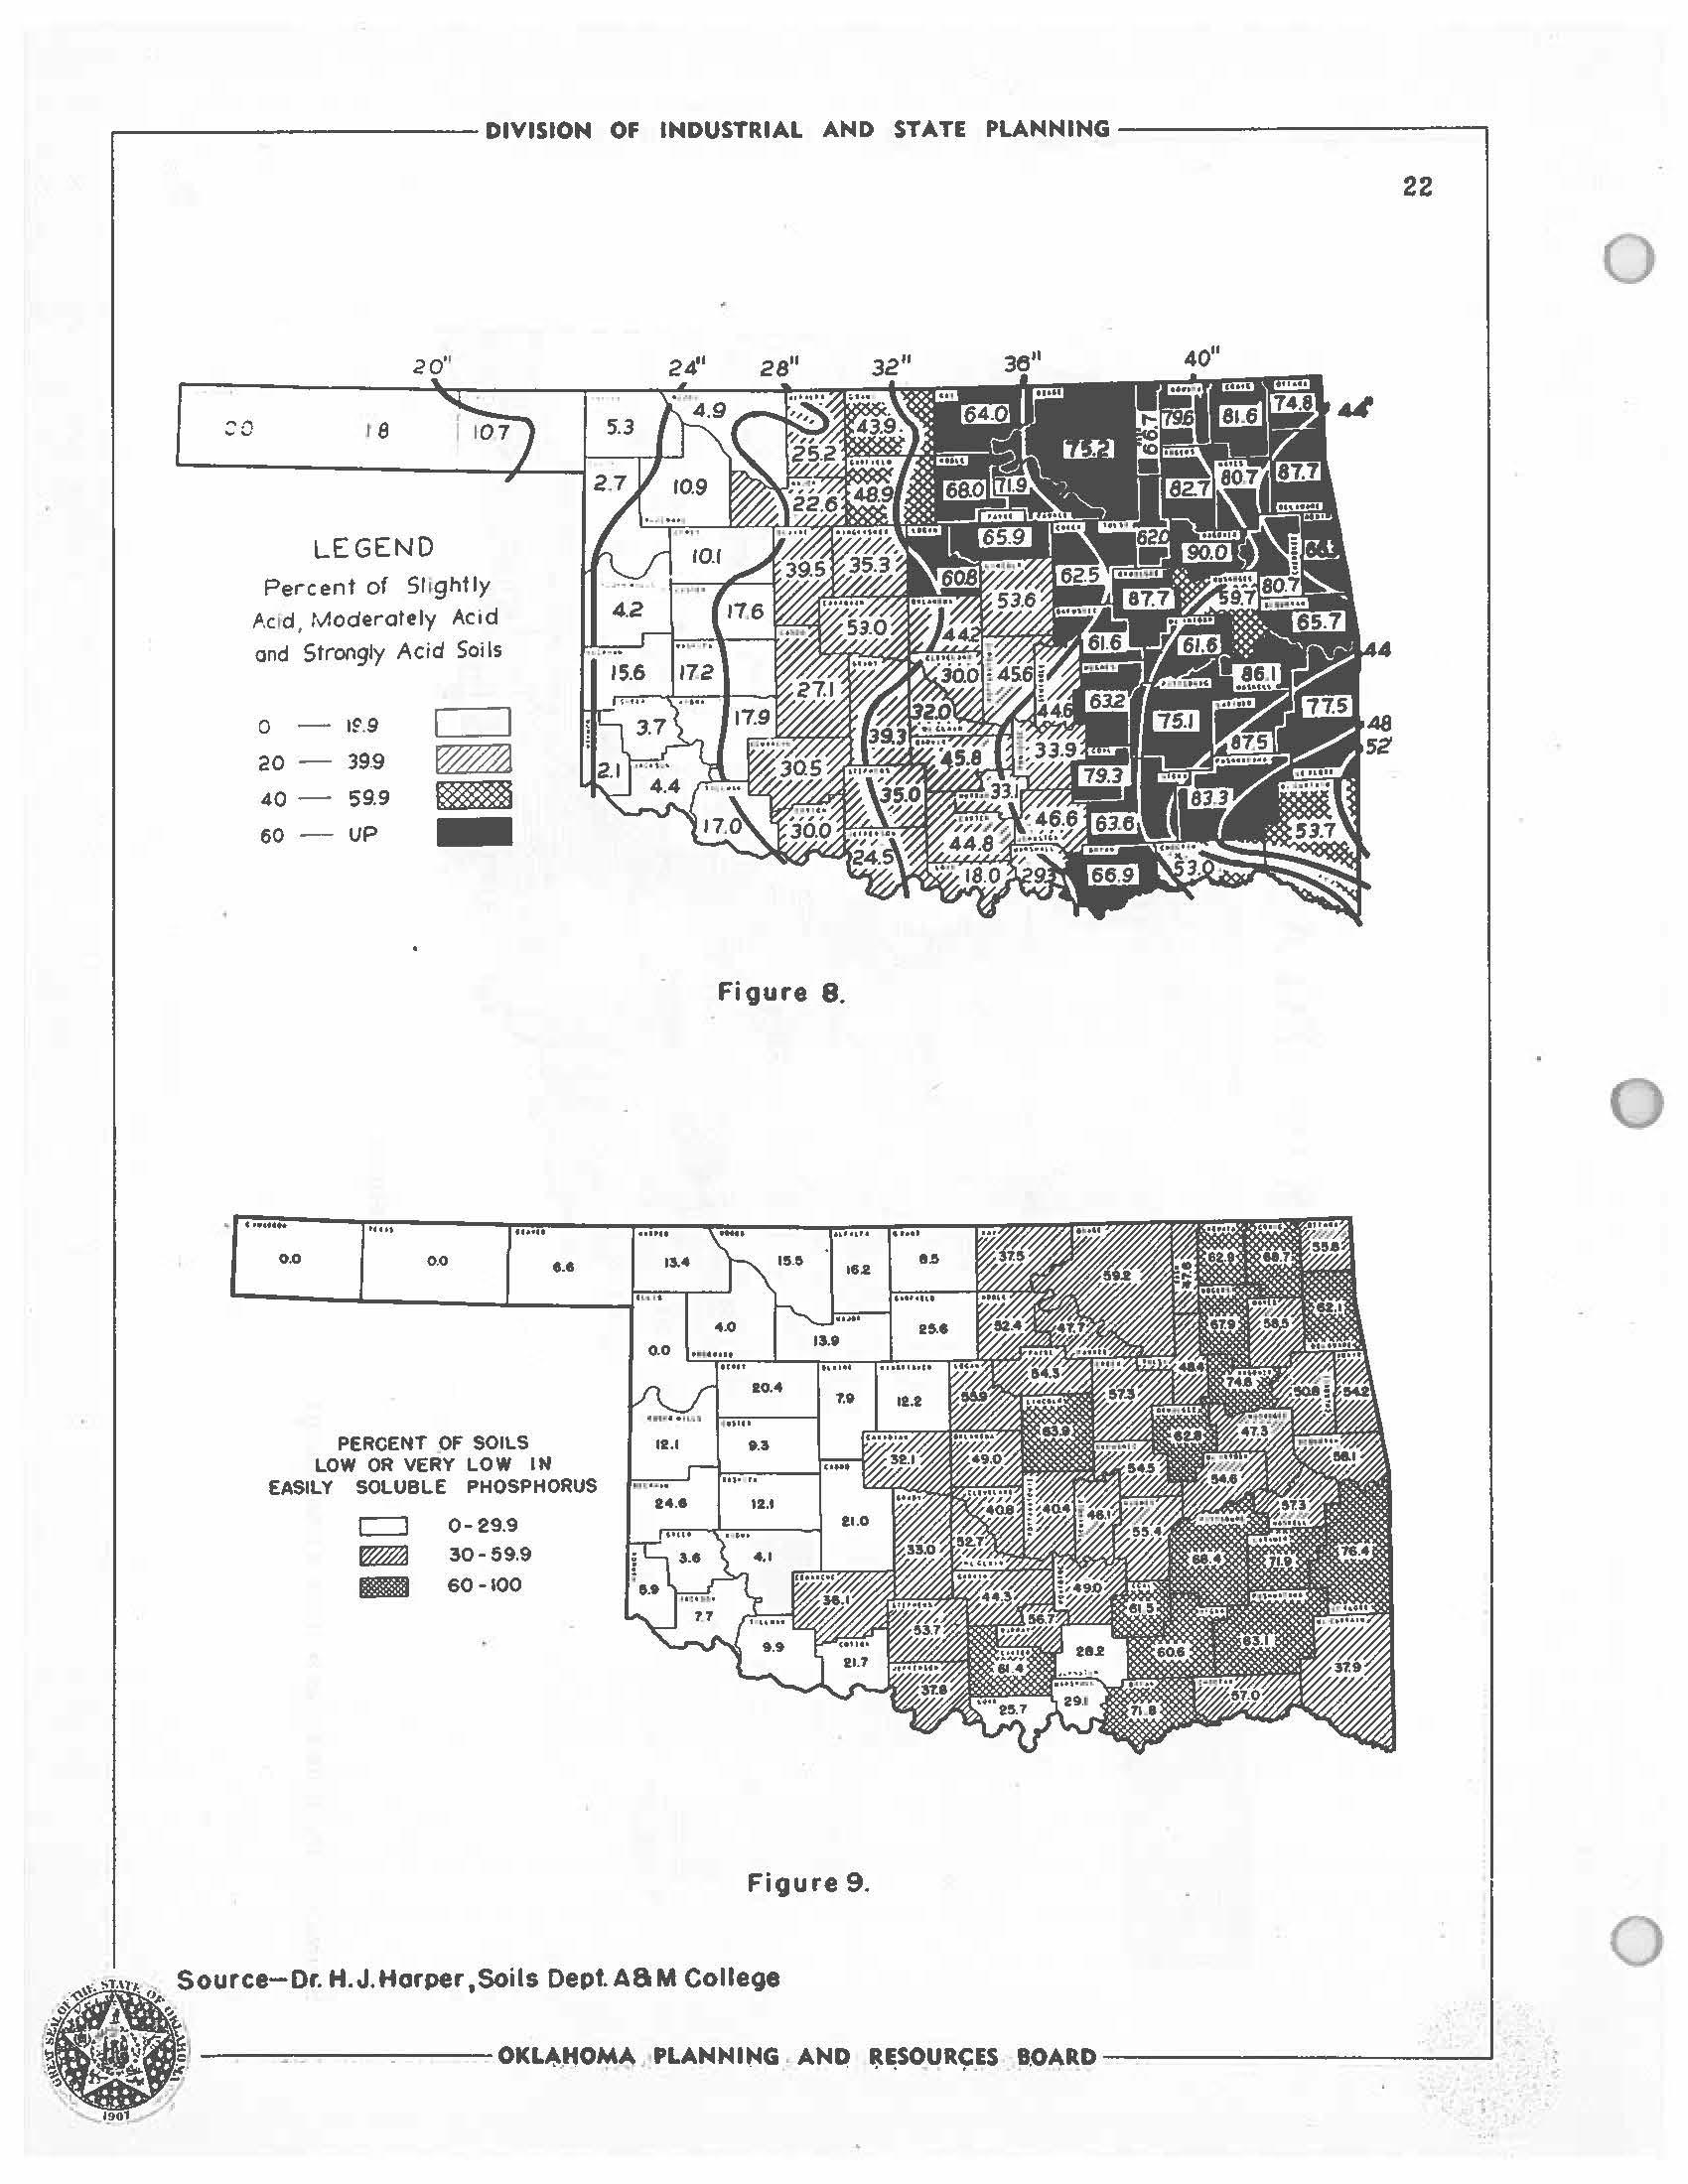
i DIVISION OF INDUSTRIAL AND STATE PLANNING----------~ ::o t e LEGEND Percent of Sli ghtly /'.c 1d , Moderately Acid and Strongly Acid Soi Is 0 - l~ 9 c=i 20 - 399 40 - 59.9 60 - UP......... 0.0 0 0 PERCENT OF SOILS LOW OR VERY LOW IN EASILY SOLUBLE PHOSPHORUS c:::::::J 0- 29.9 30-59.9 llll!llill!i 60-100
Figure 8.
,T ource-Dr. H.J.
M College 22 4 • : ~IDIIY l ---------OKL~,HO'!tA PLANNING ANCI ~~SOUR~ ES B.OARD __________ .....J 0 0 0
Figure 9.
Horper ,Soils Dept. A8
great abunctanoe on the steeper slopes ana has weathered to a silt loam soil on the gently slo1 ing table lands. Much of this area is too rough for cul tivanon. The s011s are low 1n or~uuc m~ tter e.na det·icient in availti.b..t. e phosphorus. The mti.jori ty 0,1· the be,ttom land soils ir.. this area are productive il' they ao r..u G con.:ca.in 'too much gravel in the subsoil. Cro1 , proauction 1n 'the area is low because much 01· the lt.nd is not in cuitivation ti.no l&nd which is in ou ~ tivti.tion has u low natural fertility. ?iletho a s ror so u improvement ht\v:e no-e oeen used extensively in this re('.;ion but lt.rg e increases in crop yield can be obtained by use of limestone, phosphate fertiJ.izers 1:1.D.<l legume crvps 1·or soil improvement.
Southern Ozarka
The ~ou-chern Ozark~ occur i n the sou-che~steru part of Oklahoma ti.no have oevelopea principally on residues derived from -che weatherin~ of sandstone ano sh~le. Timber ooours on the shallower soils and rou&h topo g rt1phy. In the southoentral part of the area. pine forest is oommonll' l'ouno an the sanaier soils. Some cedar will be founo on calcareous shale romtttions. V.here dense olay su·bsoils occur in so me or the valleys or on oertt..in shtlle i'orn,e.tions. prairie grass was the uorninttnt vegetation unGer virgin conditions.
The soils 01· the southern Ozark area are very low ix: available phosphorus i:.nc meny soihl t.re deficient in potassium. l'he soils are e.:i.so deficient in org .,.n10 ma ttt:r ~na oroi: yieJ.ds ll.re low oeoause of a l&.ck of fertility. On 'the steeper s lopes erosion h s been serious problem. Mar;y 01' the oottcm i5.Il<ls ere proauct1ve physict1l.iy but need to be fertilizec: ror r. H:ximu m yields. Stream valleys in this i:.rea are
( ..------------DIVISIOM OF IMDUSTRIAL AND STATE PLANNING-----------.
---------OKLAHOMA PLANNING AND RESOURCES BOARD------------'
'
frequently subject t o severe 1'1000s bec use of" -che rtlpia runoff from steep slopes.
Etlstern Prairies
The eastern prta.iries of Lkial,oma -were orig inully ocvereo. l'li th tall g rt-86 unaer virgin cob.di -cioos. Some timber occurred on the f:ilindstone ridges t.nci tilong the strewn cht\llnels. Some 01" the soils h11.ve c:teveloped on weathered sandstone, while others have developed on weathereo shales or .!. imestoLe. Normi,.l .ly, ·the limestone soils v,here deeply developed 1o.re the most i:-roductl.ve, whereas sa11<1stone soilS E.re extensively leached, are usually low in available phosphorus enci are qui'te acid. 1his lireu hbs more gently sloping t op ography than either the northern or the southern Cza.rk area. Some isolated areas of grass lane1 occur 1.u Hughes, Seminole, Fotte:v.-t,tomie und Okl'uskee Counties, which are sepe.re ted from "Che Llt.jor ptsrt 01· the eastern prairies by oel ts of timber of varyin t Y.i<ith. These isolE.te<i are &s are usu&L y in outcrops oi· sht:.le v.hich provice con ai tions more f'ti.vort,.ble for the d evelopment 01' gr1,.ss thtiu for the encrouclunem:. or the fores-e. .tdany of' the soils in -ehe etl.,tern prairie secticn 01· 0k.:.e.home. have dense clay subsoils -which cause e. poorly drained cocai ti,;;n during perioas oi' abundant ra.in t ·e.11 11110 intens1f'y the dar.lar;e 1·rom drouth v,hen temperatures ti.re h ig h. .Lie.ny o ::.' 'these soils are also very J.o-w 1n ava1,able phosphorus, but org ., n1c mt.t'ter is not such 1-n 1r1,rortant limiting factor in orop p roduction at t.he present time on many soils exoept to maintain a mo1 ·e i 'avorable physi c t;J. coP<1i tion 1·or root aevelo 1me nt.
Central Cross '.l.'1.1ntJers
The cross ti n. ber s01 : s of udahuma oc cur l.l! the ce11t.r1::l pi.rt o:f
,------------ DIVISION OF INDUSTRIAL AND STATE PLANNING------------, · ST.\ -
1 'sodJD<l!.JI" \ ----------OKLAHOMA PLANNING AND RESOURCES BOARD 24 0 0 0
the state anci extend i'rom the Kansas line ir.. eastern Osage County t:o the Texas border. '.lbese soils lut.ve developed principally on weathered sandstone interbedcled with some shale. The topography over the major portion or the area is rough and broken. Sandstone escarpments are more pronounced in the northern p1.1.rt of the area thlill in the central portion where a more gently rolling topography ooours. The timber is prinoipti.lly po~t oak and bl~ckjack with more tall grasses tht.t.n in the northern or southern Ozark areas. The western ~dge of the cross timoer area is quite sharp in Logan. lkJ.ahoma, and. Cleve1e.ne1 Counties. 1hia area extends west into G~rvin, Steph~ns, Gracty t.Jla Caaao Counties. although the soils are somewht. t different than in the centrtll and north central pE•rt of" the state. The southern part oi' the cross tl.Jl1oer area merges with the Southern Ozark region with no well defined boundary between them •
.l:;rosion is a serious problem in this region beol:luse 01· the rather sandy chare.cter er the soil ...na the hig_h percentage 01" row croi:s which are_ planted. The soils t1.re not t1.s highly leached as in the mure humi~ portion of" the state bUt they are deficient in or&anic matter ana available phosphorus.
Central Frairies
'!be central prairie soils lie l.ir.11.ed.it1.tely west or -che centrf..1 cross timbers~ They ait'1'er 1'rom the eastern prairie soils because they ~re slightly lower in orelillic matter content, no~ as acia, ~lid phosphorus deficiency is not quite es serious ~nu the subsoil6 are red rather than broYtll or gr~y. Since more leachi1-t:; occurs on Eentle aloFes ~s compored ~ith ~he steep slopes, where geologic~J. erosicn has
r C ,-------------DIVISION OF INDUSTRIAL AND STATE PLANNING------------. 25
1 -
- --'
OKLAHOMA PLAMMIMG AND RESOURCES BOARD-------
oeen more active in removing surface soil, a,.na since sandier soils are more thoroughly leached than the l"ine textured soils, a considerable v~riation in soi! condi1.ions wi1i occur within any p~1ticu1~r locality.
ihe central prairie soils ooour on a more rolling ~opogr~pby than the western prairies, consequently the boundary line, a1though not exact, can be rather easily detected in going t'rom one of these are11.s to 1.he other.
'Western Prairies
ihe •estern prairie a,.rea oi' Okh homa varies t'rom 11. gently sloping to rolling 1.opography. ii.oat of 1.he soils are Ylttl.l supplied w1 tb. organic matter and e.re not acid. '!hey llre ti.iso high to very high in ave.il11.ble pho6phorus and pol.ash. A high percentage ot' the ~heat and cotton is proauced in this area.
Erosi t'n is a more serious probient when cotton is plt:..nted, 11.s oo:ir1pt1.re<1 with wheti.1., 1¥h1.ch covers the lt1.n<1 during the spril'lg months when rain1'1dl is more torreut:i.u1 in character. illoisture cons·ervt1.1,1on is more imfortli.nt "than llll)' other taotcr in improving crop production on western p rairie aoiis at the present ~ime.
Sana Iii.a.ls.
'.J.'he sand hil.1a 01' Oklahoma have developed on outwaah mi, terial from streams f'lo1111ing 1 rom the high ple.ic.s area. 1'he most extensive deposits ooour on the north sice ot' the Salt l-ork of the Ar.icensas. the Cimcrron. the North and South C~dian Rivers s.nd in rieckh9Jll, Harmon s.nd Tillml:.ll. Counties. A rew smti.11 isolated e.ret, s oi' sandy deposits vary in physical t.md chemical oor,iposi tion am<l also in soil development beoause or dit·ferenoes in age. In westerc Okli:..home. sage-
.------------ DIVISION OF INDUSTRIAL AND STATE PLANNING --------------1
26 ---------OKLAHOMA PLANNING AND RESOURCES BOARD-------------' 0 0 0
brush oocurs on the younfer St<-ll.c.s t1.nd. shinnery ot1.k on -che olo.er for' mat1ons. Ir, 'the west cez:trt.,l i:11rt 01. the s,:;e.te, 1:1.~ rt1.inr1:1.1l increases, blsckJt1.CY. oak ap•ears on the sanaier soils wit s~udy olay suosoils, wheret--s st1gebrush may stil.t oocur a.long the streti.Jli where the sand is still youthi'ul in ch1;:.r1;,.cter. ir1;,.ctictilly 1111 of the rain falling on the Sttnc.y land i~ absorbed.. Guo<1 water c"'n be obt&inea. 1·rorr, shal1.ow wells iL. most 1occ.lities. The si,.nc is coarser il! the \V1:1stern pt1.rt of the stta.te ~ht1.n in -che t.1:1.st central p1:1.rt 01· the stt..-ce, consequently the desirt1.bili ty oi' the ~on for fa.rming increases t1s the texture 01· the sand becomes finer.
The high Plains
The hie;h plt:.ins or L,kb.homa occur principally in ,:;he pt1.nhe.nd1e oounties. '!'here is a considerE- ble are-a. 01' rough, broken i.t1.n<1 between the western prairies t1.Ha the hi gh plaits due tu an increase in elev1:1.tl.on ano. the effect or geological erosicn. The high plains soils have o.evelopeo. on outw1:1.sh mut6rir..l under the influence 01· rather row ri;.infall. The western part 01· this tl.reu is less auitable 1·or the proouot1c,n of oul tivtitea crops than the el:lstern pa.rt c,f the &.rea because of the moisture hazard. Altr ou ~h or Ganic matter line nitrogen content of the soils is decree.sine; tis the result o i' cu~.tivation. at the present tirr.e moisture conservt1.tion 1:1.na the control of wind erosion are the most important !"actors ir. successnu crop proauction.
Black. ~uxy Soils
Th:i.s e.r<:ia in Oklahom1;1 is t1.n extension 01 the b1ack soil belt in Texas. It occurs on soft 'Weathered .1. imestune or highly ca.lcareous shale. The soi.is ti.re hi ~ h in or r anic n,titter an\;. cli,y content, i;.11d
C L .------------ DIVISION OF INDUSTRIAL AND STATE PLANNING-------------.
27 ---------OKLAHOMA PLANNING AND RESOURCES BOARD---------- -.........,
normally ~re not acid. '!'hey are also high in available phosphorus e.nd potash. Erosion control is one of the imporui.nt problems on this type of land because the soils to.re grt1.nuh,r in character bnd when n o t protected by a vegeu.,.tive cover the soil tranules ar& easily transported by running water. There ure some black aoila in central ~nd northeastern Ok1ahOD1a which have developed on weathered limestone and should eventually be oiusHied with this type of le.no. A large amount of power ia required to operate fa..nn equipment on this type of Lano due to the high c!~Y content of the soil. 'l'hese soils are not only productive for cu~tivated crops but are also good pasture soils. In regions which receive rather large quantities or spring rainfall. summer crops can be grown more suocesai'ully than sprini;; planted crops Vlhich must be cu ~tivated when rainra!l is high during April. May or June.
Soil c cnservation is more important thlill the in.proveme1rt oi" fertility at the present time~
Coastal Plains Soila
Die coastal plu.ns of Oklahoma occur in the southern tier cf' oountiea east of Jefferson County. 1'h.ey •ere covered •ith timber UJlqer Tirgin con<1iti 0: ns and are normally loY; in rui.ture.l productivity. t~aohing has been more extensiTe in the eastern part than in the western part of the area. Considerable quantities of ~rass lana occur in Bryan County and southern Marsh£ll County. ~oil erosion has severely dem~geu much of the slopinf l~nd usea fer cul tinted crops. Goou soil me.nE.ge~~nt is essential in m&inta.ining and i~proving crop proaucticn on thit land.
..----------- DIVISION OF INDUSTRIAL AND STATE PLANNING -------------, 28
c ---------OKLAHOMA PLAMNIH'G AND RESOURCES BOARD - -----------' , . 0 0 0
Southern Cross Timbers
This area is in reality a. p&.rt 01' the coastal plain occurring on the north side er the b.Lack wt>J..y soils. It is a narrow band 9f' very sandy land extending t'rom the .n.rkunsas line 'Westward aoross Choctaw, Bryt1n, ?tarshall, par-cs of Carter, tJ.nct into Love County. This deep, sandy soil has beer. called "southern cross timbers" lr.rgely because of di1'ferenoes in geological origin. The fields are sm11ll and mto.ny o1' the soi.Ls have been leached extensively. It is a good soil for orchard ana small fruits. l t is &.lso well adapted to rol'I crops where .fertility is s u pplied. It is exceedingly low in org t1nic matter and 'When cul tivated is susceptible to oo~h ~ater and wind erosion.
Alluvial Soils
Praotical .1 y all. Ok .1.ahorua soil 1:1.reas wiu have stream valleys oontainir.g soi.I. mt1. teri&.1 washed from t1.djaoent uplands. In some looe.1 i ties strea=r.s f'lo,,iug 1'rom 1:he western fart 01' the sta-ce have deposited sediment alor..t; their ve.1leys which is very unlike the soil of the aojacent upland. Norma1 1y the soils alone; the sn~ller stret:lllls will have soils somewhE1t llke 1:he ~<1jt1.cent uplands, whereas the soils i,..LOllf -che h1.rger streams nowing t'r~m the grebt plains ar6a will be more like the soils of the v,estern prairies or high ple.ins. Usually bottum land soils are mucr. more productive tht.n uph.no s o iu:; v.here surface or internal dre.in&£ e is no-c bll important problem or serious overflow aces not ooour. Bottom land solls .,_re less &.cio -cht.n ti.ctje.cer,t upland soils tt.nd they usuhlly contain a much l&rger que.nti ty oi' avai.u1.ble phosphorus ti.nd other plant nutrients thti.n saji,.cent uplana soils. At least one-third 01· th~ cu ~iv&. t6d lf.nd of Lkla.homa occurs in the bottom land. These
( .------------- DIVISION OF INDUSTRIAL AMi:> STATE PLAMMIMG ------------,
... - ---------OKLAHOMA PLAMMIMG AMD RESOURCES BOARD rso t.-,,~
soils ~1·Eo r,ot 1.iJ.ected oy v.&ttr erosivn 1:.n<.1 the mi-.,.jori ty of them 1;cre not severely av.m1:.r;e,~ oy v.ino. erosivn. 'I'he rr.liintemince of orr;a.nic ma1;.:;er unn the adctiti<Jn of' phosphate t·ertiiizers or lime, where needed, e re the imrortt.nt lirr,i tine: 1·1,;.c'tcrs a.s f11r as mai.c.tt-inint a permanent i'erti.1 l ty is concerned.
Grv.ni tic Soiis
Grt:.nl tic soi s i,re ol' little i:rJpor,:;i,nce in Ckli.c omo.. The mE<Jor portion or 'this type of ls.nci occur£ in Johnston County. Some of- thesE"> soils ere ratht:lr grs.velly 1:.nc: druuthy in chi;.r&cter, whereEis other g:rani tic sciJ s contair: a hi r h f erce11t6.[8 of cl ...y, es!"ech.lly :i.n the subsurf'e.ce soi!. Some or 'the alluvium wt:.shed frol:i the gn.ni tic mountair.s in Comanche County is hi f h~r in a.vailabie phosphorus Hnd other minerals them tidjt:.cer.t 11..nc, which h1;.s developed 1"rom the vreatherir.:; of sedimentary rock. Normally the granitic i,oils in Johnston County are very oe1•icient i!i avti.il1:1.blt:: i:-hosphorus 1.-nd v.here the :,oil hE..s been covered with timbe1 , it 1s ialso .1ov. in or6 1:.nio mat\;er.
.------------ DIVISION OF INDUSTRIAL AND STATE PLANNING------------, 30
---------'---OKLAHOMA PLANNING AND RESOURCES BOARD-------------' 0 0 0
STATE 00.uill OF AuRICULTU.l<E
The State Boara of Agrioulture ia composeci. ot' five members. The presiaent, who is chairman oi' the boara is elected by the people of Oklahoma i'or a term 01· four years.
The other t'our members are appointed by the governor, with the consent and. approval of the State 8enate, i'or a term of t'iTe yea.re.
STATE DEPA!{'lKENT OF AGRICULTURE
The State ~epartment or Agriculture is heaoed by the president 01· the st~te .t:10111.rd 01· Agrioul -cural.
'l'he uepariln&nt consists or the i'ollowin~ 'ten <liTi•iona, seed an<1 plant, dairy, orchard and nursery, livestock, state Gram lnapeotion t1no. ~onded warehouses, Marketing, 1'eed and .l'·ertilizer, Veterinary Medicine, Entomology, and Agricultural Statistics azid Research.
1he iollowin@' tnlve point progr8JII of the State Department o1' Agriculture indicate its soope and 11.m.otiona.
1. To morea6e 1'e.rm inoOble ana improve quality 01· 1·arm produots by encouraging the uise 01' oetter livestock ano seed.
2. l'o improve m...rketing and o.istribution t'ac1li ties tor all agricultural products.
3. 'l'o a~sist in makini:; home ownership possible and. improving landlord-tenant relationships.
4. To encourage and aia in establishing improved oon<1itions tor Ukiahoma i'ann homes.
b. l'o ooopera "t;O wi ~h aL s ta ~ e b.llO !'ederal agriouJ. tural a.genoies in cons t ructive agricultural work.
6. 'l'o support all state agr1oul tural colleges t1ll.<1 to iniprove educational opportuni tieo for n:1.rm boys and girls.
r C .------------DIVISION OF INDUSTRIAL AND STATE PLANNING--------------,
31 OKLAHOMA PLANNING AHD RESOURCES BOARD-------------'
7. ~o hive a1l ~ossible assistance to the uevelopmeut Wla progress or 4-H c1ubs, voo6tional t1gricui.ture, &I:!d vocational homemaking.
8. To increase ft1rm mcome by enooure.g1ng tanners e.na lives-cock b rowers to take ac1v8llta[e or the services now ava11able in the depar-bnent of agriculture, to eliminate injurious insects ana contag1ous 1u1u inrection diseases amont plants wia Pllim&ls.
9. To ai d 1.n -.;he res-coration of the fertility 01· fana lanc1s in Oklahoma by encouraginf the use ot' soil conservation practices.
10. To promote development of new inoustrial uses and m~rkets for farm proauc1;s
11. To provide protection to producers ~na consumers against inrerior 1;.;na aiseased 11.gr1.ou.1 turai commoai ties.
12. To ma.ire tovailt,.ole up-to-date ir.1·onnt1-C1on on Agriou1 tural and lives-cock conClitions.
...----------- DIVISION OF INDUSTRIAL AND STATE PLANNING------------, · ST.\ • ' '
1 ---------OKLAHOMA PLANNING AND RESOURCES BOARD tSOl.-""' 0 0 0
The Ok11;1..homa Crop Improvement Associt1. ti nn la a voluo~ry organization whose membership is comprised 01· 1eaa1.nr, 0klt1.homa 1·ar111ers engaged in 'the business of producing ane1 mto.kin r avaih.bie to the public through seed oertl fioa 'ti.on, hir;h qua.l i ty seeds t111d prop1-:..gt. ting: ma teria.u of adap-wd superior crop purn't vt1.rit:lties so grown 1;1..nd ctistributed as to insure genetic ldenti ty and purity.
The Assoohi.tion was oft'ioi1;1..J.1y ir,oorporateci. unaer t.he 1 .. ws or Ok.Lahoma in 1~30 b.mi is now 1\lnotioni nf t.S a nou-pror1 t, non-stock, coopElr1;1.tive t1.ssoci1:J.tion. Legal status wus granted in 1938 when the auoci11tion was designs.tea the 01fic1a.1 t1.hency in Gk.i.ai.J.oma to carry on seed certi1'ica.tion i l compliance with house Bu.1 513 passed by the Sixteenth legislature 01 the State of Ok.1.ahoma. This act provides t'or and authorizes the certific t. tion of Okh1hon,a grown seeas and plant parts intended tor propagation or sale.
Seed certifioatioo carries with it much more than information concerning mechanical purity and certain visible quality 1·actora of' the seed tht1.~ are oetennined in ~he labor~tory. It is necessarily a program which requires a continuous pedigree record and one whioh applies only to vurieties 01· crops of known genetic origin that are approved by the experi.Jnent station ta.nd accepted by the oerti1'y1ng agency. Aoceptanoe or 'Vll.rieties for oertil' ict1.tion is bu.sod upon aatisn1.ctory sup... rior peri'ormance 01· the str11ins in 011·1.01ta.ily conducted experimental tests.
To produce f ounau.tion, l e g istt,r d or certit'iea seed, the class-
es of seeo reco 5 nu.ed in Oklahoma's seod certirio1-1t1on pro:_~ ram, eli,: ihle
( C ...------------ DIVISION OF INDUSTRIAL AND STATE PLANNING-----------
OKLAHOriiA CROP 11,.PRvV~~l~T A::i b OClr.TlvN
33
---------OKLAHOMA PLANNING AND RESOURCES BOARD _____________J
growers must start with one of' these cl.tt.sses oi' se t~<i frClll 1:1.n approved aouroe and of 1:1. variety recommendea ror Okltt.homa. lhe seed must be planted, harvested, 1:1.nd hb.lldled ~ccording to rules ia.nd regulations set forth in the various certification standards ana in such a mbllller that genetic identity ctt.n t...Lwa.ys be trr.ced directly to the original lot. In . order to determine whether all requirements ana regulations are met, the growing orop must be inspeoteci by an official assooiat1on inspector prior to h1:1.~vest time for purity, diseases, presence cf objectionable weeds, and other factors which mi f' ht ts.1'1'ect the purity and quill i ty oi' the seed. In addi ti.on, tt. re pre senta ti ve sample of' 'the seed harvested rrom the approved acrea~e. ~na in ~he condition it is to be offered for sale, must be obtained by the 01f1.ce 01· the Oklahoma Crop Improvement Association for the purpose or mt1.kinf a ,!: ernr.i. nation tei;t, a purity analysis, e.nd to determine whetoer general seed quality is acoeptable.
Member-growers 01 the association are assessed the 1'ollowing i'ees: membership fe.;s or ~J..ua rer year or ;,;5.00 tor 111·etime mer.1bership membership; rieta in:..pectiun fees or ~3.00 each 'time thul. a lie.La insp~ction is n,.,.ae; a.nu service char s. a fee of 2;,o or 'the (!;ross return from sale of certil ied seed. N:oney accrued i'ro1,1 these fees is used to pay tr~veline expenses, ror :.-reno g raphic s:;rvices, for o1'rioe sup}lies and for publishintc mimeot;r&.ph bJlC. printed n,aterials distributed to the membership.
The 0klahom::. Crop improvement As5oci&.t1on is r,ow certifyinr, over 50 ctii't·erent improved vt..rieties or 1.8 e11.1'1'erent crops. Eveu though the tote.! cert1.riec1 se-=lds t.nc flant part:; w1.11 pl~nt on the average less than 4~ of the st~te's ait~uul crop acrea e, the va!ue or the services
~---------- DIVISION OF INDUSTRIAL AND STATE PLANNING-----------,
---------OKLAHOMA
BOARD-----------_, 0 0 0
PLAHMIMG AND RESOURCES
rendered ~y the assoc i a~ioa to vklahoma Ag riou ture has been worth many thousands 01' do l lars line. will bear r!ipl.d expansion. The realm of' e.oti vi ties u. n a r .;; sponsi bi i i ties of the e.ssoo10. tion 1s 01' vital import.a-nee 8.n'j is reootaize u as der1n1't81.y essentll:;l in the framework or a sound t1. , r i. ,;u .:. -c-..irtu pro{ ram both i:1 'the state ana in the nation.

( L r-----------"--DIVISION OF INDUSTRIAL AND STATE PLANNING------------,. •
/ - -OKLAHOMA
------' '
PLANNING AND RESOURCES BOARD------
AG RI CUL '.LU RAL EXPERiliiEN T S T.n. :rION Oklahoma A. & )I. College
The Oklahoma Agricu1 tur&.l Experiment Station is one 01· the three branches of agrioul ,;ure under tile administration of" the Oklahoma A. & ~. College. The Stu.tion Wks established at Still1'8.ter as a part or the Coliege in July. 1891 by Congress under the Hatoh Act with the following provisions:
"That in order to aid in acquiring and diffusing among the United Sttt.tes useful and practioal lllformation on subJeots connected wi. l.b. -.g ricul ture, ana to promote soientitio investigation and experiment resp~cting the principles tllld applications of agricultural science. there shKll be established under the direction or••• (each of the so-called land-grant colleges) ••• a dep•rtment to be known and - design•ted as an "agricu l tun.1 experiment station."
The work of the Experilllent Station is financed by Sttt.te and ~•de£•l appropri•tions. and revenue frOJD the sale of proauots ot Station l'anns and .Laboratories. At present the lines 01· investi~&tion pu1·sued inoi.ude experiments in soils; field cropa; fruit and ver,ttt...01es; breeding of liTestook; human and animal nutritionJ insect pests; economic inseota; poultry and egg production and poultry feeding; piant diseases. their control and erattioation; bu-c~r. cheese and ice oream manui'i;.cturing; tenancy, popuia.tion movement. tuia other sooilil prob1ems; rarm manai ement. m~rketing or agriouitural products. prices. taxation, human nutrition and textiles.
'lhe investigations ~re ttes1gned especially to turther the progress 01 agriou:i. 'tUre in Oklahoma. liesul ts of investi~ations are made ava11-.b1e to the publio as promptly as posaible thr o ugh the 111ediw11 of the Extension Service and its county at! ents. and
,----------- DIVISION OF INDUSTRIAL AND STATE PLANNING ------------,
• ., OKLAHOMA PLANNING AND RESOURCES BOARD ------------' ~ 0 0 0
through ui.e publiot.ttions 01· me .i:;xperiment Station. ln eadi tlon to 1;he reguh.r Experiment i.>te.tion bu1letins. giving the results 01· 1Wrk. populi:.r pub! ic a tions .knoltlll as circulars are issuee1 from tJ.me to time as conaitions would seem to warrant, ~o ½e used by the ~tension Service ano bxperiment Station in aistributine information to the farmers. The Experiment Station prof:r8111 is conoucted 1n laboratories and on College i'ann8 lll w1<1 near Stillvia "ter • enc1 in aad1 tion, very important phases oi ui.e ~ork ~re carried on at nwnerous points throughout the state ino.tu<1ing 'l'ipton, Lawton, l,oodwe.rct, G-oodwell, Cherokee. Bixby, Lone l•rove, heavener e.na Guthrie.
C C L ~---------- DIVISION OF INDUSTRIAL AND STATE PLANNING -----------
-· ---------OKLAHOMA PLANNING AND RESOURCES BOARD -----------..J
Oklahoma A. & M. College
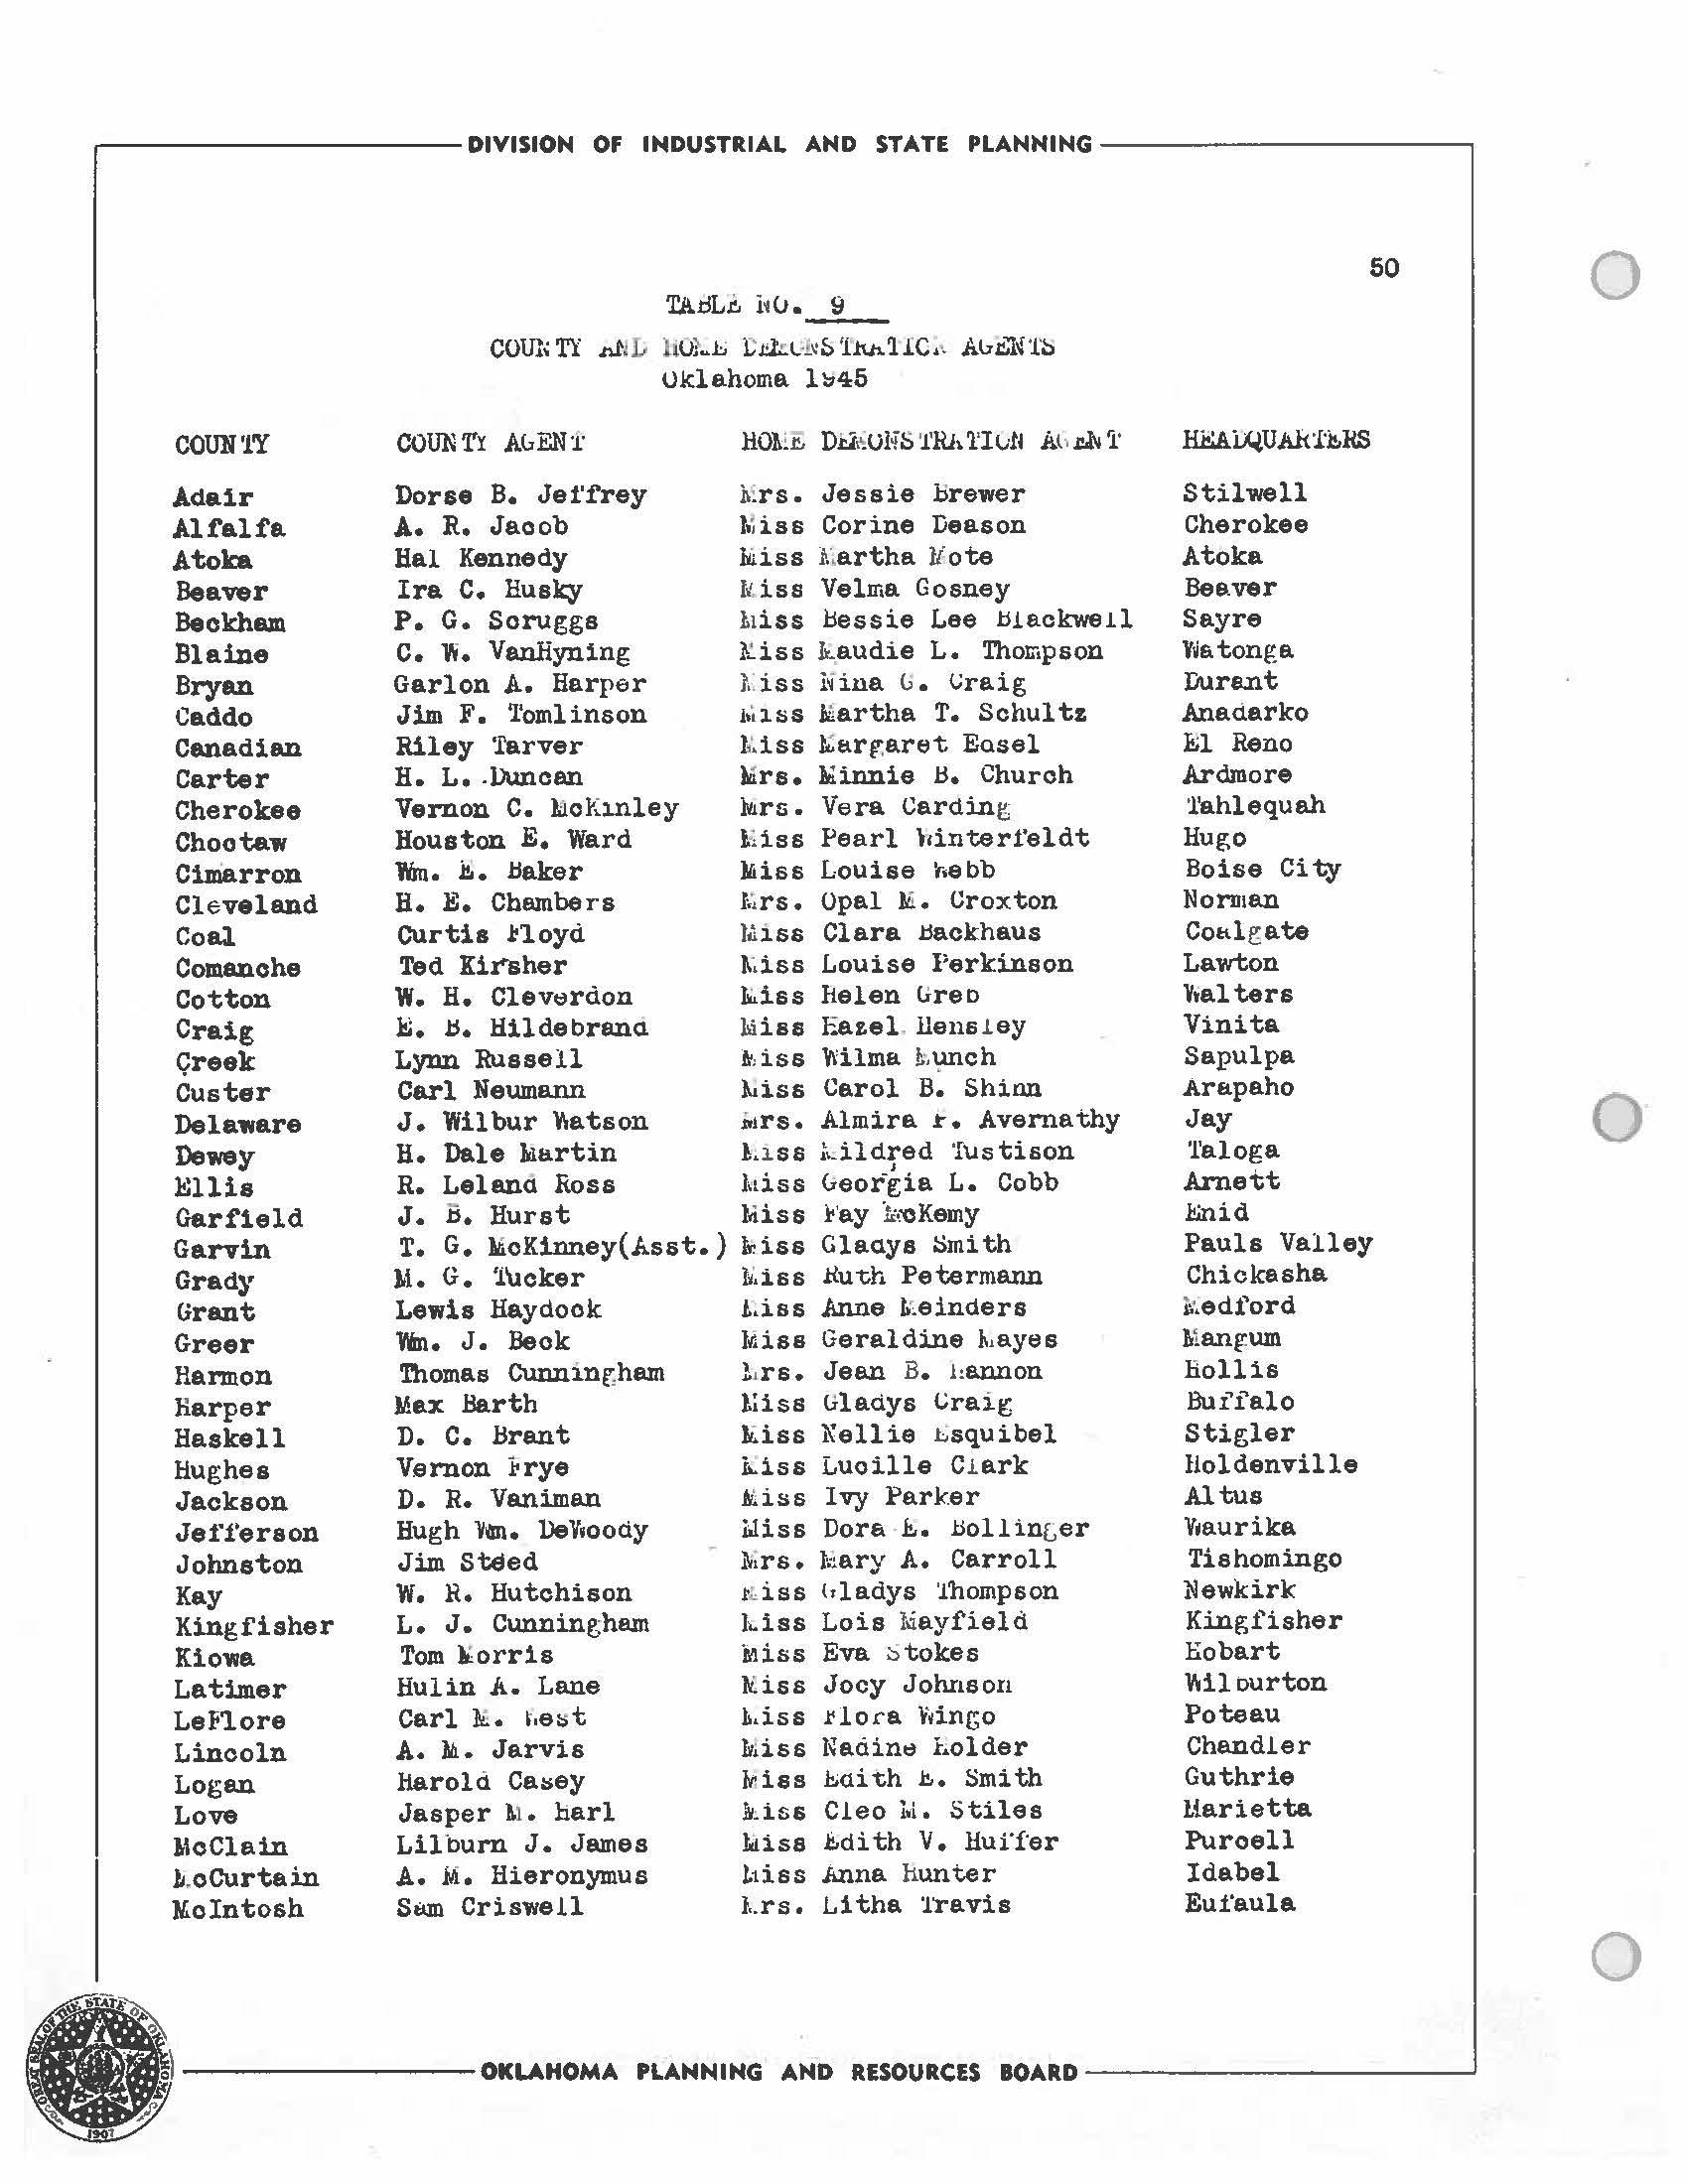
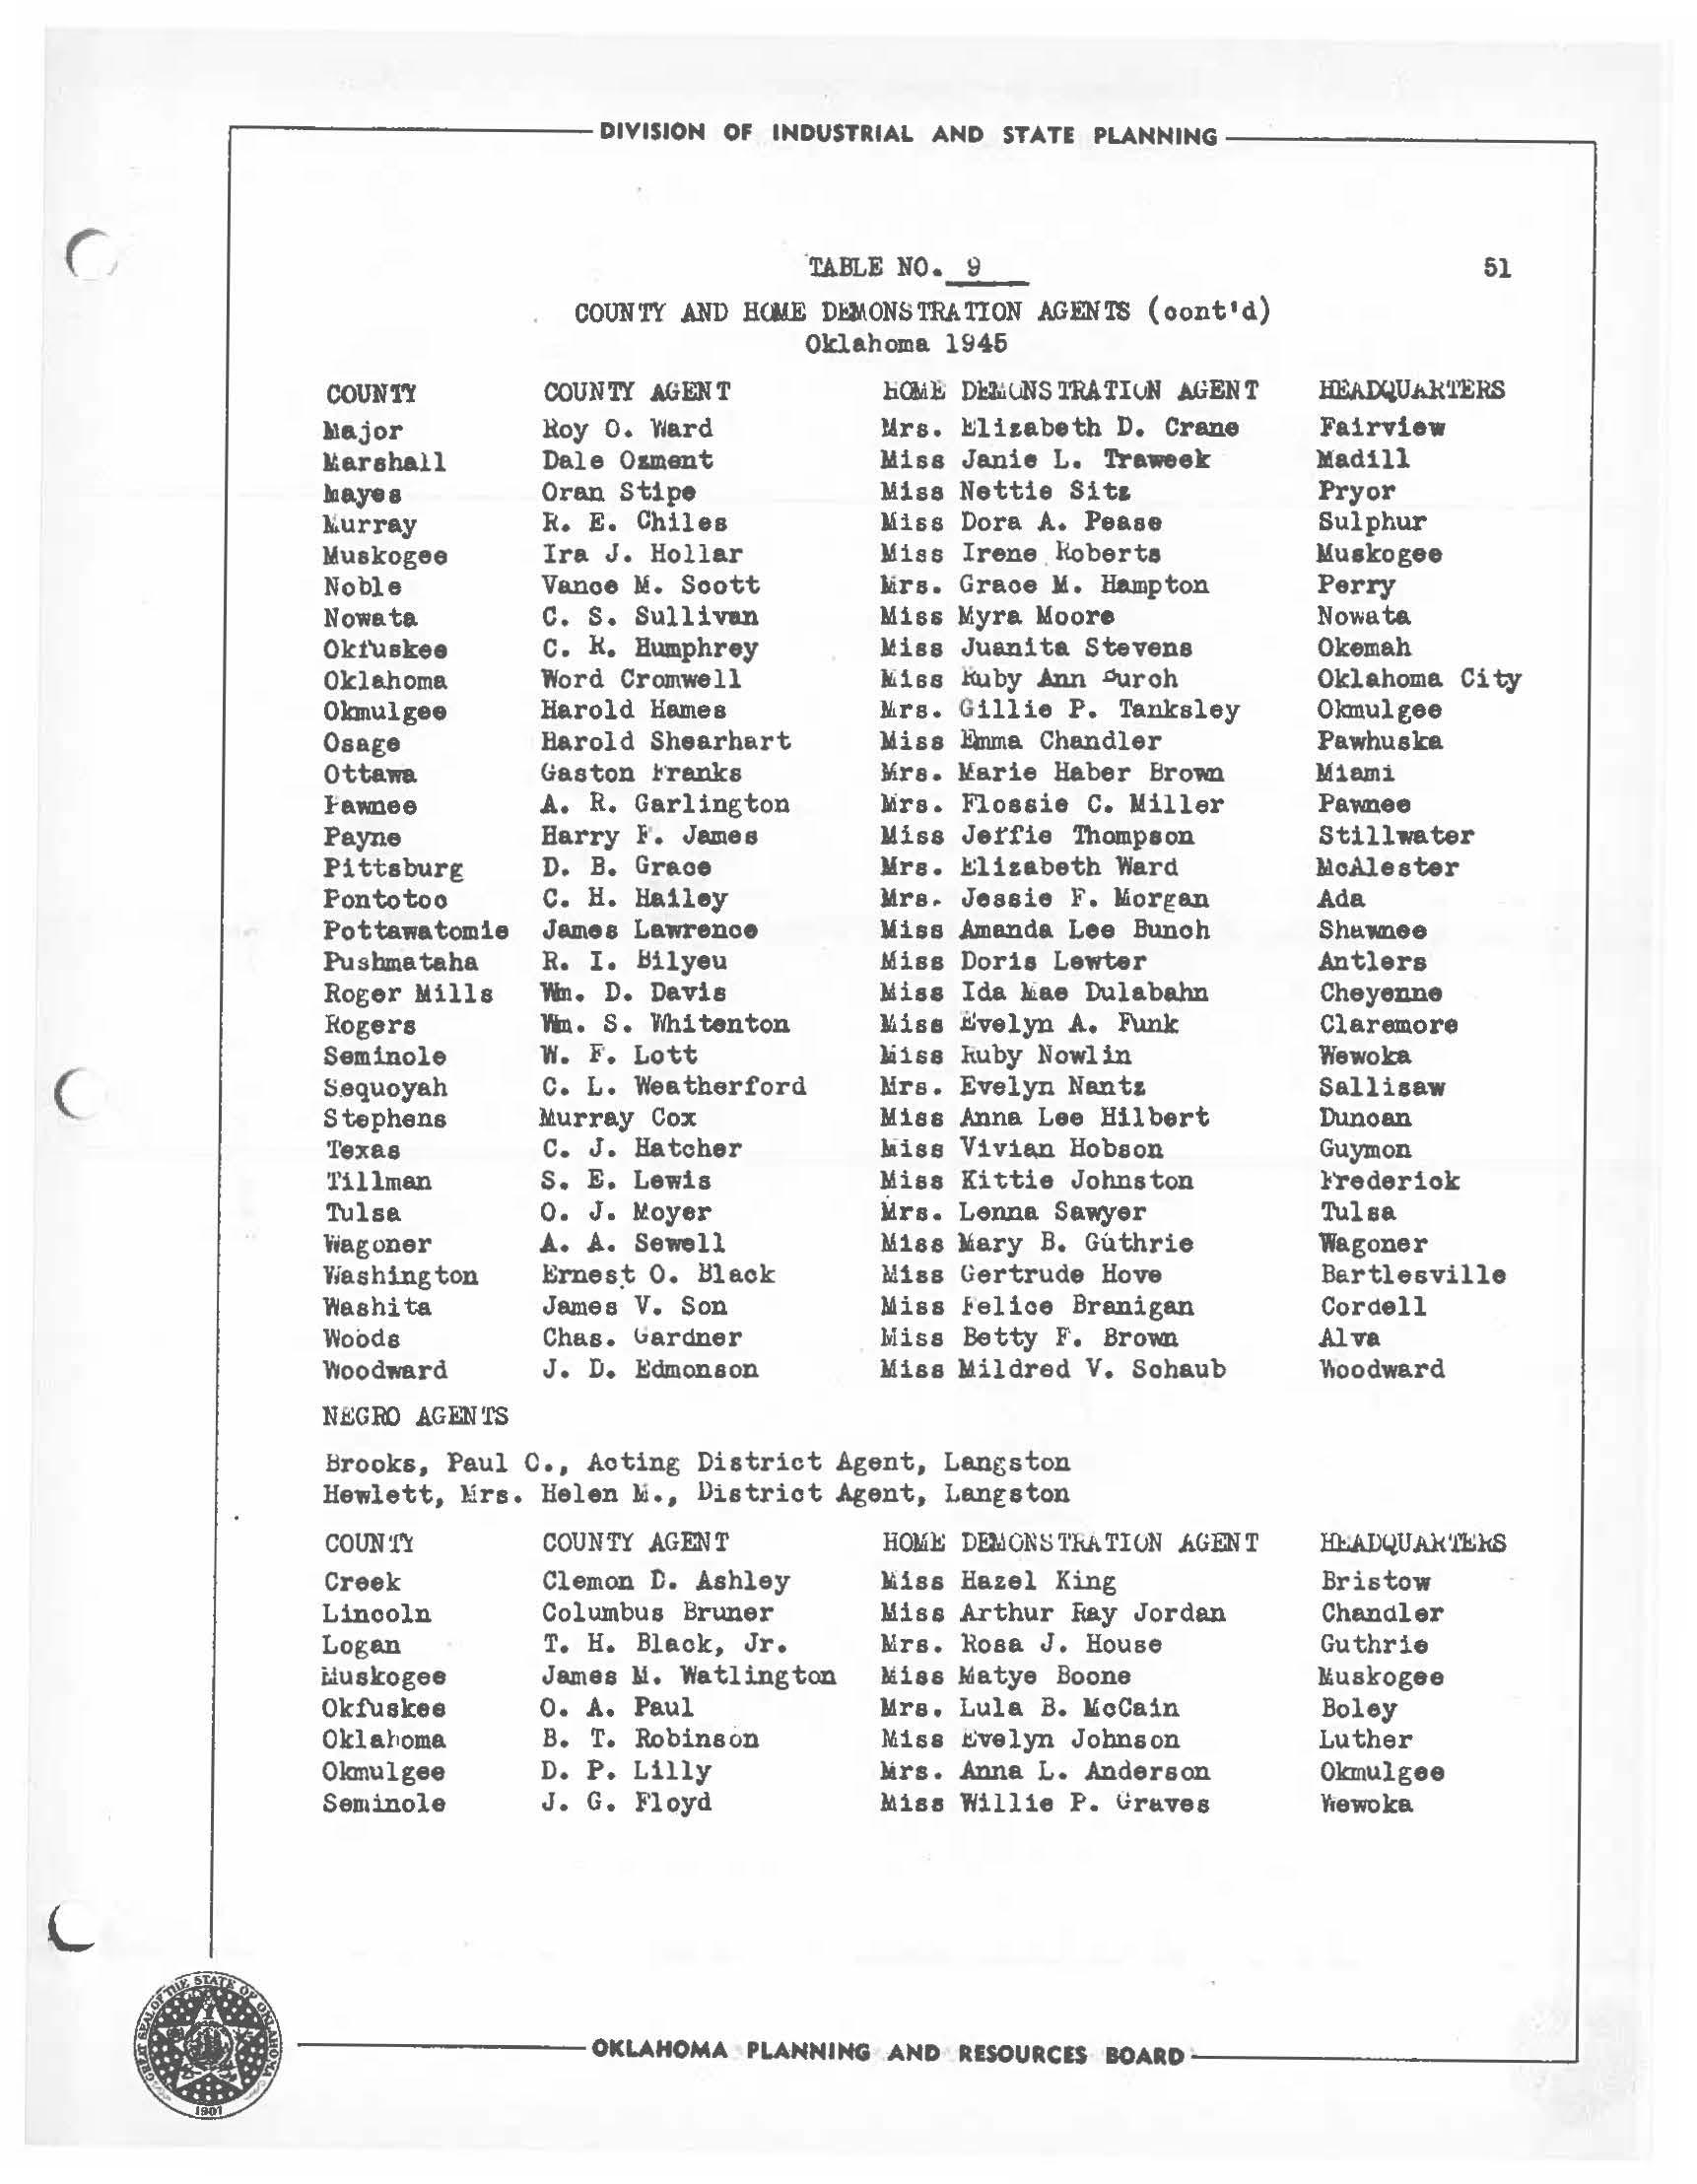
The Agricultural Extension Diviaio~ ia operated cooperatively by the A. & M. College and the u. s. Department of Agriculture and financed both by the State and the Federal Governments. The purpose of the service of this Division is to carry the results of reaearoh oomiuoted by the college eond the !::xperiment; Station, and findings from other relie:ole sources. to t.he i'ann people of' the state in order to effect improvement in farm ~na home practices. In this work, through the efforts of the seventy-seven county and home demonstration agents, assisted by some 20,000 volunte~r farm neir,hborhood leaders, this service is carried in~o more the,.n 165,000 farm homes.
Al thout;h prociuction i'or war was given a place 01· par811\ount importance, the Extension Division has continue9, to place emphasis on its year-'round long ~ime progrem. A rew activities ~hich are typical or the work involved in this pro gram, bre described in ~he following paragraphs.
Soil Conservation. ~38, 948 acres 01' lana were terraced in 19431944 in the county arents' program, ~na 6,173 ponds were constructed. This ml:lkes a total of 2b, 503 ponds built to speoit'icat1on in Oklahoma during me period this progrwr. bas Deen in oper~tion.
Cotton In one variety cotton work, 15,284 members or oommunity organizations proctuced over 4,000 acres of approved cotton. '.lheae groups are organized around traQe centers ana grow only one variety cotton 1n en area to t;he gin.ninf of which one i1n agrees ~o devote 1 ts rull i:;ime to prevent crossing of ai1'1'eren~ vt1.rieties.
,----------- DIVISION OF INDUSTRIAL AND STATE PLANNING----------38 EXTENSION DlVISION
OKLAHOMA PLANNING AND RESOURCES BOARD------------J 0 0 0
Ali'alfa Program. In the approval of origin alfalfa seed program, 2,419 farmer members cooperated in this program during 19431944 in the production of over 100,000 aorea 01' approved seea. A premium price of !'our cents t1. pound was paic. l'or 'these seea v,hioh represented a net gain of about f500,ooo.oo to 'the growers.
Victory Garaens. County t1.n<1 home demon~trt1.tion agents placed special emphasis on the cu.1. t1Vt1.tion ot' home gt.rdens and. ~24, 604 gardens we1·e oared for in the t1ta.~ under this prorram. l'hese a<1ded greatly 'tO the home food r.upply which in 'turn releai,ed more 1·00<1 for military and civilian needs.
Canning and .Preservation. Home demons-eration reco1 as sr,ow that, during the years 01· 1943-1944, the f't1.rm women of the s'tate canned over ~eventy-t.wo mil lion containers 01· 1·rui 'ts ta.n!J vegett1.ble s. Sixty two mill ion pounds oi" gi;.rcten tl.llci oi·chard J.,roauce were s wred. Also in freezing lookers, by dry1ng, c nci o-che, · muthod.s, tm atidii:1onal thirty mill.ion pounds ol' rood stun were stort:td.
4-H Clubs. 4-H Cluo memb"rs, under the airec-cion of the county and home demonstration a;;ents, ene,a[e in soiJ. conservo. 'I.ion -work, production ol' crops, lives'tock 1;,.na dairy rroctucts.
Hoo<1 l<elief.In 'the sprint; or 194~, re.vaging floods <11d more ct~blge .:o eas terr. ukla h or.1a chan 1;_ t. any t.ime in the pt.st onti hunctred yei,.rs. lhe i..x.:e:n.,ion uivision moo111zea all availtt.bie sourot1s 01· rr.tmpov.er .:o cirect activ11;1es or the recle.r:ie.tl.on
e.na rehuoi1i1;at1on rro f ; •t:JTI in -che 1lcGcte l.! area. Jin emere_ency oli·ice was aet up in Liuako t; ee l.t,d e1l availaole exteni;ion personnel v.ere assigned to tma opere.tea l'rom 1;hi,t poi.nt.
C ( ' ~---------- DIVISION OF INDUSTRIAL AND STATE PLANNING----------------, 1 'tf1 39
\ - - OKLAHOMA PLANNING AND RESOURCES BOARD - - - ----------J ¢)
J.o·~ Labor. This emergency si tuu1.ion \~a,, caused oy i.he severe drain or au,i.npowe1· 1or tnc, mu i ""1 y services e.no ror v.01 K :m 1nuus tr1.al war plants, .net was wi'Chou1; aouot the mu 1. :serious .,hor1,e..; e 01· mt.lllpower
th11.t 0kt11homa atricuL &u1·e has· eveJ· known. Ar-cer 1,, carel'ul survey 01 ' th~ situation, the 1!.xtens ion u1. v1.:s J.On >n-tt.s aole to shii t mtlLDpower i'rom one 1:·egion to ADo"&lu:,r to hand.le -i;ht, helrve.-. 1, 01· crot s. Sinoe ,June 1~4~, large numbe;•s have been recruited unu ;- J.aceu .. i.,h ar:ni:;rs in 1,h.,, s t.a"° (,0 &.aaist in thto ii• OUUC'&ion .:a.na h~rvestin;; 01' Cl ops. AS a result 01· this acl.ivity, bum.per ~he" t crops wei·~ rumd."ted uul' lllf. oo~h 194;, and l:i/44 in i·ecord time i:i. spite or -i;he severe munpower shor-cage a.no millions 01· dollars 01 crops ~ere Sla.Ved 1·rom d tllllc,.ge ana loss.
.------------ DIVISION OF INDUSTRIAL AND STATE PLANNING -------------,
40 0 0 0
CROPS
( - --OKLAHOMA
-----------~
PLANNING AND RESOURCES BOARD

0 0 0 ---------OKLAHOMA PLANNING AND RESOURCES BOARD-------------'
\1liEA '.l'
'l'he ! roauction oi' wheat is the dominant agricultural enterprise in the northwEistern one-third of Oklahoma (li'i{;ure No. 12 ) anci is the state's most l.l!lportant agricultural cash crop. ln this ar~a the return i"rom 'the wheat crop detenuint.is the proaperi ty oi' the farmers.
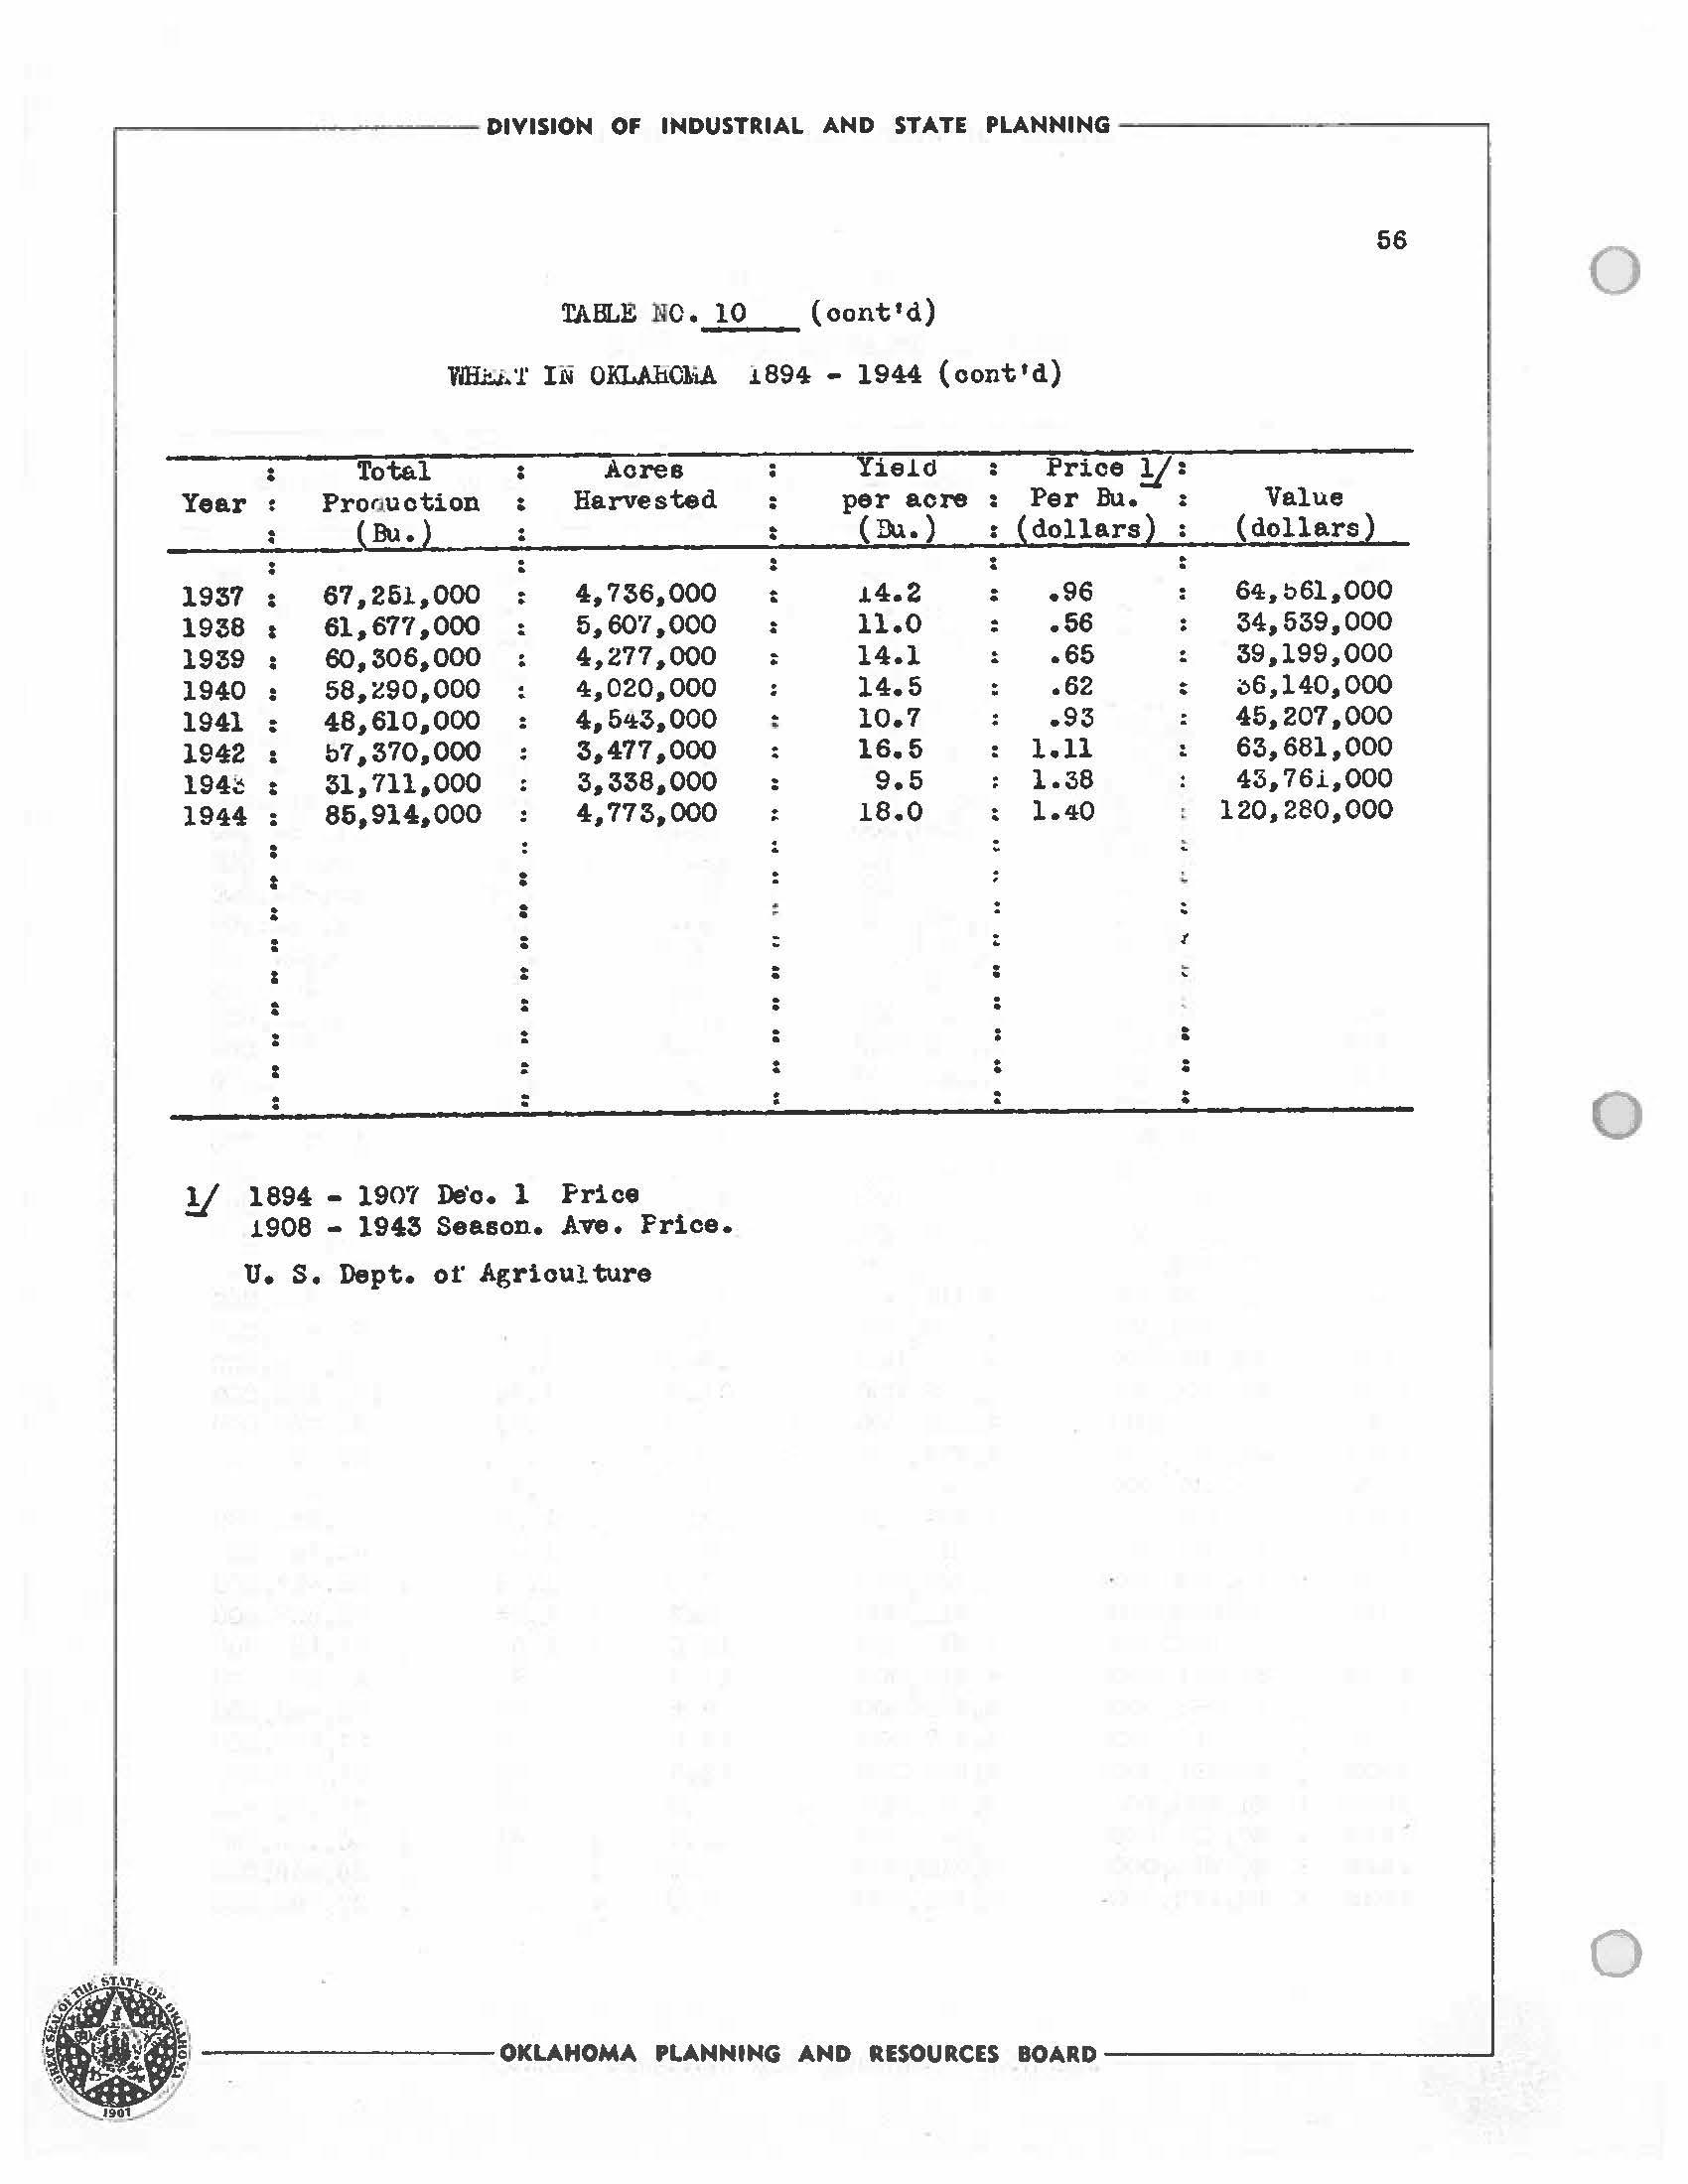
'£he Okle.homa v.heat crop fluctuates widely i'rom year to year aoooraine; to ,vea.ther conditions anct <ieme.na. The 1944 crop oi' Bb,914,000 bushels valued at tl20,280,0UO is the largest on recora. The smallest orop in the last "twenty years was that of' 19;;6 when 28.,27t,OOO oushels -were harvested.
Nineteen Oklahoma counties were among the 100 ieadmg wheat prouucint; counties 1.n l~;;~. Gari'leld, Grt:lnt and .hlfalfa placed thira, fourth ana seventh respectively.
In l!:144 Oklaho1:1a ranked third among the s-cates in the production ot· wheat ·oeing exceeattd only oy North Dakota and Kansas.
The area in Oklahoma where wheat growing has developed is in many ways v.ell suited i'or -chis type of' H~rming. 'l'he soil .i.s fertile, with a re1ai;ive1y rine texture, and with 'the exception of occasional drought periods 'the rain1·au is sui"l'icient to .ravor a good crop. The 1eve 1 rolling .!. and permits i;he use or moaern mu.chines in the plo-wing, so-..r.i;'.J.?; und ri::apint; 1.1nc. h"-s greatly i11croased the use or comoine3 and other equipment.
'!'he ht1rd v,inter varieties of wheat grown in Oklahoma have e. high protein vaJ.ue ana i'ind a ready 1riurket.
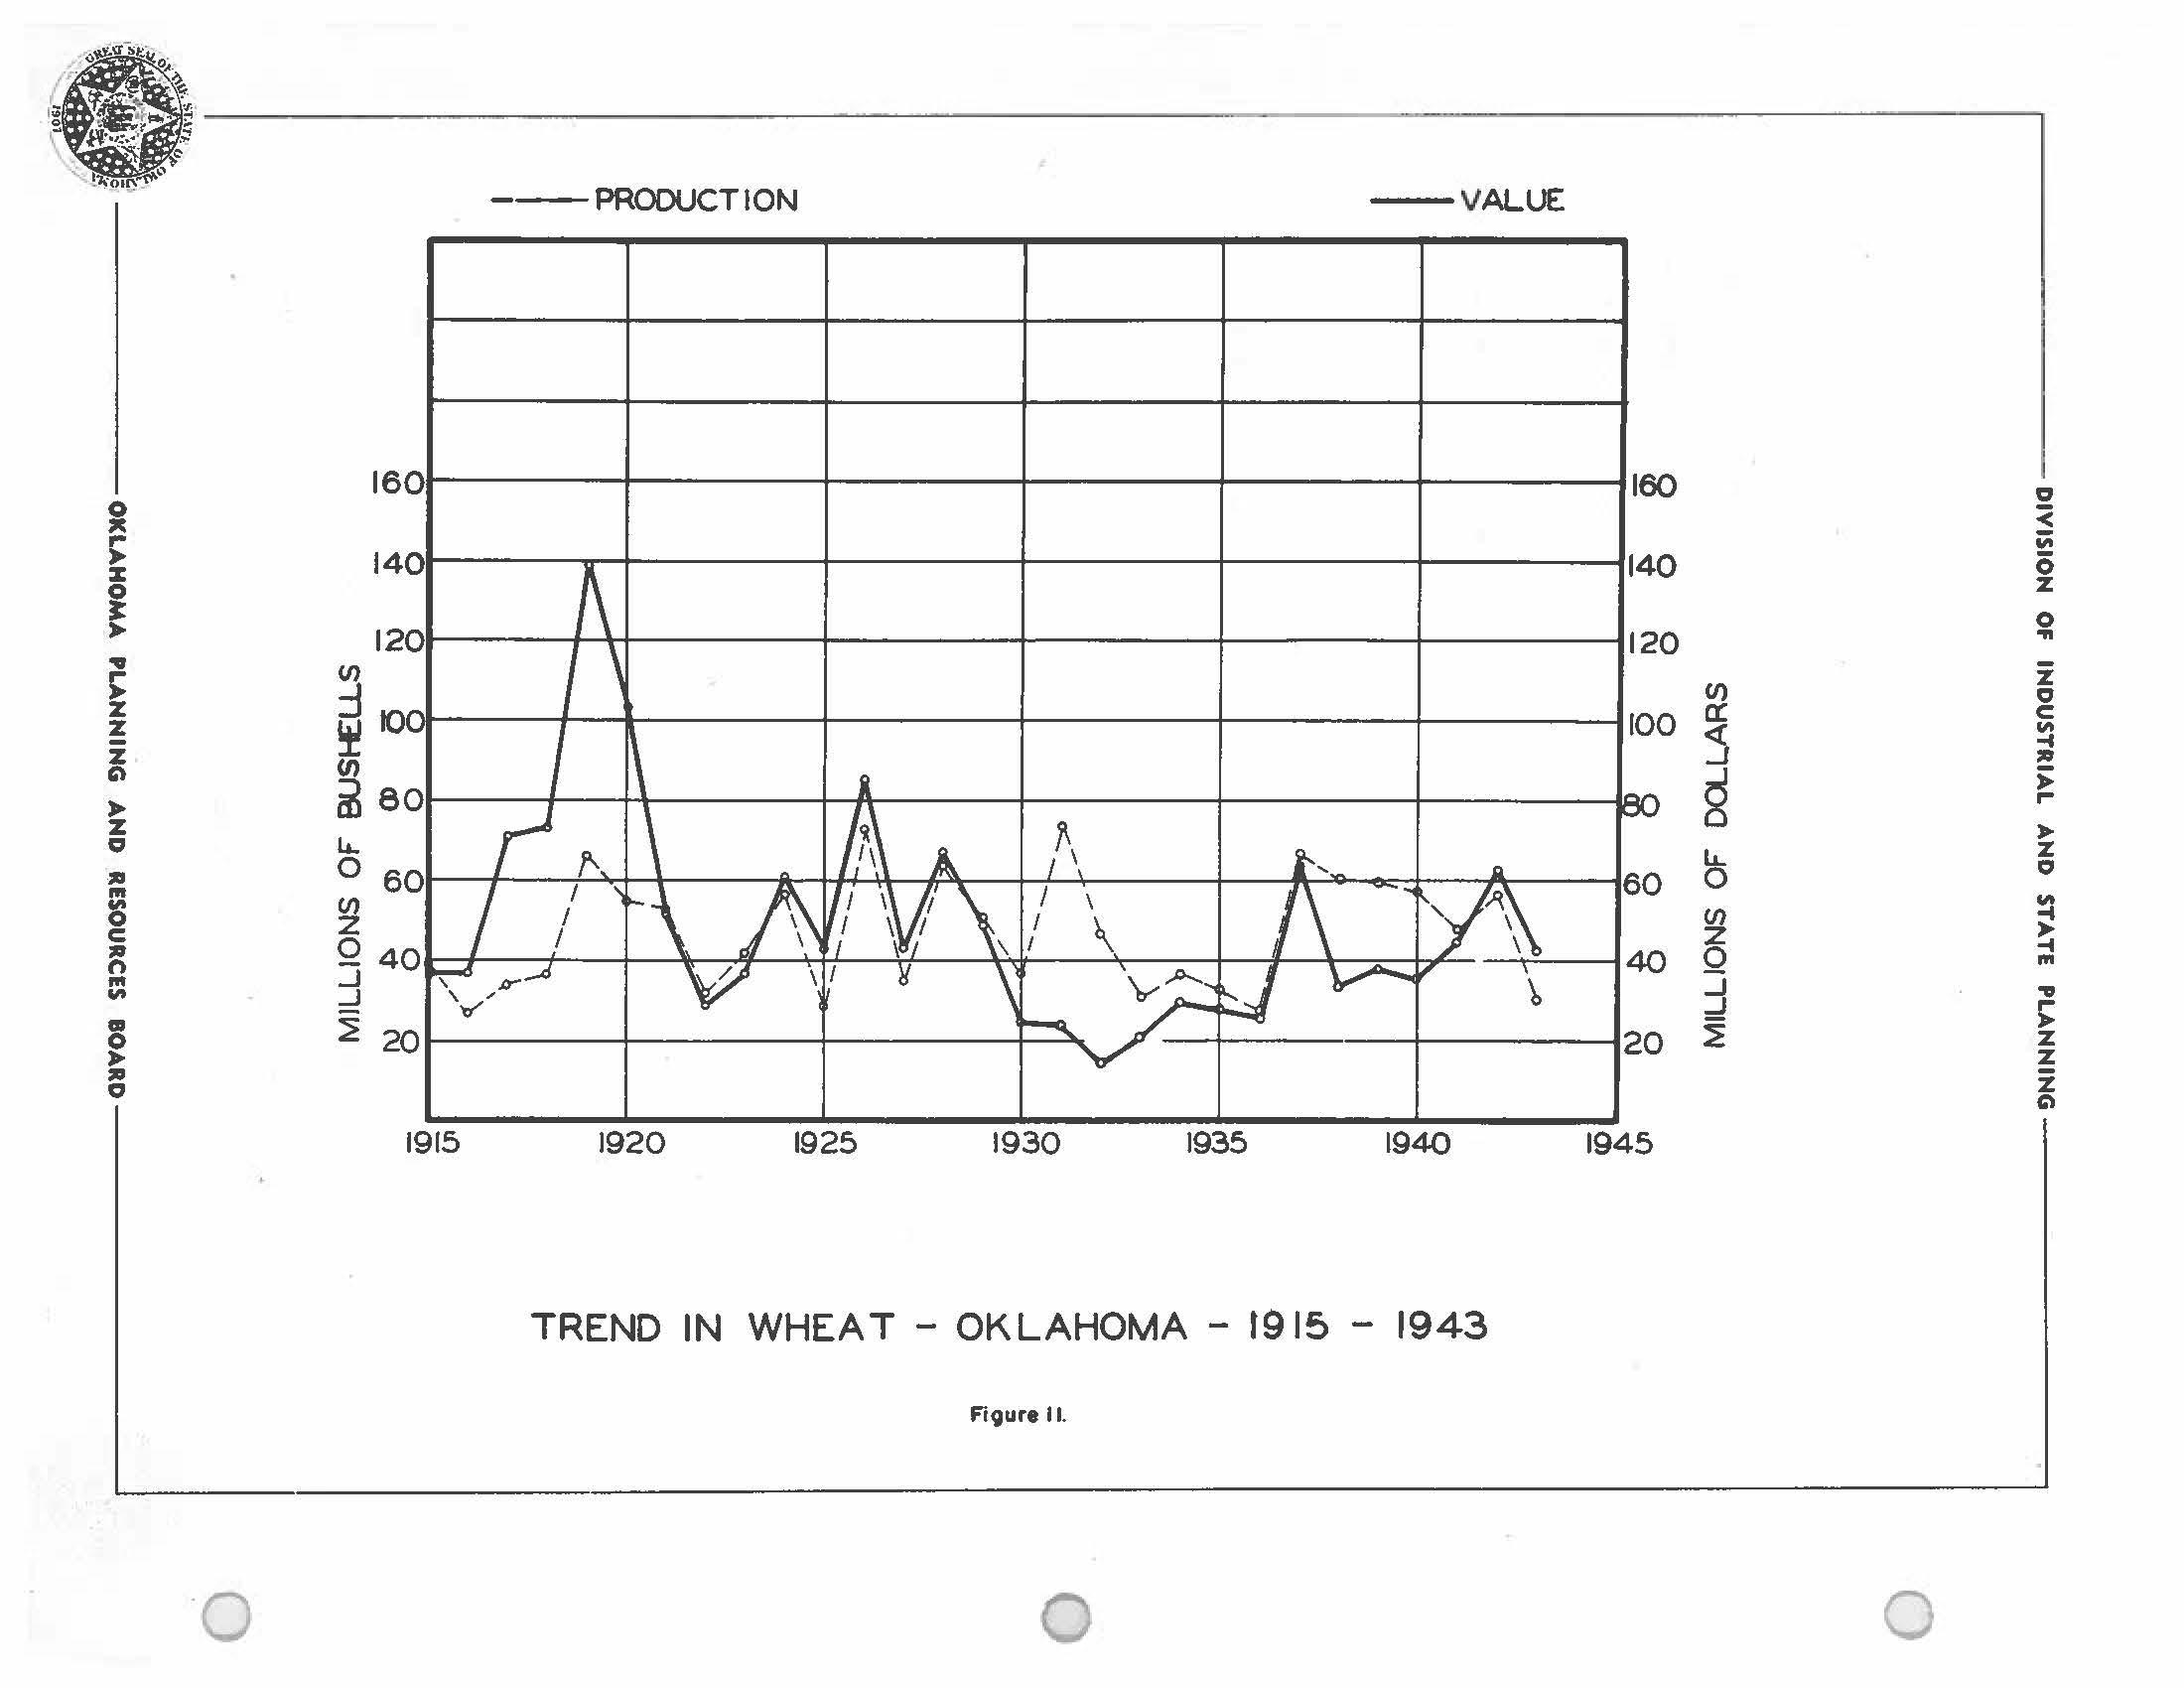
'!'he trena in proctuction e.na va 1ue ot· wheat, 1914-43 is snoffll on rigure No. 11. Annual proauct.ion aata t'or wheat oy yeari; is given in Table No. 10 and acreage, product1c;n 1;.na yield data oy counties for 1944 is given in Table .No. 11 •
( -----------DIVISION OF INDUSTRIAL AND STATE PLANNING--------------.
t>3 --- ------OKLAHOMA PLANNING AND RESOURCES BOARD-------------'
t~-~-K\ ,~ ~'!f - -----•·. 0 :z: ! z z C) z 0 lll is C ffl 11,/t CD 0 lll 0 ·o 0 16 141 121 Cl) K) (I) me, 4. o e, 04 ...J 21 ) 1915 --PRODUCTION -VALUE '!-, 1920 1925 1930 1935 1940 TREND IN WHEAT - OKLAHOMA - 1915 - 1943
11 0 I I• I 160 ,0 0 ,Q 40 :o 1945 Cl 3 "" 0 z 0 "' Cl) i a: 0 :5 C "" --4 ,, 8 ;; ,.. 4. 0 z 0 Cl) z 0 ?t "' ...J ...J z z z C'I 0
Figure
TABLE NO. 10 r,~T rn OKLAHOMA 1894 - 1944

.------------DIVISION OF INDUSTRIAL AND STATE PLANNING-----------, C 66
Total A.ores 1 Yield : Prioe!f a Year Production : Harvested per e.cre Per a.. Value (Bu.} i Bu.) (ciolhrs l 1 ~dollars} : . : : . 1894 : :s. 750,000 . 250,000 15.0 .61 1,1112.000 . 1895 2.i::00.000 27ti.OOO 8.0 .48 1,056.000 18~6 2.,so.000 G50,000 : 9.0 • 68 .1,6~0.000 1897 11.100.000 650,000 18.0 .·,e 8,892.,000 1898 17.400.000 : 1.200,000 14.5 .52 9.048.,000 1899 20.309.000 1.627,000 13.:S • 5:5 10, '/64.0QO 1900 24,480,000 1,530,000 16.0 .53 12,974.000 1901 20,860,000 1,490.000 14.0 .64 13. ;,bo.ooo 1902 19,3io.ooo 1,610.000 12.0 .b9 ll,~99.000 1903 ~l.9~0,000 2,280,000 14.0 .64 ~0,4.::9.000 1904 20.9~0,000 l,li~0,000 11.5 .94 .19.674,000 1905 17 .460,000 1.940.000 ~-0 .70 l.2,i::i::.::,000 l!:J06 23.936.000 l, 760,000 13.6 .bo 13.,404,000 1907 9.880.,000 l.,040,000 ~.5 .83 8,200.000 1908 16.330,000 l,4i::O,OOO : ll.5 .87 14,i07.000 1909 14,028,000 1,169,000 u.o 1.06 14,870.000 1910 22.,950,000 l,b30,000 i.5.0 • 8\1 20,4G6,000 C 1911 ~,440.000 1,180,000 8.0 .88 8,307.000 1912 21,f>U0.,000 l,7iU,OOO l.::.b .79 16,985,000 1913 16,4~0,000 1,940.,000 8.5 • '/6 12,b.:>G,000 1~14 45,850,0UO 2,6GU,OOO 17.5 .87 .:.l:1,890,000 1915 38,b00,000 3,080,000 lG.ti .97 37,.:,45,QOO 19!6 27,265,000 2,870.000 9.b i.. 38 37,tiG6,000 1917 3'>:.,100,000 3,lOU,000 11.0 i::.10 7l,610,000 1\:118 M,800,000 :,,;::00,000 11.5 2.01 7;),968.,000 1919 66,052.000 ; 4,7!8,000 14.0 2.10 1;,c1, '/09 ,000 1920 St>,905,000 3,727,000 15.0 1.84 102.,865.000 1921 5:,,.100,000 4,100.000 13.0 .99 5G,767,000 1922 32,062,000 3,772,000 8.b .92 29,497.000 1923 4i::,;,l7,000 6,847,000 11.0 .88 3'( • 2~9 ,000 1924 b7 .,lU,.,000 3,684,000 ; 15.5 1.07 61,099,000 19.::5 ~9,96.:>,000 ;,; :,. 61U.,000 8 • .:: l.4o 43,746,000 1926 7-.:i, 644,000 4,;s3G,000 .17.0 1.16 85,4~7.000 1927 ~t>,(.)70,000 .:.,8.l.G,000 9.2 l.~5 43,8~8,000 19~8 64,b82,000 4,613,000 14.0 1.04 67,165,000 1929 bl,,51,000 4,567,000 11.2 .96 49,201,000 1930 37,382,000 3,935,000 9.b • 68 i::5,4G0.,000 1931 74.919,000 4,407,000 17.0 .33 : 24, 12;s,ooo 1932 47,b9,,000 3,!:l66,000 12.0 .32 15,229.,000 1933 . 31,549,000 3,093,000 . 10.2 • 68 : 2l,4b3,000 . . 19:54 37,20<::,000 0,543,000 10.5 t .81 t :,0.,1.:>4,000 J.9~5 3:,,so0,ooo 3,.:,60,000 : :i.u.o : .86 t 28,948,000 1936 28,27<::,000 .:.,b;,4,000 8.0 .99 1 27,989,000 l. ' OKLAHOMA
, -~r ~. -~ 19.,
PLANNING AND RESOURCES BOARD
..----------- DIVISION OF INDUSTRIAL AND STATE PLANNING ------------, 56 0
(oont'd) Vffiu-;.1' t:N OKLAhCliA J..894 - 1944 (cont'd) : Total Aoree Yie1c1 : Price y: Year Pro rJ.uotion : Harvested : per acre : Per Bu. : Value (Bu. 2 : (lli.) : ~dollarsl ( t!_ollars l : : 1937 : 67,261,000 4,736,000 : .14.2 : .96 64,061,000 1938 l 61,677,000 : 5,60'/ ,000 : 11.0 .56 34,539,000 1939 60,306,000 4,277,000 : 14.l .65 : 39,199,000 1940 58,290,000 4,020,000 14.5 .62 : ;:,6,140,000 1941 : 48,610,000 4,543,000 : 10.7 .93 45,207,000 1942 : b7,370,000 3,477,000 16.5 1.11 t 63,681,000 194!: : 31,711,000 3,338,000 9.5 l.36 43,76.i.,OOO 1944 : 86,914,000 4,773,000 : 18.0 1.40 120,280,000 : : : : : t : : t : : : : : : : : : : 0 !/ 1894 - 1907 De'o. l Price 1908 - 1943 Season. Ave. Price. u. s. Dept. ot' Agrioul ture : •. 0 \ J ---------OKLAHOMA PLANNING AND RESOURCES BOARD -------------1 ...
TABLE No._1_0__

r 0 ;II; r % OKLAHOMA PLANNING a RESOURCES BOARD 0 .,, rz z SCAU" -STIITI/T£ 1-ILIS z w 0 0 10 20 30 +o so DISTRIBUTION OF WHEAT z 0 1944 :a Legend ... "' 0 C Planted Acreage :a n I I ... "' 0-9,999 1D 0 10,000-99,999 :a C, 100,000-199,999 2 00,000-299,999 - 300,000 and Over I"', . CHOCTAW
J (11 ...;i C, < ij; 0 z 0 ... z ICI C "' -4 :a ;;: rz 0 "' -4 -4 ffl .,, z z z 0
Figure 12.
TABlE NO. ll CKLAhvr- :A "tiliEAT Acree.ce, Yield, froouction--1S44 by Counties
Flanted I Harvested Yie M.-·p-er :Yield per, County : Ji.I! reef e Acrear,:e planted acre :Harvested i (acres) (acres) ( bus Le ls) : acre : Production : (bushels) : ( bushels)

.-----------DIVISION OF INDUSTRI.AL .AND ST.ATE PL.ANNING-------------. 58 0
·--Adair 2,600 2,400 16.6 16.0 43,100 Alfalfe 281,000 268,000 19. 3 20.3 5,432,000 Atoka 300 300 8.7 8 .7 2·,600 Bee.ver 292,000 257,000 16.2 18 .4 4,716,000 Be ckham 41,000 38,000 14.8 16.0 607 ,ooo i::Ue. ine W9,000 : 181,000 19.7 20.6 3,724,000 Bryan. 1,300 1,100 11.s 14.0 15,400 Caddo 81,000 73,000 15.2 16.9 1,233,000 Ce.na.die.n 150,000 140,0(•0 16.e 18 .o 2,523,000 Carter 1,600 ' 1,500 rn.e 20.3 30,500 Cherokee 4,200 3,900 13.5 14.5 56,700 Ch octaw Cime.rron 202,000 145,000 14.0 19.4 2,818,000 Cleveland 6,200 5,600 15.4 17 .1 95,500 Co&l 600 500 9.0 10.e 5,400 Con a.nche 47 ,ooo 41,000 12.7 14.6 598,000 Cotton 67,000 61,000 15.5 17.0 1,040,000 0 Crai g 9,800 9,200 10.8 11.5 105,000 Creek 1,200 l, 100 9.6 10.7 11,600 Custer 181,000 166,000 17 .4 18 .s 3,142,000 Delaware : 9,500 8,900 9.1 : 9.7 86,100 Dewey 136,000 130,000 16.6 17 .3 2,255,000 Ellis 146,000 137,000 15.2 16.2 2,216,000 Garfield 328,000 314,000 17.5 18.3 5,743,000 Gervin 7,100 6,200 14.8 17 .o 105,400 Crady 44,500 39,700 14.l 15.8 627,000 Grant 323,000 30u,OCO 19.2 20.3 6,201,000 Greer 48,000 42 ,ooc 11.3 12.!? 543,000 1:l arrnon 50,000 44,000 9.8 ll.l 489 ,ooo h e.rper 168,000 159,000 16.3 17 .3 2,745,000 I-iaskell 300 300 16.0 16.0 4,800 r;ut hes 200 200 14.C 14.0 2,800 Jackson 103,000 90,000 10.e 12.3 l, 111,000 Jefferson 5,500 4,800 14.0 16.0 76,900 Johnston 800 700 14.6 lG.7 11,700 Kay 207,000 200,000 16.8 17.3 3,468,000 K::.r-i: fishor 243,000 227,000 17 .s 19 2 4,349,000 Kiol'ia l'l0,000 i 148,000 14 .1 16.2 2,398,000 Latirr.er 100 100 15.0 15.0 1,500 i.eFlora 800 800 15.0 15.o 12,000 tincoln 12,eoo 11,500 16.0 17 .8 205,200 l oc: an 60,000 55,200 16.4 17.8 963,000 Love 400 300 13.5 18.0 5,100 • 0
OKLAHOM.A PL.ANNING AND RESOURCES BO.ARD
TAB.LE NO. ll(cont'd) OKLAl-,Olii.A 'WHEAT Acreage, Yield, Production--1944 by Co\Ultie•
: :eie.nted Harvested 1 Yield per l fie la per I County l Acreage l Aorea{;e ,planted aeresHarve•teds s (acres) (acres) (bushels) I acre

-----------DIVISION OF INDUSTRIAL AND STATE PLANNING-----------, 59
I Production
1
1 (bushels) . : . ~ajor 158,000 149,000 16.7 ' 11.1 • 2,638,000 l'iarshall 500 400 12.4 ' 15.5 ' 6,200 l-iayes 13,200 12,400 12.5 13.3 164,600 k:cClain : 3,800 ' 3,300 13.8 15.9 : 52,500 licCurta.in McIntosh 700 600 11.4 13.3 ' 8,000 :tit.urray 2,700 : 2,400 16.6 18.5 44,600 :t.i.uskogee 6,300 5,400 13.s 16.l 86,700 Noble 115,000 110,000 16.3 17.0 1,871,000 Howata 13,000 12,200 12.2 13.0 158,300 Okfuskee 1,100 1,000 11.1 12.9 12,900 Oklahoma 30,000 : 28,100 16.7 17.9 502,000 Okmulgee 1,800 I 1,500 15.9 19.l 28,700 Osage 28,400 26,000 13.4 14.7 381,400 Otta~,a 11,500 : 10,800 14.7 15.7 169,300 Pawnee 13,000 12,200 12.4 13.2 160,700 ( .Payne 15,200 14,000 13.0 14.l 197,600 Pittsburg 400 300 15.5 20.7 6,200 Pontotoc 1,200 I 1,000 10.a 12.9 12.,900 Pottawatol:'lie 5,100 4,600 11.3 12.6 57,800 Pushmataha 100 . 100 15.0 15.0 1,500 . Roger llills 43,000 38,000 12.5 14.l : 636,000 Rogers 11,200 : 10,500 11.0 11.a 123,700 Seminole 2,100 : 1,900 14.3 : 15.8 30,000 Sequoyah 500 1 400 9.0 11.2 4,.500 Stephens 7,800 I 6,800 13.4 15.3 104,.300 Texaa 393,000 : 342,000 11.4 20.0 I 6.649,000 Tillman 140.000 ' 124,000 I 16.9 19.l ' 2,369.,000 Tulsa 10.000 ' 9,400 12.9 13.8 ' 129.,400 Y,egoner 12,400 • 11.100 11.7 12.4 144,800 \,ashington 5,000 4,700 13.2 14.1 66,.200 ,,ashita I 164,.000 152,000 17.4 I 18.7 2,849,000 Woods ' 221.000 218,000 18.4 ' 19.2 4.179,000 Woodward a 146,000 a 137.,000 14.6 15.5 2,129,000 Sources u. s. Department or Agriculture j OKLAHOMA
:
(b.ishela)
PLANNING AND RESOURCES BOARD
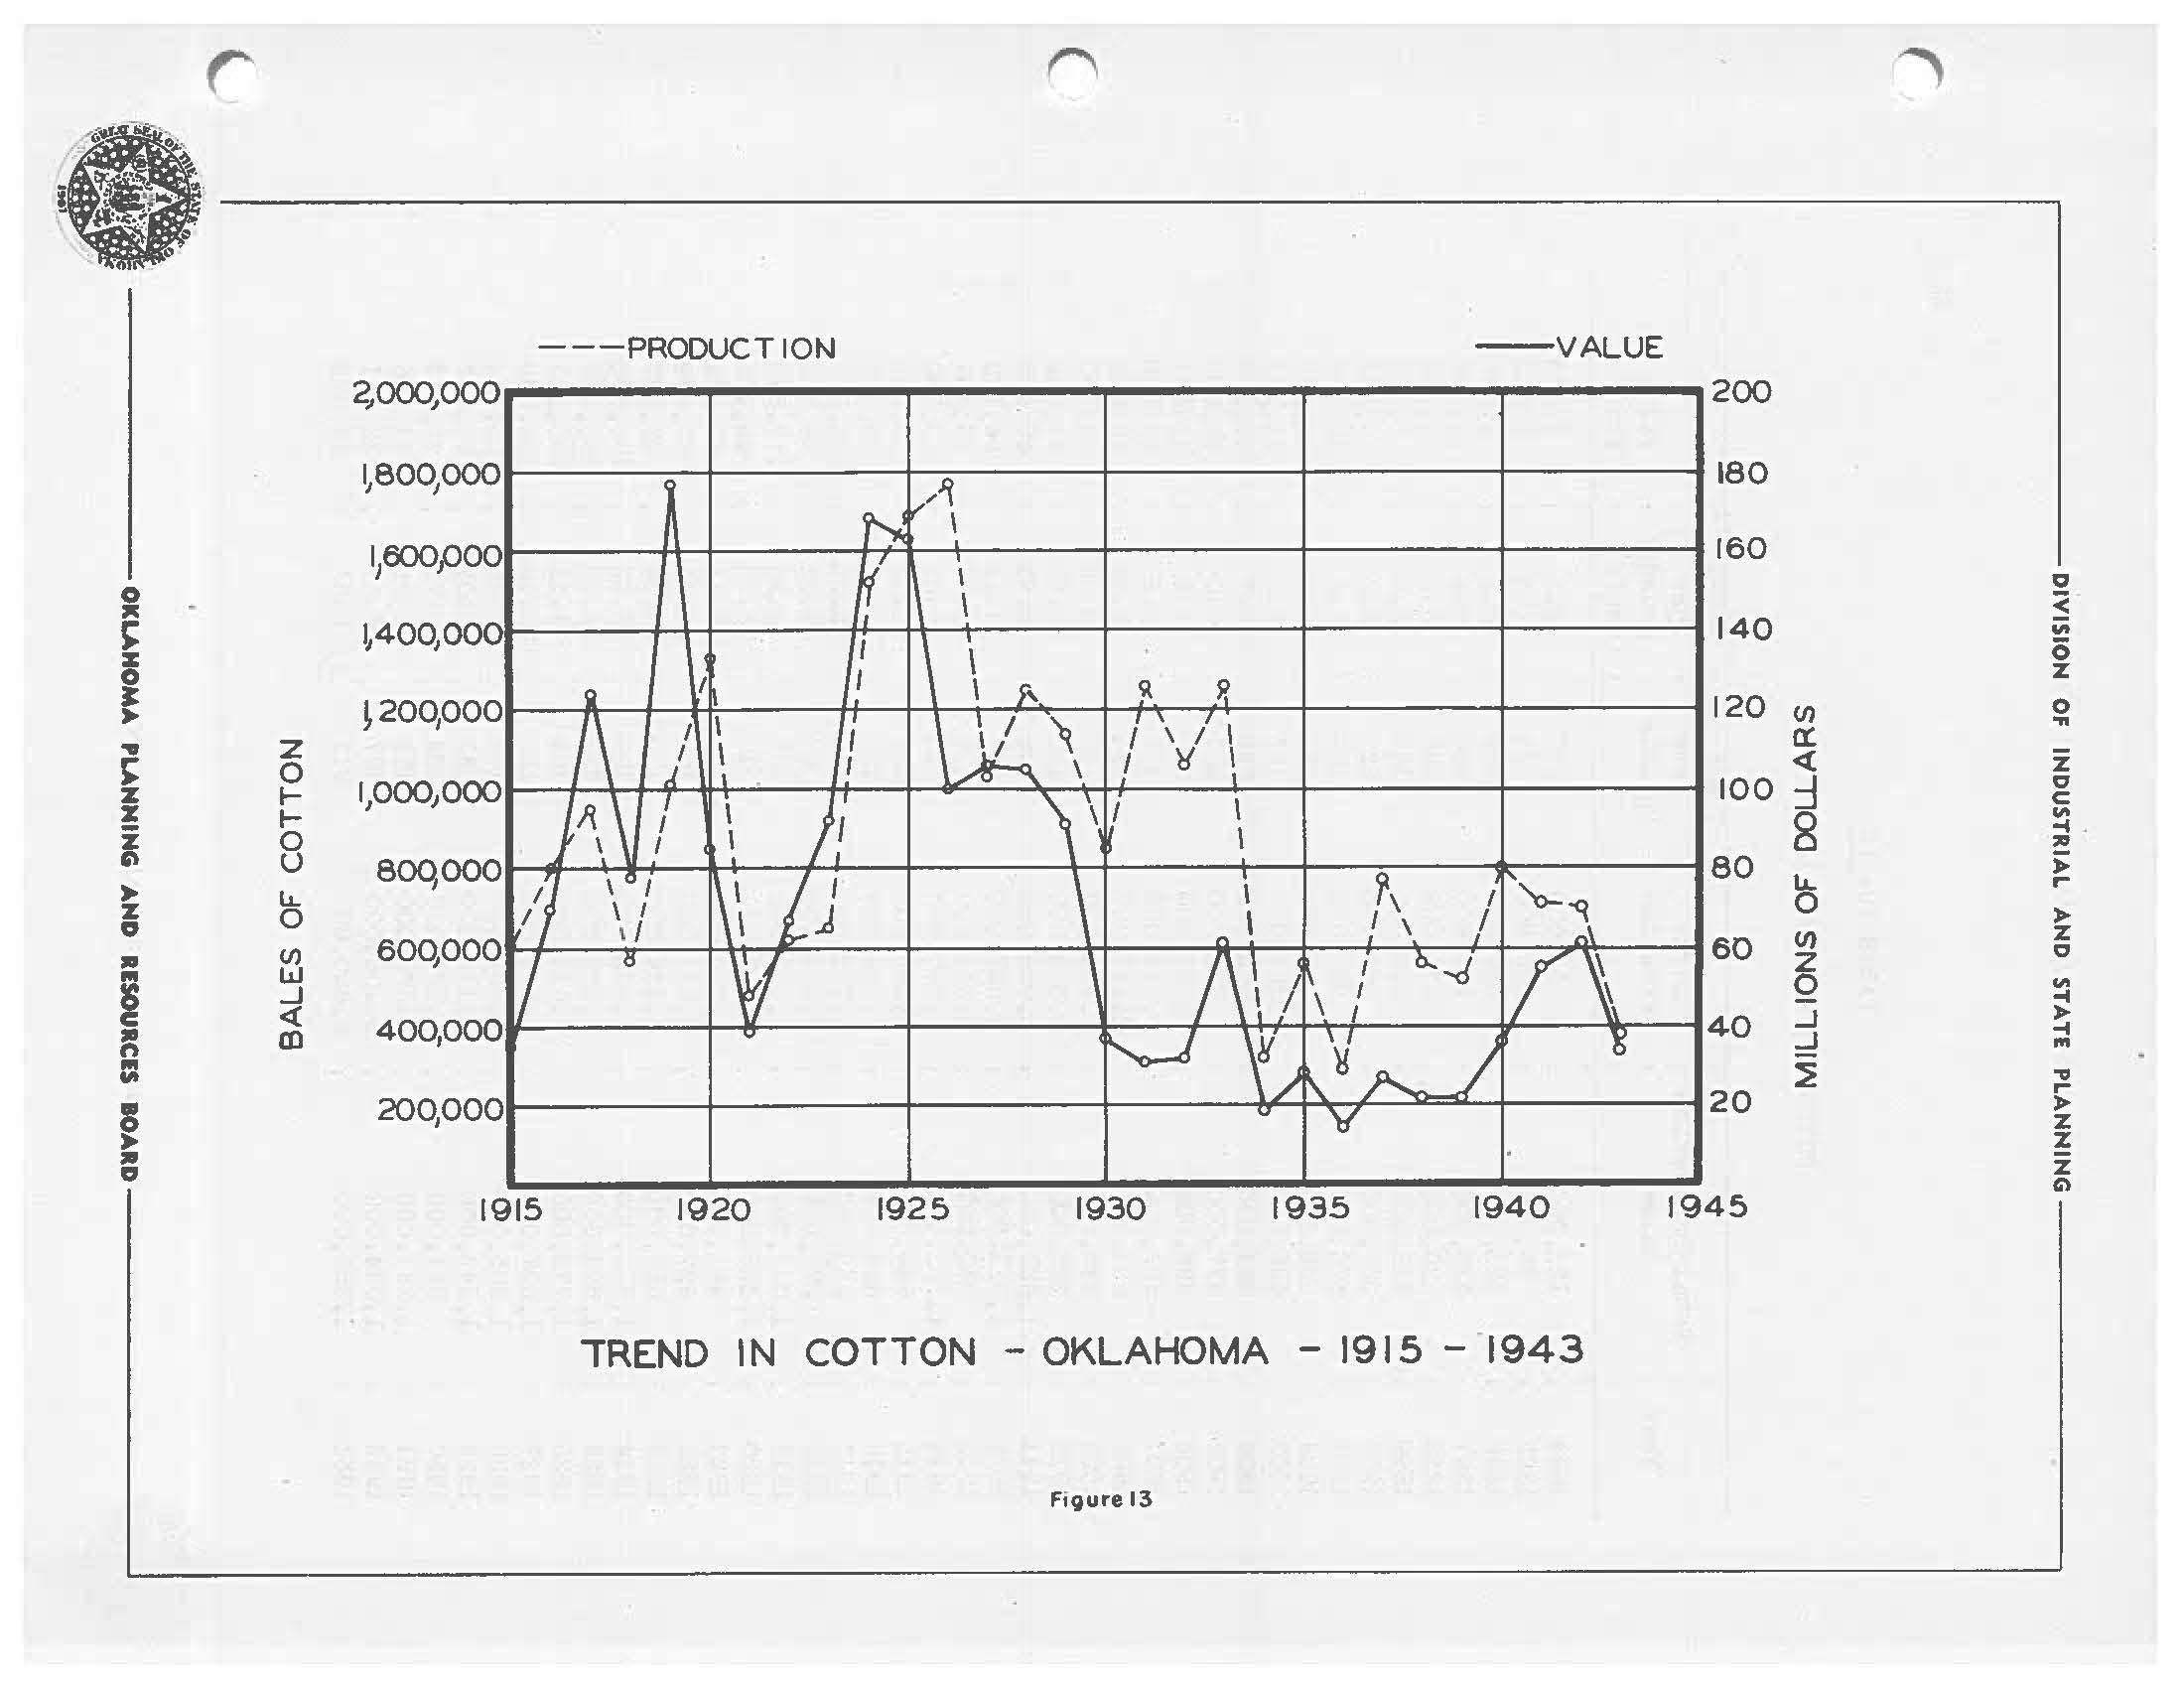
Cotton has been groYIIl in Oklahoma sine~ prior to the civil war and untii reoentl.y was the moi;t important cash crup. Since 1910 Oklahoma has ranked as one of the leading cotton froducing states.
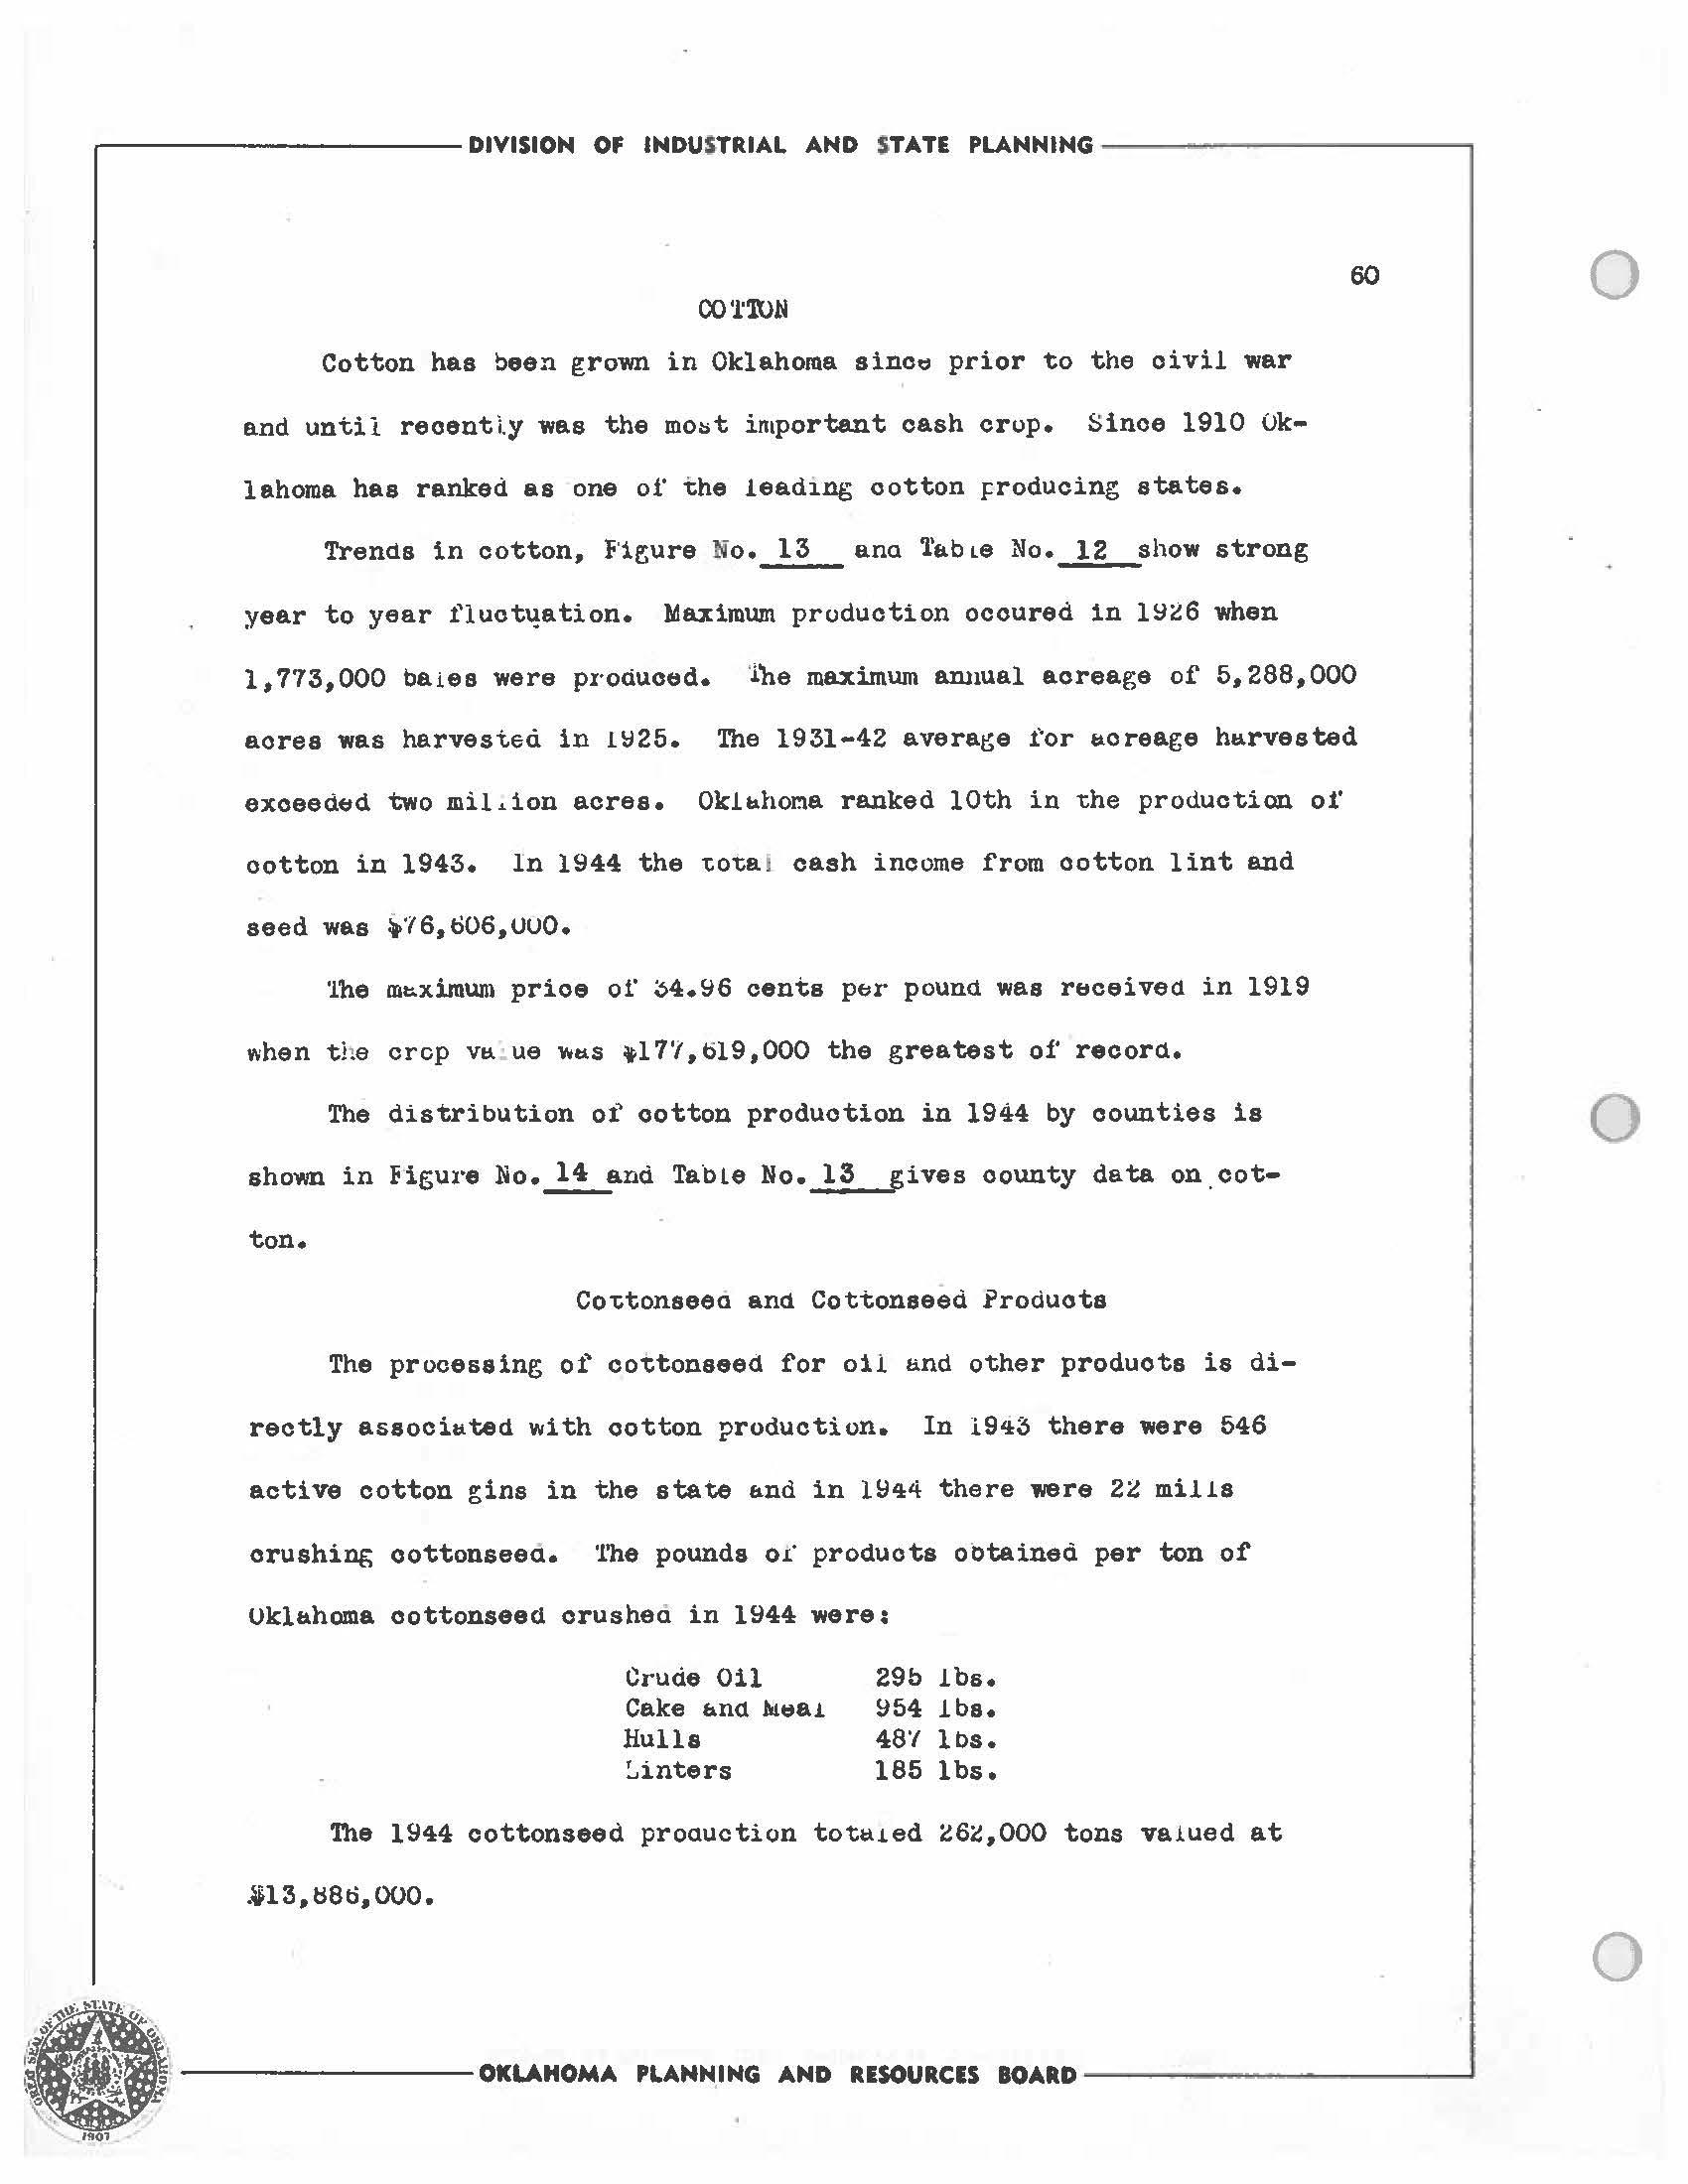
Trend.a in cotton, F'ie;ure No •..!!,_ ana Tfl.b Le No. _lLshow strong year to year t'luot~ation. Maximum production ocoured in l~l6 when 1,773,000 ba1es were pro<iuc6d. 'l'he maximum annual acreage of 5,288,000 acres was he.rvestea in 1~25. The 1931-42 avera~e for ~oreage h11.rvested exoeede:,d two miLion acres. Okh,hor.la ranked 10th in -i:he production oi' cotton in 1943. ln 1944 the 1:o"ta 1 cash income from cotton lint and seed was :a,76,ti06,ouo.
'lhe mt:.xirnum price oi' ~4.96 cents pt;r pound was rt1ceivee1 in 1919 when the crcp v11. ue v.us tl7'/,ol9,000 the greatest of' record.
The distribution of cotton production in 1944 by counties is shown in Figux·e No. 14 and Table No. 13 gives county data on cotton.
Co1:tonseea and. Cottonseed Products
The procesaing of co~tonseed for oii and other products is directly associ~ted with ootton production. In 1943 there were 546 active cotton gins in the state and in 1944 there Mre 22 mills crushing oottonseea. 'l'he pounds or· products obtained per ton of Uklbhoma cottonseed crushe d in 1944 were:
The 1944 cottonseed proauction t o t~red isi,ooo tons valued at .il3,ij8o,OOO.
,----------- DIVISION OF INDU STRIAL AND STATE PLANNING ------------, 60 CO'J.'IDN
Crude Oil Cake &.n<1 t.u,a1 Hulls '...inters 29b lbs. 954 lbs. 48 t lbs. 185 lbs.
OKLAHOMA PLANNING AND RESOURCIS BOARD ___________ .J 0 0 0
r r', , ---PRODUCT ION -VALUE 4000.,000 200 ~eoopoo 180 1/Y:Jopoo 160 0' 0 < :11111: i4oqooo 140 "' :z: 0 0 I z !200,000 120 <n 0 > ... .. z a: 0 <t z 1poo)ooo 100 :::1 IC7 z: I- C: :z I- 8 "' % 0 -4 "' " u eoqooo 80 > LL LL ,.. % 0 0 0 (I) z 11111 (/'j 60Q000 60 z ic, Ill w 0 "' § ...J -4 <i 40 ...J :; m ...J -4 "' "' tit "D ,.. ! 20qooo 20 z z ,. z " t:) 1915 1920 1925 1930 1935 1940 1945
Fi gure 13
'TREND
IN COTTON - OKLAHOMA - 1915 - -1943
TABLE NO ._ll
COTTON IN OKWtOI,,A 1894 - 1944

~---------- DIVISION OF INDUSTRIAL AND STATE P~NNING ------------, 62 0
I s Yield per, Price I Total Production Acres I Acre s per , Yea.r , Balea ' Ha.rves ted s (pounds) poundY Value ' , (cents) $1000 1894 123,000 251,000 237 4.6 2,863 1895 83,000 185,000 214 7.3 3,023 1896 123,000 356,000 165 6.2 3,805 1897 318,000 536,000 286 6.4 10,257 1898 320,000 530,000 295 5.8 9,484 1899 216,000 636,000 163 6.9 7,438 1900 357,000 766,000 224 a.1 15,514 1901 378,00Q 958,000 190 6.8 12,869 1902 545,000 ' 1,162,000 226 6.7 18,270 1903 465,ooo. l, 157,000 193 10.2 23,712 1904 804,000 : 1,682,000 229 8.5 34,184 1905 677.,000 1,614,000 201 10.0 33,855 1906 898,000 2,098,000 205 9.5 42,647 1907 862,000 2,319,000 178 9.9 42,688 1908 691,000 2,189,000 151 8.36 28,873 1909 545,000 1,974,000 132 12.90 38,150 O· 1910 923,000 ' 2,324,000 190 13.40 61,845 1911 1,022,,000 3,056,000 160 8.92 45,585 1912 1,021,000 2,587,000 189 11.12 56,782 1913 840,000 ' 3,242,000 124 11.77 49,457 1914 1,262,000 ' 2,850,000 212 6.85 43,230 1915 640,000 1,868,000 164 11.12 35,563 1916 824,000 2,528,000 156 17 .03 70,123 1917 959,000 ' 2,782,000 165 25.85 123,961 1918 : 577,000 J 3,171,000 ' 87 27.35 78,889 1919 1,016,000 2,587,000 188 34.96 177,619 1920 1,336,000 3,047,000 210 12.19 85,456 1921 481,000 ' 2,350,000 98 16.44 39,562 1922 627 ,ooo I 2,831,000 106 21.51 67,479 1923 656,000 I 3,134,000 100 28.14 92,237 1924 1,611,000 3,803,000 190 22.33 168,655 1925 1,691,000 5,288,000 153 19.33 163,435 1926 1,773,000 4,611,000 184 11.31 100,251 1927 1.,037,000 3,601.,000 138 20.46 I 106,099 1928 1,205,000 4,007,000 144 17.46 105,164 1929 l, 143,000 4,114,000 133 16.09 91,927 1930 854,000 3,929,000 104 8.71 37,174 1931 1,261,000 I 3,376,000 179 5.06 31,906 1932 1,084,000 3,108,000 167 6.07 32,891 1933 1,266,000 2,860,000 212 ~y 9.65 61,072 0 OK
LAH.OMA PLANNING AND RESOURCES BOARD
C (_ .------------ DIVISION
INDUSTRIAL
-------------.
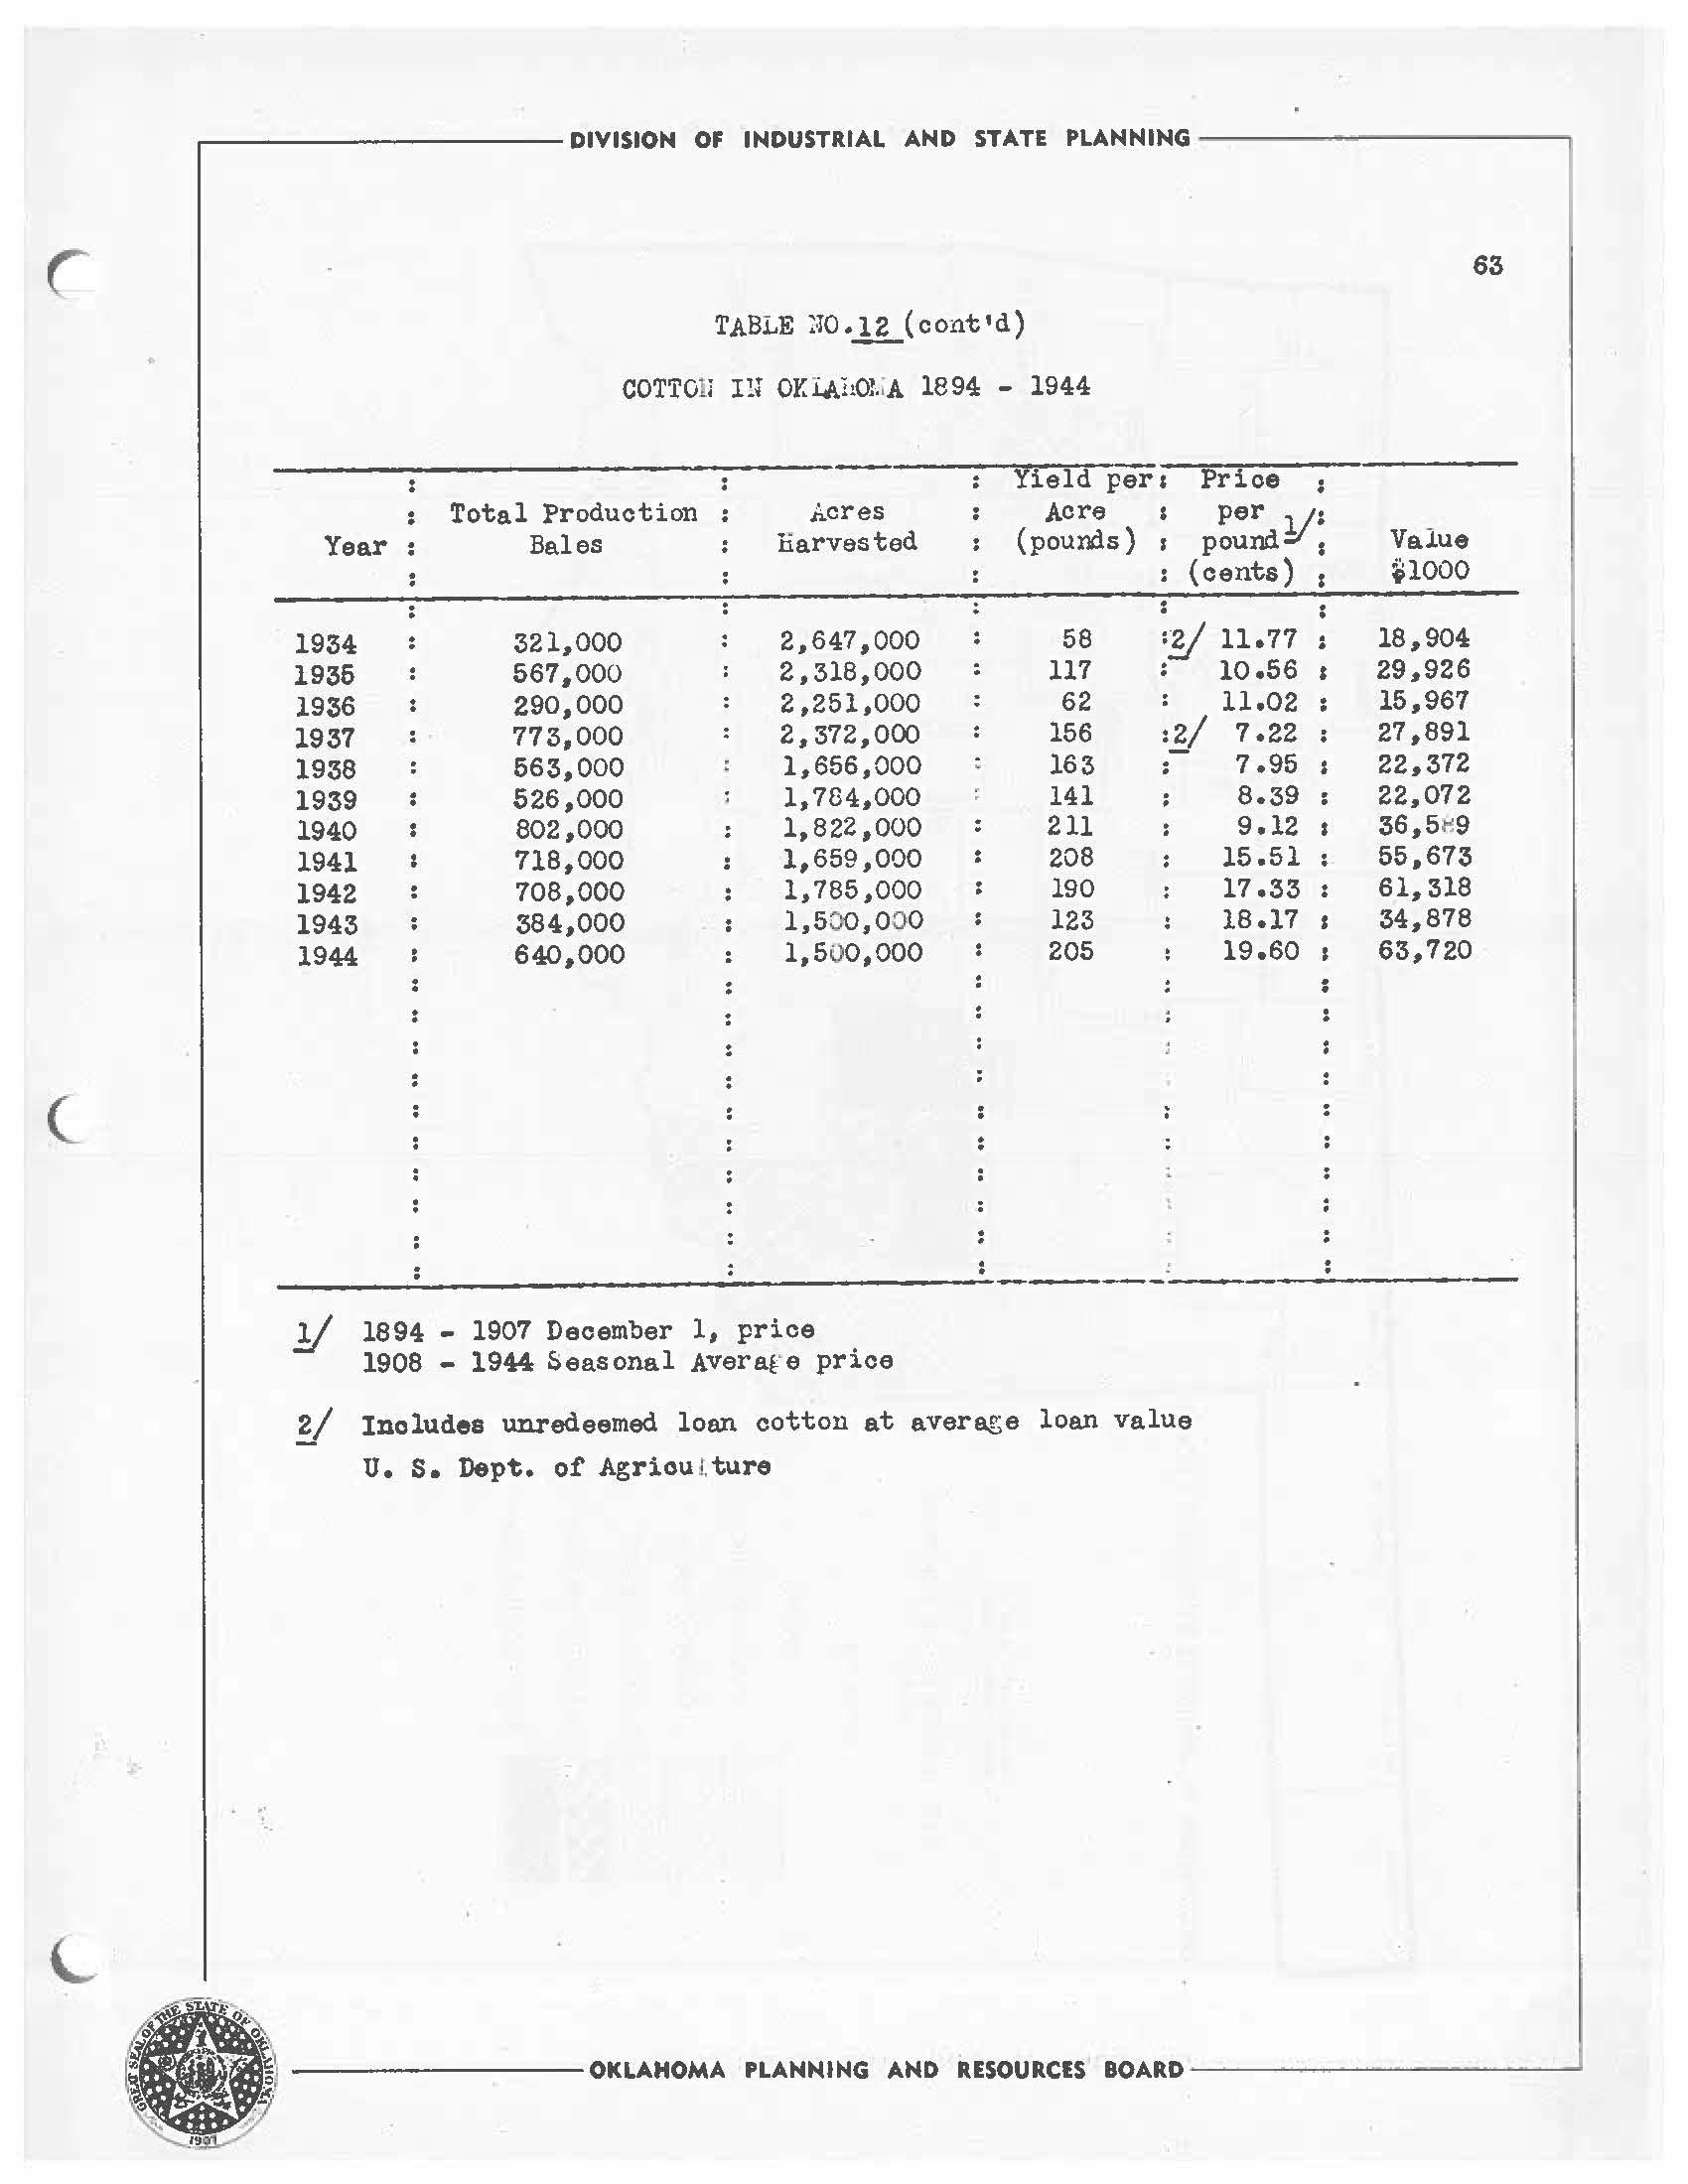
l:!J OY.iJi.l10!. iA 1894 - 1944 Yield per, Prioe Total Production ,Acres Acre ' per y: Year Be.les liarvested (pounds) ' pound , Value {cents) ~1000 : 1934 321,000 2,647,000 58 ;y 11.77 : 18,904 1935 567,000 2,318,000 117 : 10 .56 29,926 1936 290,000 2,251,000 62 11.02 15,967 1937 773,000 2,372,000 156 :y 1.22 27,891 1938 563,000 1,656,000 163 7.95 22,372 1939 526,000 1,784,000 141 8.39 22,072 1940 802,000 1,822,000 211 9.12 I 36,5 ~9 1941 718,000 1,659,000 208 15.51 55,673 1942 708,000 1,785,000 190 17 .33 61,318 1943 384,000 1,500,00 0 123 18.17 I 34,878 1944 640,000 1,50 0,000 205 19.60 I 63,720 ____.,:___________,;.________;_ ___________...;____ 1894 - 1907 December 1, price 1908 - 1944 Seasonal Avera.re price Includes
U. S. Dept. of Agriou /. ture 63 •---------OKLAHOMA PLAHMIMG AMD RESOURCES BOARD - -----------'
OF
AMD STATE PLAMMIMG
TABLE :m._g__(cont•d) COTTOil
unredeemed loan cotton at average loan value

i i > i i % 0 ,. I • n = •0 t 0 CIMARRON TEXAS BEAVER HARPEft I I I F OKLAHOMA PLANNING 8i RES01.IRCES B1 0 .SC-AU: • $TA~VTe lift"~ w " 10 to ~o +o so 01s ·1RIBUTION OF COTTON 1944 <--·--··< ~::t.::::·>:-:g ·:····,····:•:.•:, W/22Legend Boles 1,000 - 9.999 I 0,000-19,999 20 ,000·29,999 3 0, 000-39,999 40,000 an:d Over WOODWARD 0 ·-rRANT rAY ,.,Jli@·,'-~ I GARF'ICI.O IN081.E'Z:)i\.:·:::::.:.:,:=::':/ 1-l_.,-,,,-J-0-R-1 t ~/::·(•.::).::] ·~ i CRAIG\} ,... :o DEC ROGERS ' I 'MAYES \@,'.ff{.!£··-~ /A •:-:-:-:,,,,,.• •c:-:•.-•:..,,,-:: W~,,~ I.~.. F i gure 14 'Q&1PY.A1t:-:-1··:<tp I~!~:~ .. .....:1 .. -·~j 'VRTAIN. [·~:\", 0 , .p. 0 2 < .; I % " C: ;i ,.. z: ti' :; =.,, ,.. z: 2; z C)
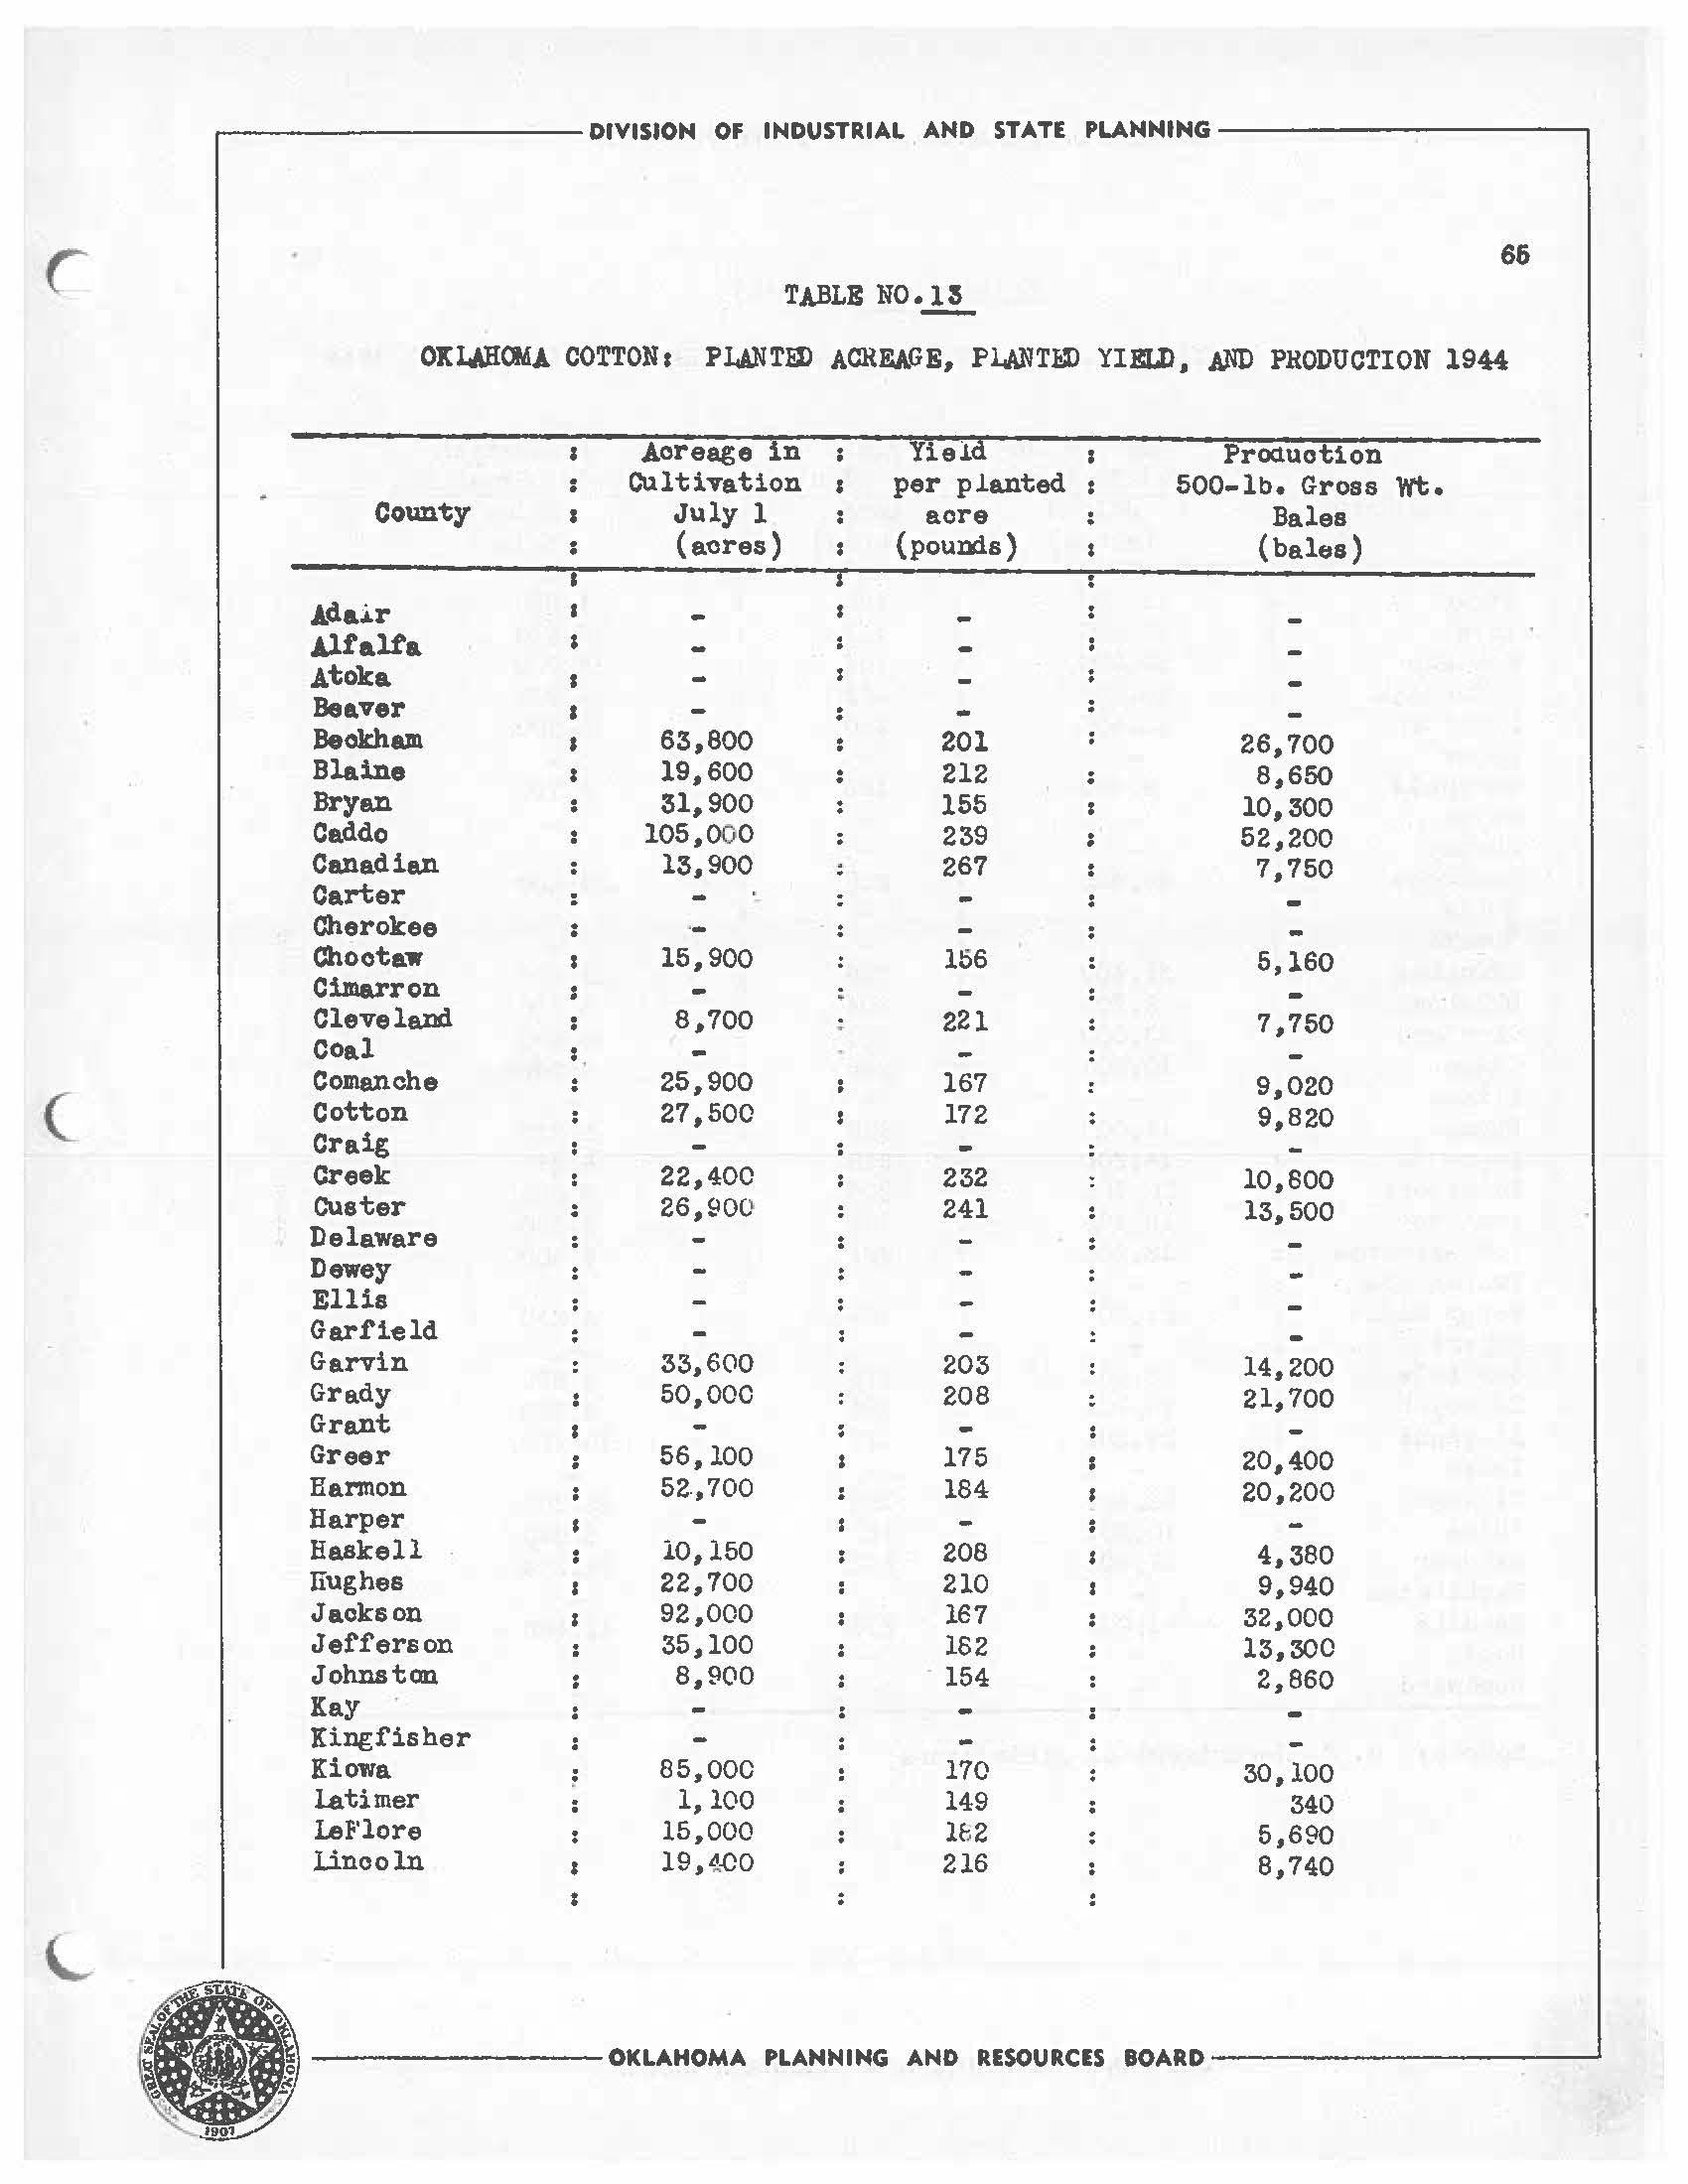
,------------DIVISION OF INDUSTRIAL AND STATE PLANNING-----------, 66
COTTON
Aoreage in Yield Proctuotion Cultivation I per p !anted , 500- lb. Gross Wt. County July 1 acre Bales (aores) (pounds) {bales) Adair I Alfalfa I ,Atoka I Beaver IBeolchaJD 63,800 201 26,700 Blaine 19,600 212 8,650 Bryan : 31,900 155 10,300 Caddo 105,000 239 : 52,200 Canadian 13,900 267 7,750 Carter Cherokee : Choctaw 15,900 156 5,160 Cimarron Clevele.lld 8,700 221 7,750 Coa.l Comanche 25,900 167 9,020 C Cotton 27,500 172 9,820 Craig Creek 22,400 232 10,600 Custer 26,900 Delaware 241 13,500 Dewey Ellis Garfield Garvin 33,600 203 14,200 Grady 50,000 208 21,700 Grant Greer 56,100 175 20,400 Hannon 52,700 184 20,200 Harper Haskell 10,150 208 4,380 Hughes 22,700 210 9,940 Jackson 92,000 167 32,000 Jefferson 35,100 182 13,300 Johns tan 8,900 154 2,860 Kay Kingfisher Kiowa 85,00C 170 30,100 Latimer 1,100 149 340 leF'lore 15,000 1&2 5,690 Lincoln I 19 .~-00 216 8,740 L •' 0
TABLE NO•.!!. OX x.ROM.l
s PI.ANTED ACH&A.GE, Pl.ANTU>
YIU, AND PRODUCTION 1944
• t(,.~ 1901
OKLAHOMA PLANNING AND RESOURCES BOARD
NO._!!(oont•d)
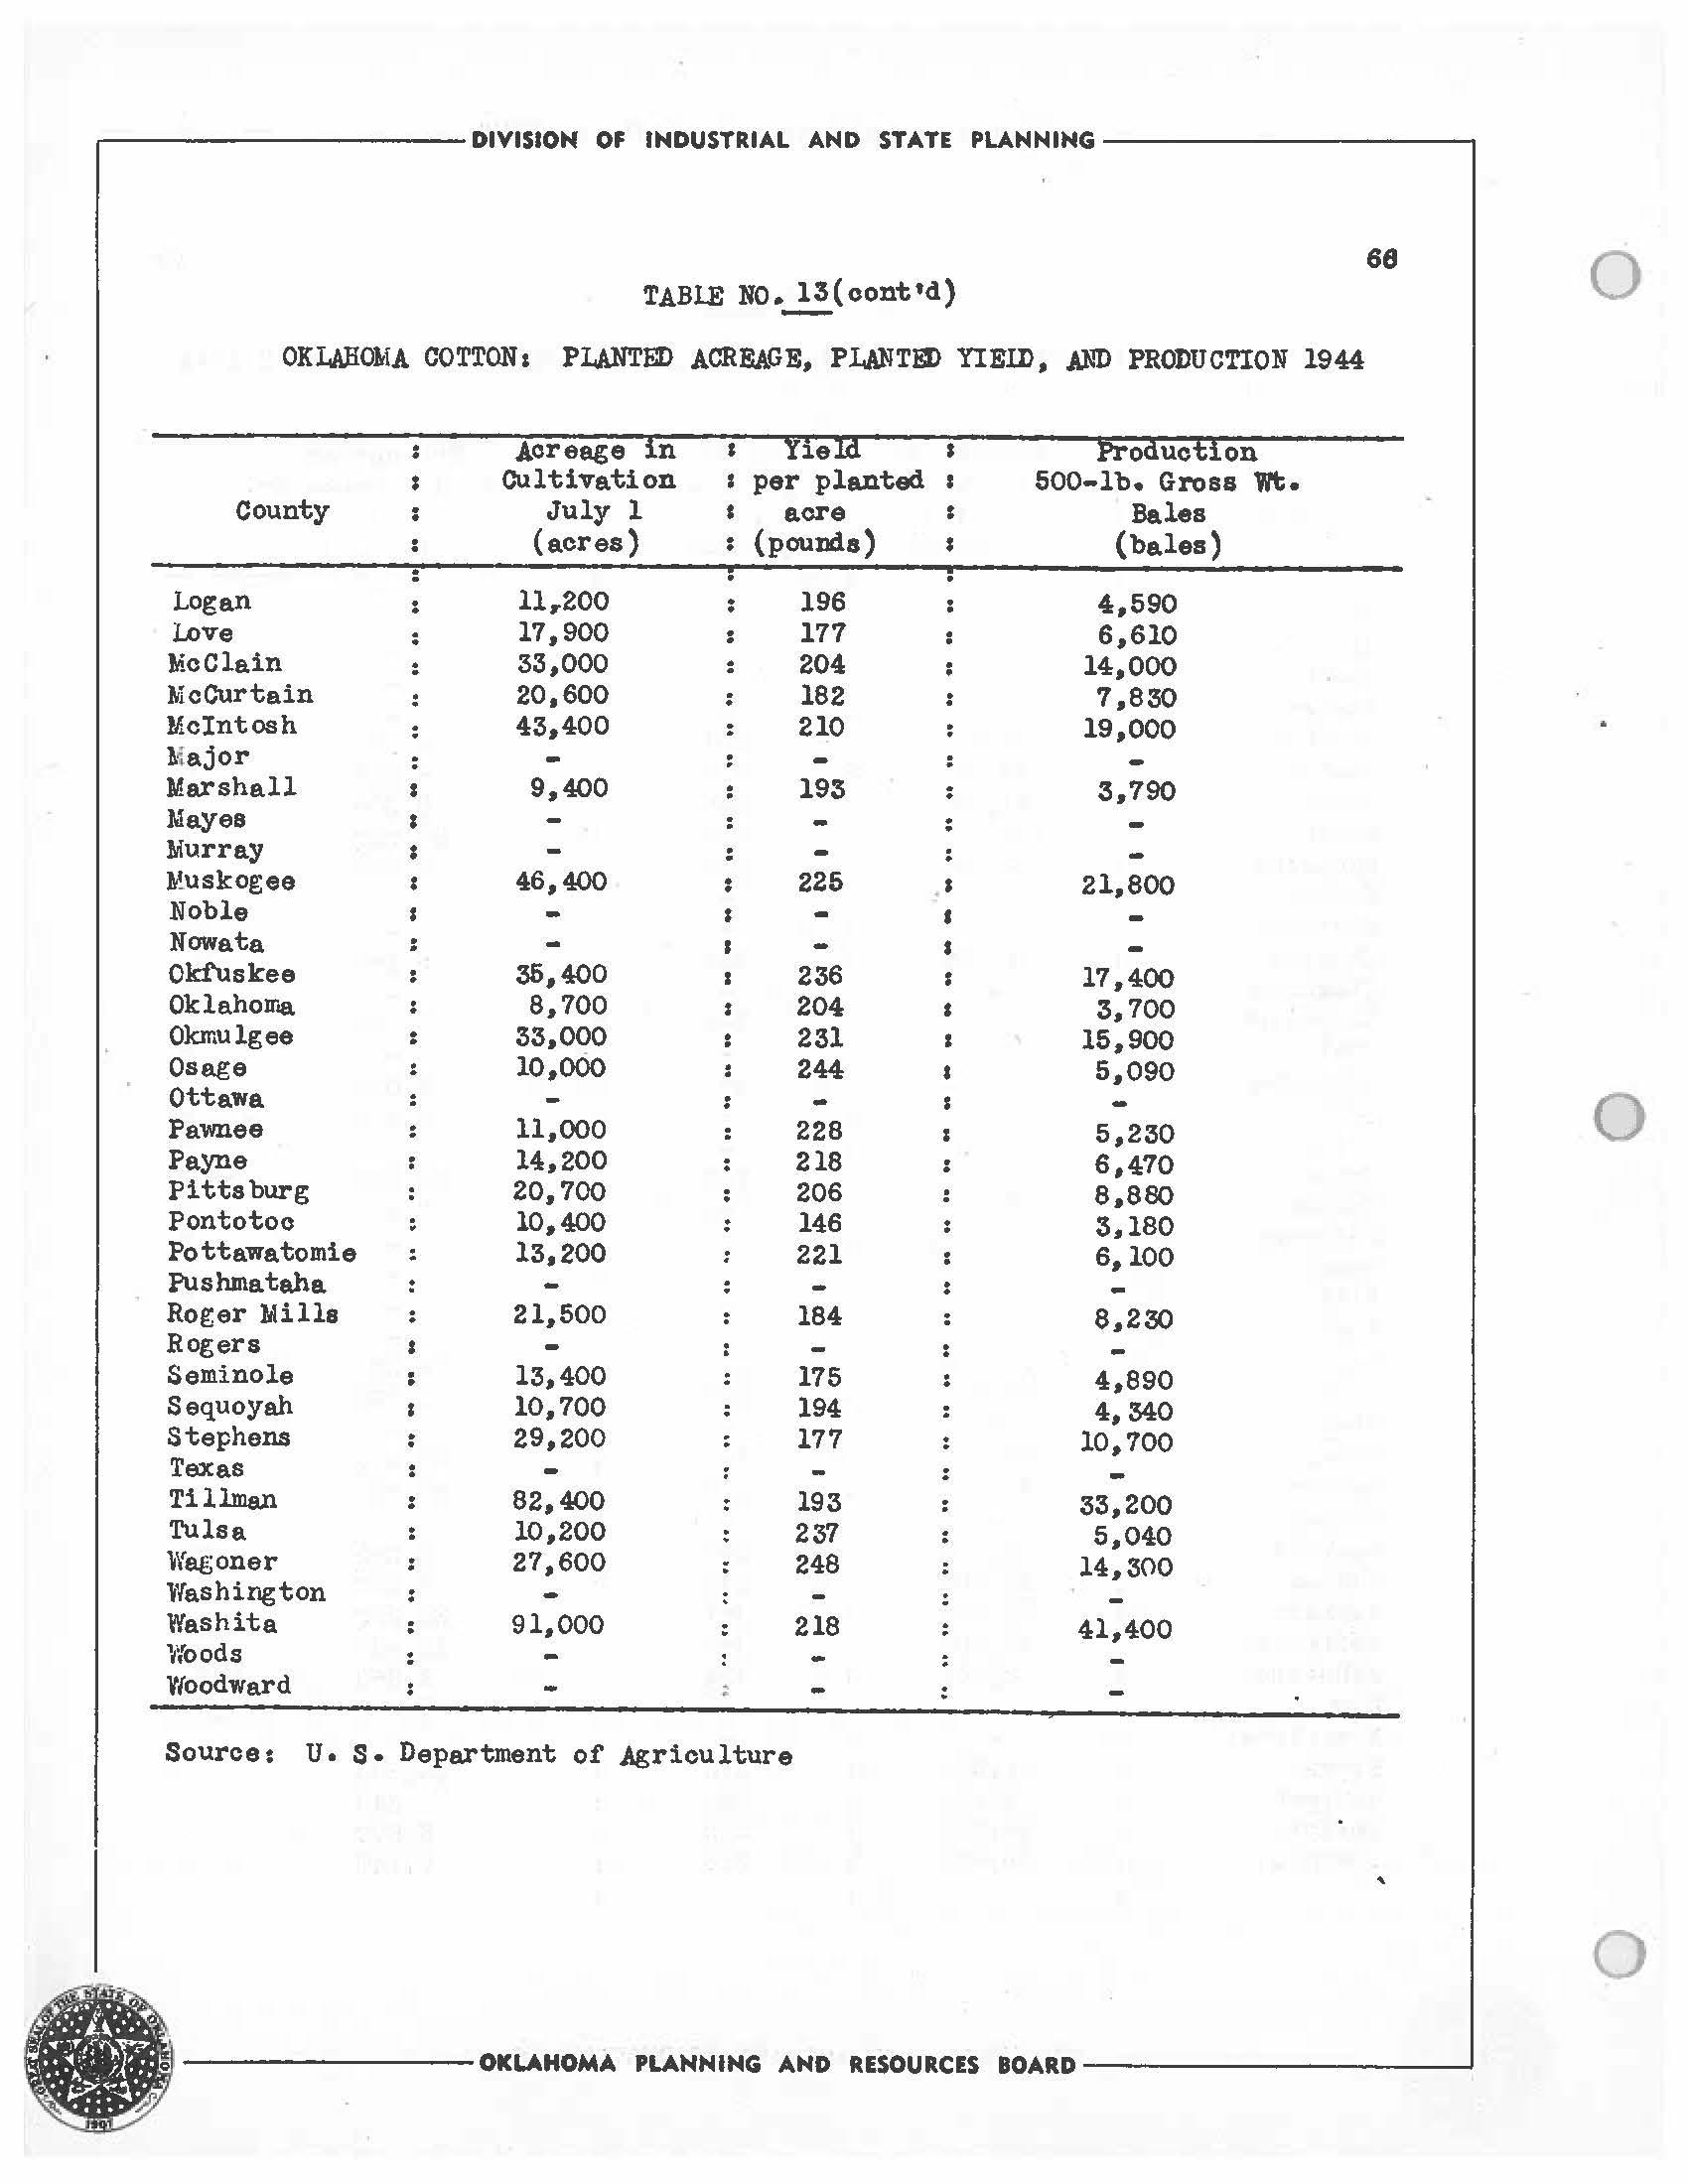
,----------- DIVISION OF INDUSTRIAL AND STATE PLANNING-----------, 66
TABlE
Aoreage in ' Yield Production : Cultivation I per planted, 500-lb. Gross Wt. County : July l acre Bales (acres) (poullds) (bales) : Logan : 11r200 196 4,590 Love : 17,900 177 6,610 McClain : 33,000 204 14,000 McCurtain 20,600 182 7,830 McIntosh 43,400 210 19,000 Major Marshall 9,400 193 3,790 Mayes Murray Muskogee 46,400 225 I 21,800 Noble • Nowata Okfuskee 35,400 236 17,400 Oklahoma 8,700 204 3,700 Okmulgee 33,000 231 15,900 Osage 10,000 244 5,090 Ottawa Pawnee 11,000 228 5,230 Fayne 14,200 218 6,470 Pittsburg 20,700 206 8,880 Pontotoc 10,400 146 3,180 Pottawatomie 13,200 221 6,100 Fus lune.taha Roger Mills 21,500 184 8,230 Rogers Seminole 13,400 175 4,890 Sequoyah 10,700 194 4,340 Stephens 29,200 177 10,700 Texas Tillman 82,400 193 33,200 Tulsa 10,200 237 5,040 Wagoner 27,600 248 14,300 Washington Washita 91,000 218 41,400 Woods Woodward
OKLAJ:IOMA COTTON, PI.ANTED ACREAGE, P.LANTFD TIEW, ,Al,,1D PRODUCTION 1944
•--------- OKLAHOMA PLANNING AND RESOURCES BOARD--------------' 0 0 0
Source: u. S. Department of Agricu 1ture
CORN
ln 1944 Oklahoma produced over 32 million bushels of oorn valued at ~9 million dollars and it was the third most important agricultural crop. At one time corn occupied first pl~ce in point oi' acreage but is now exceeded by both whe1>.t and cotton. Maximum production occured in 1906 when 131 million bushels were produced from 4 million acr e s.
Trends in corn proouction l:llld va.J.ue are sho;,,n on ,l<•igure lfo • ...!.!.,_.
The distribution 01' corn production in Oklahoma. (Figure No. --2:.!_) tends to follow some of the larger strewn valleys e..na in areas receiving more than ~5 inches of e.nnu&.l rEi.ini'e.11. :Uata on Corn production by years t1nd counties 1:1.re given in Tables No.~and 15 •
Corn acreage has declined in recent years to an average of about 2 million acres. i'he long time range of' yields of corn varies from a low 01· 5.8 bu1>heis per acre to a hi gh ·of 33 bushels per acre.
C L .------------ DIVISION OF INDUSTRIAL AND STATE PLANNING------------, ,,r'~T. -
67 ~:r· \ ; ~1---------OKLAHOMA PLANNING AND RESOURCES BOARD _____________. "' .
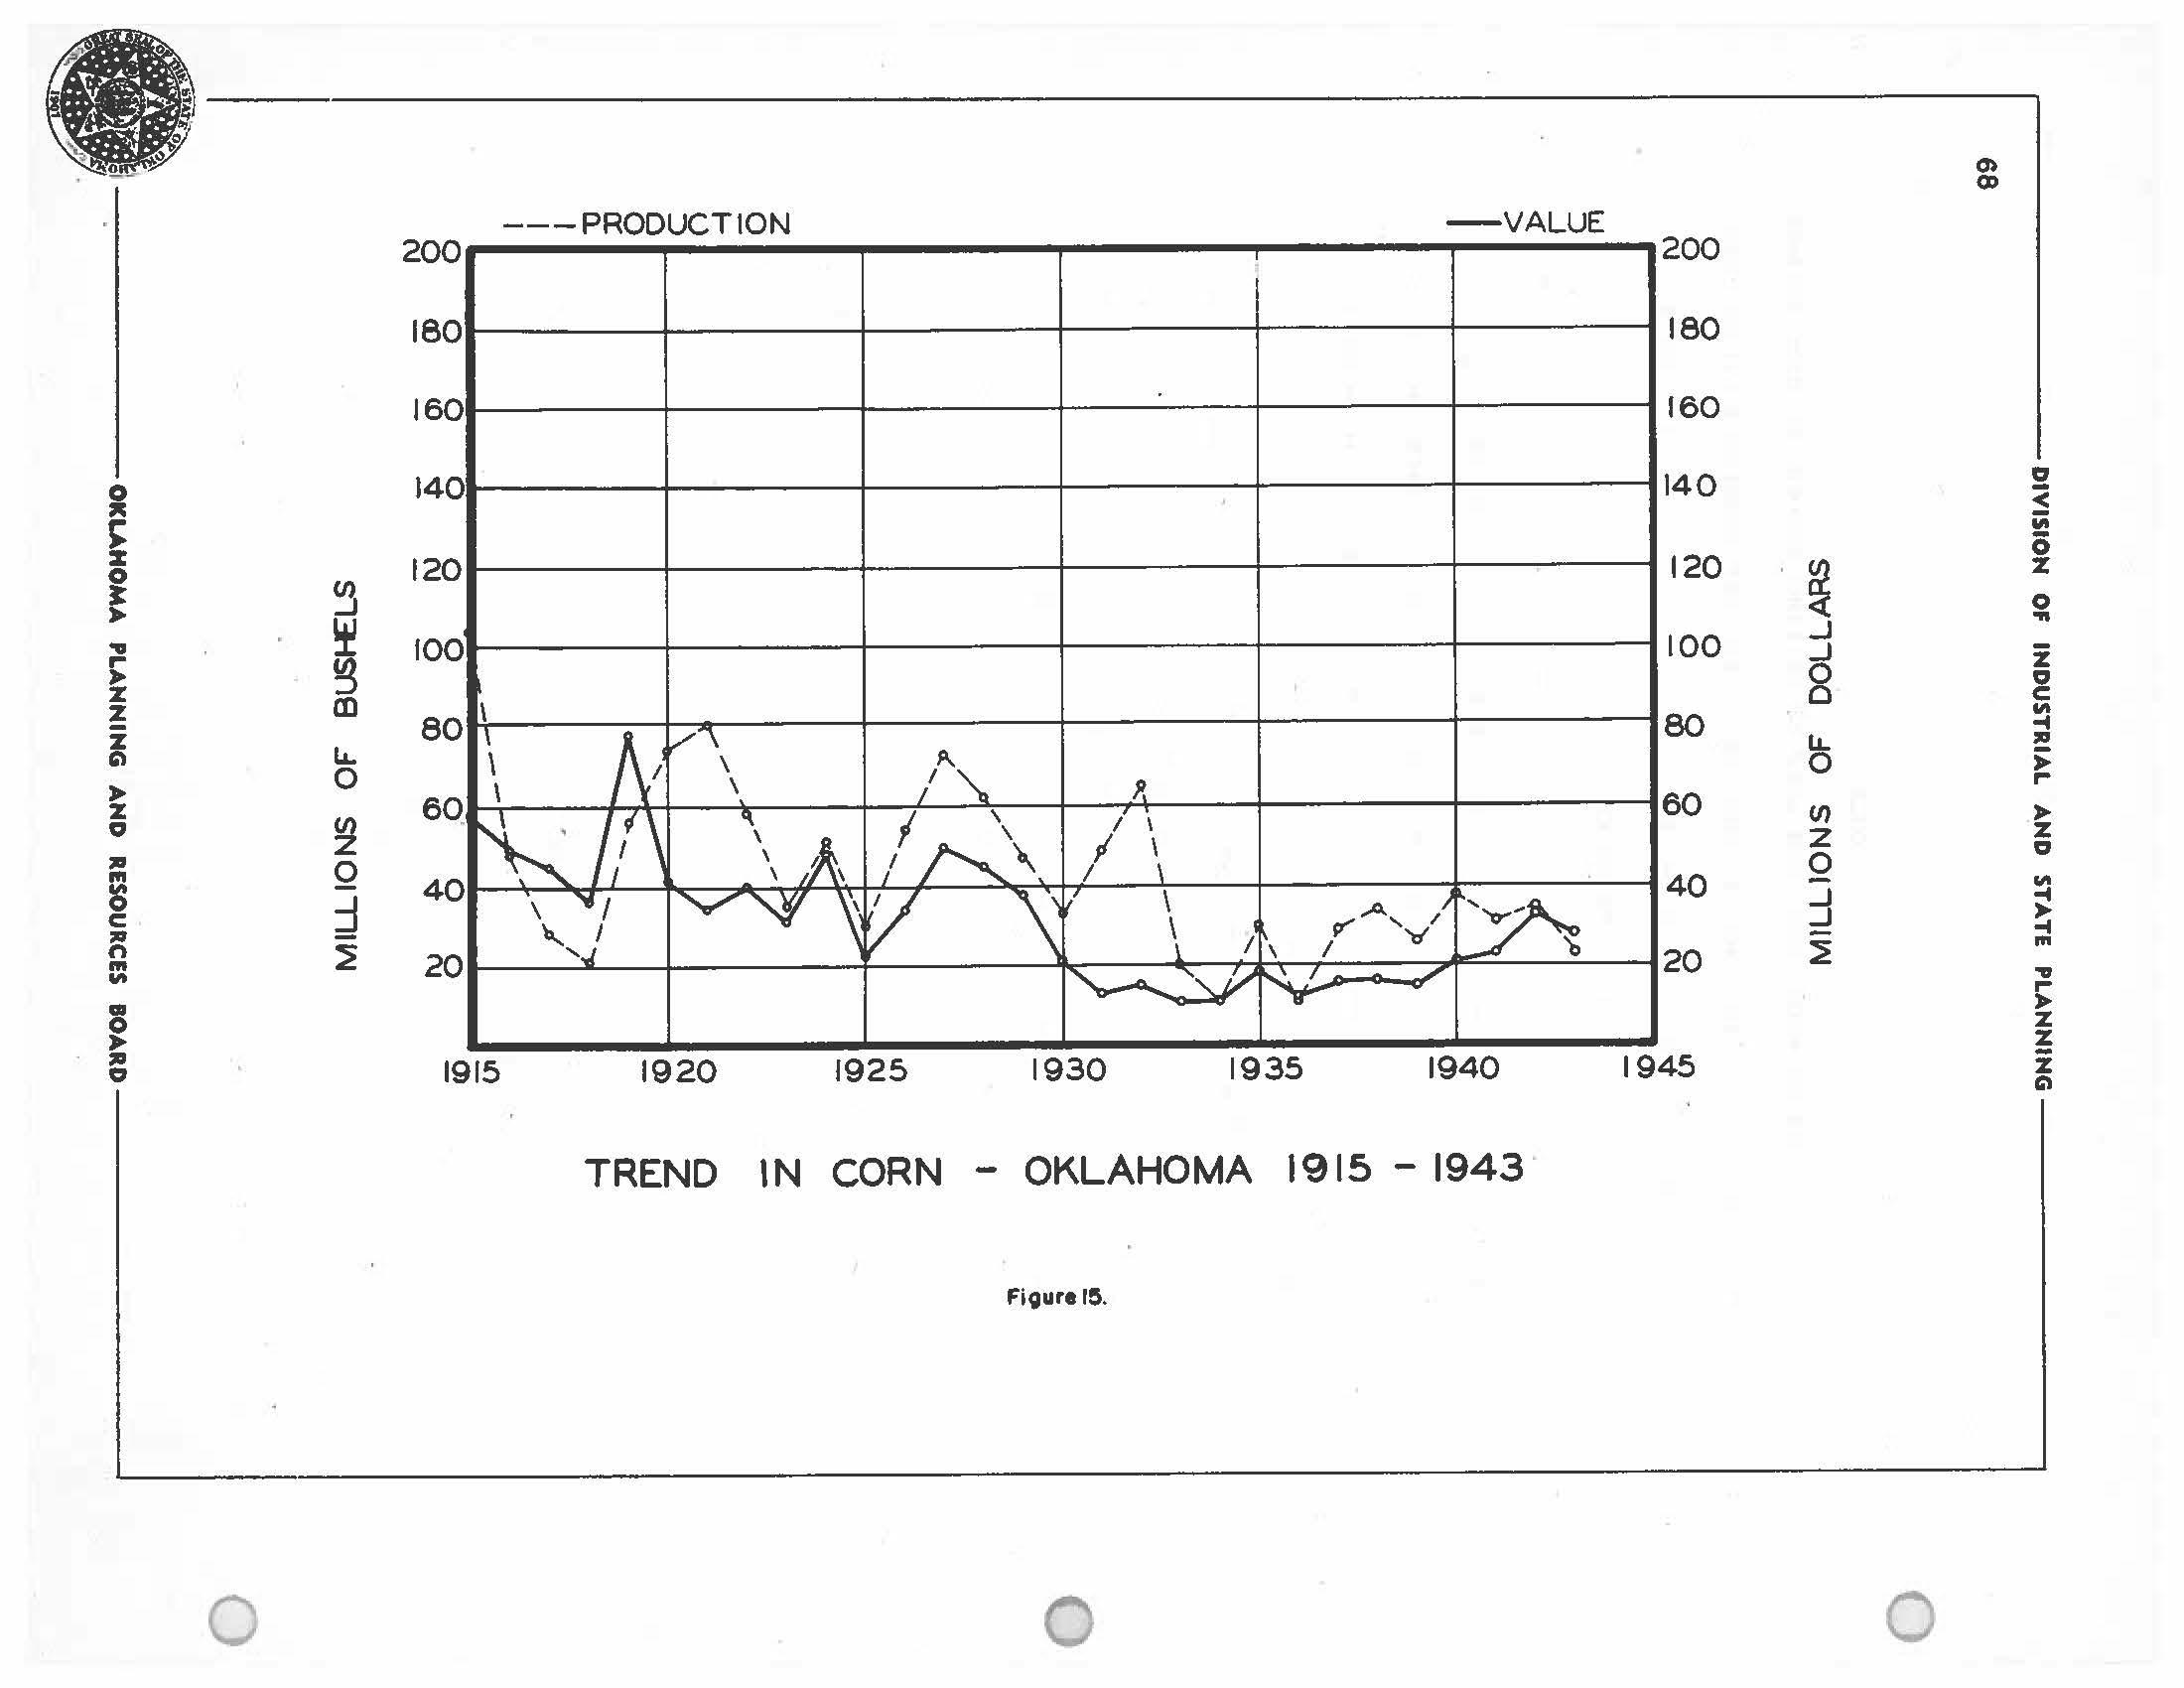
0 z 0 > • ,.. > z m ! z c:'I I.&. > 0 z C, ,ii 0 "' :J C ,ii n "' "' • 0 > ,ii C, 0 200 180 1601 ) 1401 120 100' 80 60 40 20 I I 1915 ---PRODUCTION -VALUE ' 1920 1925 1930 1935 1940 TREND IN CORN - OKLAHOMA 1915 - 1943 Figurer~. 0 200 180 160 140 120 100 80 60 40 20 1945 00 i _J _J 0 0 LL 0 CJ) z 0 _J _J 0 C, 3 "' 0 % 0 ... i C, C "' > ,.. > % 0 "' "'D ,.. z z i c:,

DIVISION OF INDUSTRIAL AND STATE PLAHNIHG ------------,
69
Price : Total Acree : Yield Year Production Harvested per per bu.!/. Value acre : (bushels) (bu.) : (dollars) (dollars) 1899 : 69,690,000 2,525,000 27.6 .20 13,938,000 1900 : 68,380,000 2,630,000 26.0 .26 17,779,000 1901 t 26,220,000 2,760,000 9.5 .76 19,927,000 1902 80,580,000 3,160,000 l 25.5 .41 33,038,000 1903 78,795,000 3,090,000 25.5 .39 30,730,000 1904 108,000,0QQ I 3,600,000 30.0 .40 43,200,000 1905 118,500,000 · 3,950,000 30.0 .34 40,290,000 1906 1;s1,010,ooo ! 3,970,000 33.0 .31 40,613,000 1907 116,130,000 4,740,000 24.5 .44 51,097,000 1908 124,500,000 4,980,000 25.0 .56 69,720,000 1909 94,430,000 5,939,000 15.9 .60 56,658,000 1910 89,760,000 I 5,610,00 0 16.0 .52 46,675,000 1911 38,080,000 5,440,000 7.0 .72 27,418,000 1912 90,650,000 4,900,000 18.5 .52 47,138,000 1913 45,540,000 4,140,000 11.0 .74 33,700,000 1914 43,375,000 3,470,000 12.5 .69 29,929,000 1915 : 104,135,000 . 3,530,000 29.5 .56 58,316,000 1916 47,520,000 I 3,520,000 13.5 1.05 49,896,000 1917 28,645,000 3,370,000 8.5 1.58 45,259,000 1918 21,450,000 2,860,000 7.5 1.68 36,036,000 ( 1919 56,188,000 2,554,000 22.0 1.39 78,101,000 1920 74,672,000 2,872,000 26.0 .56 41,816,000 1921 80,592,000 3,504,000 23.0 .43 34,655,000 1922 58,378,000 3,434,000 17.0 .70 40,865,000 1923 35,134,000 3,194,000 11.0 .89 31,269,000 1924 51,516,000 : 2,862.,000 18.0 .96 49,455,000 1925 25,580,000 ' : 2,558.,000 10.0 .89 22,766,000 1926 54,119,000 2,353,000 23.0 .64 34,636,000 1927 : 73,071,000 3,177.,000 23.0 .69 50,419,000 1928 62,525,000 3,050,000 20.5 .73 45,643,000 1929 s 47,585,000 3,070,000 15.5 .Bl 38,544,000 1930 33,526,000 3,193,000 10.5 .63 21,121,000 1931 I 49,815,000 3,321,000 15.0 .27 13,450,000 1932 65,760,000 3,288,000 20.0 .23 15,125,000 1933 20,027,000 2,861,000 7 .o .55 11,015,000 1934 11,281,000 1,945,000 5.8 .99 11,160,000 1935 25,872,000 1,848,000 14.0 .70 18.,110,000 1936 11,772,000 1,811,000 6.5 1.06 12,478,000 1937 29,628,000 1,646,000 18.0 .55 16,295,000 1938 34,240,000 1,712,000 20.0 .49 16,778,000 1939 26,489,000 1,802,000 14.7 .60 15,893,000 1940 38,743,000 1.,802,000 21.5 .55 21,309,000 1941 31,202,000 l.,'/83,000 17.5 .76 23,'714,000 1942 35,631,000 1,926,000 18.5 .93 33,137,000 1943 23,350,000 1,868,000 12.5 1.22 28,487,000 1944 32,958,000 1,831,000 18.0 1.19 39,220,000 C y 1894 - 1907 DeceMber 1 price 1908 - 1943 Seasonal Average Frice
TABLE NO. 14
CORN I:T OKLJUJO!'A 1899 - 1944
OKLAHOMA PLAHNIHG AND RESOURCES BOARD
OKLAHOMA PLANNING 8 RESOURCES BOARD
DISTRIBUTION OF CORN OKLAHOMA 1944 Planted Acreoc;ie

1000-19,999
W,j
20,000-39,999
40,000- 59.999
60,000 and over
~o.,r ~'11, ";:-:lliD,_l~~:-:"'lilr_,~ --------------------------------------------------------------------------------------, :,. ;! ....~"· 01~ 0 "Ill z z i " z 0 JIii I '11!1 n '" "' • JIii 0
I { I fuls
CIMARRON TEXAS !BEAVER HARPER
0
0 10 20 !10 to so
SC.,O~f -STATUrt MIUS
-,---ii
- ·
WOODWARD DEWEY CUSTER Bl!CICHAM WASHITA IAL.,.4L.-;.1lsit..-NT IGARFll!t.D 1NAJOR
0 KAY ..,;;i 0 0 1::11 "' 0 z 0 ... z lg C !!! rz .., s '" "Ill z z i a
Fic;iure 16.
TABLE NO•.J!._
OK.l.AliO:tl:A CORN Acreage, Yield, Produotion--1944 by Counties

DIVISION OF INDUSTRIAL AND STATE PLANNING-----------. C 71
J l Yield per, Yield per , :Planted aore-s Harvested1 planted , He.rves ted I County age Acreage J acre acre I Produotion (acres) (aortta) I (bu.) s ( bu.) • (bu.) Adair 12,300 s 12,100 16.5 16.8 s 203,000 Alfalfa 2,200 : 2,100 14.5 15.2 • 32,000 Atoka 28,800 s 28,100 ' 12.5 12.a • 361,000 Beaver 1,300 : 1,200 I 11.6 12.5 ' 15,000 Beckham 6,600 6,400 18.8 19.1 122,000 Blaine 19,000 18,600 13.7 14.0 260,000 Bryan 61,900 59,800 14.8 15.3 915,000 Caddo 54,000 62,200 16.9 17 .5 915,000 Canadian 26,000 25,000 20.0 20.4 621,000 Carter 24,400 23,700 17.7 l 18.2 432,000 Cherokee 19,700 19,400 16.2 15.4 299,000 Choctaw 44,000 42,800 15.5 s 15.9 680,000 Cimarron 15,000 14,000 15.0 16.l : 225,000 Cleveland ' 25,300 24,800 20.0 20.4 506,000 Coal 21,500 20,900 15.l 15 .5 324,000 Comanche 16,000 15,700 15.6 15.9 250,000 C Cotton 16,400 15,500 15.3 16.2 251,000 Craig 52,000 50,700 13.2 13.6 689,000 Creek 33,600 32,900 20.9 21.3 702,000 Custer 10,800 10,600 17.9 18 .2 193,000 Delaware 21,600 21,100 14.6 14.9 315,000 Dewey 10,000 9,800 14.b 14.9 146,000 Ellis 5,600 6,400 lti ob 17 .2 93,000 Garfield 2,500 2,400 12.a 13.3 32,000 Garvin 58,500 57,800 23.5 23.8 : 1,373,000 Grady 64.500 63.200 18.9 19.3 : 1,219,000 Grant 5,000 4,800 16.0 16 .7 80,000 Greer 2,600 2,500 13.l 13.6 34,000 liarmon : 2,000 1.soo 14.0 14.'/ 28,000 Earper : 2,500 2,400 14.0 14.6 35,000 Haskell :36,000 3b,500 17.5 17 .s o:51,ooo Eughes 4o,400 45,'lOO 20.2 20.5 : 9~5,000 Jackson 4,000 3,000 8.5 11.3 34,000 Jefferson 28,900 27,900 19.7 20.4 569,000 Johnston 24,000 23,100 14.5 15.l 349,000 Kay 19,600 19,000 18.9 19 .5 370,000 Kingfisher 8,500 s.300 17 .3 17.7 147,000 Kiowa 3,000 2,800 14.7 15.7 44,000 Latimer 14,000 13,600 13.6 : 14.0 191,000 ---------OKLAHOMA PLANNING AND RESOURCES BOARD-------------'
J
OK LA,.':lt-:A CORN
Acrea§'.:e, Yield, Production--1944 by Counties
Yioid per: Yisid per: :Planted acre-: lfa.rves ted planted Harvested: ::>rocluotion

,..........---------- DIVISION Of INDUSTRIAL AND STATE PLANNING ------------, 72 0
TABLE N0.~(cont'd)
County age Acreage acre a.ere (bu.) (acres) (acres) (bu.) (bu.) leFlore 48,000 46,600 18.8 19.3 900,000 Lincoln 25,200 24,700 21.6 22 .o 544,000 Lofan 19,700 19,300 20.0 20.4 394,000 Love 23,500 22,600 15.3 15.9 360,000· lfcClain 44,600 43,700 20.0 20.4 892,000 McCurtain 46,000 44,600 12.6 13.0 579,000 1lcintosh 70,000 69,000 17 .4 17 .7 1,220,000 Major 6,300 6,000 12.4 13.0 78,000 l:.e.rshall 15,000 14,400 13.5 14.l 203,000 1.: ayes 34,300 33,400 14.l 14.5 483,000 l,~urray 10,500 10,100 22.9 23.8 240,000 :r.:uskogee 68,600 67,700 21.5 21.8 1,473,000 Noble 7,700 7,400 17.0 17.7 131,000 Howe.ta 21,100 20,600 13.4 13.7 282,000 Okfuskee 47,300 46,400 21.2 21.6 1,004,000 Oklahoma 22,000 21,60(1 20.0 20.4 441,000 Okmulgee 33,000 32,500 16.2 16.5 536,000 Osage 31,200 30,400 19.l 19 .6 595,000 Ottawa 30,000 29,300 14.3 14.6 429,000 Pawnee 20,800 20,300 19.l 19 .6 397,000 Payne 24,000 23,500 22.1 23.l 544,000 Pittsburg 41,000 40,500 16.3 16.5 668,000 Pontotoc 29,000 28,300 17.4 17 .8 505,000 Pottawatomie 32,300 31,600 18.8 19.2 606,000 Pushmataha 19,000 18,400 13.5 13.9 256,000 Roger Mills 9,000 8,800 14.9 15.2 134,000 Rogers 25,500 24,900 16.5 16.9 420,000 Seminole 25,000 24,500 19.0 19 .1 475,000 Sequoyah 29,000 28,600 21.9 22.2 634,000 Stephens 43,000 41,300 18.9 19.7 813,000 Texas 2,600 I 2,500 15.4 ·16.0 40,000 Tillman 12,000 11,400 14.8 15.5 177,000 Tulsa 29,100 28,400 18.7 19.2 545,000 Via.goner 43,600 42,500 18.7 19.2 815,000 Yva.shington 15,800 15,400 16.5 16.9 261,000 Washita. 18,700 18,300 16.3 16.7 305,000 Woods 2,200 2,000 12.1 14.0 28,000 Woodward 2,500 2,300 12.4 13.5 31,000
0 ---------OKLAHOMA PL.ANNING AND RIESOURCES
_____________.
:; ource: u. s. Department of .Agriculture
BOARD
OATS
Oats are an important crop in Oklahoma. 'lhey are grown in all seotions of the state with the greatest acreage intensified in the southwest central ana. northwest parts of the state. In general the central pe.rt of the state is adapted to a high production of oata. -
The most cOJnrnon type of oats grown in Oklahoma are red oata -.hioh are aaapted to resist the hot dry weather at heading and filling time.
The 1944 oat orop was 27,569,000 bushels harvested frca 1.451,000 acres with an average yield of 19.0 ouahels -per aore. '!he highest produotion 01· record w&.s 46,780,000 bushels in 1920. The prioe of ;;. 78 per bushels received in 1943 is the highest of reoord.
tigure No. 17 shows the trends in production and value of oats rrom 1~15 to 1~44. Yearly aata on o~ts are sUJAJDarized in Table No .
16 and county data for 1944 is given in Table No. 17 • '!he distribution oi' oats by coun'ties h shown on Figure No. 18 •
( ..------------DIVISION OF INDUSTRIAL AND STATE PLANNING-----------,
73 ---------OKLAHOMA PLANNING AND RESOURCES IOARD-----------
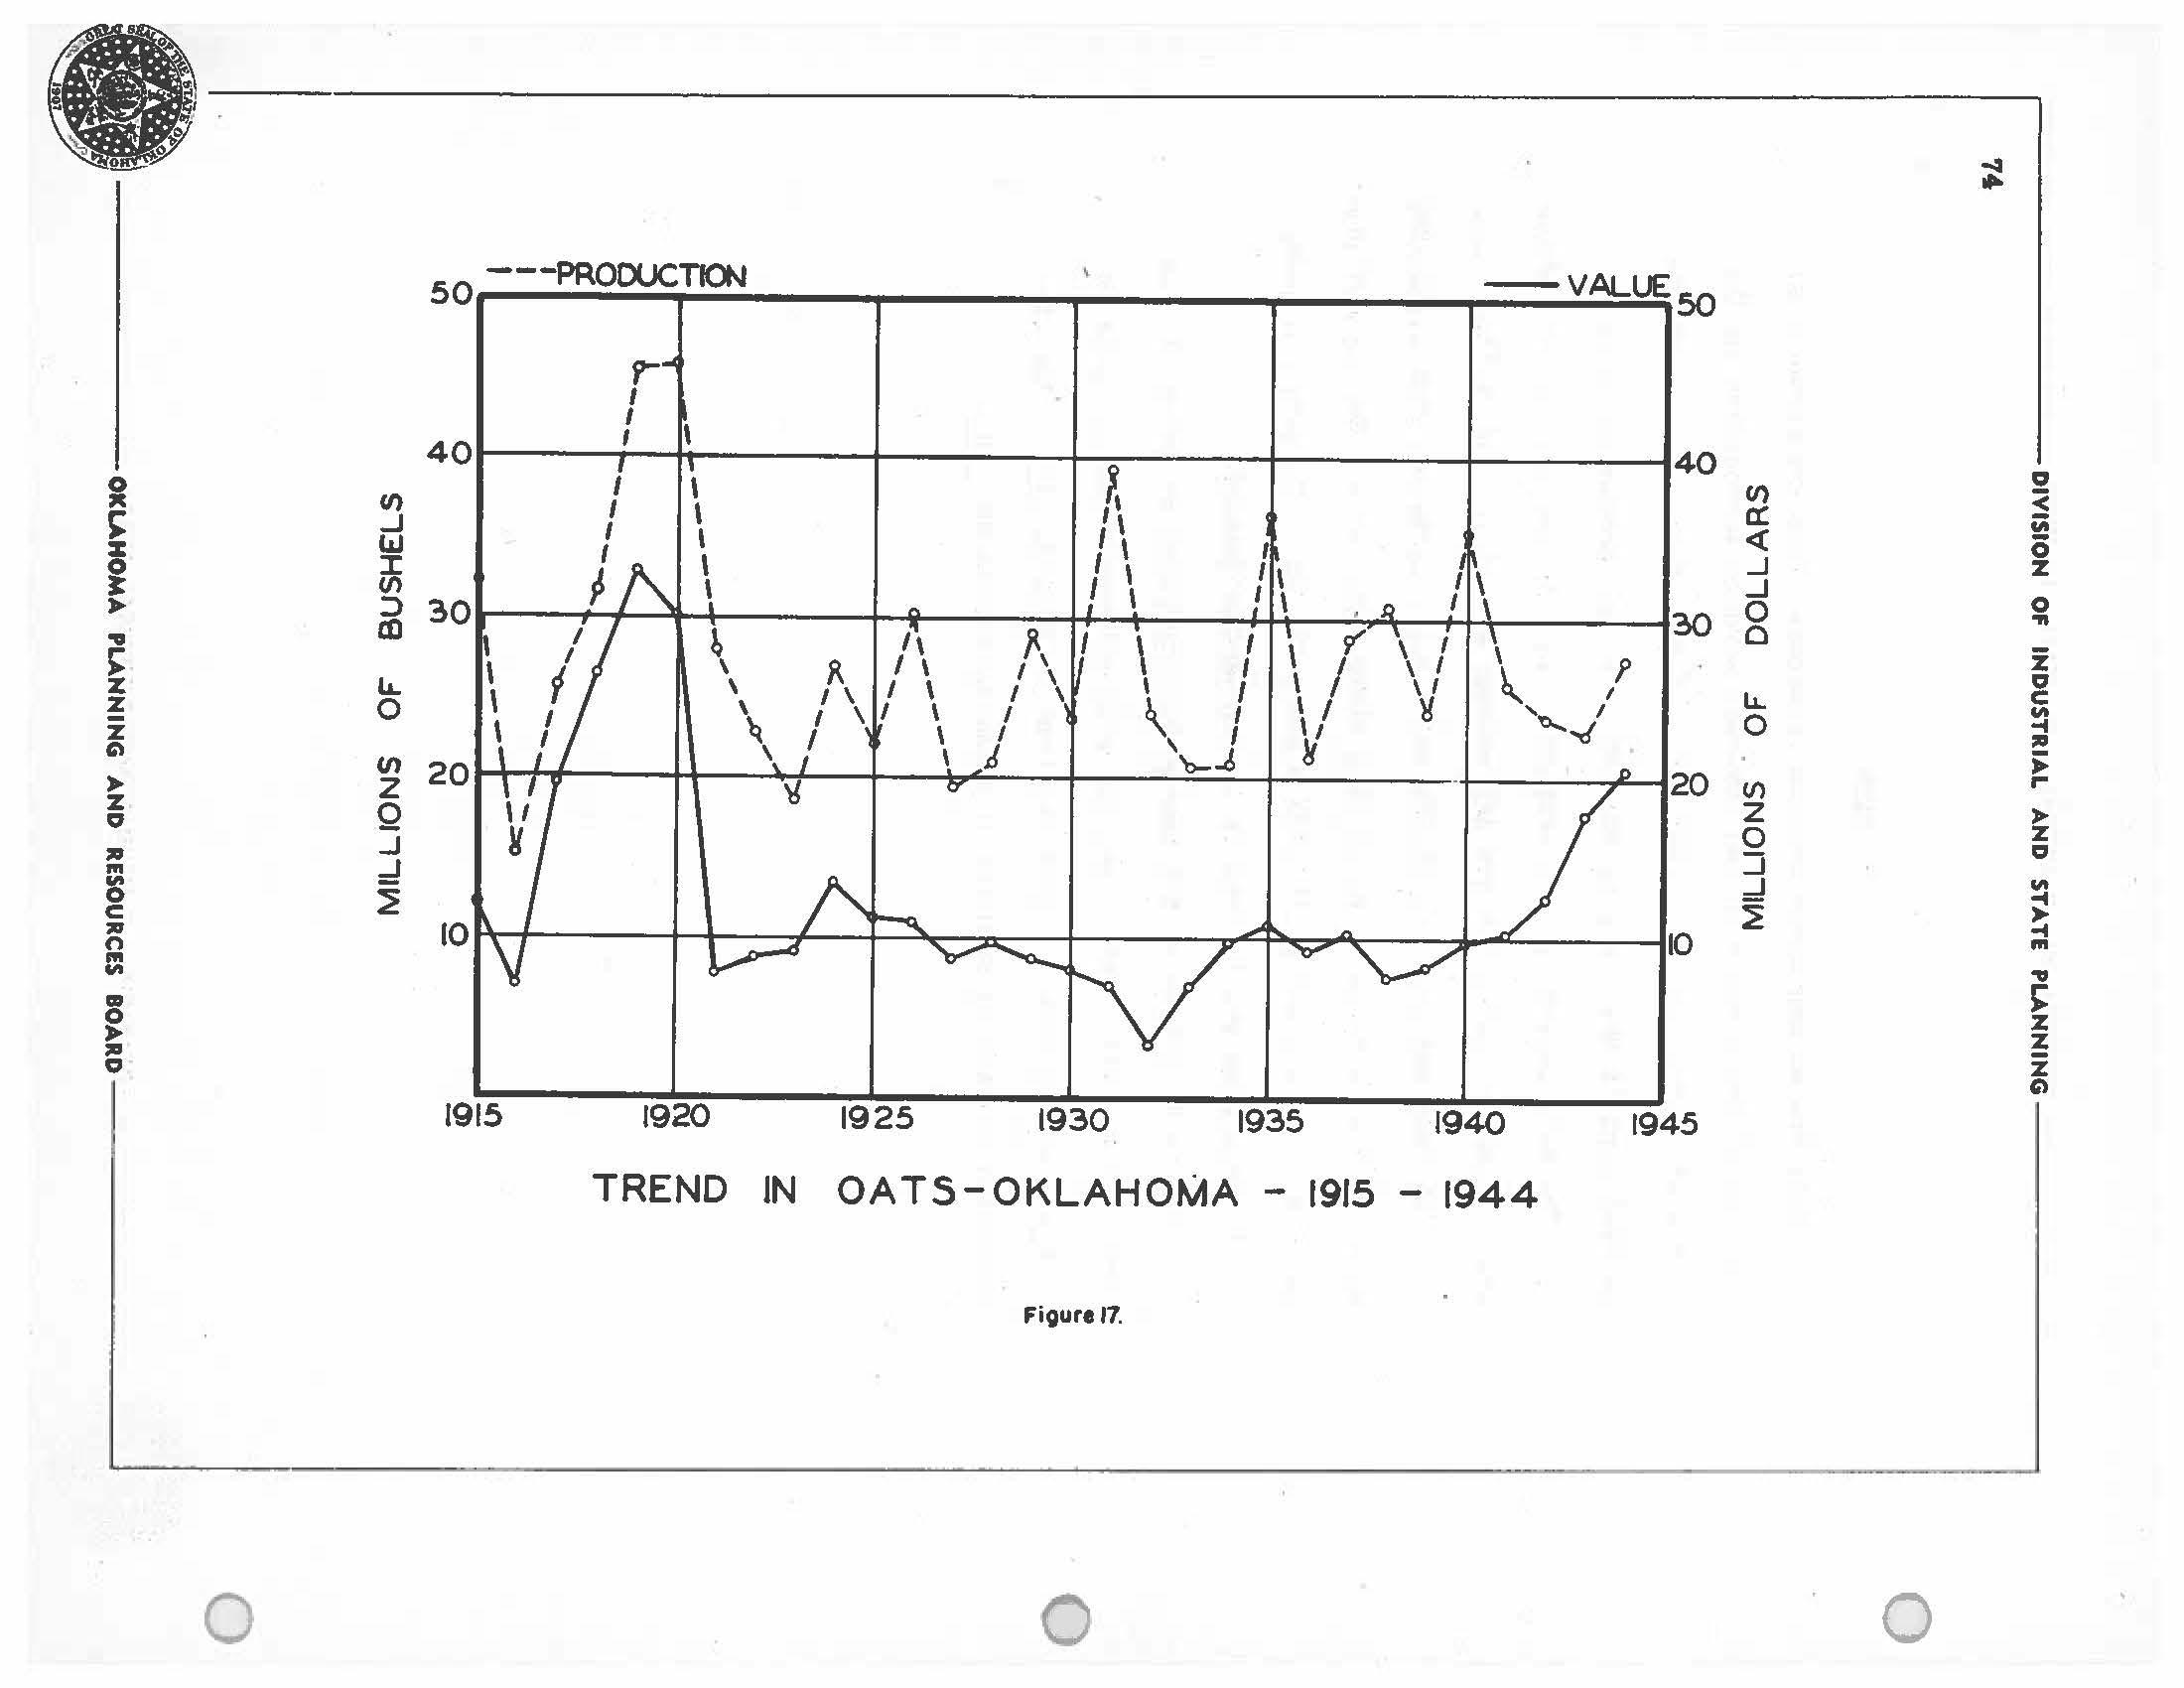
• ;: <) z i • % z z " z Cl ,., Ill ;s C ,., n Ill "' ID ,a Cl 0 (/) ..J laJ ::r (/) :::> '° u. 0 (/) 2 Q ..J ::I ---PRODUCTION -VALUE so-....;.........~~~-------.-----.------,.---.......,50 vi I 1. I\ <( \ I \ I ..J I\ I\ ...J ,, ,, 308 I /\ ,. f \ f \ '{' \ f \ R ,, 1\ 1 / 1/ I._ / I Li.. \ I \ I \ I \ ), I l / 'Y:J.......,J 0 ' I \I \ I '\ I li \ / \ j \).... '1 ·+-----?~ 20 Cl) 0 2 _J _J 11\/ I \ ;__/ 1 ""~ I Y-1'.......,, ho 1915 1920 1925 1930 1935 19~ 1945 TREND JN OATS-OKLAHOMA - 1915 - 1944
17. 0 0 Cl < "' 0 % 0 'ft z Cl C "' -I ,., rz Cl "' -I ?t Ill .., z z z "
Figure
TABlE NO. 16
OKLAJiOl:A
OA'IS I ,Acreage, Yield and Production-1900 - 1944
,

r------------ DIVISION OF INDUSTRIAL AND STATE PLANNING-----------, C 7ti
Yield per, Price ' Tota.l Acreage acre per , Year Production Harvested (bu.) B\.lshe1l/, Value (bu.) {dollars) I (dollars) 1900 10,800,000 360,000 30.0 1901 6,570,000 : 365,000 18.0 .48 3,154,000 1902 15,980,000 I 470,000 34.0 .35 5,593,000 1903 13,780,000 530,000 26.0 .34 : 4,685,000 1904 9,800,000 490,000 20.0 .37 3,626,000 1905 16,050,000 535,000 30.0 .31 4,976,000 1906 18,452,000 I 605,000 30.5 .30 5,536,000 1907 9,520,000 680,000 14.0 .48. 4,570,000 lSOS 15,625,000 625,000 2s.o .45 7,031,000 1909 16,626,000 609,000 27 .3 .49 8,147,000 1910 23,800,000 700, 000 34.0 .3s 9,044,000 1911 8,350,000 835,000 10.0 .4e 4,088,000 1912 22,050,000 900,000 24.5 .39 8,600,000 1913 17,280,000 I 960,000 18.o .42 7,258,000 1914 28,875,000 : 1,050,000 27.5 .41 11,839,000 ( 1915 32,250,000 1,290,000 25.0 .38 12,255,000 1916 15,250,000 1,220,000 12.s .46 7,015,000 1917 I 26,830,000 1;230,000 21.0 .76 19,631,000 19!8 31,625,000 l, 375,000 23.0 .84 26,565,000 1919 45,762,000 1,578,000 29.0 .72 32,949,000 1920 45,780,000 1,635,000 28.0 .66 30,215,000 1921 28,132,000 1,705,000 16 .5 .28 7,877,000 1922 l 2,780,000 1,340,000 17 .o .39 8,884,000 1923 18,638,000 1,066,000 17 .5 .49 9,133,000 1924 27,000,000 1,200,000 22.s .50 13 ,500,000 1925 22,116,000 1,164,000 19.0 .51 11,279,000 1926 30,245,000 1,:.ns ,ooo 23.0 .37 11,191,000 1927 19,448,000 1,144,000 17.0 .45 8,752,000 1928 20,984,000 976,000 21.5 .47 9,862.,000 1929 19,068,000 908,000 21.0 .46 8,771,000 1930 23,692,000 1,053,000 22.5 .34 8, 0 55,000 1931 39,416,000 1,516,000 26.0 .18 7,095,000 1932 24,012,000 1,334,000 18.0 .14 3,362,000 1933 20,738,000 1,121,000 18.5 .34 7 ,D51,000 ., 1Si4 • 20,922,000 1,268,000 16.5 .47 9,833,000 1935 ' 36,450,000 1,458,000 25.0 .30 ' 10,935,000 1936 I 21,232,000 1,327,000 16.0 .44 9,342,000 1937 28,844,000 1,407,000 20 .5 .36 10,384,000 1938 30,723,000 1,463,000 21.0 7,ci8l,OOO C
._., , ,01
OKLAHOMA PLANNING A"4D RESOURCES BOARD
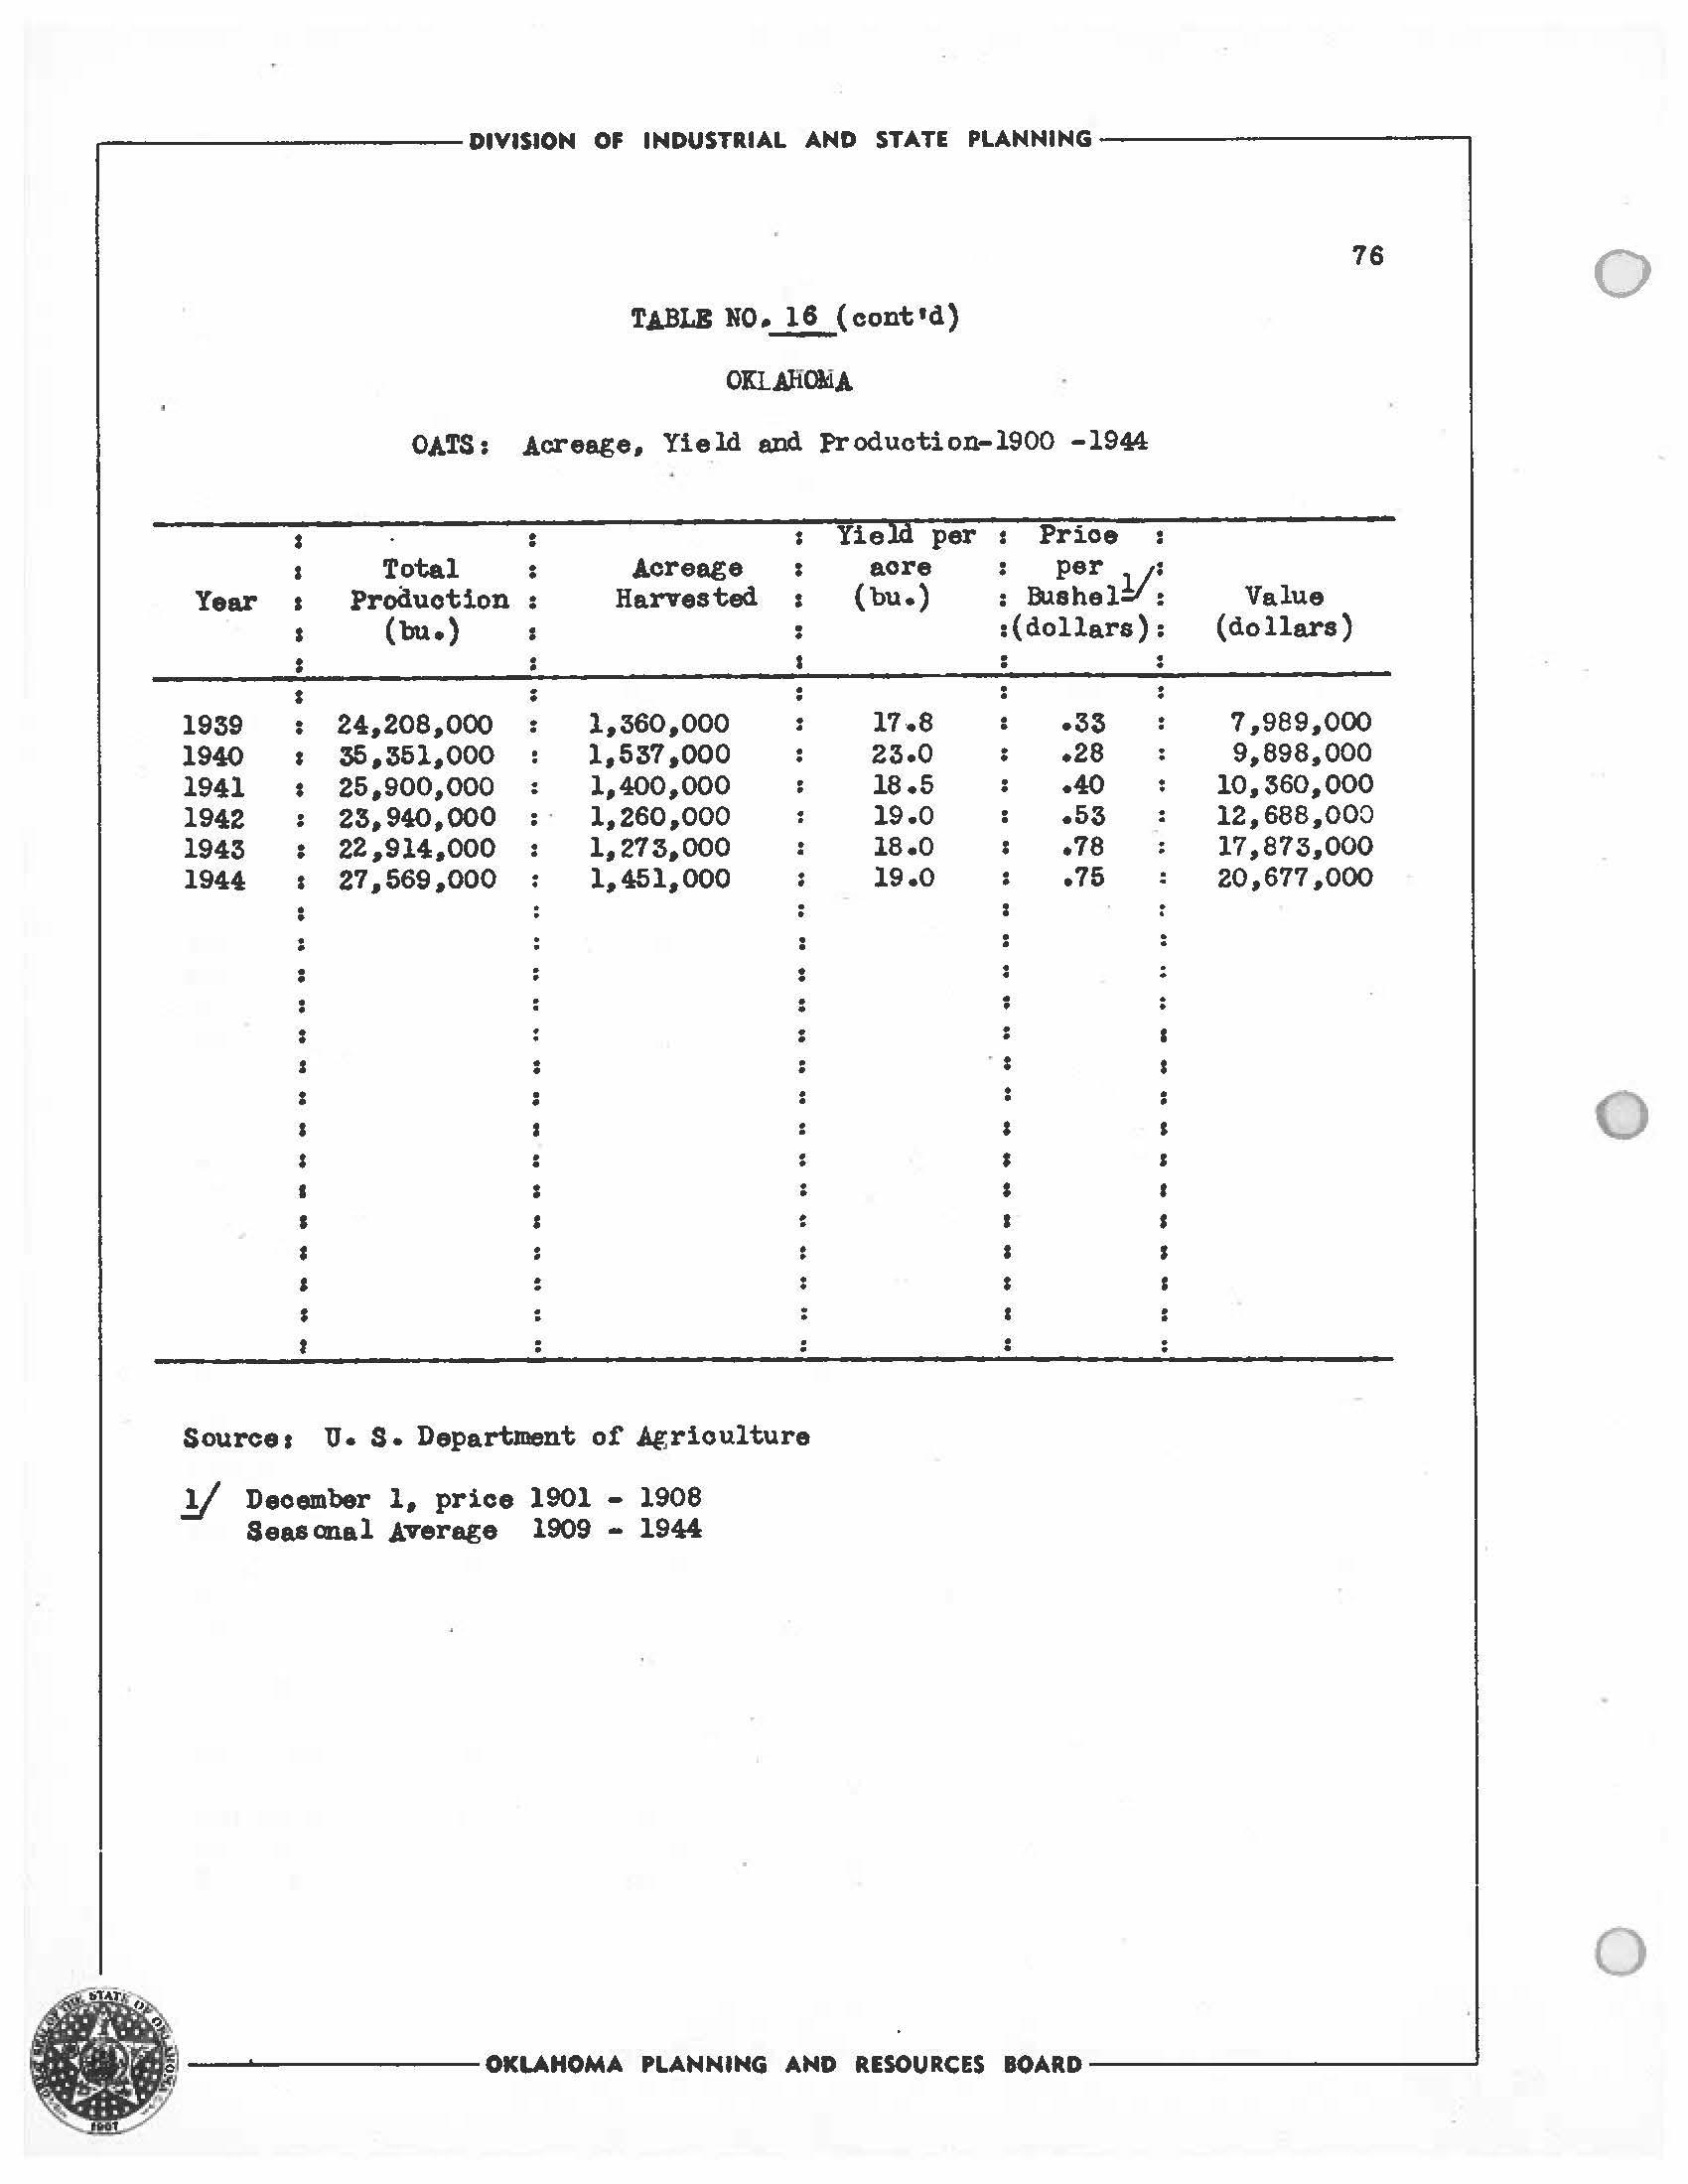
.----------- DIVISION OF INDUSTRIAL AND STATE PLANNING--------------,
OKl.AltOkiA OATS: Acreage. Yield and Produotion-1900 -1944 s s Year a a s Yield per a Price s 1939 1940 s 1941 s 1942 : 1943 . . 1944 s Total Production (bu.) 24.208.000 35.361.000 25.900,000 23.940,000 22.914.000 27,569,000 . Acreage Harvested 1.360.000 1.537 .ooo 1,400.000 1,2so.ooo 1,273,000 1,451.000 Sources u. s. Department of Agriculture J/ December 1. price 1901 - 1908 Seas anal Average 1909 - 1944 acre {bu.) 17.8 23.0 18.5 19.0 18.0 19.0 per : : Bushel!/: : (dollars) : .33 : .28 : .40 .53 .78 .75 76 Value {dollars) 7.989.000 9.898.000 10.:sBo.ooo 12. 688.00:J 11.a1:s.ooo 20,677.000 _......,_______ OKLAHOMA PLANNING AND RESOURCES BOARD-------------' 0 0
TABLE NO .._l!,,_{cont•d)

~ .\ ,.,, :~· ZI ·~ "''~~J· .:...~:01~ 0 ;Ill: ,.. :z: 0 .. ,.. % % z G\ % 0 ,ir ffl .,. 0 C :,Ill n ... .,. .. 0 ,ir 0 r
RESOURCESBOA SCAtlt-STATUT/t //11/Ll!S w 0 10 20 30 to so DISTRIBUTION OF OATS 1944 Legend Acres I
-
and
HARPER
CIMARRON TEXAS IBiAvc.ii OKLAHOMA PLANNING 8
I 100-9,999 V///A 10,000-19,999 I~ 20,00 o- 29,999 uDA 30,000- 39,999
40,000
Over
) .., .., C, < cii 0 % 0 .., z 0 C :,,:, ,.. z 0 "' -4 -4 ... "Ill % % % G\
Figure 18
County
TABLE N0.-1,!_
OKI-IAHOdA OATS
Acreage, Yield, Produotion--1944 by Counties

1 Yield -per, Yield per, Planted ' Harvested s planted : Harvested, 1 Acreage I Acreage aore , acre (acres) 1
(bu.) (bu.)
~----------DIVISION OF INDUSTRIAL AND STAT£ PLANNING------------,
Ade.ir Ali'alfa. Atoka Beaver BeolchaJn Blaine Bryan Caddo Canadian Carter Cherokee Chootaw Cimarron Cleveland Coal Comanche Cotton Craig Creek Custer Delaware Dewey Bllis Garfield Garvin Grady Grant Greer Harmon Harper Haskell Hughes Jackson Jeff'ersan Johnston Kay Kingfisher Kiowa I \
·4,200 : 27,100 2,300 4,000 , 11,700 20,200 12,800 36,.SOO I 43,700 10,700 8,500 l, 100 600 19,200 5,100 43,400 43,900 79,000 13,100 34,500 19,200 11,800 8,100 35,500 13,000 28,200 19,600 20,300 3,300 7,200 6,900 5,500 4,000 26,200 2,200 3,900 11,300 19,300 12,600 36,000 42,700 10,300 8,300 1,100 600 18,400 5,000 41,900 42,200 74,000 12,900 33,700 18,600 11,500 7,900 32,400 12,500 27,000 19,400 19,200 3,300 7,000 6,400 5,200 15.0 28.7 17 .7 23.2 20.4 22.2 14.5 24.5 26.o 17 .9 15.2 17 .3 23.8 21.1 17.7 i2.o 21.3 15.8 29.7 18.5 23.7 21.1 23.3 14.7 2s.o 26.6 18.6 15.6 17 .3 23.8 28.3 18. l i2.a 22.2 Produotion (bu.) 63,200 777,,400 40,600 92,,600 238,300 449,400 185,200 900,600 l,134,,500 191,800 129,600 19,000 14,300 520,,800 90,400 956,300 936,300 594,500 277,900 919,900 207,200 306,600 141,300 792,700 229,300 754,100 451,700 350,t:iOO 44,900 134,900 82,400 95,400 347,700 267,100 48,8UO 493,700 22,600 : 19,100 3,000 21,100 22,800 : 45,500 21,400 18,400 2,900 I 20,800 22,00v 43,000 7.5 21.2 26.7 10.8 26 .o 17.4 2 3. 7 17 .6 26.7 23.0 17. 3 13.6 18 .7 11.9 17 .3 15.4 14.0 16.3 23.4 28.7 19.l 8.0 21.5 27.3 11.1 26.7 17.9 24.5 18.3 27.9 23.3 18.3 13.6 19.3 12.9 18 -~ 16.2 14.5 16.8 23.7 29.8 20.2 , 654,,t:iOO , 867,600 78 1 OKLAHOMA PLANNING AND RESOURCES BOARD _____________. 1 0 0 0
(aores)
TABl.E NO _!l_(cont•d)
OKl.JJ-;Olf.A OATS
Acr e a r, e, Yield, Produotion--1944 by Counties
Yield per:" Yield per a Planted Harvested planted I Harvested: Production County Aore ar, e Acrenge a.ere acre

-----------DIVISION OF INDUSTRIAL AND STATE PLANNING-------------, C 79
(acres) (acres) {bu.) (bu.) (bu.) La-t.i.mer 600 600 13.7 13.7 8,200 leFlore 1,300 1,200 18 .8 20.4 24,500 Lincoln 26,700 26,400 21.9 22.2 s 685,700 Logan 28,300 27,700 19.7 20.2 s 558,900 Love 1.~00 1,800 19.4 20.4 36,800 MoClain 10,400 l0, 100 26.l 26.E 271,100 Afo Curtain 200 200 18 .o 18 .o 3,600 McIntosh 12,700 11,900 13.4 14.3 170,500 Major 16,300 16,900 28.0 2s.e : 457,200 Marshall 12,30 0 12,100 14.9 15.2 183,400 Ma.yes 41,100 40,200 12 .1 12.3 495,500 Murray 7,800 7,600 22 .2 22.8 173,500 Muskogee 33,100 31,700 13.9 14.5 460,100 Noble 32,700 32,100 19.8 20.2 s 647,700 ( Nowata 39,6 0 0 37,600 8.4 8.9 333,000 Okfuskee 11,100 11,000 23.3 23.5 i 258,100 Oklahoma 27,POO s 26,900 21.1 21 9 589,400 Oknrulgee 23,10 0 s 22,300 15.5 16.l 358,300 Osage 36,800 34,600 19.7 21.0 s 726,500 Ottawa 25,100 2::i,300 9.4 10.1 236,100 Fawnee 38,000 36,800 16.l 16.6 611,500 Payne 46,400 45,400 J.7.4 17.8 : 808,200 Pittsb.irg 8,6 00 8,300 14.8 15.3 127,300 Pontotoo 4,600 4,400 18.0 18.8 82,700 Pottawatomie 19,200 ' ~c, ') N) 21.6 21.e 414,600 Pushmataha. 200 foo 15.5 15.5 3,100 Roger Mills 6,900 5,600 19.5 20.s s 115,000 Rogers 59,60 0 57,700 10.3 10 . 7 616,300 Seminole 10,900 10,200 20.6 22 .o 224,400 Sequoyah 3,000 2,800 17 .3 18 .5 5 1,900 Stephens 13,000 12,700 14.6 1s.o ' 190,200 Texas 1,100 ' 1,100 26.9 26.9 29,600 Tillman I 25,000 24,900 25.3 25.4 a 632,000 Tulsa 31,300 29,900 11.a 12.3 s 368,500 Wagoner s 39,100 36,600 8 .6 9 .2 337,500 Washington 22,700 21,700 14.C 14.6 s 317 ,ooo Wash i ta ' 26,000 ' 24,900 21.6 22 .6 a 561,500 Woods 19,700 19,300 26.3 26.8 518 ,ooo Woodward 9,100 ' 8,800 19.6 20.3 178,400
u. s. Department or Agriculture i,, I
':\': I l
Source:
OKLAHOMA PLANNING AND RESOURCES BOARD
RY~ AND B.Euil..EY
As a ot:tsh grain crop rye is of minor iniportence ill Oklanoma. Its pri noipal uses a.re ior a winter cover crop• oomptlnion crop with winter le t umes lind ~in~r p«,.sture.
The 1944 harvest tlCrea.g e totaled i5i,ooo acres yielding l,3~0.000 bushels. 'l'hi8 was the greatest crop oi' record.
tee.rly data for rye ttre given in Tabl e No.~.
Barlev
In 1944 bti.rley re.nkea 12th in ~ash value e.mong the prinoipal crops in Oklahoma. Comp&reci to the other grains its acreagt1 is rel at1 ve ! y small. 'l'he 1944 orop of 3,990,000 bushels we.a hlirvested from 210,000 acres, the smallest acreage since lb~7. The trend in production ttn<l value of b11..dey 11.re shown on F•i g ure No.~. Yearly data is aunu11arized in ·Table No. 19 •
The au-row winter types 01· bt>rley ar e most common in the ::;tate. Barley ia used prinoipal y for grain and pasture.
Table No._!2._ gives county data ror barley in 1944.
,,------------ DIVISION OF INDUSTRIAL AND STATE PLANNING----------80
---------OKLAHOMA PLANNING AND RESOURCES BOARD--------- ---J 0 0 0
TABLE NO- 18
OKI.AfiCJ.iA
RYE: Aoreage, Yield per a.ere am production. 1900 - 1 944
s

( ,------------ DIVISION OF INDUSTRIAL AND STATE PLANNING-----------,
lSOO 1901 1902 1903 1904 1905 1906 1907 1908 1909 1910 1911 1912 191:; 1914 1915 1916 1917 1918 1919 1920 1921 1922 1923 19 24 1925 1926 1927 1928 1925 1530 1931 1932 1933 1934 1935 1936 1937 1938 1939 J940 1941 1942 1943 1944 : (bu.) 50,000 60,000 69,000 48,000 35,000 58,000 55,000 30,000 36,000 35,000 38,000 28,000 ,42,000 105,000 350,000 352,000 405,000 416,000 424,000 : 720,000 437,000 259,000 214,000 s 248,000 230,000 160,000 198,000 76,000 72,000 71,000 120 ,ooo 184,000 124,000 72,000 107,000 225,000 168,000 423,000 459,000 1, 1S3,000 969,000 :l,224,000 : l,18 8 ,000 897 ,ooo 1,520,000 Acreage Harvested 5,000 5,000 6,000 6,000 5,000 5,000 5,000 5,000 4,000 4,000 4,000 5,000 5,000 15,000 35,000 37,000 54,000 52,000 53,000 72,000 46,000 37,000 : 33,000 31,000 27,00 0 20,000 18,000 9,000 9,000 : 8,000 16,000 16,000 13,000 12,000 17,000 30,000 28,000 47,000 51,000 1£3,C00 102,000 1 36,000 125,000 138 ,ooo 15 2 ,000 Yield per Acre (b.l.) 10.0 12.0 11.5 a.o 1.0 11.s 11.0 6.0 9.0 8.7 9.5 5.5 8.5 1.0 10.0 9.5 7.5 8 .o . a.o 10.0 9.5 1.0 6.5 a.o 8.5 a.o 11.0 8.5 8 0 a.s 7.5 11.s 9.5 6.0 6.3 7.5 6.0 9 0 9.0 9.7 9.5 9. 0 &.5 6.5 10.0 Price p~r1 : Bushel!, , (dollars) 1.25 1.87 1.50 1 . 00 .66 .so .so 1.01 1.10 .90 .99 .92 .90 .62 .32 .26 .69 .86 .69 .94 .77 -46 .44 .56 66 1.02 1.07 Value (dollars) sos.ooo 707,000 79 3,00 0 1,oao.000 437 ,ooo 171,000 171,000 223,000 232,000 176.000 178,000 75,000 66,000 64,000 74,000 59,000 32,000 50,000 92,000 145.000 135,000 326,000 211,000 501,000 426,000 685.000 784,000 915,000 1,6 26,000
Total Year: Production:
Y Dec.
1916-1929;
1930-1944 81 ---------OKLAHOMA PLANNING AND RESOURCES BOARD __________ ---1
~ource: U S. Dept. 01· Agriculture
l price
Seasoual Average frice
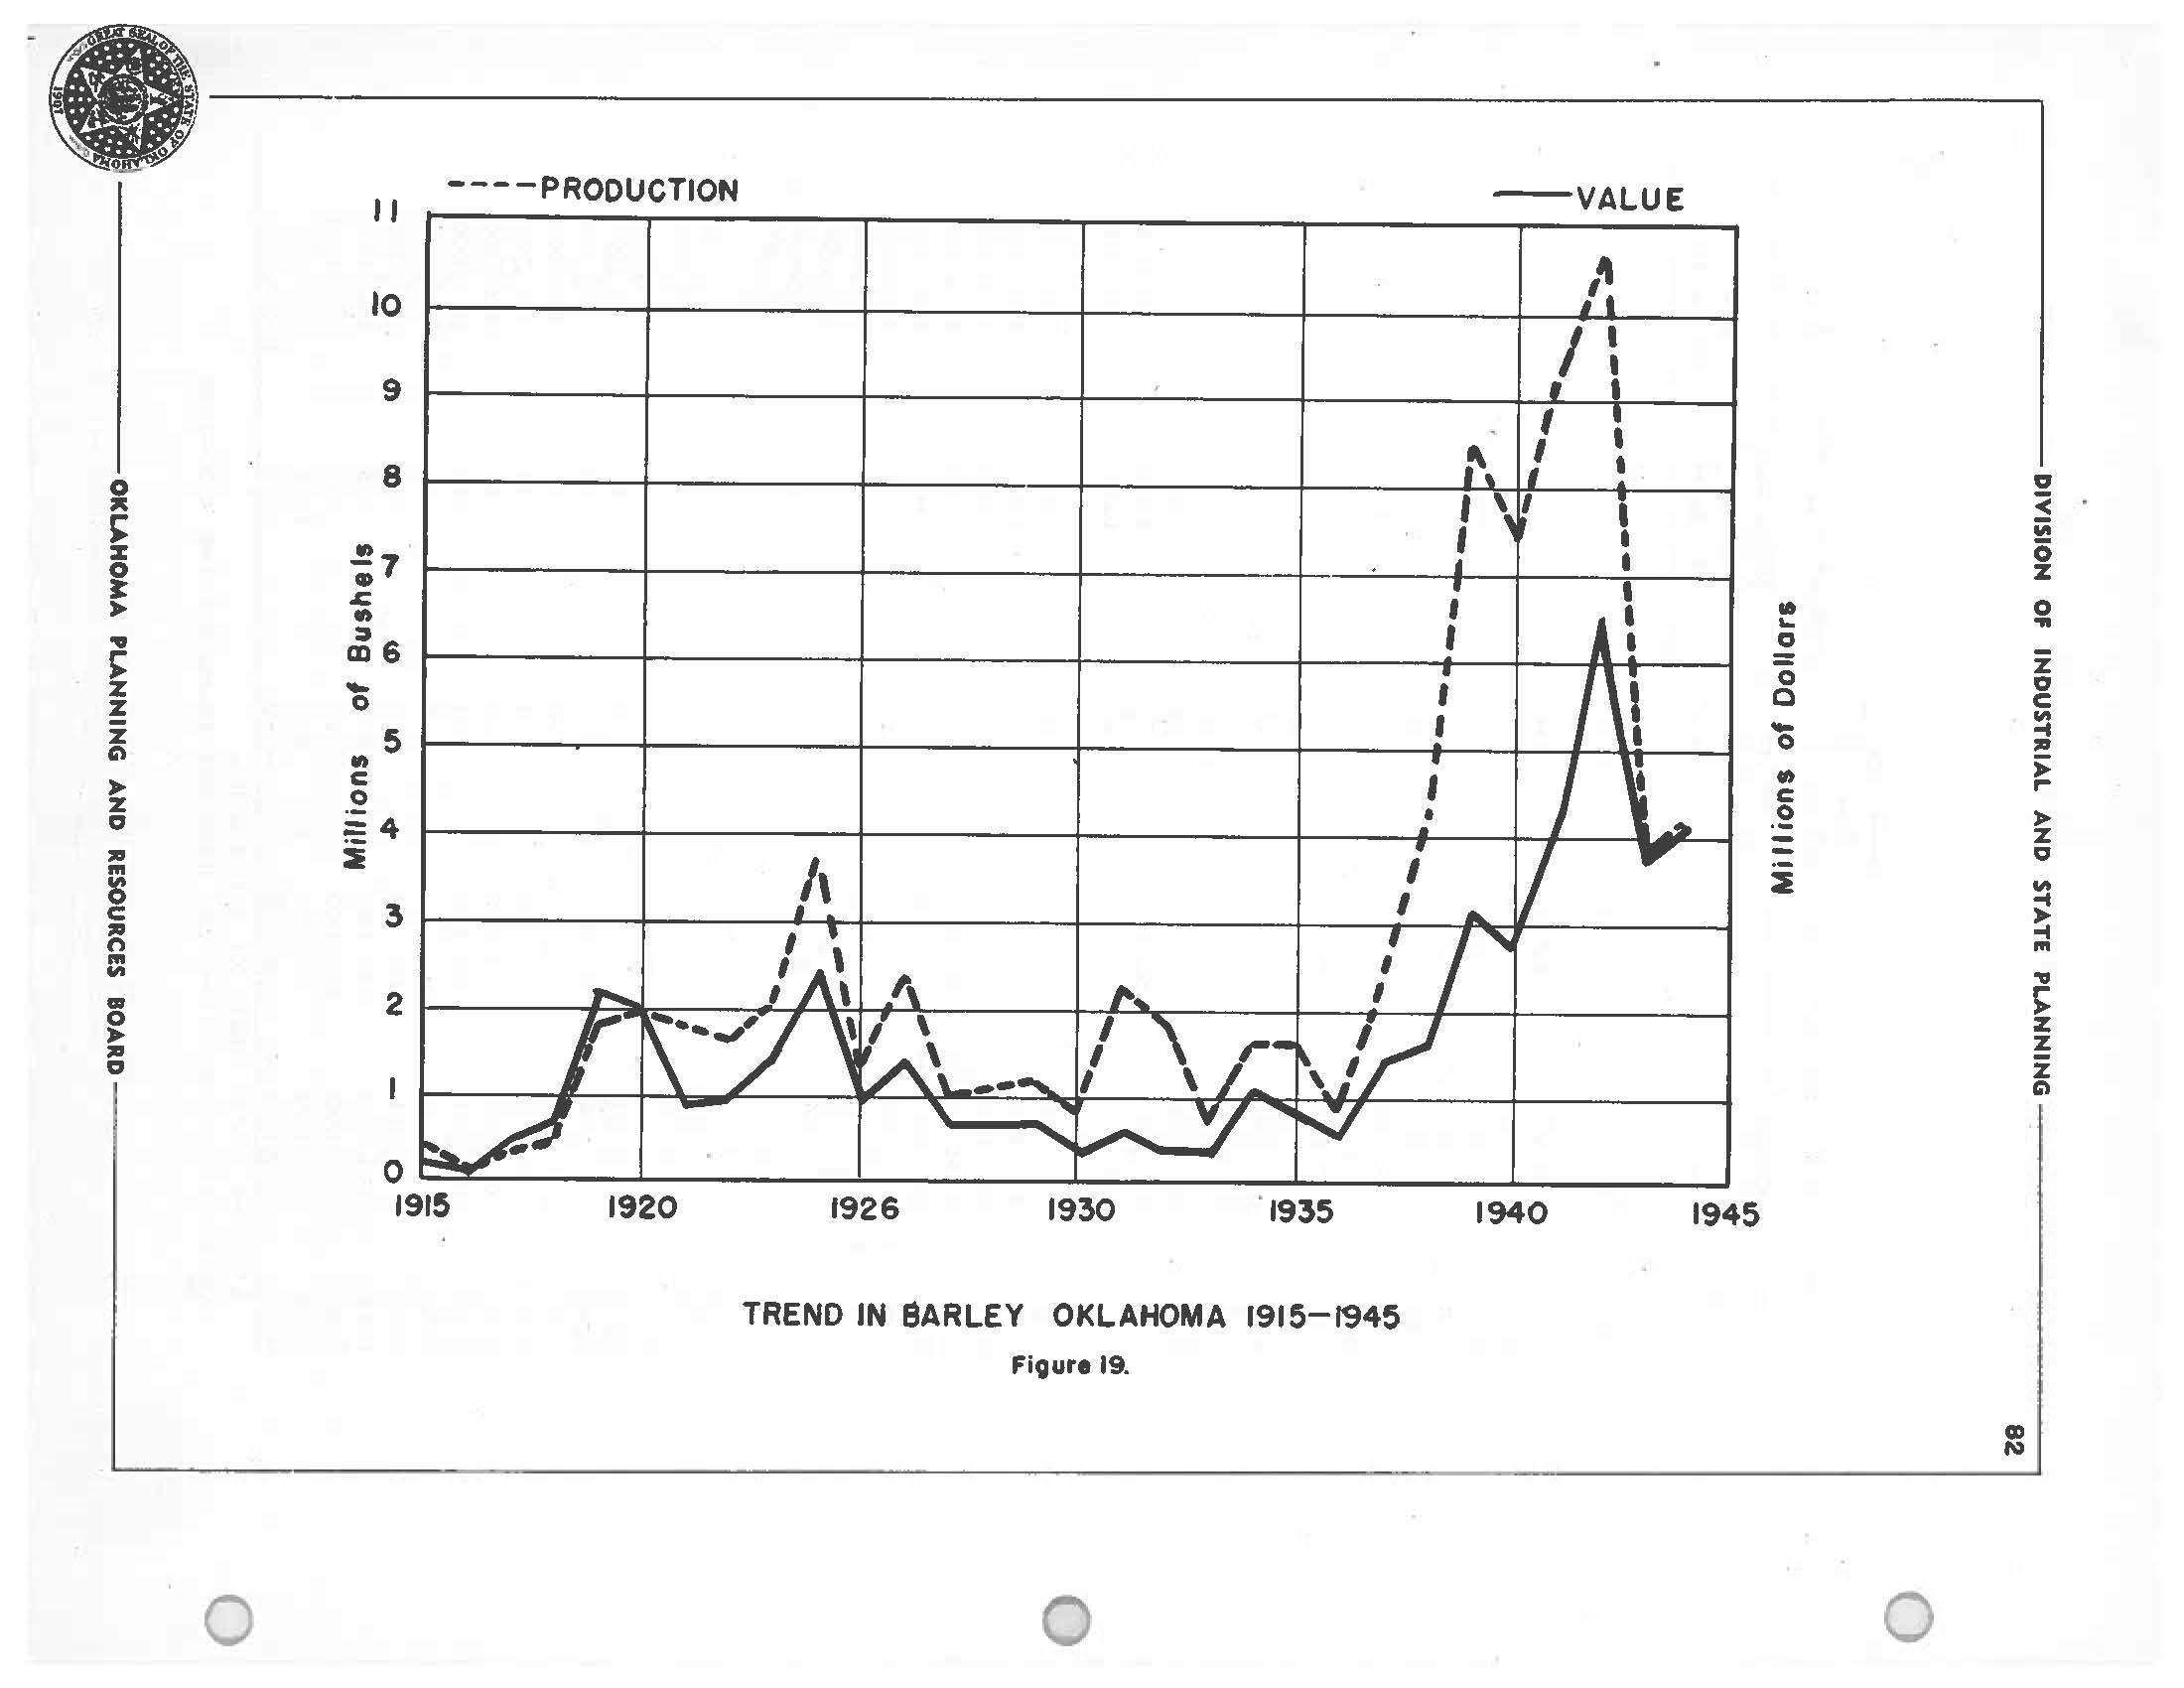
• • 1' "" 0 0~i !j;;: z I .. i z z G\ z 0 JD "' g JD t') ffl .... ar JD 0 0 " ----PRODUCTION -VALUE l• I I I I , ' 10 I I I /: 9 8 I I 1 '• ~7 CD 16 I I I I I ; I I 51 I A I 0 1 4 I I 1 I J I / t I I, 3 I I. ' I ' I I I II 1'..V I 2 I .. 1 '•1 ' I c, I - ' I I ~- -~ r ,- , .. . " , • 0 1915 --- ' 1920 1926 1930 · 1935
0 1940 1945 .. .. C, 0 C 'o • C .2·0 CD N ICJ < iii 0 z 0 ... z 0 C JD ,.. z g .... ... "' "O z z % G\
TREND IN SARLEY OKLAHOMA 1915-1945 Fioure 19.
TABLE NO. 19
OKLAHl.11irBARLEY: Acreage, Yield, and Production 1900 - 1944

,------------ DIVISION OF INDUSTRIAL AND STATE PLANNING-------:------,
: Total : Yield : Price Year Production : Acreage per per!/ Ve.lue : (Bushels) Harvested : Acre : Bushel (dollars) : (bu.) : ( dol.L&.rs) : : : 1900 320,000 16,000 : 20.0 : 1901 210,000 14,000 15.0 : 1902 338,000 15,000 ; 22.5 : 1903 : 280,000 14,000 20.0 1904 182,000 14,000 : 13.0 1905 : 208,000 : 13,000 16.0 1906 247,000 : 13,000 : 19.0 1907 150,000 : 13,000 11.5 1908 150,000 : 13,000 11.5 1909 : 124,000 10,000 12.4 .60 74,000 1910 245,000 14,000 17.5 • 51 125,000 1911 135,000 27,000 s.o .60 81,000 1912 412,000 25,000 16. 5 • 55 227,000 1913 119,000 17,000 7.0 .64 76,000 1914 289,000 17,000 17.0 .57 166,000 1915 : 370,000 19,000 19.6 .49 181,000 1916 . 150,000 20,000 7.5 .68 102,000 . 1917 : 325,000 26,000 12.5 l. 31 426,000 ( 1918 : 473,000 43,000 11.0 1.43 676,000 1919 : 1,771,000 77,000 23.0 1.19 2,107,000 19~0 : 1,914,000 116,000 16.5 : 1.01 2,048.000 1921 : 1,769,000 122,000 14. 5 .49 867,000 1922 : l, 612,000 129,000 12.5 .58 935,000 1923 : 2,000,000 129,000 15.5 .68 1,360,000 1924 3,675,000 210,000 17.5 .65 2,389,000 1925 : 1,24~.ooo 113,000 11.0 • 72 895,000 1926 2,380,000 : ll9,000 ~o.o • 59 1,404,000 1927 : 979,000 : 89,000 11.0 .67 656,000 1928 : 1,023,000 62,000 16.5 .66 675,000 1929 : l, 136,000 71,000 : 16.0 .59 670,000 1930 : 768,000 53,000 14.5 • f:>O ;',84,000 19~1 : 2,226,000 106,000 21.0 .26 579,000 1932 : 1,794,000 1~8,000 13.0 .19 Ml,000 1933 : 657,000 73,000 9.0 .47 309,000 1934 l, 600,000 100,000 16.0 .66 1,056,000 1935 l, 568,000 : 95,000 16.5 .50 784,000 1936 780,000 : 78,000 10.0 .68 sso,ooo 1937 2,258,000 129,000 17~ 5 • 61 1,377,000 1938 4,142,000 : 218,000 19.0 .37 1. 5;53,000 1939 8,452,000 : 525,000 16.l .37 3,127,000 1940 7,310,000 430,000 17.0 .37 2,705,000 1941 9,216,000 : 512,000 18.0 .45 4,147,000 1942 :10,625,000 6G5 1 000 17.0 .61 6,481,000 1943 : 3,750,000 375 000 10.0 .98 3,675,000 1944 3,990i000 210:000 19.0 1.02 4,070,000 L
83
"' I
I '.!.!1
Source: u. s. Dept. of At riculture
OKLAHOMA PLANNING AND RESOURCES BOARD
TA.BIE HO. 20 OK lJJJOJAA BANI.Ex
,Acreage. Yield, Production--1944 by Counties
Pieiited : Harvested: fie!cl per 1 Yiela per I • County I .Acreage 1 Acreage sp lanted acre I Harvested : (acres) 1 (acres) s(bushels) I acre Proauotion I I , ( bushela) I

~---------DIVISION OF INDUSTRIAL AND STATE PLANNING-----------, 84 0
{bushels) Adair 200 200 ' 15.5 ' 15.5 I I ' 3,100 Alfalfa 6,100 s.ooo s 24.0 24.4 146,600 Atoka 500 500 12.6 12.6 ' 6,300 ' : Beaver 22,600 22.100 I 19.4 19.8 438,500 BeokhaJD 4,.500 4,100 15.6 ' 17 .2 70,400 Blaine l,.500 l.,500 I 21.0 21.0 31,500 Bryan 500 500 : 15.6 15.t> 7,800 Caddo 1.,800 1,800 19.7 19.7 35,400 Canadian 1,400 1,300 22.9 24.6 32,000 Carter 1,200 1,200 15.8 15.8 18,900 Cherokee 300 300 14.7 14.7 4,400 Choctaw Cimarron 22,100 21,300 19.4 20.1 427,900 Clevelam : 900 900 18.3 18.3 16,500 Coal 200 200 l2 .5 12.5 2,500 Comanche 1,500 1,200 I 15.o 18.8 22,500 0 Cotton 2,200 1 2,200 16.5 16.5 36,400 Craig 500 500 13.2 13.2 6,600 Creek 200 200 14.5 14.5 2,900 Custer 3,600 3,600 21.0 21.0 75,600 Delaware 500 500 15.0 15.o 7,.500 Dewe1 2,300 2,200 19.7 20.6 45,300 Bll1s 5,600 5,.300 18.2 18.9 100,300 Garfield 5,.000 . 4,900 I 21.6 I 22.1 108,.200 Garvin 1,200 . 1,100 10.7 11.6 12,,800 : I Grady 2,200 1,900 16.9 I 19.5 37,100 Grant 7,100 7,100 22.a 22.a 161,600 Greer 3,900 3,6 -~o 12.2 13.2 47,400 Harmon 2,300 I 1,800 8.6 11.0 19,800 Harper 9,800 9,.700 16.8 17.0 165,000 • Haskell 100 I 100 18.0 18.0 1,800 Hughes 100 i 100 13.0 13.0 1,,300 Jaokaon 5,200 4,400 8.1 9.6 42,200 Jefferson 600 I 600 15.5 15.5 9,.300 ; : Johnston 600 500 11.2 13.4 6.100 Kay 1,700 l,,700 25.0 25.0 42,.500 Kingfisher : 2,200 1,900 16.9 19.5 37,100 Kiowa : 4,300 : 4,100 20.3 21.3 87,200 Lati.'!ler : LeFlore : : Lincoln : 600 : 600 25.5 25.5 15,300 0 • ~
-OKLAHOMA PLANNING AND RESOURCES BOARD
TABLE NO. 20 (cont'd) OKL.An<l A B.ARLEY Acrear,e, Yielq, Froducti ~n--1944 by Counties
:Planted ' : Harvested : Yield per 1 Yield per County :Aoree.ge r A,rcrea[e :Planted ao re I H!il"vested ,(acres) (acres) (bushels) acre

DIVISION OF INDUSTRIAL AND STATE PLAMMIMG C 86
Production • : (bushels) (bushels) Logan 900 900 26.2 26.2 : 23,600 Love 300 300 14.3 14.3 4,300 McClain 900 900 12. 'i I 12 •'i 11,400 UoCurtain : McIntosh 100 100 13.0 : 13.0 1,300 Major 900 900 24.0 24.0 21,600 Y-arshall 1,400 1,300 12 .7 13.7 17,800 Mayes 1,400 1,300 13.1 : 14.2 18,400 liurray 500 500 13.4 13.4 6,700 Muskogee 500 400 12.4 16 .5 6,200 Moble : 1,200 1,100 17.0 : 18.5 : 20,400 Nowata. 1,400 1,100 10.6 13.5 14,900 Okfuskee 100 100 13.0 13.0 1,300 Oklahoma I 2,100 2,000 15.7 16.5 33,000 C Okmulgee 300 300 12.0 12 .o 3,600 0S8f.b 600 500 14.2 17 .o 8,500 Qtta'Yla 300 300 12.7 12.7 3,800 Pawnee 500 600 1s.e 16.8 8,400 Payne 600 600 17 .3 17 .3 10,400 Pittsburg 300 300 14.7 14.7 4,400 Pontotoc 400 400 13.0 13.0 5,200 Pottawatomie 1,000 900 13.e 15.3 13,800 PushmatahaRoger Mills 1,300 1,200 18 .7 20.2 24,300 Rogers 900 800 13.1 14.8 11,800 Seminole 200 200 14.5 14.5 2,900 Sequoyah 100 100 16.0 16.0 1,600 Stephens 600 600 13.5 : 13.5 8,100 Texas :46,400 43,700 18.7 19.8 867,100 Tillman : 6,500 6,200 17.7 : 18.6 116,300 Tulsa 800 800 15.9 : 15.9 12,700 Wagoner : 1,400 1,300 14. l 15.2 19,800 Washington 1,500 1,300 12.7 14.6 19,000 l{ashi ta : 6,900 6,600 16.6 17 .5 115,600 Woods 8,500 8,500 20.9 20.9 177,900 \'i>odward : 3,500 3,400 17 .5 18.0 61,200
L OKLAHOMA PLANNING AND RESOURCIS IOARD----------~
Source: U. S. Department oi' .Agriculture
SORGHUKS
Sorghum• haTe good drought re1i1ti.D.g qualitiee and are playing an important roll in •stern Oklahoma where they e.re replacing many acres
1 prnioualy daToted to oorn and other grain crops. 'l'he principal typea adapted to Oklahana are the kafira. miloa. and •-•et sorghums. Commercially milos are probably the most important. Grain sorghums are used mainly for gra.in and feed while the anet sorghums are used primarily for hay. fodder and silage.
In 1944 Oklahoma ranked third in the nation with a production ot oTer 12 million bushels of grain sorghums. Table No . _,!1,giTas 1orghum data by counties for 1944 .
Table No.~ gives acreage, yield and production data tor aorghwa used for syrup. Acreage, yield and production data for all 1orgbUlll ie given in Tabla No._!!.
BAY
Prari• hay is an important commercial orop only in Northeast Oklahoma where the harvest is largely from native wild grasses.
Tame bay production in 1944 totaled 1.331,000 tons and wild bay 668,000 tons. Yearly data on tame and wild hay are given in Tables Ho. 24 and 25. Important n&tive hay grasses are Little Blue Stem, Big Blue item, Switch Grass, Indian Grass, tUld Side-Oat Gruaa. l'l-end1 in tame bay are 1ho11D on Figure No. 20.

The more important tame graaaea are Benauda. Sudan and Annual rye.
Commonly used legumes for pasture inc l ude sweet oloTer, lespediza. vetoh yellow hop, white dutob and bur clovers. and blaok medic.
.------------ DIVISION OF INDUSTRIAL AND STATE PLANNING -------------,
86
---------O"'LA"OMA PLANNING AND RESOURCES BOARD ------------' 0 0

.------------DIVISION OF INDUSTRIAL AND STATE PLANNING------------, r
---
For All Purposes Harvest for Grain County Pianted : Harvested t :Yield Per: Acreage : Acreage : Acreage Acre : Production (acres) : (acres) : (acres) : (bu.) (bu.) Adair : 3,000 : 3,000 : 900 7.8 : 7,000 Alfalfa : 21,500 21,300 : 1,800 16.7 : 28,300 Atoka : 10,400 10,100 : 1,500 : 7. 3 : 10,900 Beaver : 103,400 99,600 44,600 14.9 : 666,300 Beckham 88,600 86,800 : 50. 700 14.2 720,200 Blaine 30,600 29,200 7.100 ; 14.5 103,200 Bryan 16,900 16,700 4,900 10.6 52,000 Caddo 112,700 110,400 48,400 13.6 659,900 Canadian 31,000 30,400 14,800 : 14.6 216,300 Ce.rt.er 18,800 18,400 4,500 8.3 37,500 Cherokee 4,700 4,600 900 : 8.1 7,300 Choctaw 9,000' 8,600 1,600 10.1 1.6,100 Cimarron 113,600 112,300 71,000 22.0 l, 565~100 Cleveland 19,800 19,400 6,600 10.3 67,900 Coal 13,800 13,600 4,700 10.2 48,000 Comanche 39,800 37,000 16,100 12.0 193,300 Cotton 19,200 18,200 : 4,500 11.4 51,400 Craig 13,600 : 13,300 7 ,800 13.5 105,100 Creek 19,800 : 19,600 6,700 12.4 83,100 ( Custer 36,700 : 35,700 : 16,700 14.9 233,200 Dela.ware 8,100 : 8,000 1,600 9.1 14,600 Dewey 56.200 55,600 24,300 14.0 341,300 Ellis 71,200 70,200 37,600 11.6 435,900 Garfield 13,700 : 13,400 1,700 14.7 25,000 Garvin 33,200 31,800 7,800 "11.4 89.200 Gre.dy 56,000 54,800 18,700 13.5 251,900 Grant 23,100 G2,900 3,800 18.8 71,400 Greer 55,300 53,700 20,!?00 12.7 264,500 Harmon 44,900 42,200 12,400 14.7 : 182,200 Harper 40,600 : 40,100 7,800 14.7 114,600 Haskell 6,300 6,200 900 8.0 7,200 Hughes 14,500 14,200 6,200 10.3 63,800 Jackson 57,700 53,700 15,700 11.6 182, 0 00 Jef f erson 29,100 28,000 4,100 9.9 40,500 Jolmston 9,400 9,300 1,800 9.6 17,300 Kay l 7,400 17,000 3,300 16.7 05,200 Kint fisher 13,200 13,100 1,900 l '1. 5 33,200 Kiowa 28 ,100 26,600 6,400 13. 5 86,200 Latin ,er 4,GOO •l, 700 900 8.6 7, 700 LeFlore 8,400 8,200 1,500 9.1 13,700 l , iI; coln 44.700 43,eoo 29,900 12.6 376,000 Lor.an 16,20 0 15, eoo 6,lCJO 13.G 83,200 Love 8 , '/U O 8,400 2,400 9,0 21,600 L ,4'ru ',"' \
.I .. l.!_0
TABLE NO. 21 87
OKLAHUnA SO!i.GHUM ~ CEl''I SYRUP Acreag e. Yield. Production - 1944 by Counties
OKLAHOMA PLANNING AND RESOURCES BOARD

DIVISION OF INDUSTRIAL AND STATE PLANNING-----------,
0 OKLAHGU SORGhllM--xi"CEPT
Acreage, Yield, Production - 1944 by Counties Jor IU 'Pu!:Eoaes Harvested for Grain County Planted : Harvested Aoreage :Yield Per: Acreage . Acreage (acres) : Acre : Production . (a.creel : (acres) : : t bu. L (bu.) lloClain 30,100 : 29,200 : 11,400 : J.3.1 : 148,000 McCurtain : · 3,300 3,100 900 : 9.4 8,500 llclntosh 11,600 11,500 4,500 : 11.4 : 51,400 llajor : 30,800 30,200 8,900 : 13.8 122,800 l4arshall : 6,100 6,000 l·, 700 9.8 16,700 ~ayes 16,100 : 15,900 8,500 13.6 115,200 liiurray : 6,700 6,500 1,600 10.2 16,300 Muskogee 13,700 13,500 3,900 8.6 : 33,500 Noble 10,600 10,500 3,100 13.9 43,000 Nowata : 13,500 13,000 5,100 : 11.4 58,300 Okfuskee 14,400 14,200 9,700 : 13.l 126,700 Oklahoma 9,700 9,600 5,700 12.2 69,800 Okmulgee : ll,900 11,400 : 7,200 12.6 90,500 Osage : 22,600 22,200 7,600 12.9 : 98,000 Ottawa 6,300 : 6,200 1,800 10.8 19,500 Pawnee : 12,100 11,700 6,200 12.2 75,900 Payne : 26,100 26,800 : 10,000 15.1 151,100 Pittsburg : 1~,400 : 12,300 5,300 10.8 57,200 Pontotoc : 11,900 : 11,400 5,500 10.6 58,400 0 Pottairatomie : 22,800 : 22,300 : 7,600 10.9 8:3,100 Puahma taha : 6,800 6,500 1,000 8.2 8,200 Roger Kills : 89,700 87,000 : 50,800 13.3 676,000 Rogers : 10,000 9,800 4,800 14.0 67,400 Seminole : 18,300 17,900 10,400 10.3 107,000 Sequoyah 4,300 4,200 600 7.0 4,200 Stephens 37,700 36,900 17,900 11.0 197,200 Texas 113,600 111,400 59,600 20.8 1,240,800 Tillman 31,100 29,900 10,200 13.9 141,600 Tulsa 9,800 9,600 2,300 1;:;.3 30,500 Wagoner 9,600 9,500 3,700 10.7 39,600 Washington 7,600 : 7,500 3,700 14. 7 54,400 Washita 79,900 77,500 45,300 15.6 706,400 Woods 45,400 44,500 10,800 16.1 173,700 Woodward 65,800 64,400 28,200 13.2 372,900
TABLE NO. 21 (oont 1 d) 88
SYWP
0 l OKLAHOMA
____________, ,1!_01
Source: U.S. Department of .Af, rioulture .
PLANNING AND RESOURCES BOARD
TABLE NO. 22OKI.AHrMA
80RGBlDl CilE FOR SIRUP1 .&.oreage, Yield, and Production, 1916-19.,.
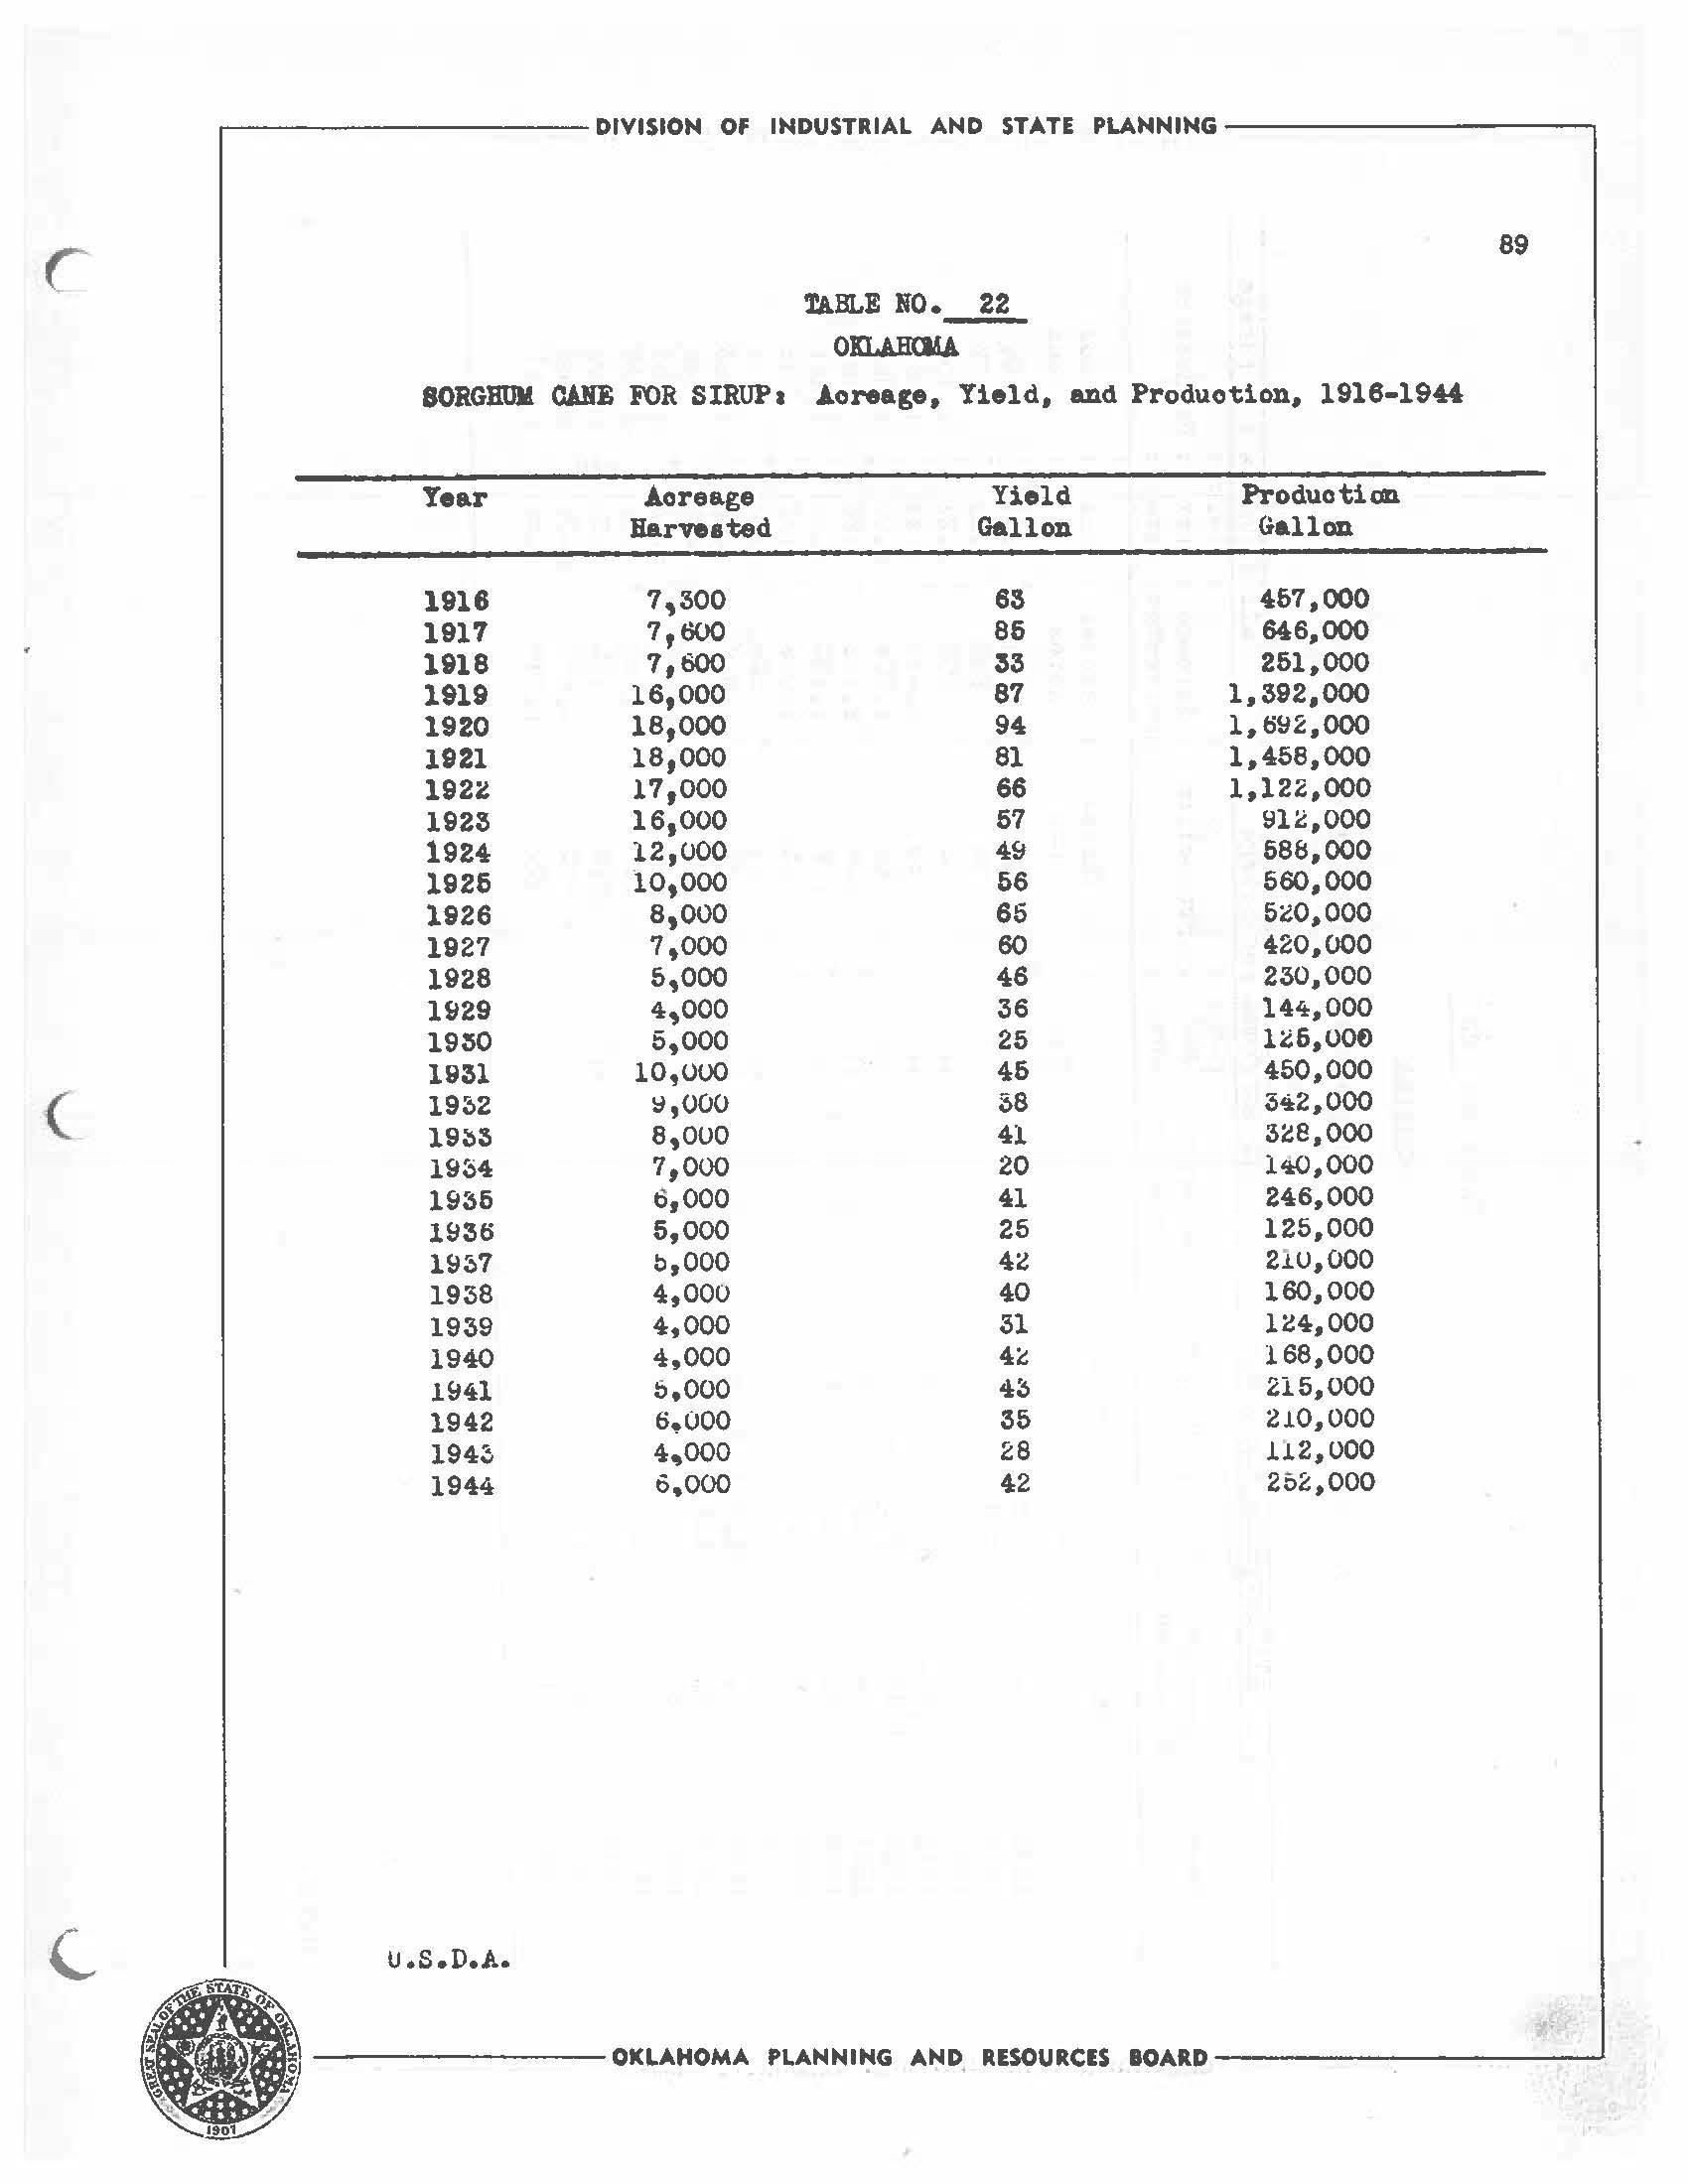
----------DIVISION OF INDUSTRIAL AND STATE PLANNING----------. 89
Year Aoreage Yield. Production Barveated Gallon Gallcm 1916 7,300 6S 467,000 1917 1,000 86 646.,000 1918 7,600 33 261,000 1919 16,000 87 1.,392,000 1920 18,000 94 1,692,000 1921 1s,ooo 81 1,458,000 1924' 11,000 66 1,12,,000 1923 16,000 57 91':,000 1924 12,000 49 688,000 1926 10,000 66 560,000 1926 e,ooo 65 5,0,000 1927 1.000 60 420,000 1928 s,ooo 46 230,000 1929 4,000 36 14.tt,000 19:SO 5,000 25 1i6,006 1931 10,000 46 450,000 ( 19~2 ~,ooo 38 31:t2.,000 19~:S e,ouo 41 3ie,ooo 19S4 1,000 20 140.,000 1936 6,000 41 246,000 1936 5,000 25 125,000 19~7 0,000 4i 210,000 1938 4,000 40 160.,000 1939 4,000 31 U!4,000 1940 4,000 4ie 168,000 1941 :;.ooo 4~ 215,000 1942 s.ooo 35 210,000 l94i 4.000 28 n2,ooo 1944 6.000 42 252,000 u.s.D.A. •--------OKLAHOMA
RESOURCES IOARD-----------1
PLAMNlt:(G AND,
NO. 23OKLAHCMA

___________:___ _ 0 Year z 0 > .. ,.. > 1929 :z z 1930 z 1931 " 1932 > 1933 z 0 1934 'Ill 1936 Ill 1936 C: 1937 ,., n 1938 "' "' 19391940 1941 ,., 0 1942 194~ 1944 u.s.D.A. 0
1~29 - 1944
Sor fiwns For Grain :
Sor hwna 1''or Sile. e l All Sor hums r·or li'ora e I eld I : Yie.La , I 1 Yield t : Acreage : Per : Production: Acreage : Per I Pro auction : Acreage : Per 1 Proa.uction :Harvested I Acre . :Harvested: Acre : :Harvested: Acre : . : : : . : . I : : Thous. : Thous. : Thous. ; ; Thous. : Thous. : Tone : 1'hous. : Acres : Bu. : Bu. : Acres : Tons Tons : Acres : : Tons . : 12.0 : : : ; : : 1.31 : 748 . 8.,941 9 4.9 44 767 994 : : : : : : 696 7.0 • 4,~b3 9 3.8 34 950 .92 877 : J. 028 : 11,275 : 899 : l. 2:5 : 1,108 11.0 12 4.6 b5 . , : : : 1,094 10.5 11,462 : 13 4.3 ti6 J. ,04t> . 1.24 1,292 : 1.,060 : 9.6 • 10.,032 20 ::,.~ 65 : 1,004 • 1.09 1,097 I 7.6 . 4.,788 : 38 : 2.7 : 104 : l.,2S2 : .80 I 985 640 : 923 9.0 : s.,2n : 30 : 4.2 : J.26 : l,160 : l .,2 : J.,421 : 350 I 6.0 : 2.,090 : 31 : 2.1 : 83 : l,00~ : • "/2 I 725 883 : 11.0 : 9.,678 : 2~ : 4.3 : 99 695 : 1.18 : 821 : 740 : 11.4 I 8.,46'9 : 28 4.9 : 137 : 828 : 1. ;$2 : 1.,093 : 645 8.7 I 5,600 33 : 112 949 : .89 : 849 3.4 . 900 : : 10,314 : 62 : 270 : 1,248 : l.2b : 1,5~2 . 11.6 4.4 : 667 : 12.0 : 7,982 : 61 : 5.1 : ioo : 1,191 : l.5~ : 1,8~8 : 8.::1 : 12.9 : 10,614 : 83 : 4.8 396 951 : 1.65 l,56~ : . 9.0: b,355 : l.O.:i ~.5 360 l,~97 l.08 : l,608 597 . . : 12,915 : 5.0 . 650 1 , 145 : 898 . J.4.4 : 110 l.bO l.,7J.7 : . 0 0 <O 0 0 < ;;; 0 z 0 "" % 0 C: "' --i 'Ill ;;: ,.. :z ic, "' --i > -4 "' "CJ z z :z G)
TABLE
ALL SORGHUMS t Acreage., Yield.., and 1-'roduotion.,
llI
All
.:JO SNOl771 V\I
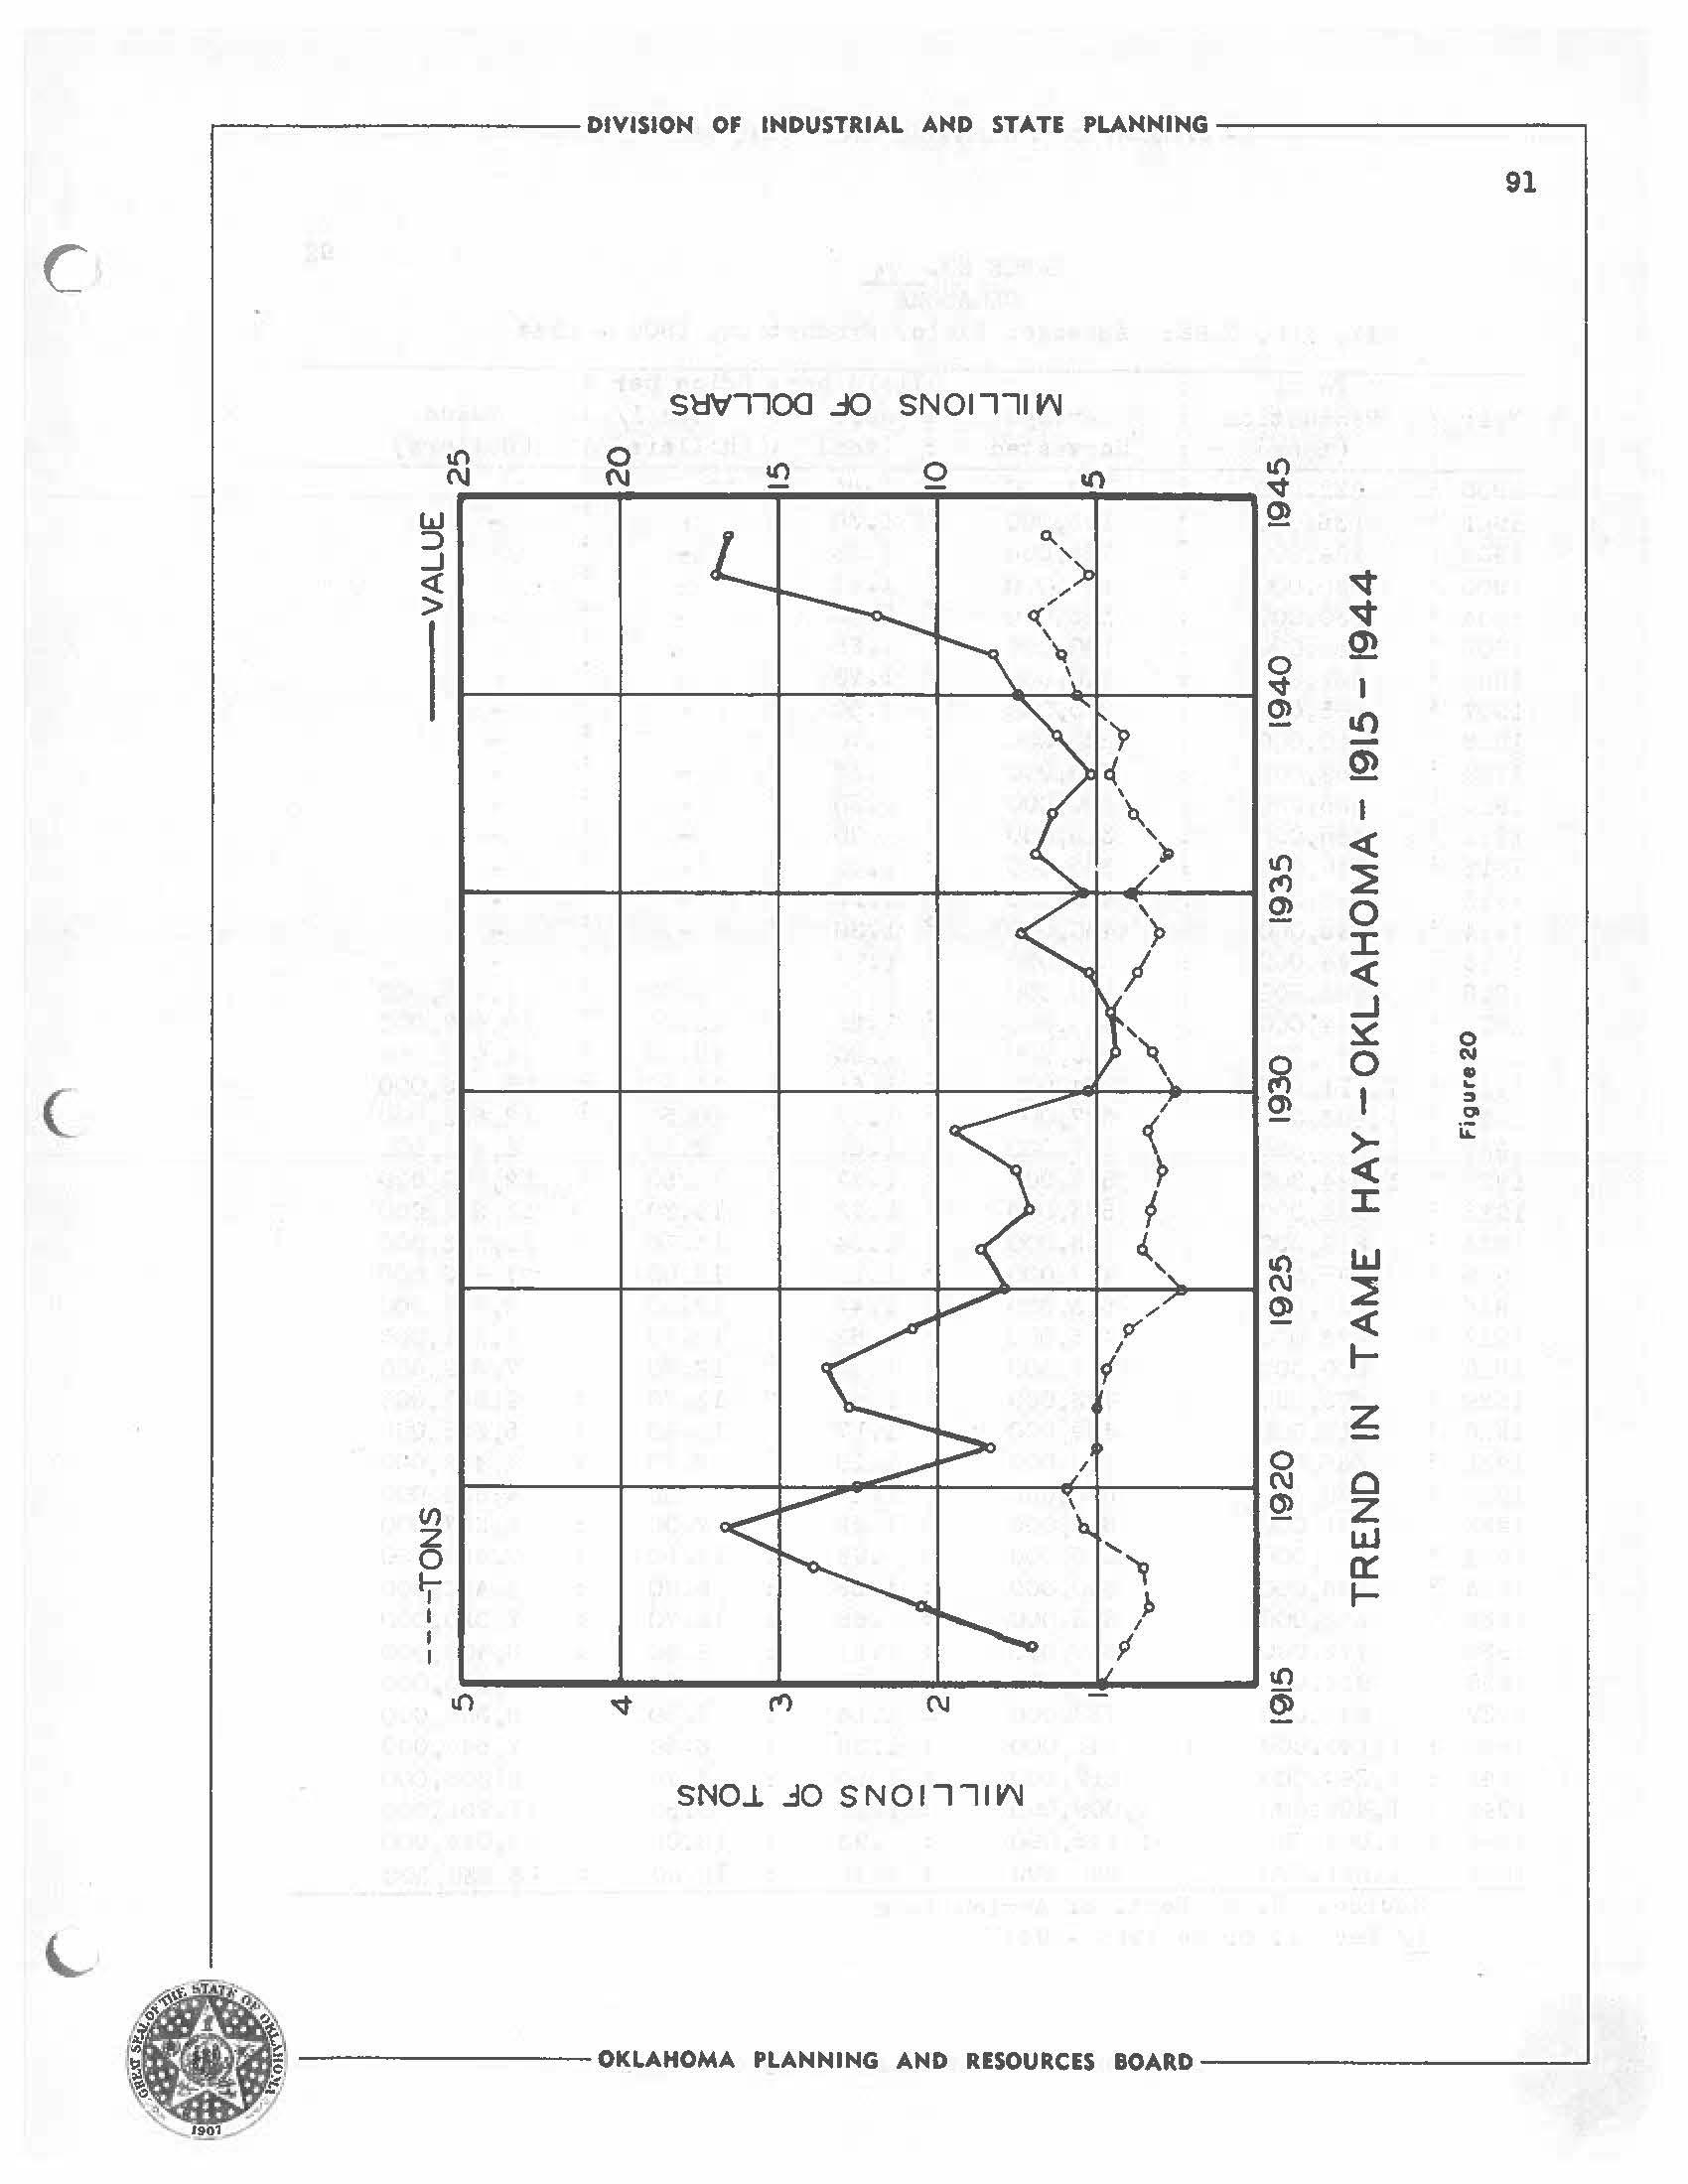
.----------- DIVISION OF INDUSTRIAL AND STATE PLANNING-----------, 91 C SW7700
lO 0 I{) 0 t{) C\I N IO w ::, _I <( > 0) 0 I 0, "° 0) I t{) <( (') 0, 0 I <( ...J 0 0 N Cl C I .. 0, :, / 01 \ ><( I c{., t{) w N / O> <( p' I J- 1 z I 0 N Q (I) z z .... uJ 0 er lr p ..... I I I 9 I I{) '° (\J 0)
L , -------- OKLAHOMA PLANNING AND RESOURCES BOARD-----------' ~ ftii.Ji?-. i ,~1.,....
SNOJ. ..:10 SNO 17 71 V\J

~----------DIVISION OF INDUSTRIAL AND STATE PLANNING-----------, TABLE NO • ....li., 92 0 OKLAHOMA HAY, .aLL, T.ili.E: Acreage, Yield, Production, 1900 - 1944 Total :Yield per: Prioe per a Year Production Acreage Acre : Ton½' a Value (tons) : Harvested (ton) : (do!lars (dollars) 1900 222,000 : 120,000 : 1.-85 a a 1901 : 136,000 105,000 : 1.30 I a 1902 : 194,000 : 125,000 : 1.55 I l 1903 : 2::!~,000 : 135,000 : 1.65 : 1904 330.,000 165,000 2.00 : : 1905 352,000 190,000 : 1.85 : : 1906 357,000 210.000 1.70 : : 1907 405,000 270,000 : 1.50 : : 1908 ; 510,000 300,000 : 1.70 : : 1909 : 459,000 335,000 : 1.37 a 1910 : 455,000 350,000 : 1.30 : :1911 335,000 335,000 : 1.00 : : : : : . 191, 548,000 : 365,000 1.50 . 1913 495,000 450,000 : 1.10 : : 1914 : 585,000 450,000 ; 1.30 : : 1915 994.,000 510,000 : 1.95 : : 1916 : 795,000 : 530,000 : 1.50 : 9.00 a 7,155,000 1917 694,000 555,000 1.25 : 15.40 : 10,699,000 1918 720,000 600,000 1.20 : 19.50 : 14,040,000 1,111,000 764,000 : 1.65 . 15.10 : 16,776,000 1919 . 1920 : 1,203,000 627,000 : 1.92 : 10.50 12,632,000 19::!l : 1,033,000 617,000 : 1.67 : 8.20 : 8,471,000 1922 : 1,024,000 579,000 : 1.77 : 12.50 : 12,800,000 1923 : 954,000 553,000 ·1. 73 : 14.30 : 13,642,000 1924 819,000 533,000 1.54 13.30 : 10,893,000 1925 : 496,000 417,000 1.19 16.00 7,936,000 1926 727,000 513,000 1.42 : 12.00 : 8,724,000 1927 673,000 415,000 1.62 : 10.70 7,201,000 1928 600,000 417,000 1.44 I 12.70 : 7,620,000 1929 698,000 483,000 1.45 : 13.70 ; 9,563,000 512,000 439,000 : 1.17 . 10.40 6,325,000 1930 : . 1931 : 666,000 554,000 : 1.20 : 6.70 ; 4,462,000 1932 : 939,000 670,000 1.40 : 5.00 . 4,695,000 : . 1933 751,000 ; 615,000 1.22 1.00 6,257,000 1934 : 611,000 ; 625,000 .98 12.20 7,464,000 1935 : 796,000 600,000 : 1.33 6.90 5,492,000 1936 552,000 645,000 .86 : 12.70 7,010,000 1937 772,000 659,000 : 1.11 : 8.30 6,408,000 1938 934,000 708,000 : 1.32 5.60 5,230,000 1939 841,000 737,000 : 1.14 : 7.50 6,308,000 1940 1,143,000 841,000 1.36 : 6.60 7,544,000 1941 : 1,240,000 812,000 : 1.53 : 6.70 8,308,000 1942 l.,406,000 1,009,000 ; 1.39 8.50 11,951.,000 1943 1,064,000 1,145,000 : .93 16.00 17,024,000 1944 : 1,331,000 94~,000 t 1-41 : 12 50 : 16,638,000
!./ Dec. l, price 1916 -1944 0
Source: u. s. Dept. of Agriculture
OKLAHOMA PLANNING AND RESOURCES BOARD
OKLAlil..Ai.AlULD HAY: Acreage, Yield and Production, 1912 - 1944

~---------- DIVISION OF INDUSTRIAL AND STATE PLANNING-----------, C
93
Total YieJ.d per Price : Year Production Acreage Acre : per ton '!/: Value (tons) Harvested : (ton) : (oollars) : (dollars) 1912 600,000 632,000 .95 1913 : 581,000 581,000 1.00 : 1914 : 414,000 552,000 .75 1915 688,000 598,000 1.15 1916 557,000 586,000 .95 9.10 5,069,000 1917 422,000 527,000 .&O : 15.20 : 6,414,000 1918 299,000 : 499,000 : .60 18.60 : 5,561,000 1Sl9 58b,OOO 532,000 : 1.10 15.20 8,892,000 1920 547,000 5,:!l.,000 : 1.05 : 12.00 : 6,564,000 19~1 582,000 485,000 1.20 5.90 3,434,000 : ; : 1&22 : 495,000 495.,000 : 1.00 7.50 3,712,000 1923 494,000 : 5~0.000 .95 11.00 5,4;'.;4,000 19i4 504,000 530,000 .95 9.70 4,889,000 1925 :-507,000 : 472,000 .65 11.70 3, b92,000 1926 484,000 510,000 .95 8.50 : 4,114,000 19G7 592,000 515,000 1.15 6.80 : 4,026,000 1928 526,000 : 438,000 1.20 : 6.80 3,577,000 ( 1929 492,000 482,000 1.02 : 7. 50 3,690,000 1930 405,000 506,000 • 80 7.80 3,159,000 1931 424,000 511,000 : • 83 s.oo 2,120,000 193~ 451,000 5;:il,000 .85 3.50 1,578,000 1933 327,000 467,000 .70 4.60 1,504,000 1934 246,000 425,000 • 58 10.60 2,608,000 1935 532,000 : 463,000 1.15 5.00 2,660,000 1936 191,000 : 347,000 .55 10. 70 2,044,000 1937 292,000 344,000 .85 6.60 1,927,000 1938 371,000 323,000 1.15 4.60 1., 707,000 1&39 336,000 : 354,000 .95 5.80 1,949,000 1940 408,000 389,000 1.05 5.20 2,U:2,000 1941 469,000 408,000 1.15 5.90 i::, 767,000 1942 584,000 449,000 1. :-,o 7.40 4,322,000 1943 593,000 516,000 1.15 15.20 9,014,000 1544 658,000 526,000 1.25 10.60 6,97b,OOO
TABLE NO. 25
!/ Lee. 1 Price 1916 - 1944
L ---------OKLAHOMA PLAHMIHG AHD RESOURCES BOARD-------------'
Source: u. S. Dept. of A_g: ricul ture
ALFALF:&. AND ALFALFA SE.ED
Alfalfa baa been grown in Oklahoma largely as a hay crop. 1hree to five cuttings a year are produced and aom.e alfalfa is grown in every county.
With the deTelopment or efficient dehydratinr, equipJDent, several new dehydrating plants have been built in Oklahoma.
The processing of alfalfa by dehydration elimin~tes losses due to weather conditions a.n<i gives increased pro1'its to the 1'arm.t1r due to the higher price of alfalfa meal.
In recent years the production of alf'a1f'a seed hta.s been increasing in importance. '.lhe 1~45 crop is estimated at 175,000 bushels, 3~% above the ten-year (1934-43) average. The 1943 crop of' 184,000 bushels is the greatest of record.
Oklahoma produced about 15~ of the nation's alfalfa seed ano ranked first in production in 1944.
Tables No._,!!_and 27 give yearly data on ~lfalfa hay and alfalfa seed.
.------------ DIVISION OF INDUSTRIAL A.ND STA.TE PLANNING - -----~------, 94
I . ---------OKLAHOMA PLANNING AND RESOURCES BOARD-----------1901 0 0 0
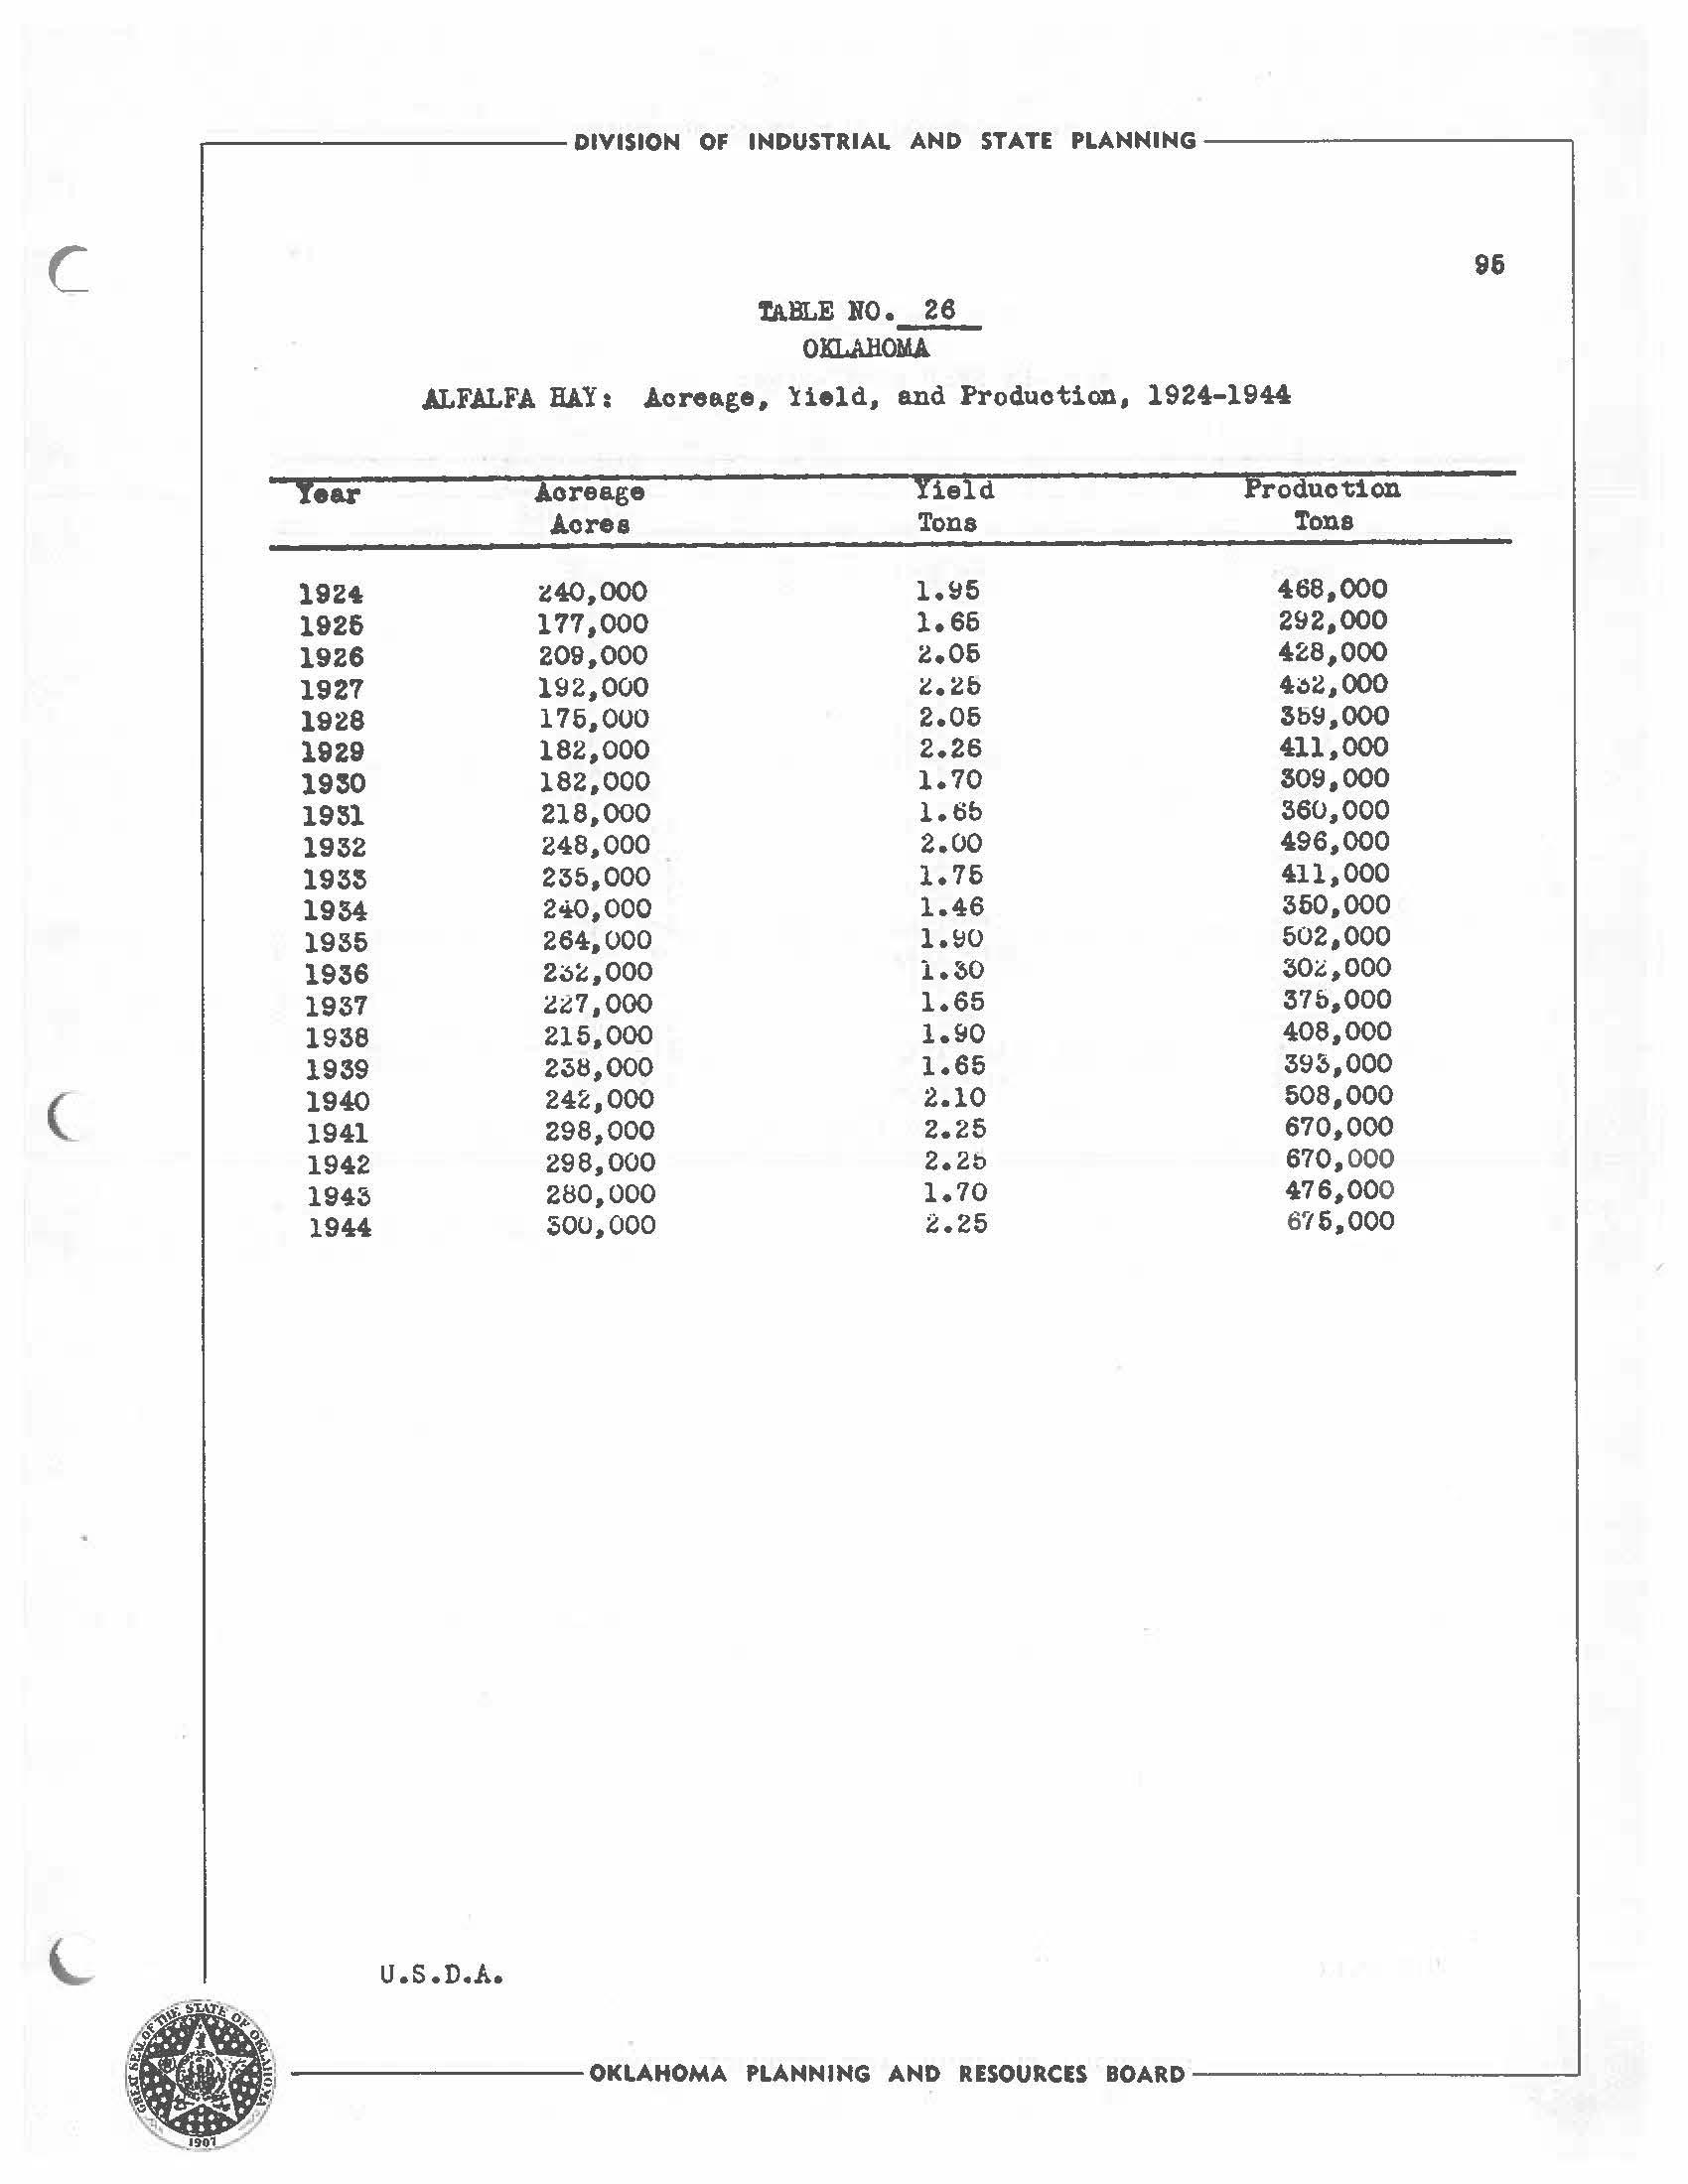
.---------- DIVISIOM OF IMDUSTRIAL AMD STATE PLAMMIMG ---------~ C 96
!ABLE llO. 26 OKLAliOli
Tear loreage Yieid Production Acree Tona Tone 1924 i40,000 l.95 468,000 1926 177,000 1.66 292,000 1926 209,000 2.06 428,000 1927 192,000 l.2b 4~2,000 1928 176,000 2.06 369,000 1929 182,000 2.26 411,000 19SO 182,000 1.10 309,000 1931 218,000 1.6b 360,000 1932 248,000 2.00 496,000 1935 235,000 1.76 411,000 1934 N0,000 1.46 360,000 1935 264,000 1 1:io 502,000 1936 2~~.000 1.30 30G,000 1937 l-27,000 1.65 37f>,OOO 1938 215,000 1.90 408,000 1939 2~8,000 1.65 393,000 ( 1940 242,000 2.10 508,000 1941 298,000 2.25 670,000 1942 298,000 2.2ti 670, 000 1943 280,000 1.70 476,000 1944 :500,000 2.25 6'l 6,000 L U.S.D.A • -,:- ~ [ ~) OKLAHOMA PLAMMIMG AMD RESOURCES BOARD __ .....1 l ' -9
ALFALFA BAY: Acreage, Held, and Production, 1924-1944
ALFALFA SEED 1~29 - lf;45
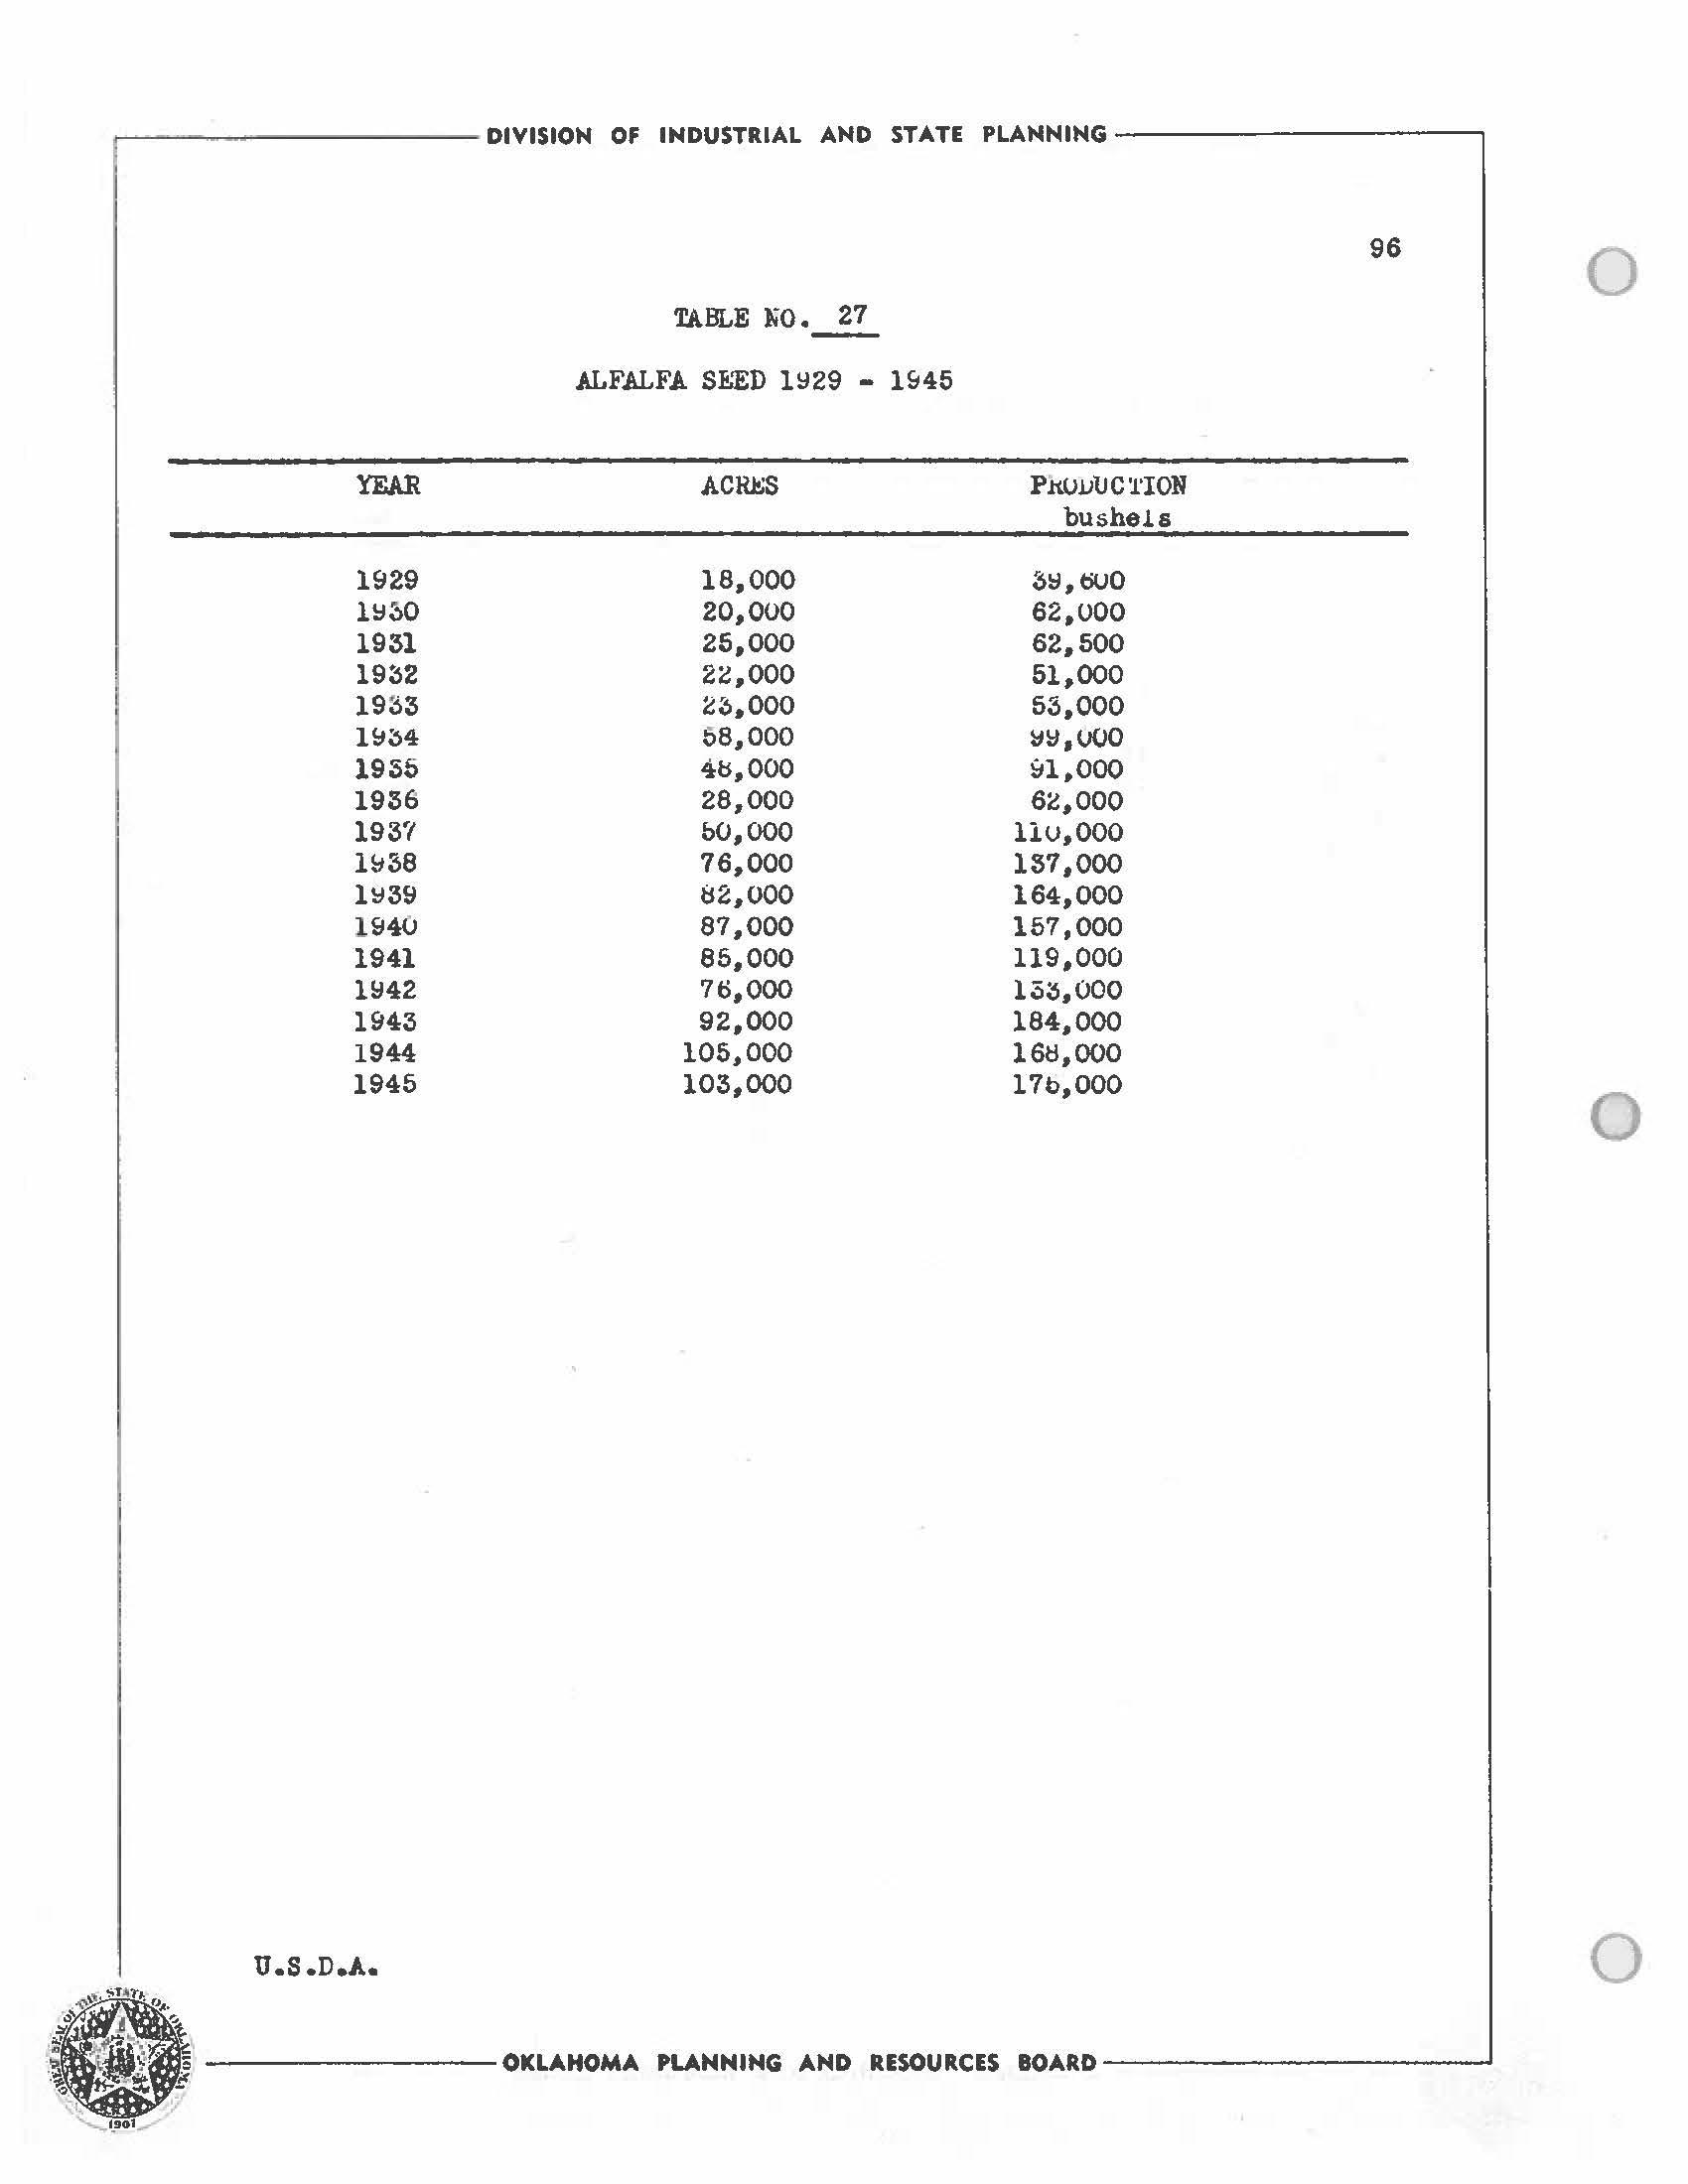
DIVISION OF INDUSTRIAL AND STATE PLAHHIHG -----------, 96 0
TABLE lO. 27
YEAR ACRJ!:S P .ttU.ulJ C '.!'ION bushels 1929 18,000 ~~.ouo 1~30 20,000 62,000 1931 25,000 62,500 19~2 2i,ooo 51,000 1933 23,000 53,000 U:134 58,000 ~~.voo 1955 4ts,000 ~1.000 1936 28,000 6l,OOO 193'/ b0,000 llu,000 1~38 76,000 137,000 1~39 82,000 164,000 1940 87,000 157,000 1941 85,000 119,000 l!:J42 76,000 1;;;~,000 1943 92,000 184,000 1944 105,000 161:1,000 1945 103,000 l7b,OOO 0 u.s.o.A. 0 --------OKLAHOMA PLANNING AND RESOURCES BOARD------------'
tiROOMCO.NN
Oklahoma usually ranks first in the nation in the production of broomoorn. Principal produoin~ areas are central. Oklahoma where Lindsay is the center of p~·oduotion tllld in the western part of the state. 'l'he 1:1tan.daru o,· tall varieties of broomoorn are grown in the Linasay area, while the dwarf varieties predominate in the western part of the state.
The annual broomcorn acreage fluctuates between wide limits. Production ranges i'rom 9,000 to :w.ooo tons annually. The 1944 production of' o::0,400 tons 111:,d a cash va.iue of over 4 million dollars.
Acreage, yield ana production aata by years for broomoorn from 1915 - 1944 is given in '.l'able No. 28 •
r ( .------------ DIVISION OF INDUSTRIAL AND STATE PLANNING------------,
97 OKLAHOMA PLANNING AND RESOURCES IOARD-----------..J

.-----------DIVISION OF INDUSTRIAL AND STATE PLANNING------------, 98 0
OKLAJIOM.l BROOMCORN: Acreage. Yield, aX¥i Production 1915-1944 Total : Yield per Pricel/: Year Production Acreage acre : per ton : Value (tons) Harvested (pounds) : (dollars): (dollars) 1915 52,800 240,000 440 1916 M,000 230,000 296 173.00 5,882,000 1917 39,000 260,000 300 255.00 9,945,000 1918 31,200 240,000 260 : 162.00 5,054.000 1919 35,800 233,000 307 149.00 5.334,000 1920 22,200 178,000 250 129.00 2,864,000 1921 24,100 146,000 330 64.00 1,542,000 1922 20,500 195,000 210 213.00 4,366,000 1923 32,800 273,000 240 110.00 5,576,000 1924 45,400 246,000 369 85.00 3,859,000 1926 12,600 120,000 210 136.00 1,714,000 1926 29,600 169,000 350 10.00 2,072,000 1927 19,600 106,000 370 98 00 1,921,000 1928 23,000 128,000 360 1u.oo 2,553,000 0 1929 17,900 125,000 287 120.00 ' 2,148,000 1930 18,000 164,000 220 : 10.00 1,260,.000 1931 20,900 144,000 290 48.00 1,003,000 1932 18,800 150,000 250 34.00 639,000 1933 : 11,tiOO 103,000 225 89.00 1,032,000 1934 9,400 135,000 140 139.00 1,307,000 1935 22,000 210,000 210 76.00 1,672,.000 1936 8,500 100,000 170 131.00 1,376,000 1937 15,000 100,000 300 10.00 1,260,000 1938 11,.800 76,000 310 71.QO : 888,.000 1939 8,200 61,000 268 105.00 924,000 1940 13,000 84,000 310 11.00 923,.000 1941 10,200 60,000 340 13s.oo 1,377 ,ooo 1942 11.,900 62.,000 385 180.00 2,142,000 1943 9,400 58.,000 325 291.00 2., 735.,000 1944 20.,400 109,000 376 235.00 4,794.,000 y Decemoer 1,. pr.oe 1910 - 15:12~ Seas onaJ. Avere.t,e pi ·1ce :i930 - 1944 Sources U. S. Department o f Agrioul:ture 0 • OKLAHOMA
TABLE NO.~
PLANNING' AND RESOURCES BOARD
In reoent years peanuts have beoome more important as a cash orop. In 1940 the total peanut acreage waa 106_.000 and in 1948 the total 119.8 617,000 aorea. Corresponding production figures for that portion picked and threshed f or nuts wer~ 54 million pounda in 1940 and 61 million pounds in 1943.
'lbe 1943 yield per acre of 250 pounds waa t'ar below the 1940 figures of 600 pounds.
1944 production for all purposes totaled over 139 million pounds with 116 million pounds picked and threshed for nuts. The aalea value or the 1944 peanut production at ,1.11 average price of 7.6 oenta per pound was ts,.ooa_.ooo.
Figure No. __2_1__showa the prinoipd producing counties 1n 1944
and Tkble No. 30 gives acreage, yield and production figures for 1944. Table Bo. 29 gives yearly data for peanuts.
( r----------- DIVISION OF INDUSTRIAL AND STATE PLANNING------------,
PBANUiB
99
ti c - - OKLAHOMA PLANNING AND RESOURCES BOARD-------------' " · J!
PWU!S: Aoreag•• Yield and Production, 1919 - 19'"

.-----------DIVISION OF INDUSTRIAL AND STJ.TE PLANNING-----------,
0
100
'fABLB NO. OICLABCllA
l Total l Picked l Yield a Year l l!:quiT. t and : Baneeted I Production I Solid I 1hreehed : Pounds : Pounde I .1creage l t Aorea l : I t l : 1919 : 11.000 : 8,.000 : 690 . 5,520,000 . 1920 : l0,000 : 7,000 : 760 : 6,.250,.000 1921 a 18,000 . . 11,000 : 6Z5 : 6,875,000 1922 I 1s.ooo I 11.000 : 525 : s. 7'/ti,000 1923 15.000 I 9,000 : 560 : 4,.950.000 1924 : 10,000 : 5,000 : 650 3.iso,.000 1925 s.ooo : s.ooo : 650 I 3.900,000 1926 : 12,.000 s.ooo : 800 a 6,400,000 1927 32,000 19,000 700 : 13,.300,000 1928 15,.000 37,000 : 650 : 24,.050,000 1929 : 102,000 50,000 : 500 25,.000,.000 19~0 : 41,000 : Z4,000 : 425 10,200,000 1931 : 56,.000 ;,2,000 : 425 l~,600,000 111~2 61,.000 29,000 : 550 : 15,.900,000 1933 46,000 ;.';3,000 625 20,625.000 0 1934 82,000 55,000 300 16,500,.000 1935 66,000 45,000 600 : ~1.000.000 1936 53,000 38,000 : 270 : 10,260,000 1937 36,000 25.000 : 475 : 11.875,000 1938 61,000 St!,000 5~0 20,.140,000 1939 n.ooo 6~,uoo 415 : 21,995,000 1940 106.000 : 90.000 : 600 54.000,000 1941 110,000 Btf,OUO 5~5 46.200.000 1942 330,000 : 266,000 5·10 : 151,050,000 1945 617,000 275,000 :c;Zb ol.875,.000 1944 273,.000 d8,000 ~10 u1,.1so.ouo
0 ---------OKLAHOMA
AND
BOARD------------'
u.s ..D.A.
PUNNING
RESOURCES

(" I. ..)<o,I , __ CIMARRON TEXAS IH:A -Vl:R HARPElf , r t pn7i 0 ,i: % 0 .. ,.. z z z G\ z - o "' Ill s C "' .,, cs, 0 "' 0 OKLAHOMA PLANNING 8 RESOURCES sc,u~ •STATUTI MILtS 0 10 IO $0 -to so PRINCIPAL PEANUT PRODUCING COUNTIES 1944 Legend Acres ~o oo- t0,ooo t····1 • • • • • • • • • 10,000~nd Over 'W~DWARO OiW£Y CUSTER •EC/CHAM WASHITA r--, IALFALM 19RANT KAY [GARFIELD 1HAJOR BLAINE~ I ' ,~ a: .~ CAIMOIAN Fioure 21. i f! 1i CRAIG)I ... 0 0£1.: ROGERS' I 1MAYES (") to-' 0 .... 2'. < 0 z 0 .,, z Cl C "' ,.. z: Cl s Ill -0 z z z a
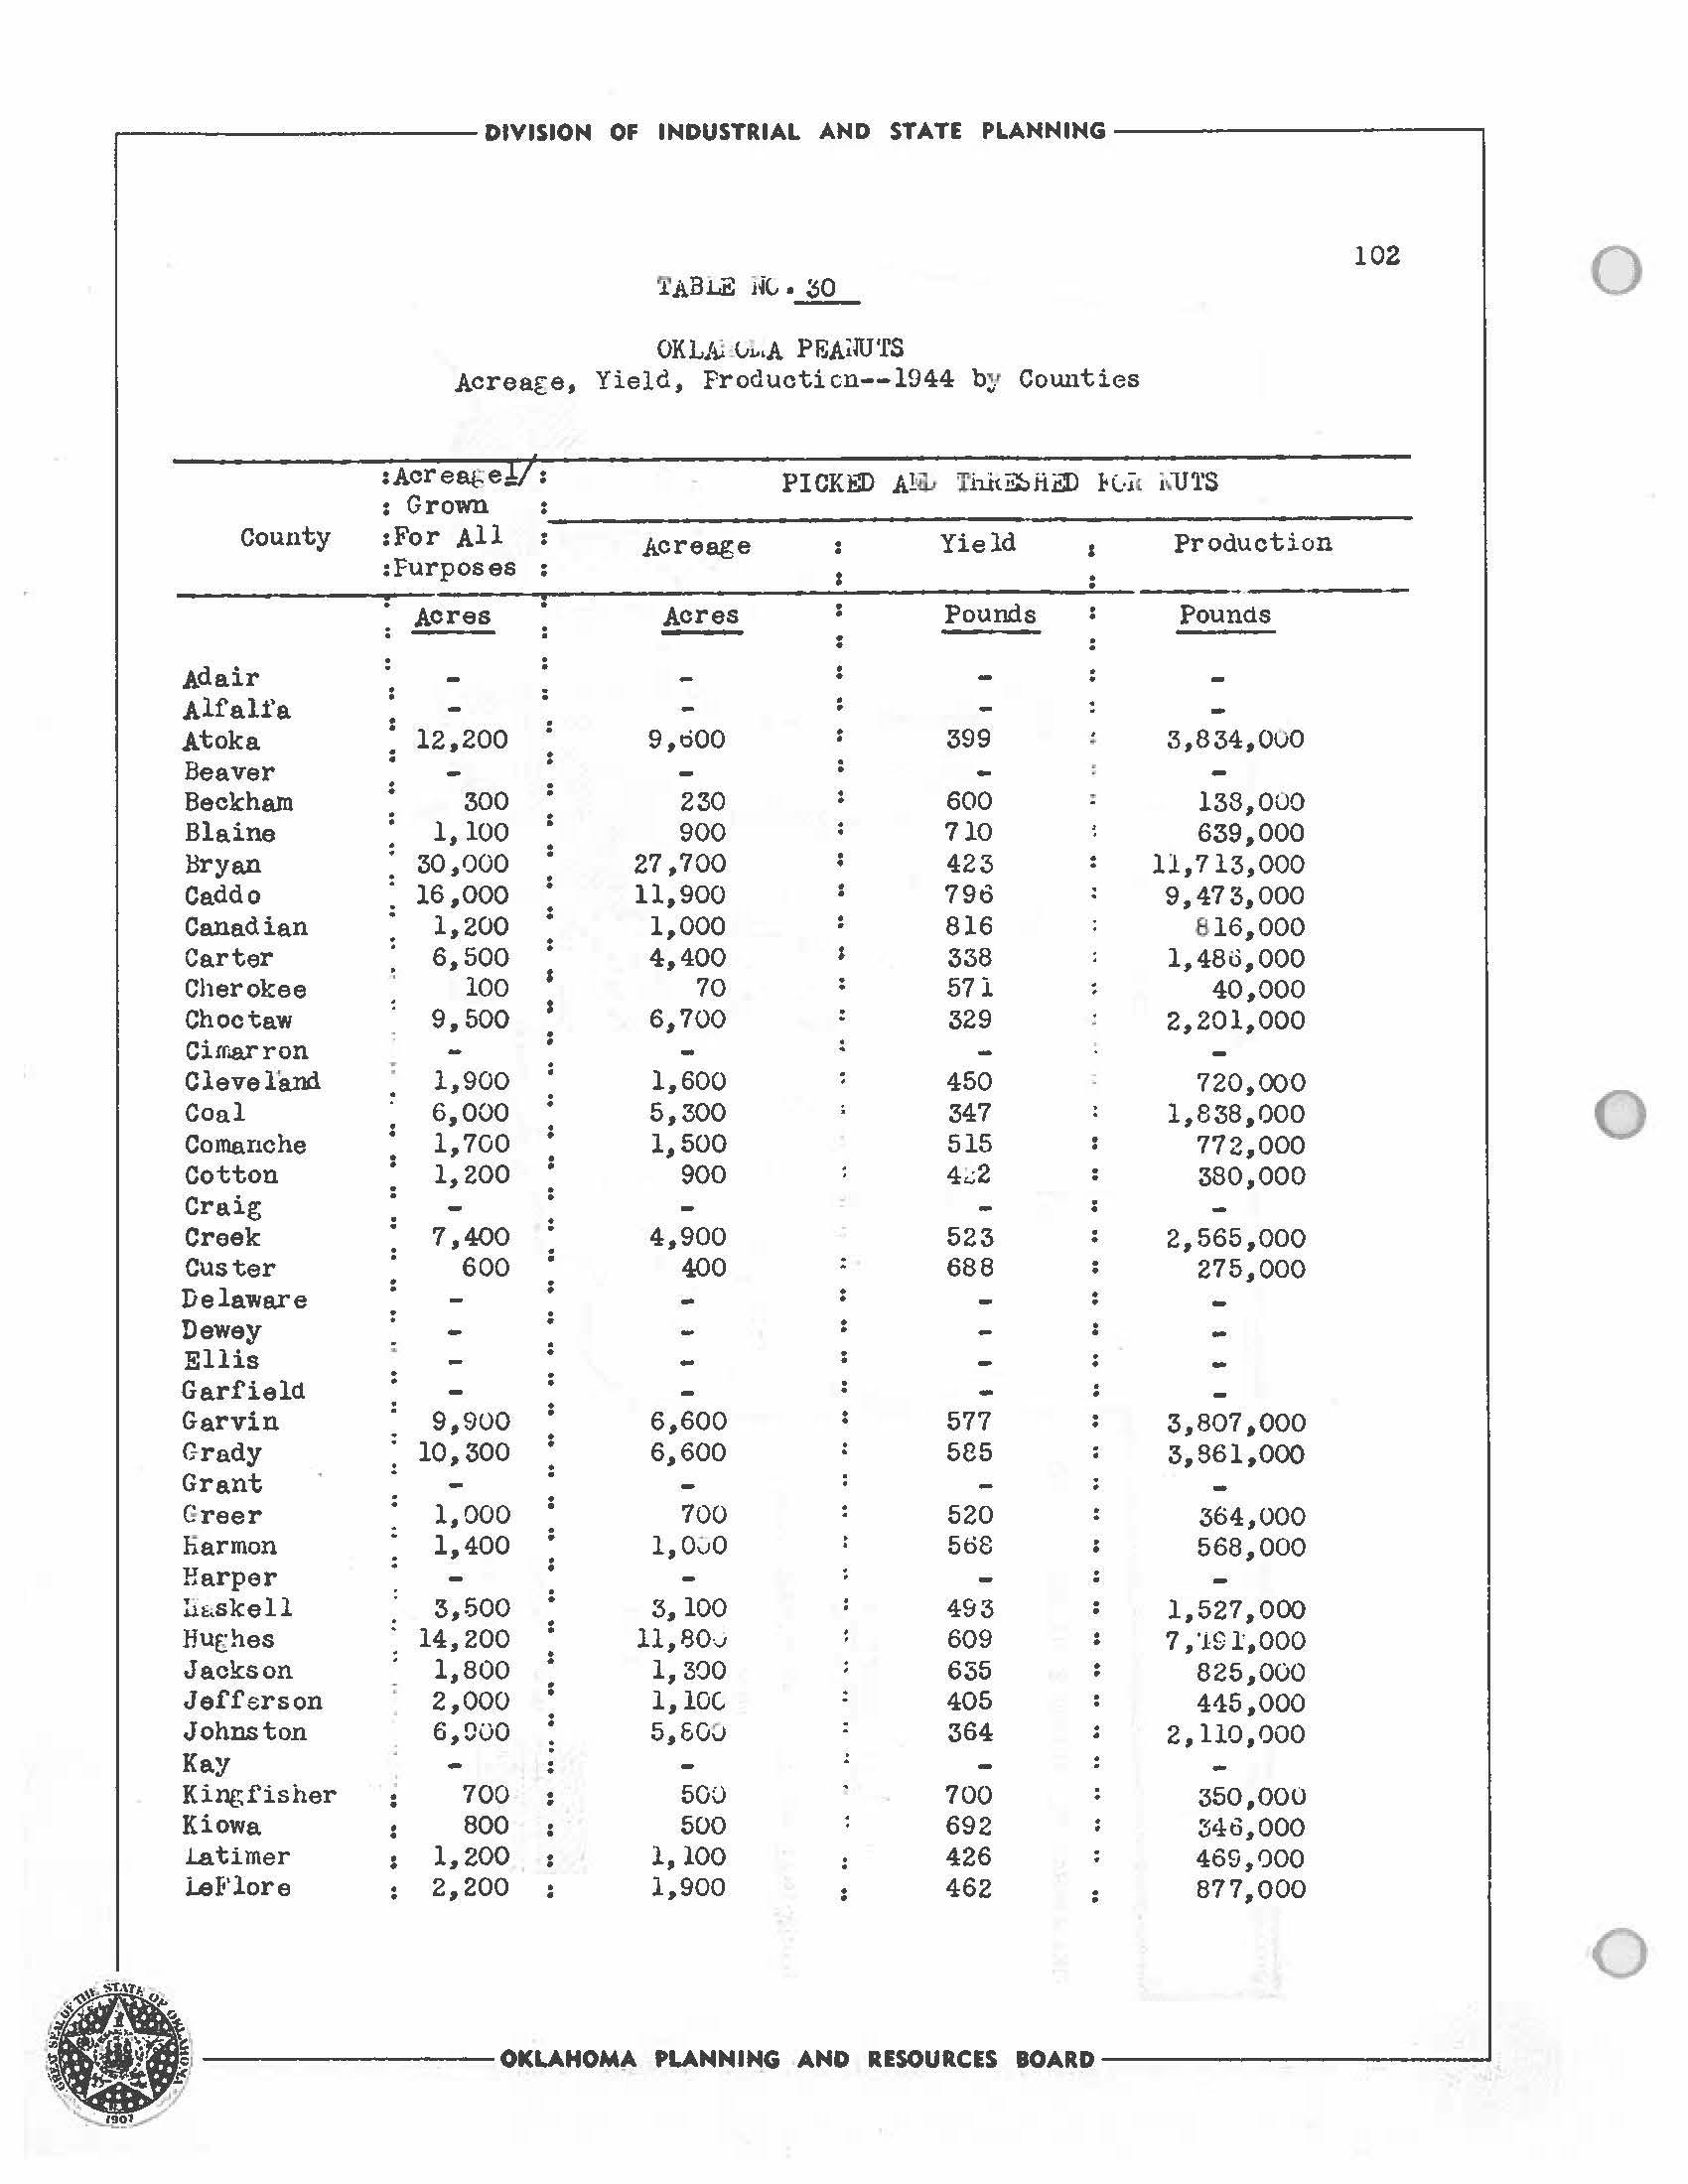
.------------DIVISION OF INDUSTRIAL AND STATE PLANNING-------------, i -r. ' County Adair Alfalfa Atoka Beaver Beckhalll Blaine Bryan Caddo Canadian Carter Cherokee Choctaw Cimarron Cleveland Coal Comanche Cotton Craig Creek Custer Delaware Dewey Ellis Garfield Garvin Grady Grant Greer liarmon Harper Ii&skell Hur;hes Jackson Jefferson Johnston Kay Kingfisher Kiowa l.atimer l.eF'lore I OKLALv,..,A PEA1lU'!S Acreag:e, Yield, Froducticn--1944 b !' Cowities :.Acr ea.fell: : Grown :For All :Furposes PICKED Al«<J Tiiit:ii::,i-iill H::i"c i~lJ'l'S 12,200 300 1,100 30,000 16 ,ooo 1,200 6,500 100 9,500 1,900 6,000 1,700 1,200 7,400 600 9,900 10,300 1,000 1,400 3,500 14,200 1,800 2,000 6,000 700 800 1.200 2,200 .Acreage !:!:.!.!!!. 9,tiOO 230 900 27,700 11,900 1,000 4,400 70 6,700 1,600 5,300 1,500 900 4,900 400 6,600 6,600 700 1,0;;0 3,100 11,800 1,300 1. 10(. 5,600 500 500 1,100 1,900 Yield Pounds 399 600 710 423 79'3 816 338 571 329 450 347 515 4~2 523 688 577 585 520 568 493 609 635 405 364 700 692 426 462 Production Pounds 3,834,000 138,000 639,000 11,713,000 9,473,000 8 16,000 1,486,000 40,000 2,201,000 720,000 1,838,000 772,000 380,000 2,565,000 275,000 3,807,000 3,861,000 364,000 568,000 1,527,000 7 ,'HH,000 825,000 415,000 2,110.000 350,000 346,000 469,000 877,000 102 ~l:D!i.Y 1 ---------OKLAHOM" PLANNING AND RESOURCES BOARD------------,9~ 0 0 0
OKW.OP:A PEANUTS Acreage, Yield, Protiuotion--194~ by Counties

];/ Total F.quivalent Solid Acreage (Alone plus oDe-half interplanted)
Source: u. s. Department of Agriculture
C DIVISION OF INDUSTRIAL AND STATE PLANNING-----------. 103
TABLE no. so (cont'd)
sAoreegel/ . . Picked ane1 Threshed 1'or nuts , Grown County sFor All Acreage Yield Production ,Purposes l Aores Pounis s PoundsLincoln 7,500 5,600 630 . 3,627,000 Logan 1,100 1,000 665 . 665,000 Love 4,100 3,500 426 1,491,000 McClain 5,100 4,500 617 2,775,000 McCurtain 4,900 3,800 426 1,619,000 McIntosh 5,400 5,200 688 3,576,000 Major 400 230 735 169,000 Marshall 1,600 1,500 435 652,000 Mayes Murray 2,300 1,800 ! 355 639,IJOO Muskogee 3,600 2,800 577 1,615,000 Noble Nowata Okfuskee 10,000 7,500 477 3,574,000 Oklahoma 1,500 1,300 541 703,000 Okmulgee 7,200 6,100 454 2,771,000 Osage 800 500 844 422,000 Ottawa Pawnee 800 600 798 479,000 Payne 1,800 1,500 754 1,131,000 Pittsblrg 11.,000 8,800 585 5,149,000 Pontotoc 5,000 4,300 399 1,717,000 Pottawatomie 9.,800 7,200 461 3,322,000 Pushmataha: 5,800 5,200 ! 333 l, 730,000 Roger Mills : 100 70 614 43,000 Rogers 600 300 647 194,000 Seminole 13,800 13,100 497 6,510,000 Sequoyah 1,300 1,200 532 639,000 Stephens 10.200 7,600 549 4,170,000 Texas Tillman 1,300 1,100 559 615,000 Tulsa 2,300 1,300 582 756,000 We.loner 800 500 628 314,000 Washington Washita 1,100 700 739 517 ,ooo Woods Woodward
---------OKLAHOMA PLANNING AND RESOURCES BOARD------------'
Oklahoma is a loadixlg state in the production of Pecans. Much effort is being mllde to improve and increase the pro<1uction. !lany native pecan and walnut treea are being budded or grafted ~ith paper ahell peoana. New orchards have been planted to paper shell varities and old orchards improved by removal ot other trees and underbrush.
The improvement in cracking machinery baa resulted in increased interest ot growers in improving native groves aue to better market•
for seedling nut,. Many new cracking plants h~ve been establishea in the star.e wb1oh tends to improve the market i'or seealing nuts. Potentially there are thousands of acrea tht1.t can be improved economically by thinning and cul tiv1,.ting or ptlsturing the aret1.s. This method oi'fera the beat possible profit to the Gklahoma pecan grower.
For many years Oklahoma has ranked 2nd in the pro<1uotion of pecans. ibe greatest year or record was 1941 when over 30 million pounds •re harvested. Production for lij44 is below normal.
1he 1~44 production to'tti.!ed 14 m111ion pounds or which improved varitiea accounted for 1,400,000 pounds and seedlings li,600,000 pounds. PrelimiluLry eatim~tea indickte th~t the 1945 orop will excee~ th~t or 1944 by 81 million pounds. In 1944 Oklahoma rank:ed 4th in the production 01' pecans.
Table No._3_1_...:gives yearly o.ata on peotlll prociuotion for 1919 -

~---------- DIVISION OF INDUSTRIAL AND STATE PLANNING-------------,
104
OKLAHOMA PLANNING AND RESOURCES
----------' 0 0 0
BOARD
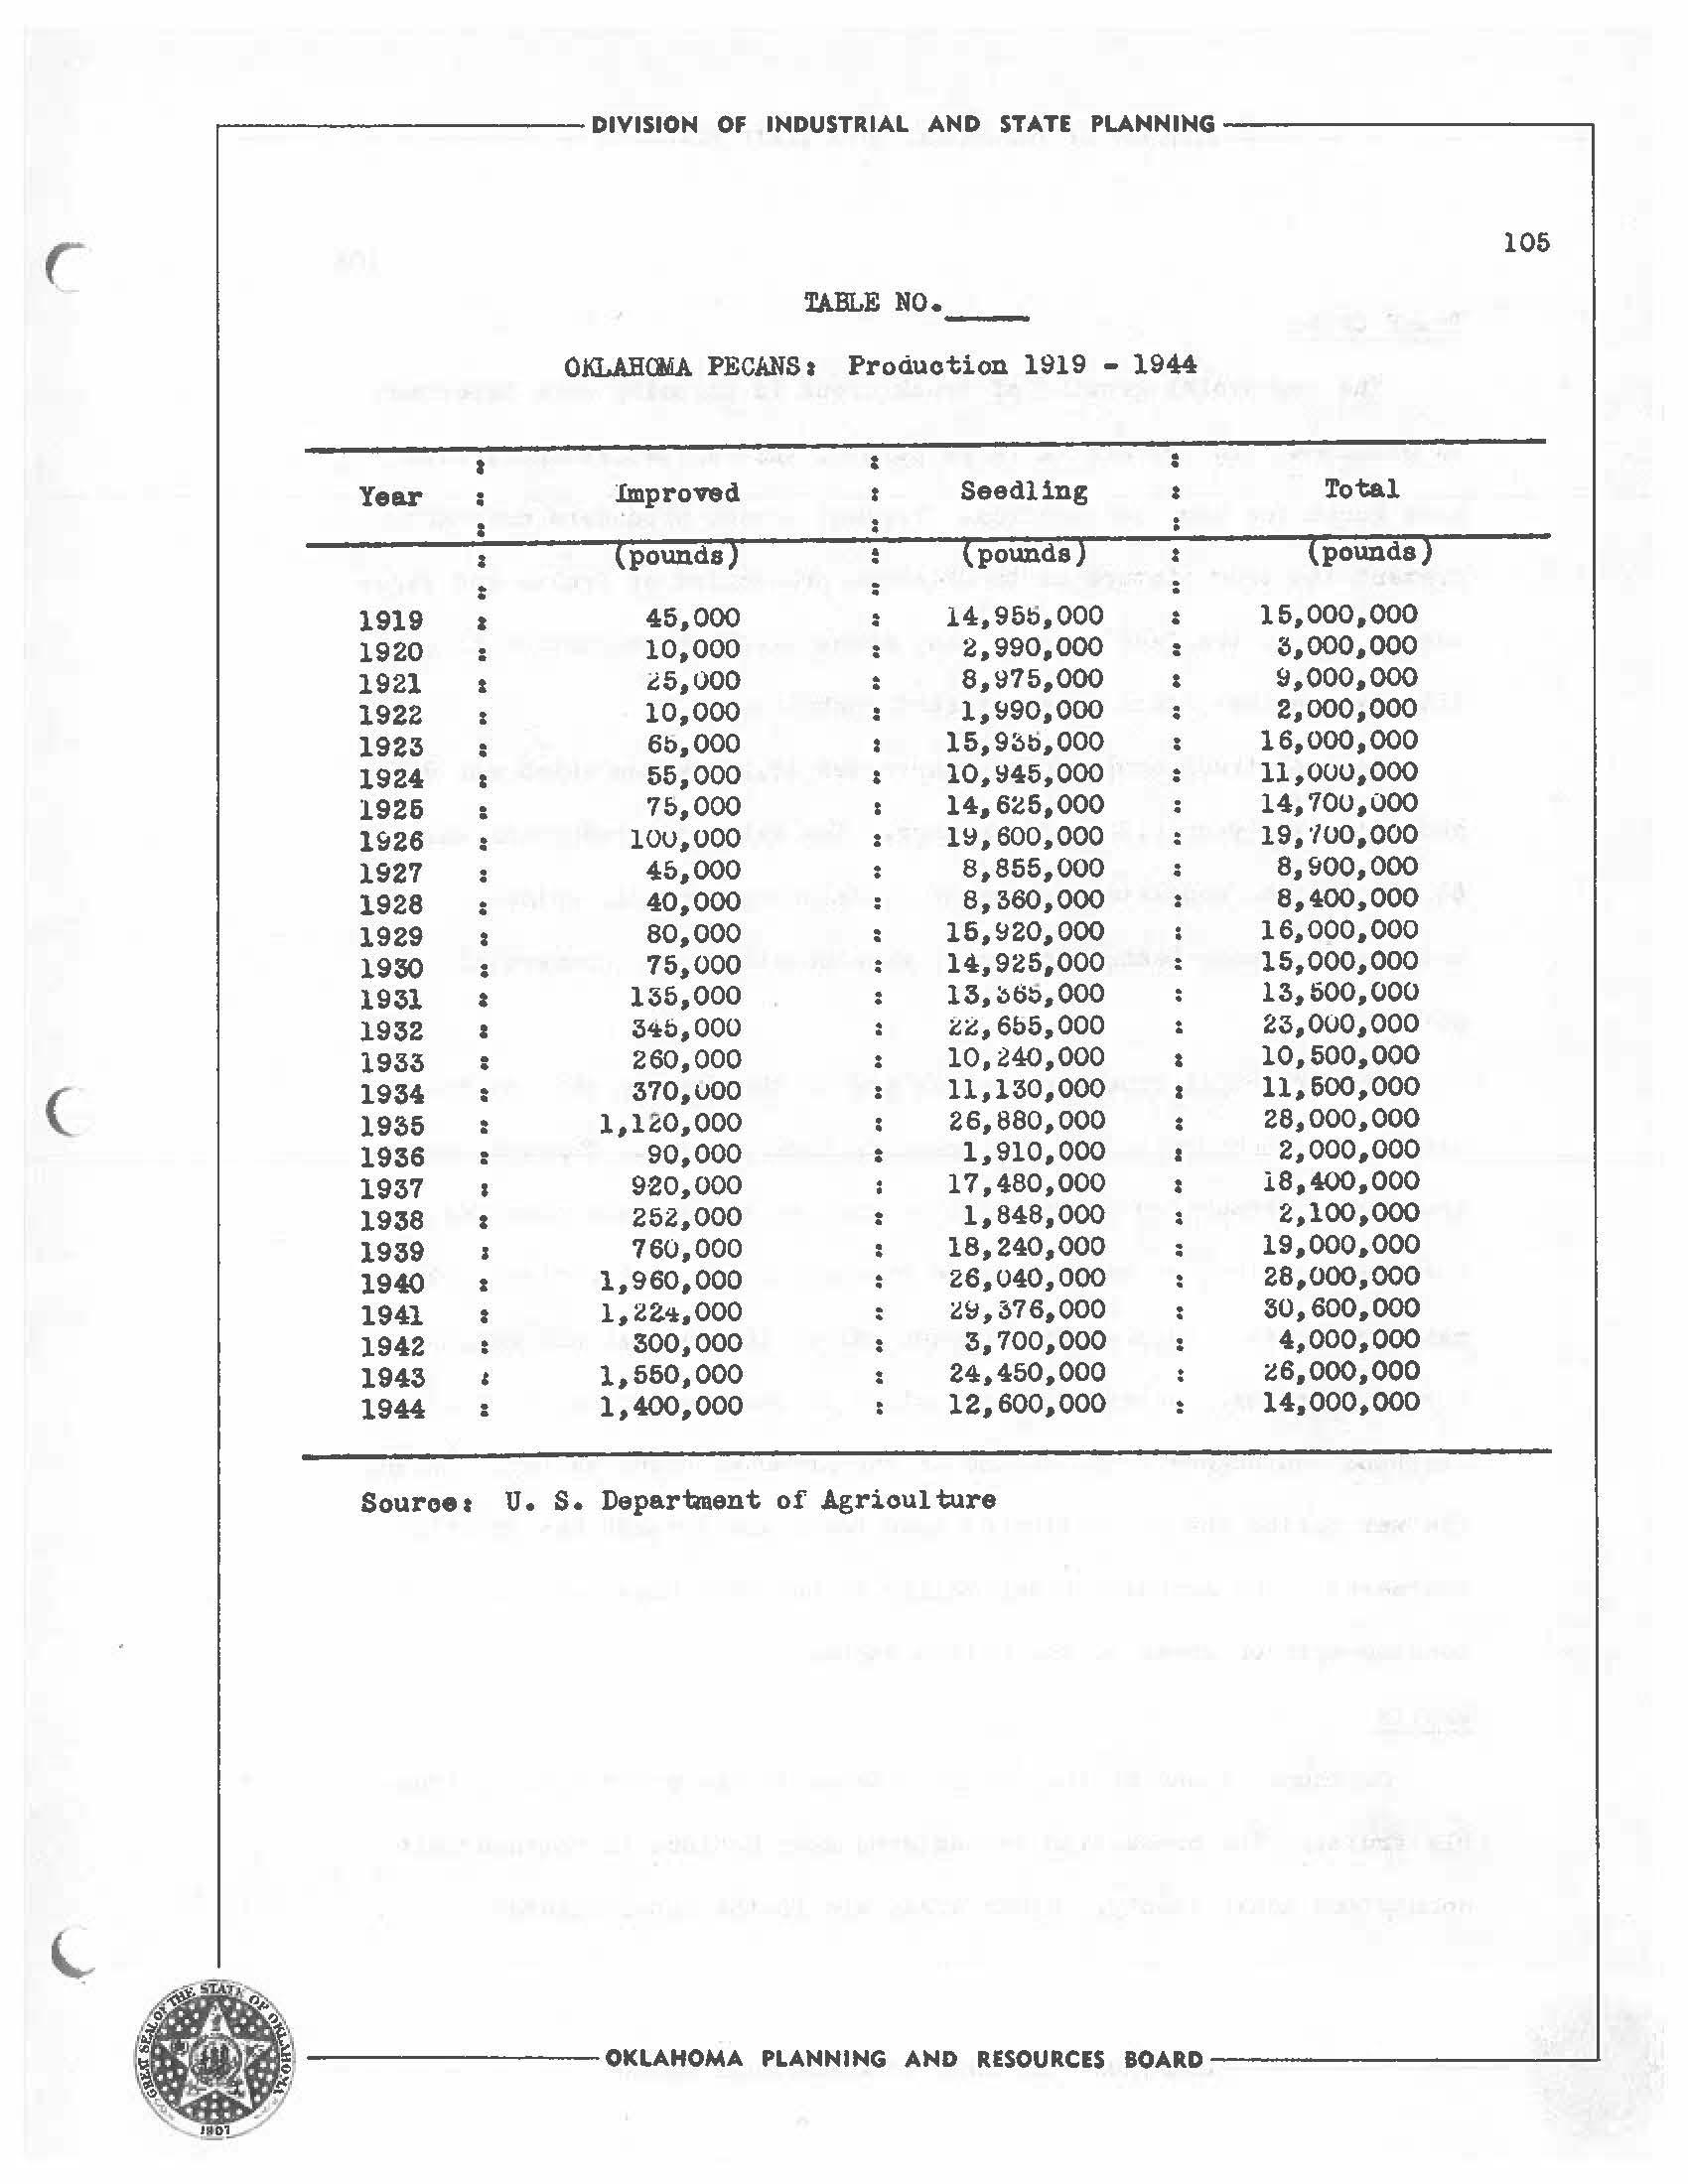
.-------------DIVISION OF INDUSTRIAL AND STATE PLANNING----------105
• :
Year Improved Seedling a Total : : : (pounds) (pounds) : (pounds) : : 1919 & 45,000 : 14,955,000 : 15,000,000 1920 : 10,000 : 2,990,000 : 3,000,000 1921 l ~5,000 . 8,ij75,000 : 9,000,000 . 1922 10,000 . l,~90,000 : 2,000,000 . 1923 : 6b,OOO 15,93ti,OOO 16,000,000 1924 55,000 : 10.,!::145,000 : 11,000,000 1926 : 75,000 14,625,000 14,70u,ooo lfl26 : 100.,000 1~,600.,000 19, ·100.000 1927 : 45,000 8,855,000 8,900,000 1928 . 40.,000 8,360,000 8,400,000 . 1929 80,000 15,~20,000 16,000,000 1930 : 75,000 : 14,925,000 15,000.,000 1931 & 135,000 13, ;,65,000 13,500,000 1932 a 34b,OOO 2.i:,6b5,000 23,000,000 1933 : 260,000 10,240,000 t 10,500,000 C 1934 : 370,uOO 11,130_.000 11,600_.000 1935 : 1.,120.000 26,880.,000 28,000,000 1936 : 90,000 . 1,910,000 2,000,000 . 1937 9 20,000 17,480,000 18,400,000 1938 & 252,000 : 1,848,000 2,100,000 1939 760,000 18,240,000 19,000,000 1940 : 1,960,000 26,040,000 za.000,000 1941 l 1,22.... 000 : 2~,376,000 : 30,600,,000 1942 300,000 3,,700.,000 4,000,000 1943 1,560,000 24,450.,000 is.000,000 1944 : 1,400,,000 12.soo.000 14,000,000
TABLE NO.Oi<LAH<:MA PECANSa Production 1919 - 1944
:
) - OKLAHOMA PLANNING AND RESOURCES BOARD ___________ J !!!!'!...--'
Souroet U. $. Depar-baent of Agriculture
!not Crop•
!be ocaneroial growing of truok orope 1a beoca1Dg aoN iaportu.t in Oklahoma. In the past a ltLrge part of the Vegetables and fn.1 te were grown tot home oonaumption. oenaue prooedure does not preea.t the true pioture as to Oklahoma produotion of fruit• and vegetables due to the taot that in many oaaea Olclabma produotion ia ore• dited to another state under present teohniques.
In 1944 truok crop growers harvested 48.200 acres whioh was 86% above the ten year (19~3-42) average. The value or production waa $4,788,000 and consisted mainly of oantaloupes, onions, sp1naoh, we.tennelona, map beans, tomatoes, aweetpotatoes, 11.lld oommercial potatoea.
1be prinoipal truok crop areas are in the eastern p~rt of the atate, and concentrated in the Arkei.nsas River Valley. Tomatoes and snap beana production is apreb.d over most 01· the eastern counties. Locali£ed centers of sweet pottt.toe production are Rush Springs, Okemah etnd Thomas. Onions are produced mainly in .McIntosh 1:tnd neighboring counties, ~atermelon production is centered in Major, Graay. Stephens e.nd Hughes counties tt.na in "the Arkansas River Valley. During the war perioci the production 01' 1,nap beans ano. spinach has greatly increased, The Arkansas Hi ver Valley is now recognized 1:1.s one 01' the leading spinach areas 0£ the United States.
Fruits
Oklahoma is one oi' the leaning states in the production 01· bramble fruits. The production is centered near McCloua in Pottawatomie oounty ano. Adair oounty. Other areas 1:1.re in the sub-irrigated

.-----------DIVISION OF INDUSTRIAL AND STATE PLANNING - ------------. 106
OKLAHOMA
RESOURCES
--- ----------' 0 0 0
PLANNING AND
BOARD
areas 1n Kajor and Dewey oountiea.
Peaches have been plenttid over most oi" the state with oe;nters of production Ul 1ulsa, Cherokee and McCurtain counties. McCurtain and adjoining counties 01·ter ,;he best ooDUT,eroial poseibili ties due to freedom of frost damage.
Apple production is scattered over ,;he e~btern part of the state, mainly 1n Delaware, ~nct Cherokee counties.
In recent years the plantin~ oi' early maturing apples have oeoome of grets.tt.:t importance.
Strawberry acreage declined our:i.n~ ;;he arought ye~rs 1.1.lld has never fully recovered. The easte : rt part oi' "the state i1> well aa.aptea "(;O -c;his crop.
Yearly da"i.a for potatoes, sweetpotatoes and fruit are given in Tables No.~ and ~•
C C ,------------ DIVISION OF INDUSTRIAL AND STATE PLANNING-------------. 107
OKLAHOMA PLANMIMG AND RESOURCES BOARD -------------J

.-----------DIVISION OF INDUSTRIAL AND STATE PLANNING-----------. TA.BLE NO. 32 108 0 OKLAHO:t,,APOTA'IOBS: Acreage, Yield, and Production 1900 - 1944 : Total Yield: ?rioe per: Year : Production : Acreage : per: Bushel ¼ Value : (bu.) : Harvested :Acre-bu.: (dollars : (dollars) U,00 : 1,312,000 16,000 : 82 : 1901 : 864,000 18,000 : 48 : 1902 : 1,840,000 20,000 : 92 ; 1903 : 1,615,000 : 19,000 : 85 : 1904 : 1,700,000 : 20,000 85 1905 : 1,892,000 22,000 86 : 1906 . 2,136,000 24,000 89 : : . 1907 : 1,988,000 28,000 7l : -: 1908 : 2,220,000 : 30,000 74 1909 : 1,888,000 32,000 : 59 1910 : 2,100,000 : ~o.ooo : 70 1911 812,000 28,000 : 29 19U: . 1,863,000 27,000 : 69 . 1913 1,792,000 28,000 64 : 1914 . 2,025,000 27,000 : 75 : . 1915 2,464,000 28,000 : 88 : 1916 1,890,000 : 27,000 : 70 1.95 3,686,000 1917 : 1,612,000 : 26,000 62 1.so 2,902,000 1918 : 1,296,000 : 27,000 ; 48 1.95 : 2,527,000 1919 : 1,960,000 26.,000 : 75 2.05 3,998.,000 0 1920 : 1,846,000 26,000 71 1.80 3,323,000 1921 1,484,000 28,000 :: 53 1.85 : 2,745,000 1922 : 2,294,000 31,000 : 74 1.23 2,822,000 1923 2,176,000 32,000 : 68 . . 1.28 : 2. 785,000 . 1924 2,240,000 32,000 : 70 : 1.30 2,912,000 1925 : 2,695,000 36,000 : 77 2.25 6,064,000 1926 2,774,000 38,000 73 1.70 4,716,000 1927 2,920,000 40,000 73 1.so 6,256,000 1928 3,744,000 52,00p : 72 .75 : 2,808,000 1929 2,925,000 39,000 75 1.20 3,510,000 1930 : 3,344,000 38,000 88 : 1.03 3,444,000 1931 : 3,010,000 43,000 70 .59 1,776,000 1932 3,200,000 40,000 80 .53 1,696,000 1933 2,170,000 35,000 62 .95 2,062.000 1934 2,301,000 : 39,000 : 59 .63 1,450,000 1935 : 2,730,000 : 39,000 70 .60 1. 638,000 1936 1,705,000 : 31,000 55 1.01 l,824,000 1937 ; 2,560,000 32,000 : 80 .67 1,715,000 1938 2,240,000 28,000 80 .67 1,501,000 1939 1,944,000 27,000 : 72 .68 1,322,000 1940 : 2,310,000 30,000 77 .61 1,409,000 1941 . 1,982,000 30,500 65 • 71 1,407,000 . 1942 2,244,000 33,000 68 1.10 2,468,000 1943 : 2,501,000 41,000 61 1.34 : 3,351,000 1944 . 2,015,000 31,000 65 : 1.36 : 2,720,000 . Souroo: U. s. Dept. 0f Agriculture '!/ Dec. 1, price 1916 - 1929 Seasonal Average price 1930 - 1944 0 •
OKLAHOMA PLANNING AND RESOURCES BOARD

DIVISION OF INDUSTRIAL AND STATE PLANNING C
33 109 vKLAHOMA-POTATOES, SWtiET: Acreage, Yield and Production 1900 - 1944 Total : : Yield: Pr'ice per : Year : Production Acreage : per aore: Bushel 1 : Value bu. . . Harvested bu. dollars : dollars 1900 380,000 : 4,000 95 : 1901 : 228,000 : 4,000 57 : 1902 : 380,000 : 4,000 95 1903 : 392,000 t 4,000 : 98 1904 : 650,000 : 5,000 : 110 1905 : 436,000 4,000 109 : 1906 756,000 6,000 126 . . 1907 570,000 6,000 95 : 1908 708,000 6,000 118 : 1909 355,000 : 5,000 7l 1910 : 475,000 5,000 95 1911 356,000 : 4,000 89 1912 : 412,000 : 4,000 103 : 1913 462,000 : 6,000 77 1914 763,000 7,000 109 1915 1,270,000 : 10,000 127 1916 1,157,000 13,000 89 1.35 1,562,000 1917 1,417,000 13,000 : 109 1.60 2,267,000 1918 : 1,020,000 15,000 68 2.20 2,244,000 1919 1,870,000 : 17,000 110 1.80 3,366,000 C 1920 ! 1,610,000 14,000 115 1.32 2,215,000 1921 1,372,000 14,000 ; 98 1.06 1,454,000 1922 1,216,000 16,000 76 1.18 1,435,000 1923 : 1,620,000 : 18,000 90 1.13 1,831,000 1924 1,275,000 15,000 85 1.50 1,912,000 1925 1,344,000 14,000 96 1.35 1,814,000 1926 1,836,000 : 17,000 108 1.00 1,836,000 1927 : 1,908,000 18,000 106 .so 1,526,000 1928 : 1,602,000 18,000 89 .95 1,522,000 1929 . 1,344,000 16,000 84 1.15 1,546,000 . 1930 : 1,105,000 17,000 65 1.04 1,149,000 1931 1,235,000 19,000 65 • 70 864,000 1932 1,680,000 24,000 70 .47 790,000 1933 : 1,444,000 19,000 76 .63 910,000 1954 : 810,000 18,000 45 .97 786,000 1935 : 1,260,000 : 18,000 70 .77 970,000 1936 350,000 10,000 ~5 1.43 500,000 1937 : 780,000 10,000 78 1.03 803,000 1938 : 880,000 11,000 80 .91 801,000 1939 480,000 10,000 48 1.04 499,000 1940 880,000 10,000 88 .90 792,000 1941 : 1,080,000 12,000 90 .97 1,048,000 1942 : 800,000 : 10,000 : 80 1.34 1.,072,000 1943 600,000 12,000 50 2. 65 • 1,590,000 1944 : 1,040,000 . 13,000 : 80 2.20 2,288,000 . Source 1 U. S. Deparbnent of Agrioul ture '!/ December 1, price 1916 - 1929 L Seasonal Average price 1930 - 1944 \ OKLAHOMA PLANNING AND RESOURCES BOARD s/ 1
TABLE NO.
DBLE 110. OICLAHQIA
FRUU't ~roduction - 1916 - 19'4
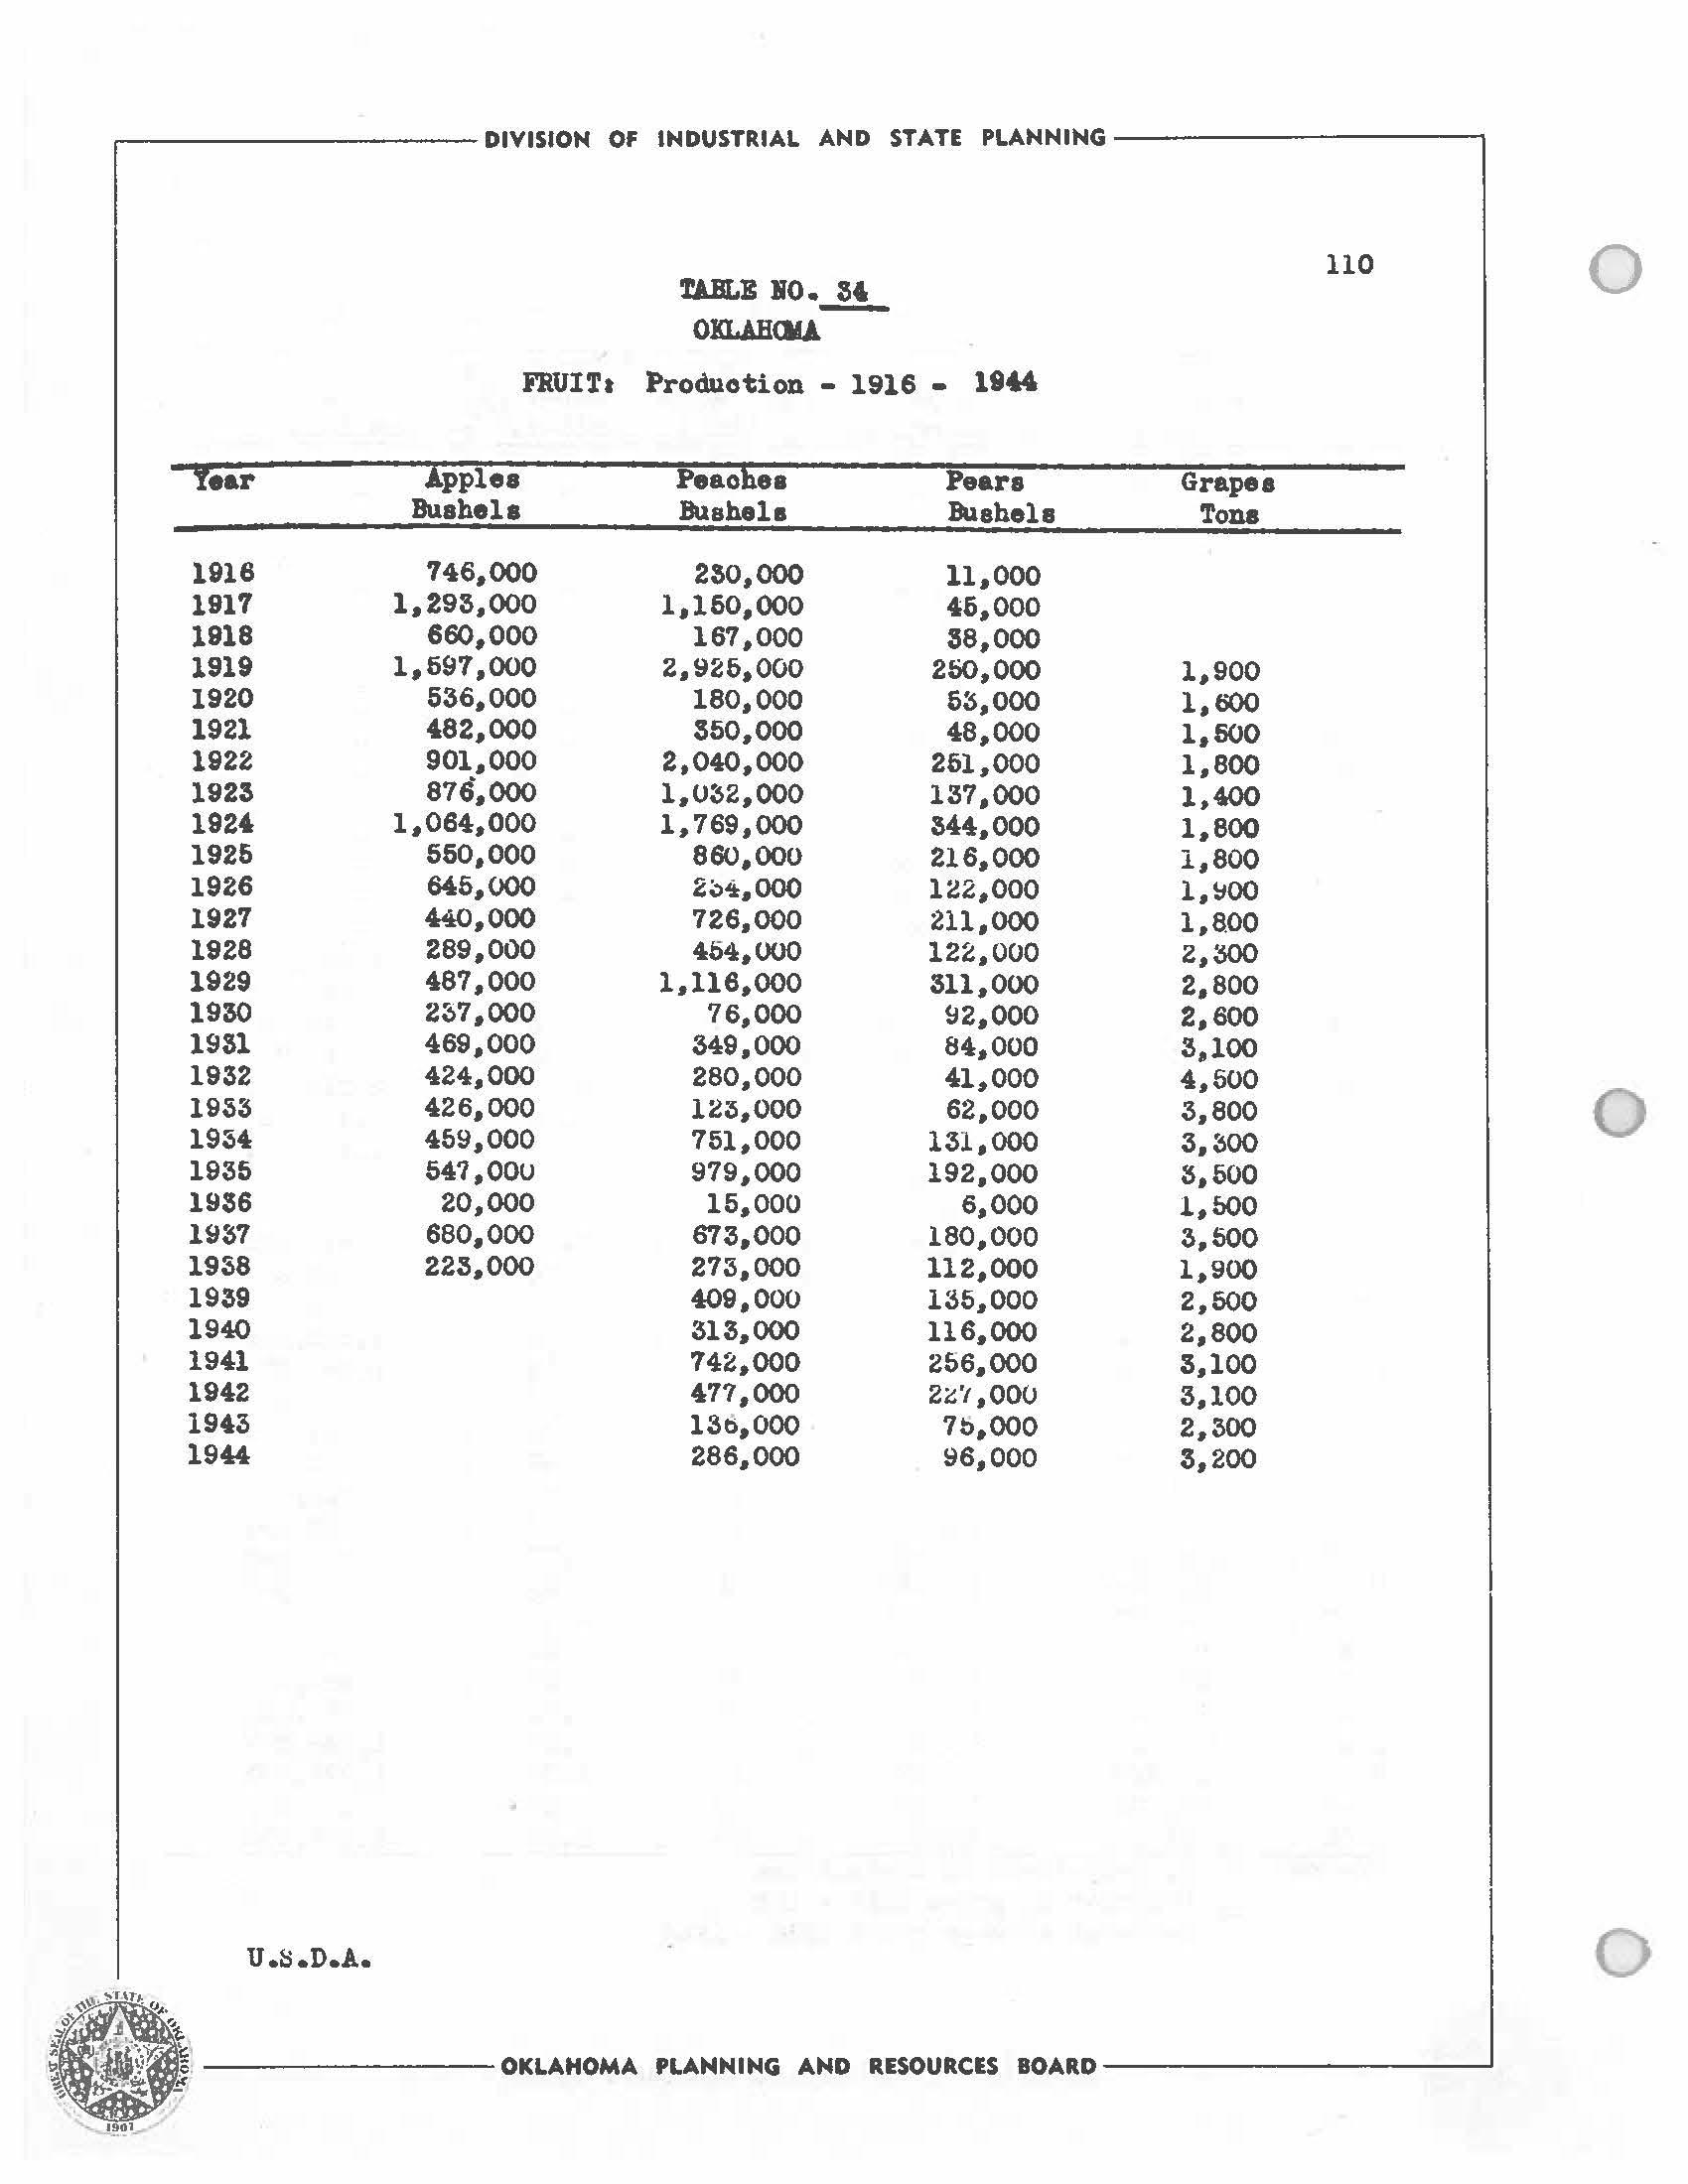
,-----------DIVISION OF INDUSTRIAL AND STATE PLANNING-----------, 110 0
Year lpplee Peachea Peare Grapes Bushell Bushels Tona 1916 746,000 230,000 11,000 1917 1,293,000 1,160,000 46,000 1918 660,000 167,000 38,000 1919 1,697,000 2,926,000 260,000 1,900 1920 636,000 180,000 6:S,000 l,600 1921 482,000 350,000 48,000 1,500 1922 901,000 2,040,000 261,000 1,800 1923 876,000 1,032,000 137,000 1,400 1924 1,064,000 1,769,000 M4,000 1,800 1925 550,000 860,000 216,000 1,800 1926 645,000 2i>-!i:,OOO 122,000 l,~00 1927 440,000 726,000 211,000 1,8.00 1928 289,000 464,000 122,000 2,300 1929 487,000 1,116,000 311,000 2,800 1930 2~7,000 76,000 ~2.000 2,600 1931 469,000 349,000 84,000 3,100 1932 424,000 280,000 41,000 4,500 0 1933 426,000 123,000 62,000 3,800 1954 459,000 751,000 131,000 3, :soo 1935 547,00U 979,000 192,000 :S,500 1936 20,000 15,000 6,000 l,f>OO 1937 680,000 673,000 180,000 3,500 1938 223,000 273,000 112,000 1,900 1939 409,000 135,000 2,500 1940 313,000 116,000 2,800 1941 742,000 266,000 3,100 1942 477,000 2~·, ,ooo 3,100 1943 13t>,OOO n,,ooo 2,300 1944 286,000 ~6,000 3,200
0
u.s.D.A.
OKLAHOMA PLAMNIMG AND RESOURCES BOARD----------___.
111 C
( OKLAHOMA PLANNING AND RESOURCES BOARD ------------'
LIVESTOCK
LIV&TOCK AND LIV.l!;S'roCK PRODUCTS
In general, natural conaitions in Okl~homa are favorable tor the produotion of livestock. Good. p~sture 111.lld is abund1U1~, most or which baa a bith grazing v~lue. Feed crops o~n be grown in many l:l.l'eas to supplement the p11.stures. In ~hese areas where uncertain rainfall makes corn growing hazardous, grain sorghum cian oe substituted.

In the early days before statehood the career 01· the livestock industry in Oklahoma 'ffiiS colorful and occupies an uportant place in American History.
In recent years there has been a great explUlaion in the development ot high grade peaigreea livestock. Among thQ breeds of livestock in which Oklahoma has nationaJ.ly recognized herds are herefords, Aberdeen Angus, shorthorns, southdown, shropshirea, v~rioua swine breeds, saddle horses, pulmino horses i..na 'iuarter horses.
Most of the livestock associations sponsor annual sales on oonaigmnent basis to aiseminate gooa oreed.ing i.took throughout i:be state e.nd. nation.
The estillla.teci number ot' livestock ana poultry on !'arms January 1, l94ti are given in 'fable No.~
Cattle
As of January l, 1~45 the toul number of cattle and calves on farms totaled ~,091,000 head.. Of' this number 912,000 1'8re olas&ified aa milk oowe. The above tota1 iti slightly below th~ all time high of ~,164,000 head on farms January l, 1944. The maximum TB.lue head of 16~.10 ooourred in 1944.
The dbtr1 ·0ution of oa..ttle by counties in 1945 ( Table No. 36
~---------- DIVISION OF INDUSTRIAL AND STATE PLANNING ----- --------, 112
0 0 0
OKLAHOMA PLANNING AND RESOURCES BOARD---
and ~•igure No. 23 ) ahowa Osage County aa the leading protluoer w1 thCaddo County ranking seoond.
lhe trends in oattle and milk cows ar~ sho11'D. on Figures lo. 22 and 24 and production and value figures by years and counties aregiven in Tables No. 36 and Swine37 •
The hog population in the state has varied irregularly onr the years. 1be low point was reached in 1926 when 7;,6,000 were reported. The maximwn number of 1,600,000 was reported in 1911. ihe nuabor on hand January l, 1945 is estimated at 908,000, a abarp decline troa 1944 figure of 1,.466,000. F1gure .Ho.~ aho-.. the dietribution of hogs and Table Ho.~ gives the number and w.lue by year1.
Sheep
Sheep railing ii of little importanoe in Olclahcaa. 'Die :mmber of sheep and lambs on farms January 1, 1945 ia estimated as ~26,000 head. Stook sheep are estimated at 266,000 head. 1he number and value of atook sheep by years are aho1111 in Table Ho. 39.
Horses and Mules
'lhe number and value of horses anci .m.u i.es on i'arms January l, by yett.rs is given in Tables No. 40 and 41 ---- •
( .------------ DIVISION OF INDUSTRIAL AND STATE PLANNING-------------.
llS ---------OKLAHOMA PLANNING A-ND RESOURCES BOARD-------------'

,------------ DIVISION OF INDUSTRIAL AND STATE PLANNING---------------. 114 0
OKLAlH.J!ll.A LI\t~
Estimated 1'.'Umber on Farms, January l, 1945 All All : All : All : Cattle Sheep : Hogs Horses z All County and and and and : Chiokens Calves Lambs Pi~s Jt.ules : Adair 16,000 3,500 : 10,900 5,090 108,000 Alfalfa ; 55,000 : 17,400 8,600 2. 690 : 206,000 Atoka 29,500 1,500 : 17,800 8,720 : 128,000 Beaver 72,200 2,100 8,300 3,650 199,000 Beckham i 42,000 2,900 7,700 5,420 : 237,000 Blaine 50,000 11,700 9,400 4,160 286,000 Bryan 42,500 1,000 22,900 9,730 234,000 Ce.ddo 75,000 5,800 20,000 10,680 511,000 Canadian 58,500 8,200 13,400 4,920 : 329,000 Carter 38,600 5,300 14,800 7,400 : 133,000 Cherokee 25,600 3,400 12,700 7,700 204,000 Choctaw 26,000 1,100 10,800 8,160 : 148,000 Cimarron : 30,600 : 9,400 : 4,300 1,490 49,000 Cleveland 24,400 900 10,700 5,490 205,000 Coal 20,500 800 8,100 5,650 98,000 Comanche 54,500 3,700 12,900 6,580 212,000 Cotton 33,500 4,700 6,400 2,690 162,000 Craig 37,500 2,700 12,700 8,010 199,000 0 Creek 27,600 500 11,600 8,980 126.,000 Custer 63,800 7,200 13,000 5,600 252,000 Lelav1are 29,300 6,200 19,800 6,930 209,000 t ev,ey 47,000 3,100 : 10,000 5,910 194,000 bllis 51,000 2,300 6,500 4,360 141,000 Gar 1 ield 64,000 27,400 9,500 4,410 334,000 Garvin 43,500 2,700 15,500 8,430 251,000 Grady 61,100 5,500 22,200 : 10,600 312,000 Grant 50,800 42,300 12,700 4,170 322,000 Greer 27,300 700 4,200 3,000 176,000 Hannon 18,700 3,100 3,600 1,650 113,000 Harper 44,200 2,800 3,700 3,130 129,000 liaskell 22,200 300 9,500 6,570 108,000 Hughes 20,900 700 17,200 7,400 185,000 Jackso n 36,000 5,100 3,900 2,450 241,000 Jeffersori 49,000 1,400 5,200 4,820 1~9,000 Johnston 30,000 2,500 10,400 5,460 113,000 Kay 56,000 19,900 24,500 5,590 269,000 Kingfisher 54,800 11,500 15,200 2,200 297,000 Kiowa 56,000 4,900 4,500 2,5;sO 205,000 Lather 17,600 900 5,700 3,640 52,000 Lenore 44,Z.OO 1,300 16,800 11,270 186,000 Lincoln 44,000 1. 600. 9,900 8,490 355,000 Lt,f Rn 31,600 4,600 13,400 4,200 181,000 Love 19,200 400 11,800 3,650 97,000 0 •
TABLE 10. 35
'I'l,CK---;F.r f'(JUL '.!'RY
OKLAHOMA PLANNING. AND RESOURCES BOARD

r-----------DIVISION OF INDUSTRIAL AND STATE PLANNING-------------, C 116
All All .li.ll All Cattle Sheep Hogs Horses : All and and and and Chickens Calves Lambs Pi~s Mules ii cClain 27,600 : 1,400 17,900 5,810 22 ~.000 McCurtain 41,500 : i,700 : 20,900 11,790 154,000 McIntosh 25,000 800 20,300 8,490 199,000 r..ajor 42,600 5,000 9,100 4,730 223,000 Marshall 18,000 700 7,400 3,030 48,000 i.. ayes 42,900 3,000 11,300 7,220 231,000 Murray 21,000 800 8,900 3,6l0 70,000 lv1uskogee 38,600 1,000 17,800 11,370 212,000 Noble 44,200 6,200 10,400 3,980 177,000 Nowata : 35,100 2,00 0 8,500 b,210 113,000 Okfuskee 26,700 l,2v0 14,300 6,220 175,000 Oklahoma 34,900 5,300 11,600 : 5,160 ~45,000 Okrnule-ee 21,900 1,700 11,400 7,940 131,000 Osar;e 127,500 1,900 22,700 10,500 129,000 Ottawa 24,200 2,200 14,000 5,010 131,000 Pal9llee 43,500 2,700 9,2:)0 6,260 127,000 Payne 37,000 3,700 12,500 6,210 207,000 ( Pittsburg 44,700 2,200 19,700 10,640 169,000 Pontotoc 32,600 1,600 : 11,100 6,140 213,000 Pottawe.tomie 33,200 900 14,300 5,980 264,000 Pushmataha 30,600 2,500 14,800 7,090 82,000 Roger Mills 56,300 3,300 7,700 6,730 165,000 Rogers 44,500 2,900 14,400 6,860 129,000 Seminole 16,700 700 10,800 6,460 144,000 Sequoyah 29,300 400 8,300 6,840 128,000 Stephens 46,000 1,500 14,100 7, l J 0 214,000 Texas 62,000 2,600 8,190 2,630 140,000 Tillman 39,000 5,900 9,000 2,440 211,000 Tulsa 32,900 1,600 10,600 5,840 167,000 Wagoner 27,200 1,400 11,300 7,520 180,000 Washington 26,800 500 5,700 3,560 65,000 Washita 62,500 4,400 11,200 4,960 379,000 Woods 56,700 3,800 6,400 4,2 8 0 149,000 Woodward 65,000 2,500 9,600 4,800 162,000
'!ABLE NO. ~5 ( cont'd) OKLAHvi..A LIVM> TvCK i-.. J; POUL TRY ~stimated Number on 1'arms, January 1, 1945
Source: U. s. Depar"bnent of Agrioul ture
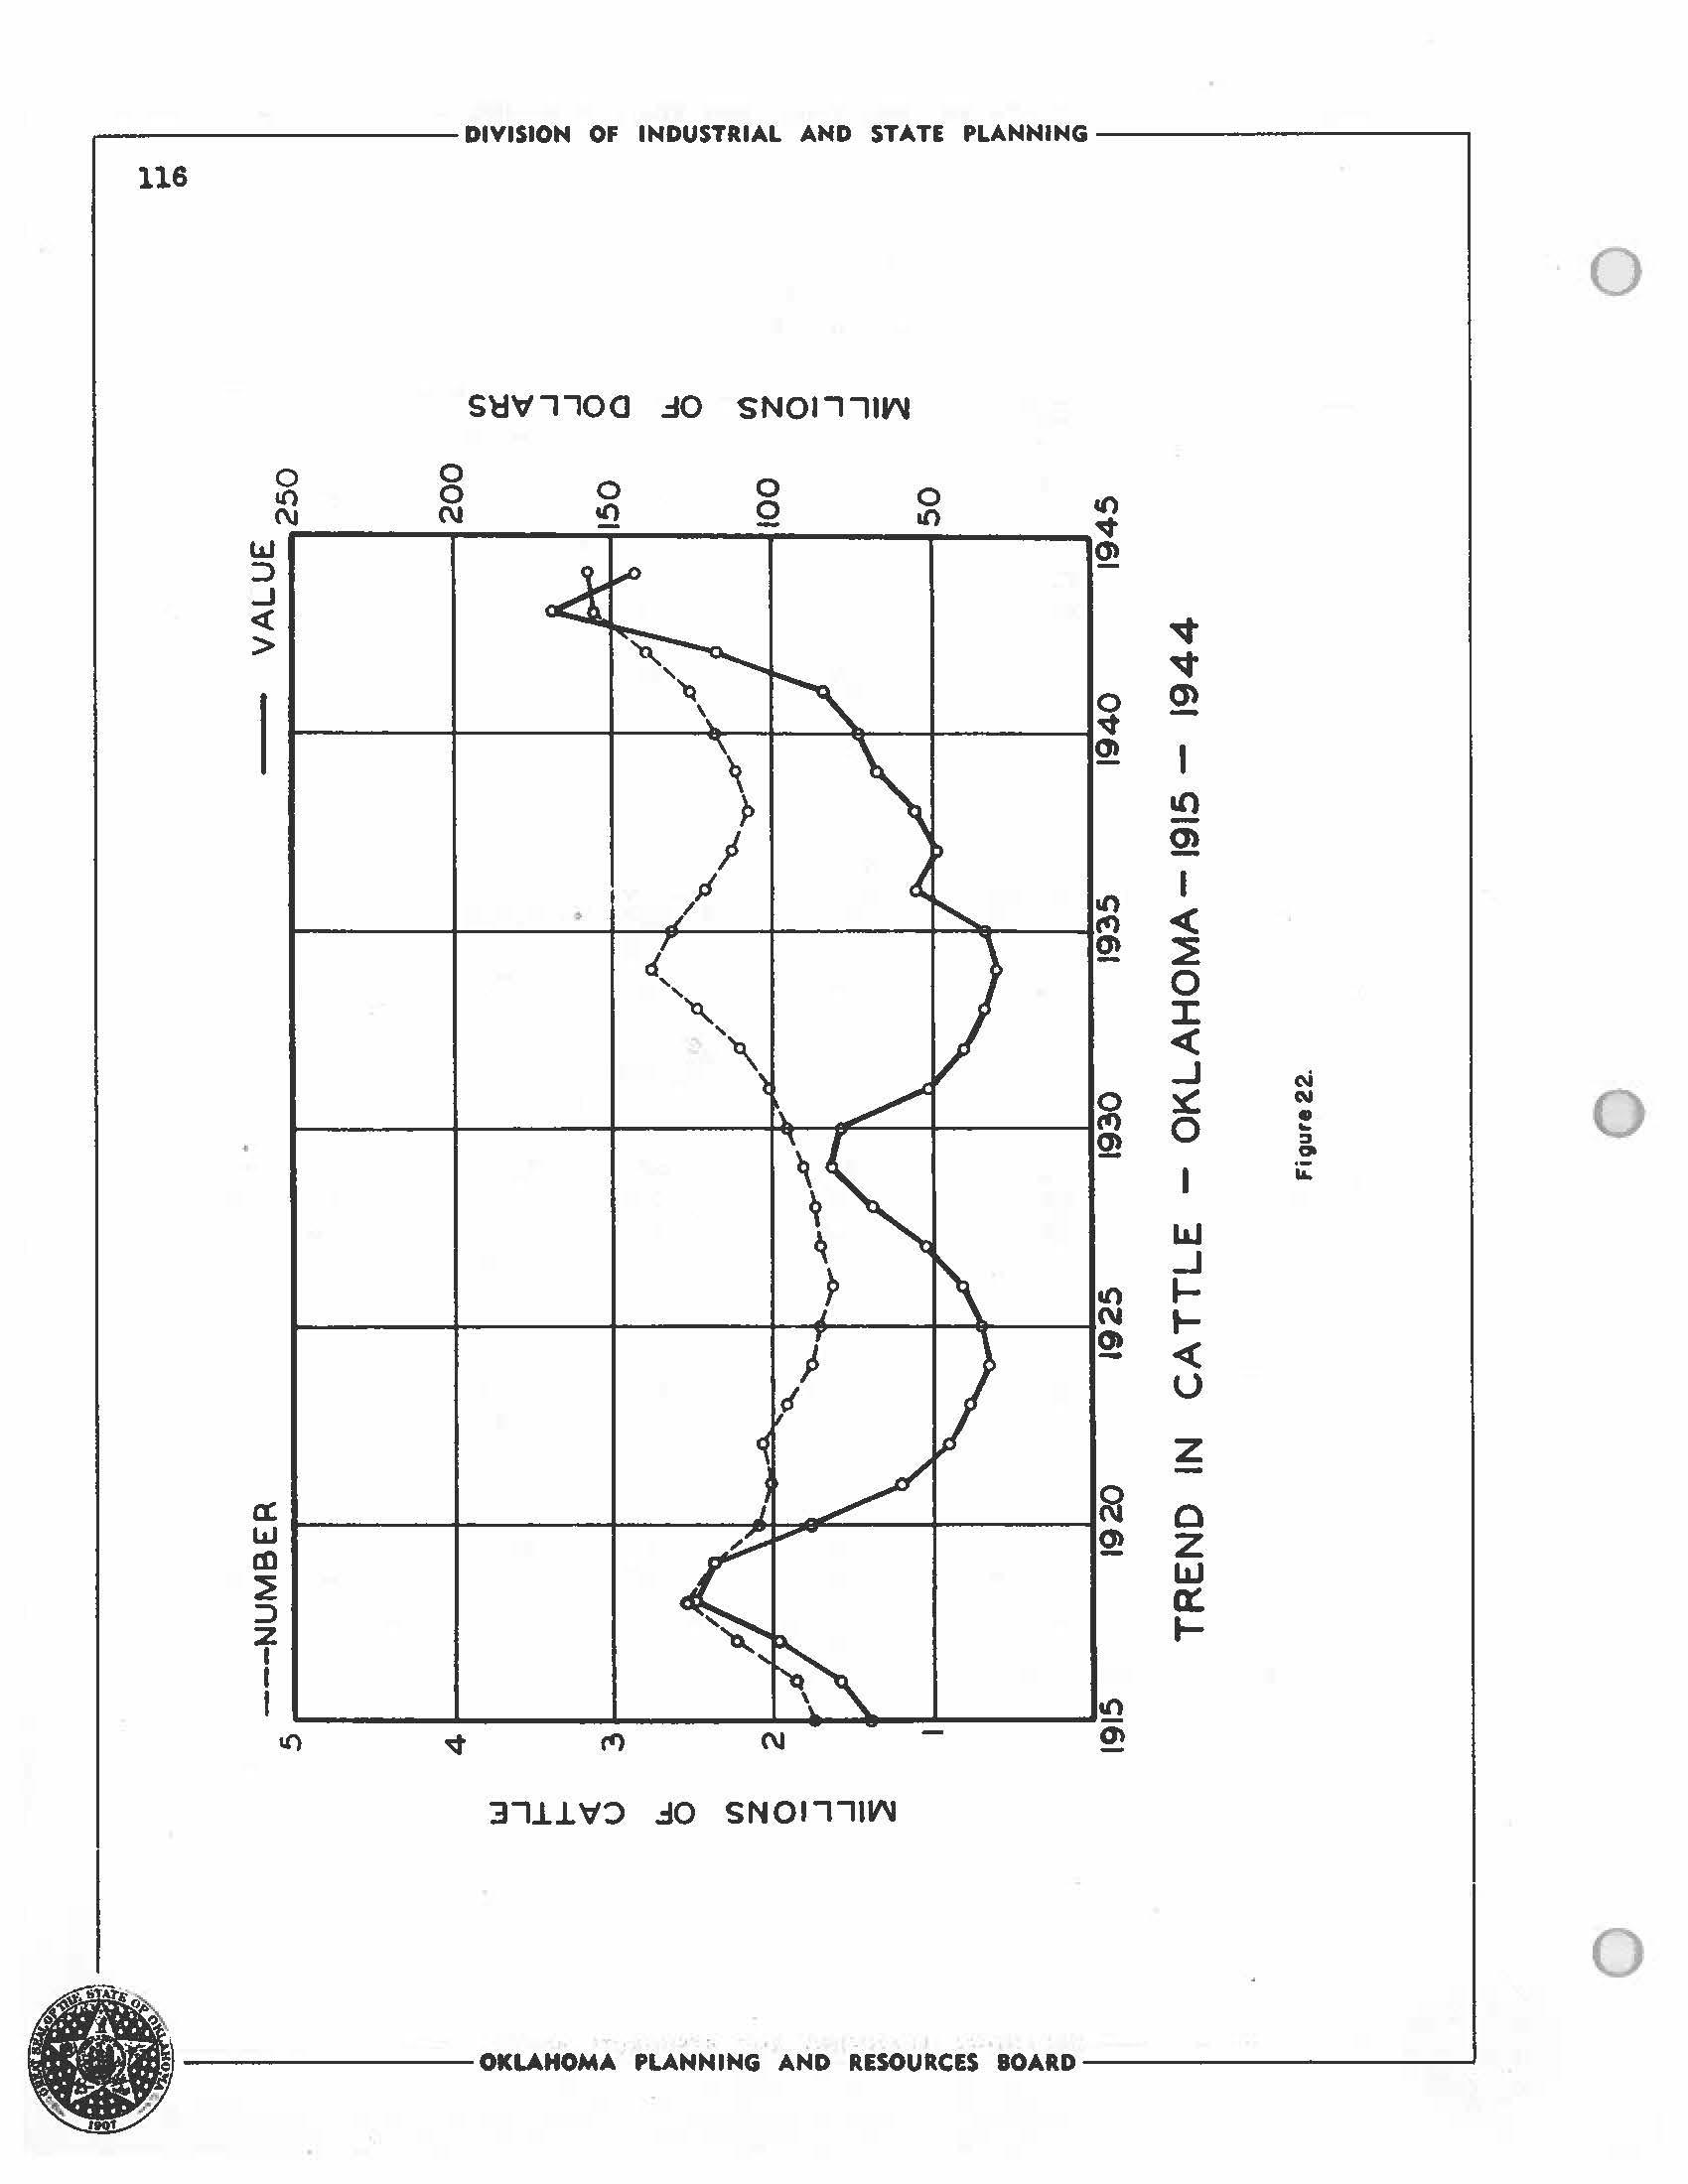
,---------DIVISION OF INDUSTRIAL I.MD STATE PLANNING---------, 116 0 S~'o'7700 .:10 SNOl771~ 0 0 0 0 I() 0 0 co (\J N Ill Q IC) w :) 0, _. <( > 0 0, '° 2! it) I re, < 0, 0 ::c < ....J (\j 0 N • (f) 0 .. 2? :::, "' LL.I ....J co .... N tJ, <I u z a: 0 w 0, z ro LL.I a:. :) :z I I I Ill I() re, N 0\ 37.ll.'o'':> .:fO SN01771V\I 0 •-------OKLAHOMA PLANNING I.MD RESOURCES IOI.RD-----------'

.------------ DIVISION OF INDUSTRIAL AND STATE PLANNING-----------, C l i.7 TaB::...E m. A - 1941: ML CAT'l'i..E I;.,; OKl.JJ:Oi.,A 1891 Year Iiumber on Farr,m Jan. 1 "l9.lue ;eer I! ead Total Ve.Iue ,F 18Sl 787,0()0 " 14.,1~ 11,078,000 •.,J 1892 1,011,000 14.10 14,234,000 1893 1., 156 ,o.:.. o 14.20 16,364,000 1894 1,288,00C 15.30 20,514,000 1895 1,457,000 15.80 23,082,000 1896 1,623,000 15.90 25,774,000 1897 1,792,000 w.20 32,5b5,000 1696 2,030,000 22.90 46,422,000 1899 2,320,00 0 24-30 56,412,000 1900 2 , 42 9, o::-o 26.10 63,484,000 1901 2,484,000 19.80 49,177,000 1902 2,500,000 21.60 53,980,000 1903 2,510,000 19 .oo 47,681,000 1904 2,42 0 ,000 14.00 36,048,000 1905 2,240,000 14.70 32,824,000 1906 2,090,000 16.20 33,763,000 1907 1,985,000 17 .40 34,484,000 1908 1,930,000 w.20 35,080,000 1909 1,615,000 18 .90 34,264,000 1910 1,797,000 22.so 40,406,000 1911 1,725,000 25.90 44,682,000 ( 1912 1,673,000 25.70 42,920,000 1913 1,606,000 32 .40 52,056,000 1914 1,702,000 38.40 65,297,000 1915 1,736,000 40.30 69,920,000 1916 1,844,000 42.70 78,763,000 1917 2,205,000 44.00 97,063,000 1918 2,535,000 49.20 124,614,000 ' ,. ., ,. 2,360,000 49 .90 117,664,000 ..1n o 2,074,000 42.10 87,315,000 l!iU 2,000,000 29.60 59,200,000 1922 2,050,000 22.10 45,305,000 1 23 1,900,000 20.40 38,760,000 1924 1,750,000 18.60 32,550,000 1925 1,695,000 21.10 35,764,000 1926 1,627,000 25.40 41,326,000 1927 1,695,000 30.90 52,376,000 1928 1,729,000 39.70 68,641,000 1929 1,814,000 45.00 81,630,000 1930 1,915,000 41.00 78,515,000 1931 2,020,000 25.40 51,308,000 1932 2,200,000 18.80 41,360,000 l933 2,470,000 14. lo 34,827 ,ooo 1934 2,7 50,000 11.10 30,450,000 1935 2,€ 33,000 12.10 33,526,000 1936 2 I 4~~2 I 000 22 .90 55,514,000 1937 J 2,252,000 21.so 48,622,000 L I OKLAHOMA
PLANNING AND RESOURCES BOARD
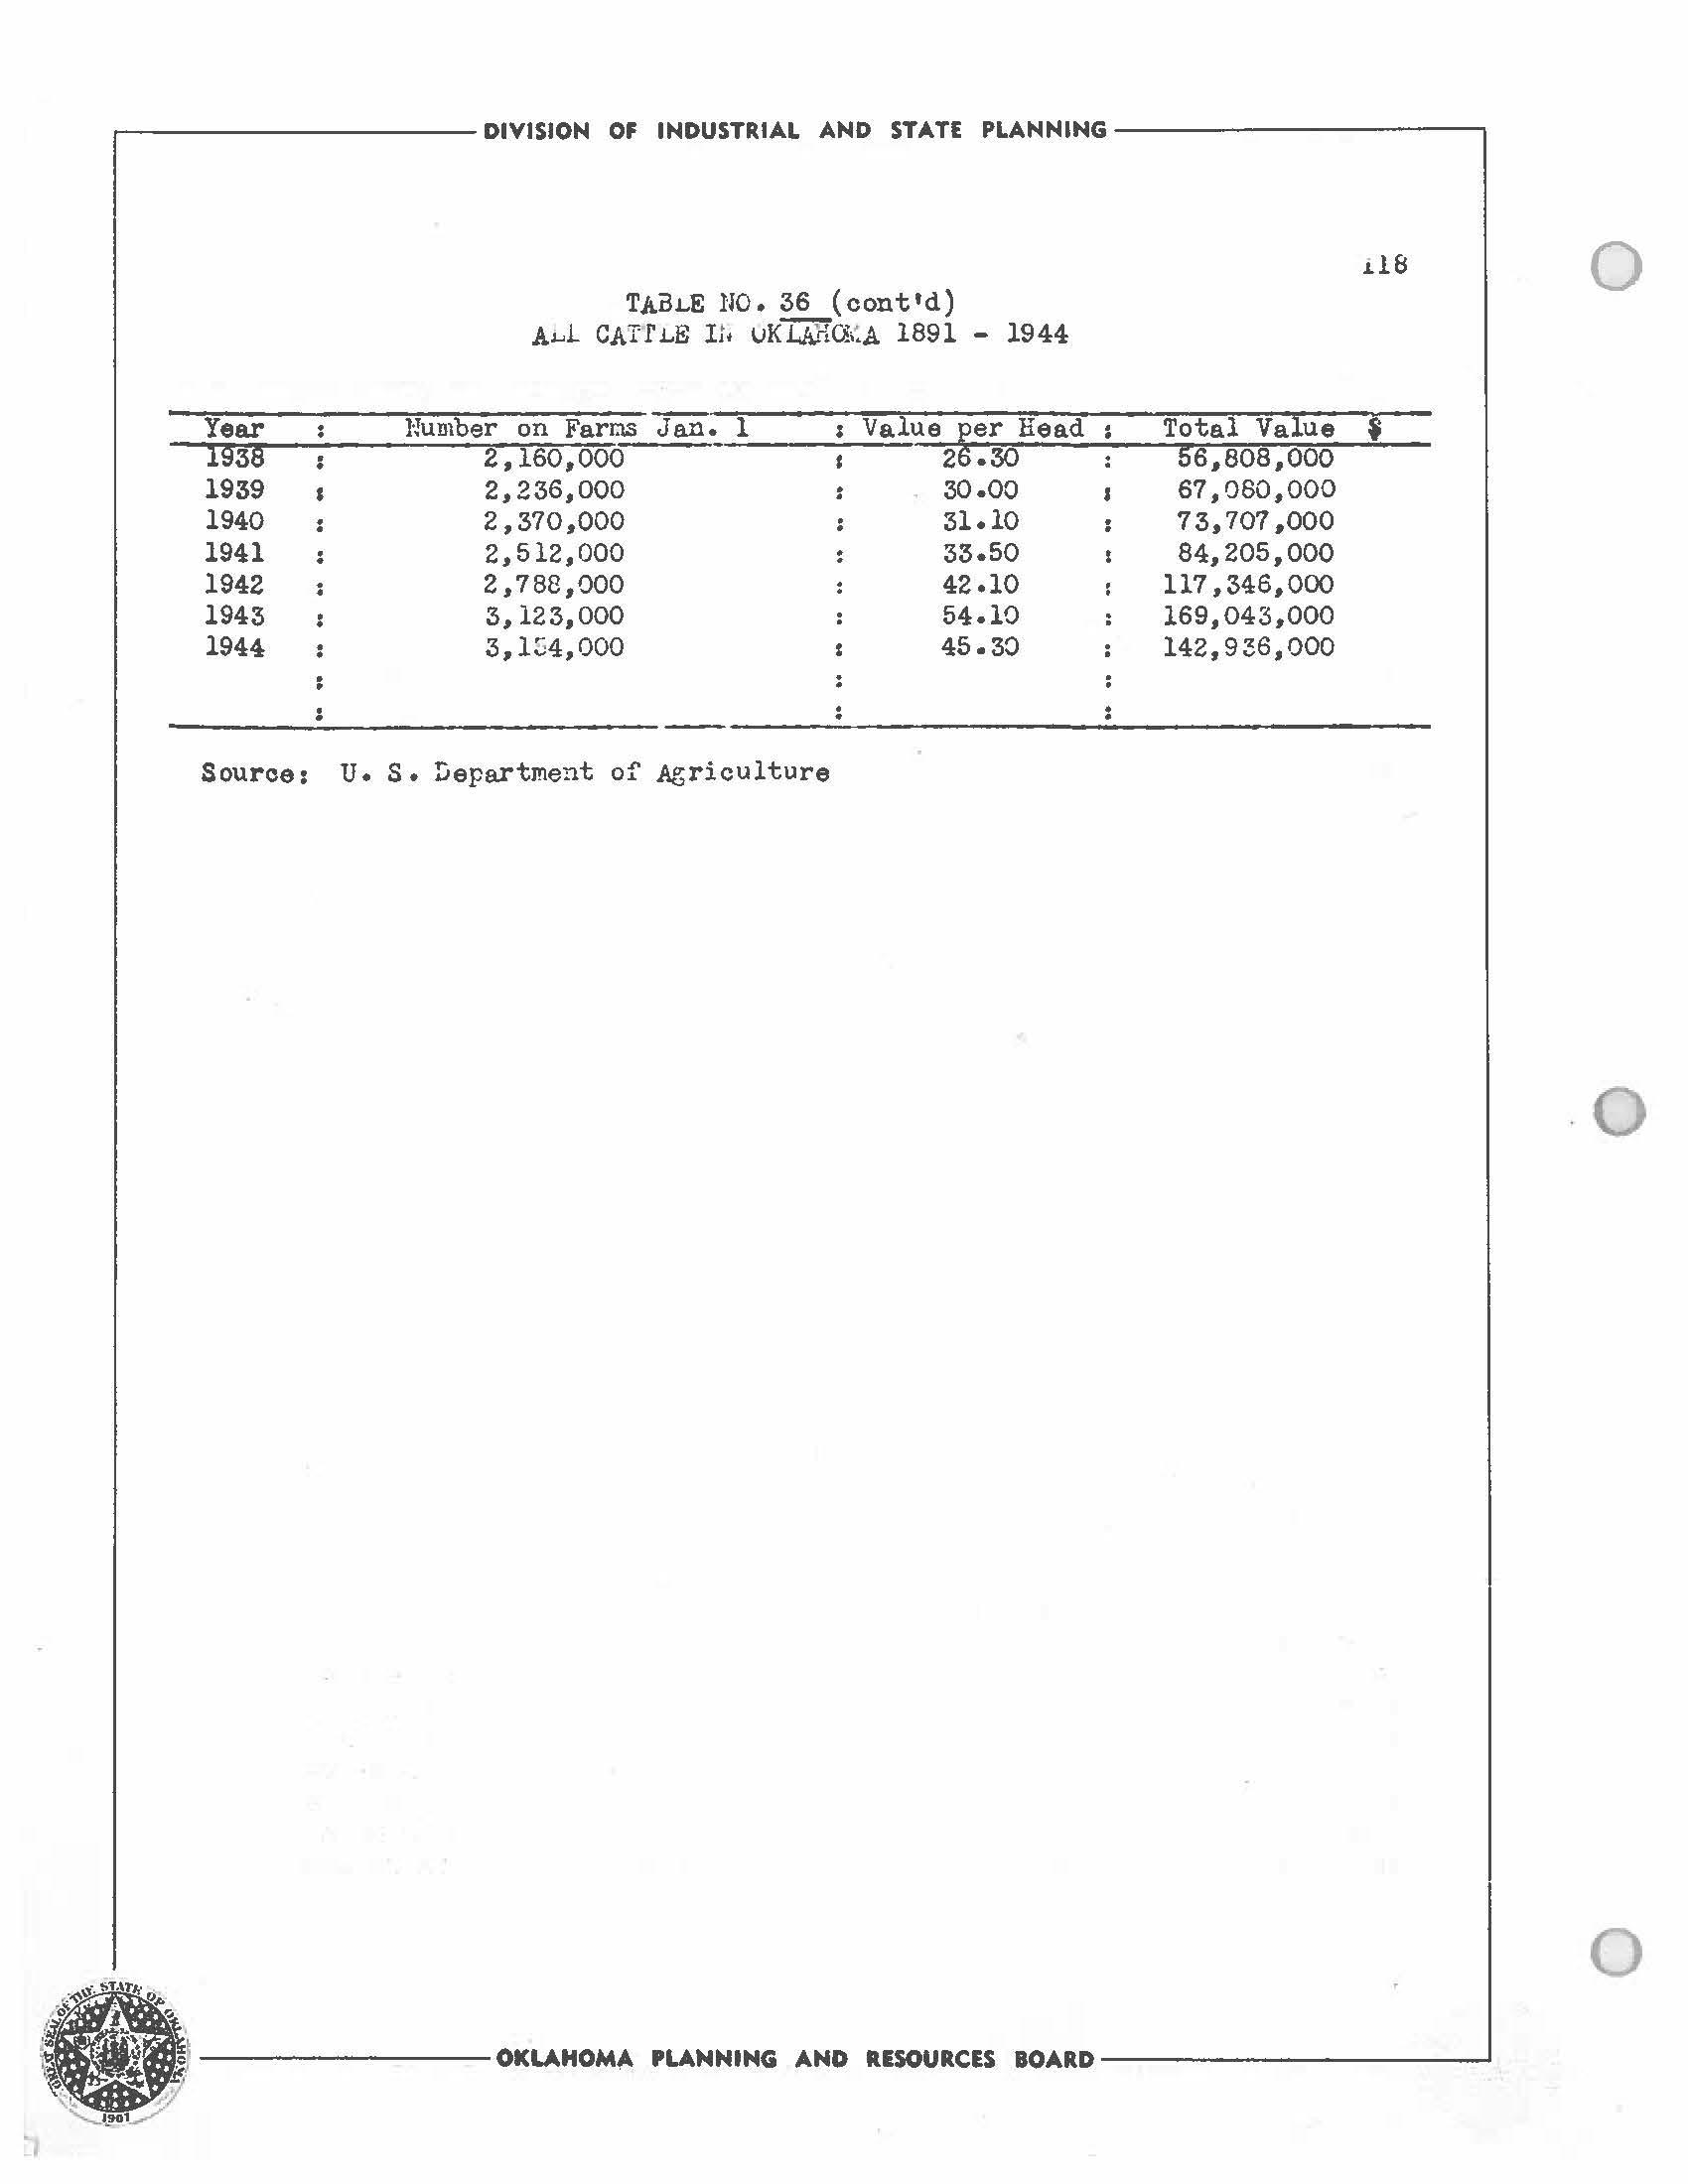
...------------ DIVISION OF INDUSTRIAL AND STATE PLANNING------------, Year 1938 1939 1940 1941 1942 1943 1944 TA.oLE NO. 36 (cont'd) A.._,i CAI fLE I l, vK l.JJ{C>., A 189 l - 19 44 Number on Faros Jan. l 2,160,000 2,236,000 2,370,000 2,512,000 2,788,000 3,123,000 3,154,000 Value ~er Head 2 .30 30.00 31.10 33.50 42.10 54.10 45.3:)
u. s. Department of Agriculture il8 Total Value I 56,808,000 67,080,000 73,707,000 84,205,000 117,346,000 169,043,000 142,936,000 - ------OKLAHOMA PLANNING AND RESOURCES BOARD------------' 0 .o 0
Source:

,g ..... ·!!lf!.... 0 ,c :z: 0 .,, z z z G') z ICI ,, "' .,. 0 C "' .,. a, 0 ,, 0 r OKLAHOMA PLANNING 8 RESOURCESB1 SCALE -STAri,rE MIL rs0 10 zo 30 +o so DISTRIBUTION OF CATTLE 1945 I I V///22Legend Head 15.000-29.999 30,000-44, 999 45,000-59,999 60,000-74,999 Over 75,000 "
.... .... u, 0 < ii. 0 z 0 ... z ICI C ,, ;;: rz 0 E ... "Cl z z G'I
Figure 23.
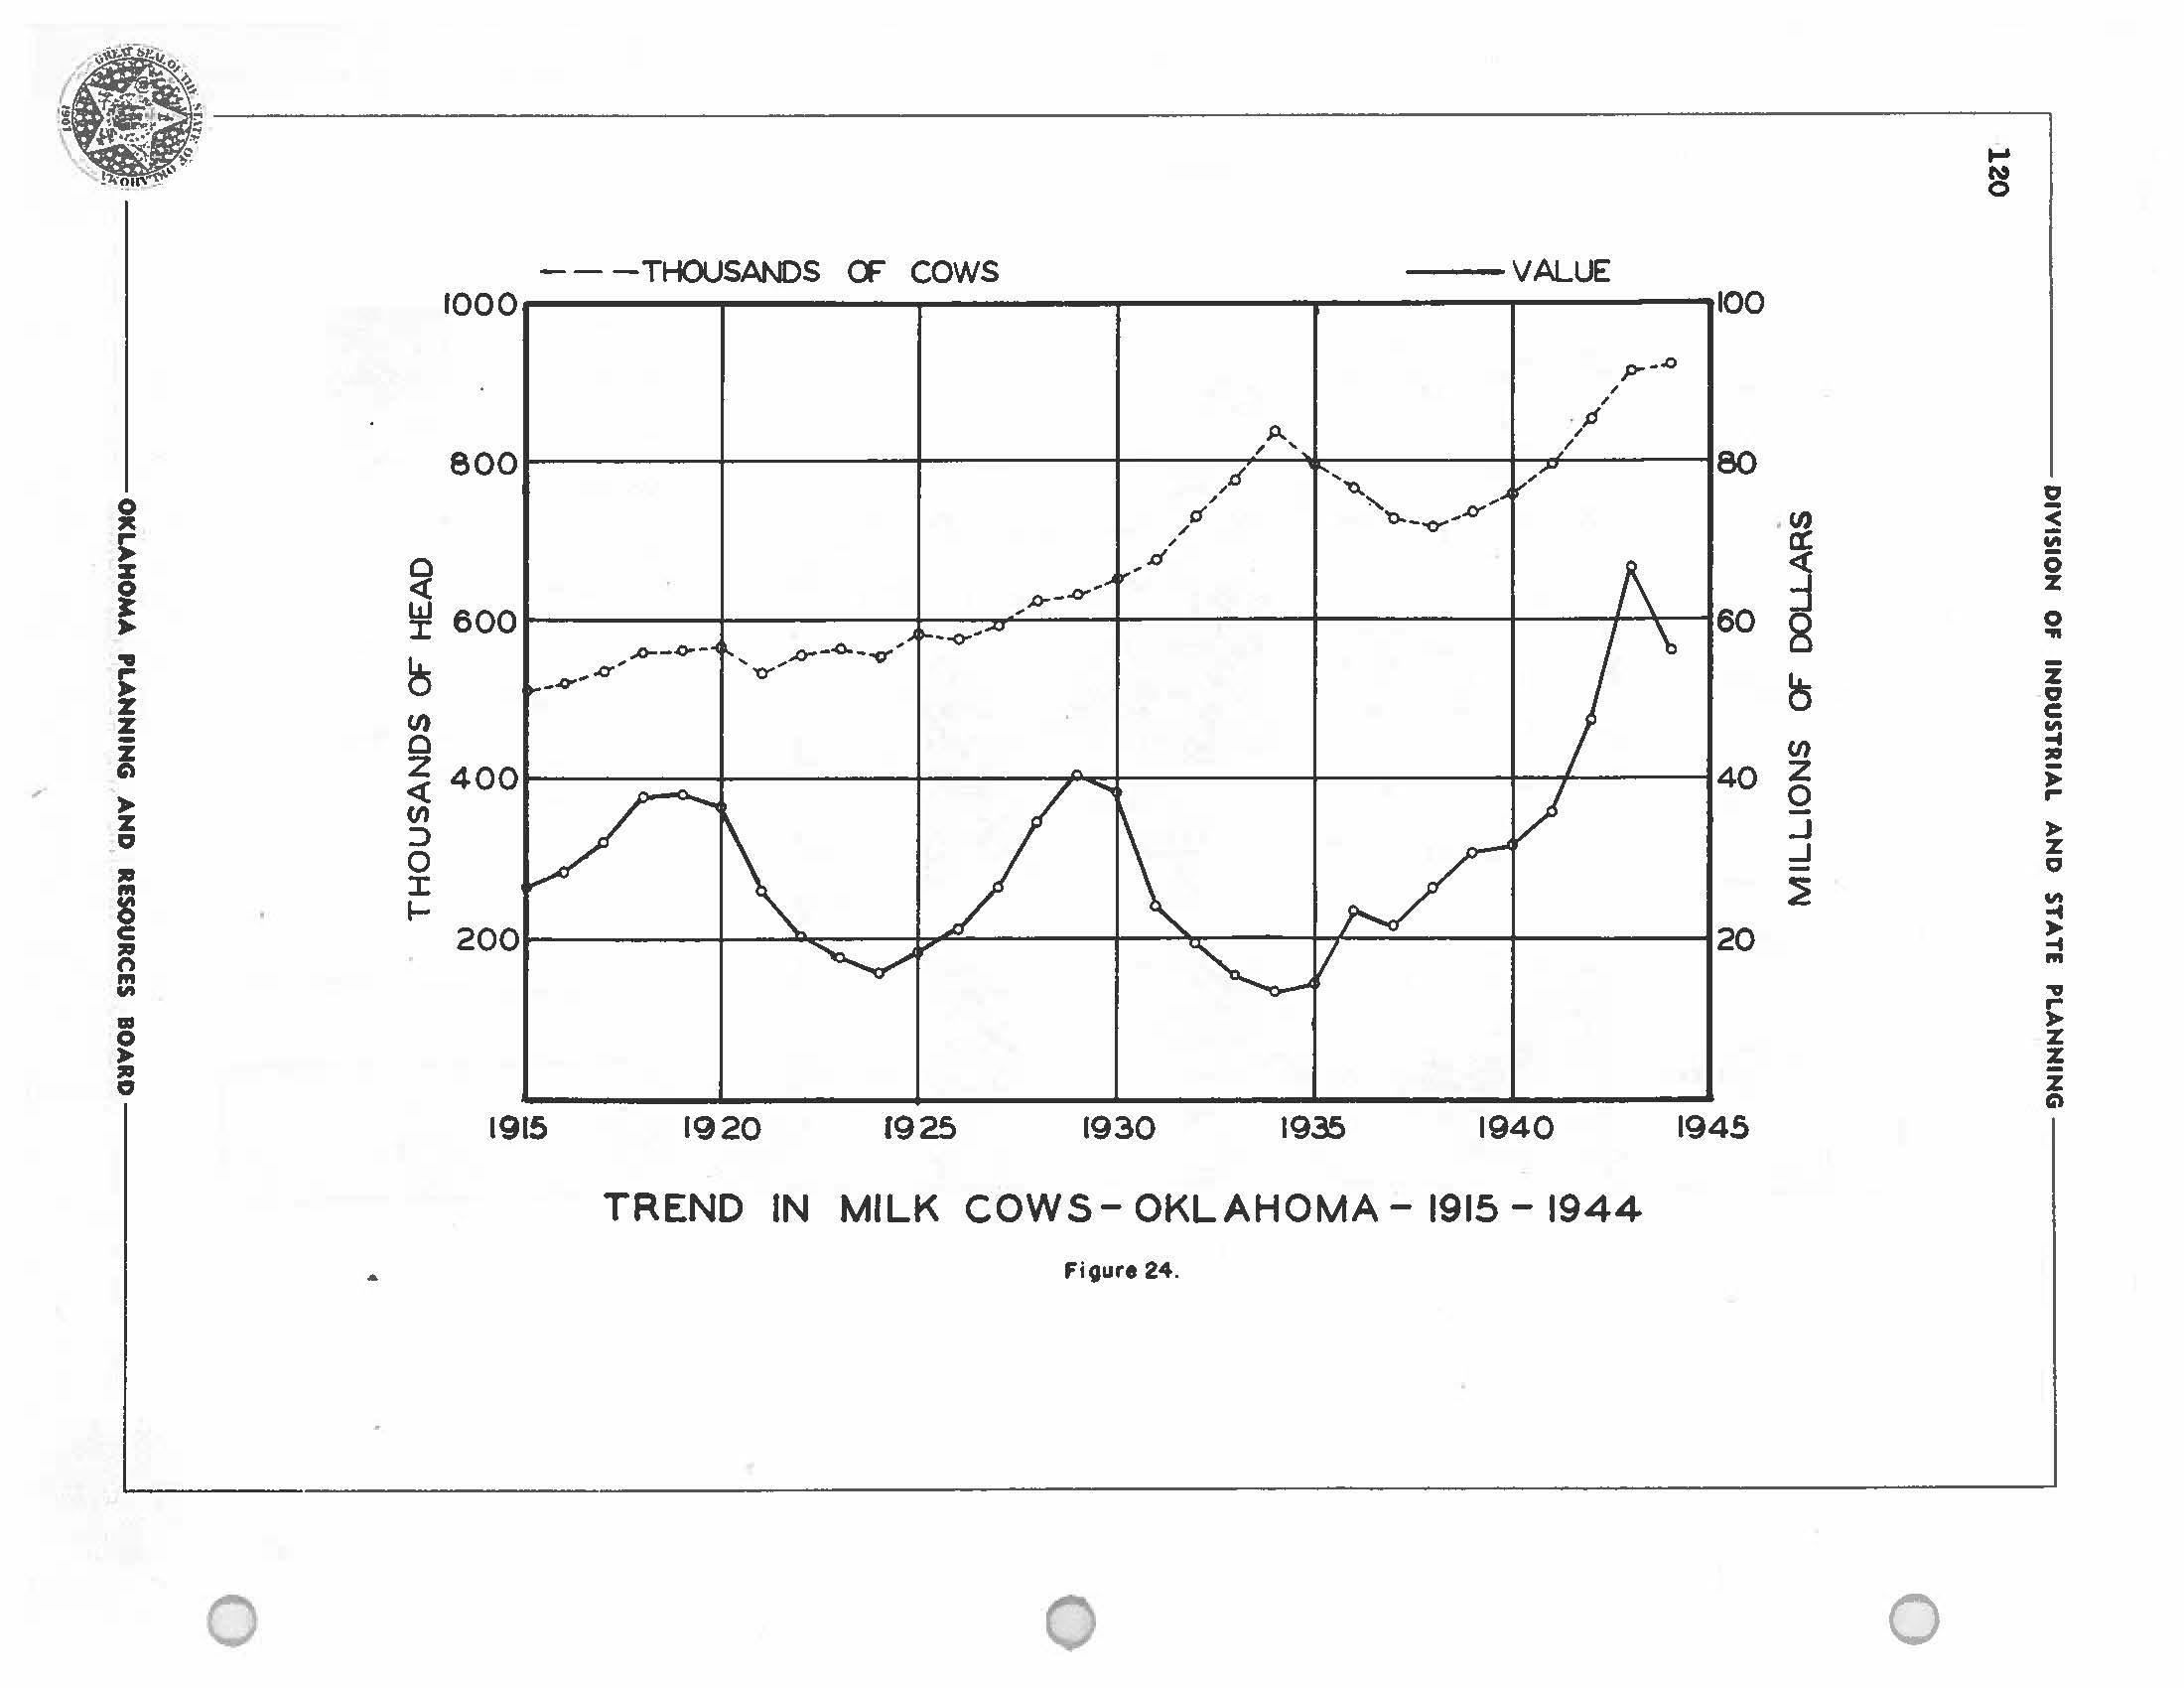
0 ,it z ! .. % i % " ,., § "' n "' "' ID "' 0 0 - - -THOUSANDS CF COWS VALUE 1000--------------------------,,-------.I 100 ;:r ·.J;> , , · P 800 , I ,/ ~-1 r ,I, f'" u' ;eo t t : 600 ~-h-~-~- -~r6-~+~-brq•1 I I /\ I I .! / '"0.--o-~ ... rl , 60 8 .d (/) Cl 4oor------:-:::::::--t-----t----:iP-o.::±---------+----~___,1--------1 (II :> 0 ::c 12001 I b...._ L,R I ¾: I / I I (/) 40 5 ...J _J 20 1915 1920 1925 1930 1935 1940 1945 TREND IN MILK COWS- OKLAHOMA- 1915 - 1944
0 .... N 0 0 3 "' 0 % 0 ... % 0 C: "' ,.. % 'Cl "' -4 -4 "' .,, ,.. % ! z G\
Figure 24.

~---------- DIVISION OF INDUSTRIAL AND STATE PLANNING-----------,
121
Year H\.un ber on Farms Jan 1. , Value per Head is Total Value • 1891 30,000 16.00 480,000 1892 40,000 16.00 640,000 1893 60,000 ' 17.00 1,020,000 1894 220,00 0 ' 18.00 3,960,000 1895 230,000 18.20 4,186,000 1896 240,000 19.80 4,752,000 1897 240,000 18.60 4,464,000 1898 250,000 ' 26.20 6,550,000 1899 260,000 28.40 7,384,000 1900 275,000 31.90 8,772,000 1901 278,000 29.30 8,145,000 1902 300,000 27.40 s,220,000 1903 320,.000 : 26.50 8,480,000 1904 340,000 21.60 7,344,000 1905 360,000 : 21.20 7,632,000 1906 380,000 22.70 8,626,000 1907 400,000 24.00 9,600,000 1908 420,000 26.00 10,920,000 1909 445,000 26.20 11,659,000 1910 480,000 . 31.50 15,120,000 . 1911 490,000 : 37.00 18,130,000 1912 500,000 35.40 17,700,000 1913 502,000 43.00 21,586,000 1914 500,000 : 50.30 25,150,000 1915 510,000 52.00 26,520,000 1916 519,000 : 55.00 28,545,000 1917 535,000 60.00 32,100,000 { 1918 560,000 67.70 37,912,000 l!:119 561,000 ; 68.00 38,148,000 1920 564,000 65.00 36,660,000 1921 536,000 49.00 ' 26,264,000 1922 556,000 : 37.00 20,572,000 1923 564,000 32.00 18,048,000 1924 554,000 29.00 16,066,000 192!? 582,000 32,00 18,624,000 1£•26 576,000 : 37.00 21,312,000 1927 594,000 45.00 26.,730,000 1928 : 623,000 56,00 34,888,000 1929 631,000 64.QO 40,384,000 1930 650,000 59.00 38,350,000 lS31 675,000 36.00 24,300,000 1932 730,000 21.00 19,710,000 1933 778,000 20.00 15,560,000 1934 838,000 16.00 13,408,000 1935 798,000 18.00 14,364,000 1936 766,00.0 31.00 23,746,000 1 9 37 728 ,000 30.00 ' 21.,840.,000 1938 718,000 37.00 ; 26,566.,000 1939 734,000 42.00 ' 30,826,000 1940 758,000 42.00 31,836,000 1941 796,000 45.00 35,820.,000 1942 852,000 : 56.00 47,712,000 1943 912,000 73.oo 66,576.,000 1944 921,000 61.00 56,181,000
Table 87
Mil.K C0\-.S rn OKL.AIIOlt,A 1891 - 1944
Source: u. ,) . De partment of ~riculture
OKLAHOMA PLANNING AND RESOURCES BOARD------------'
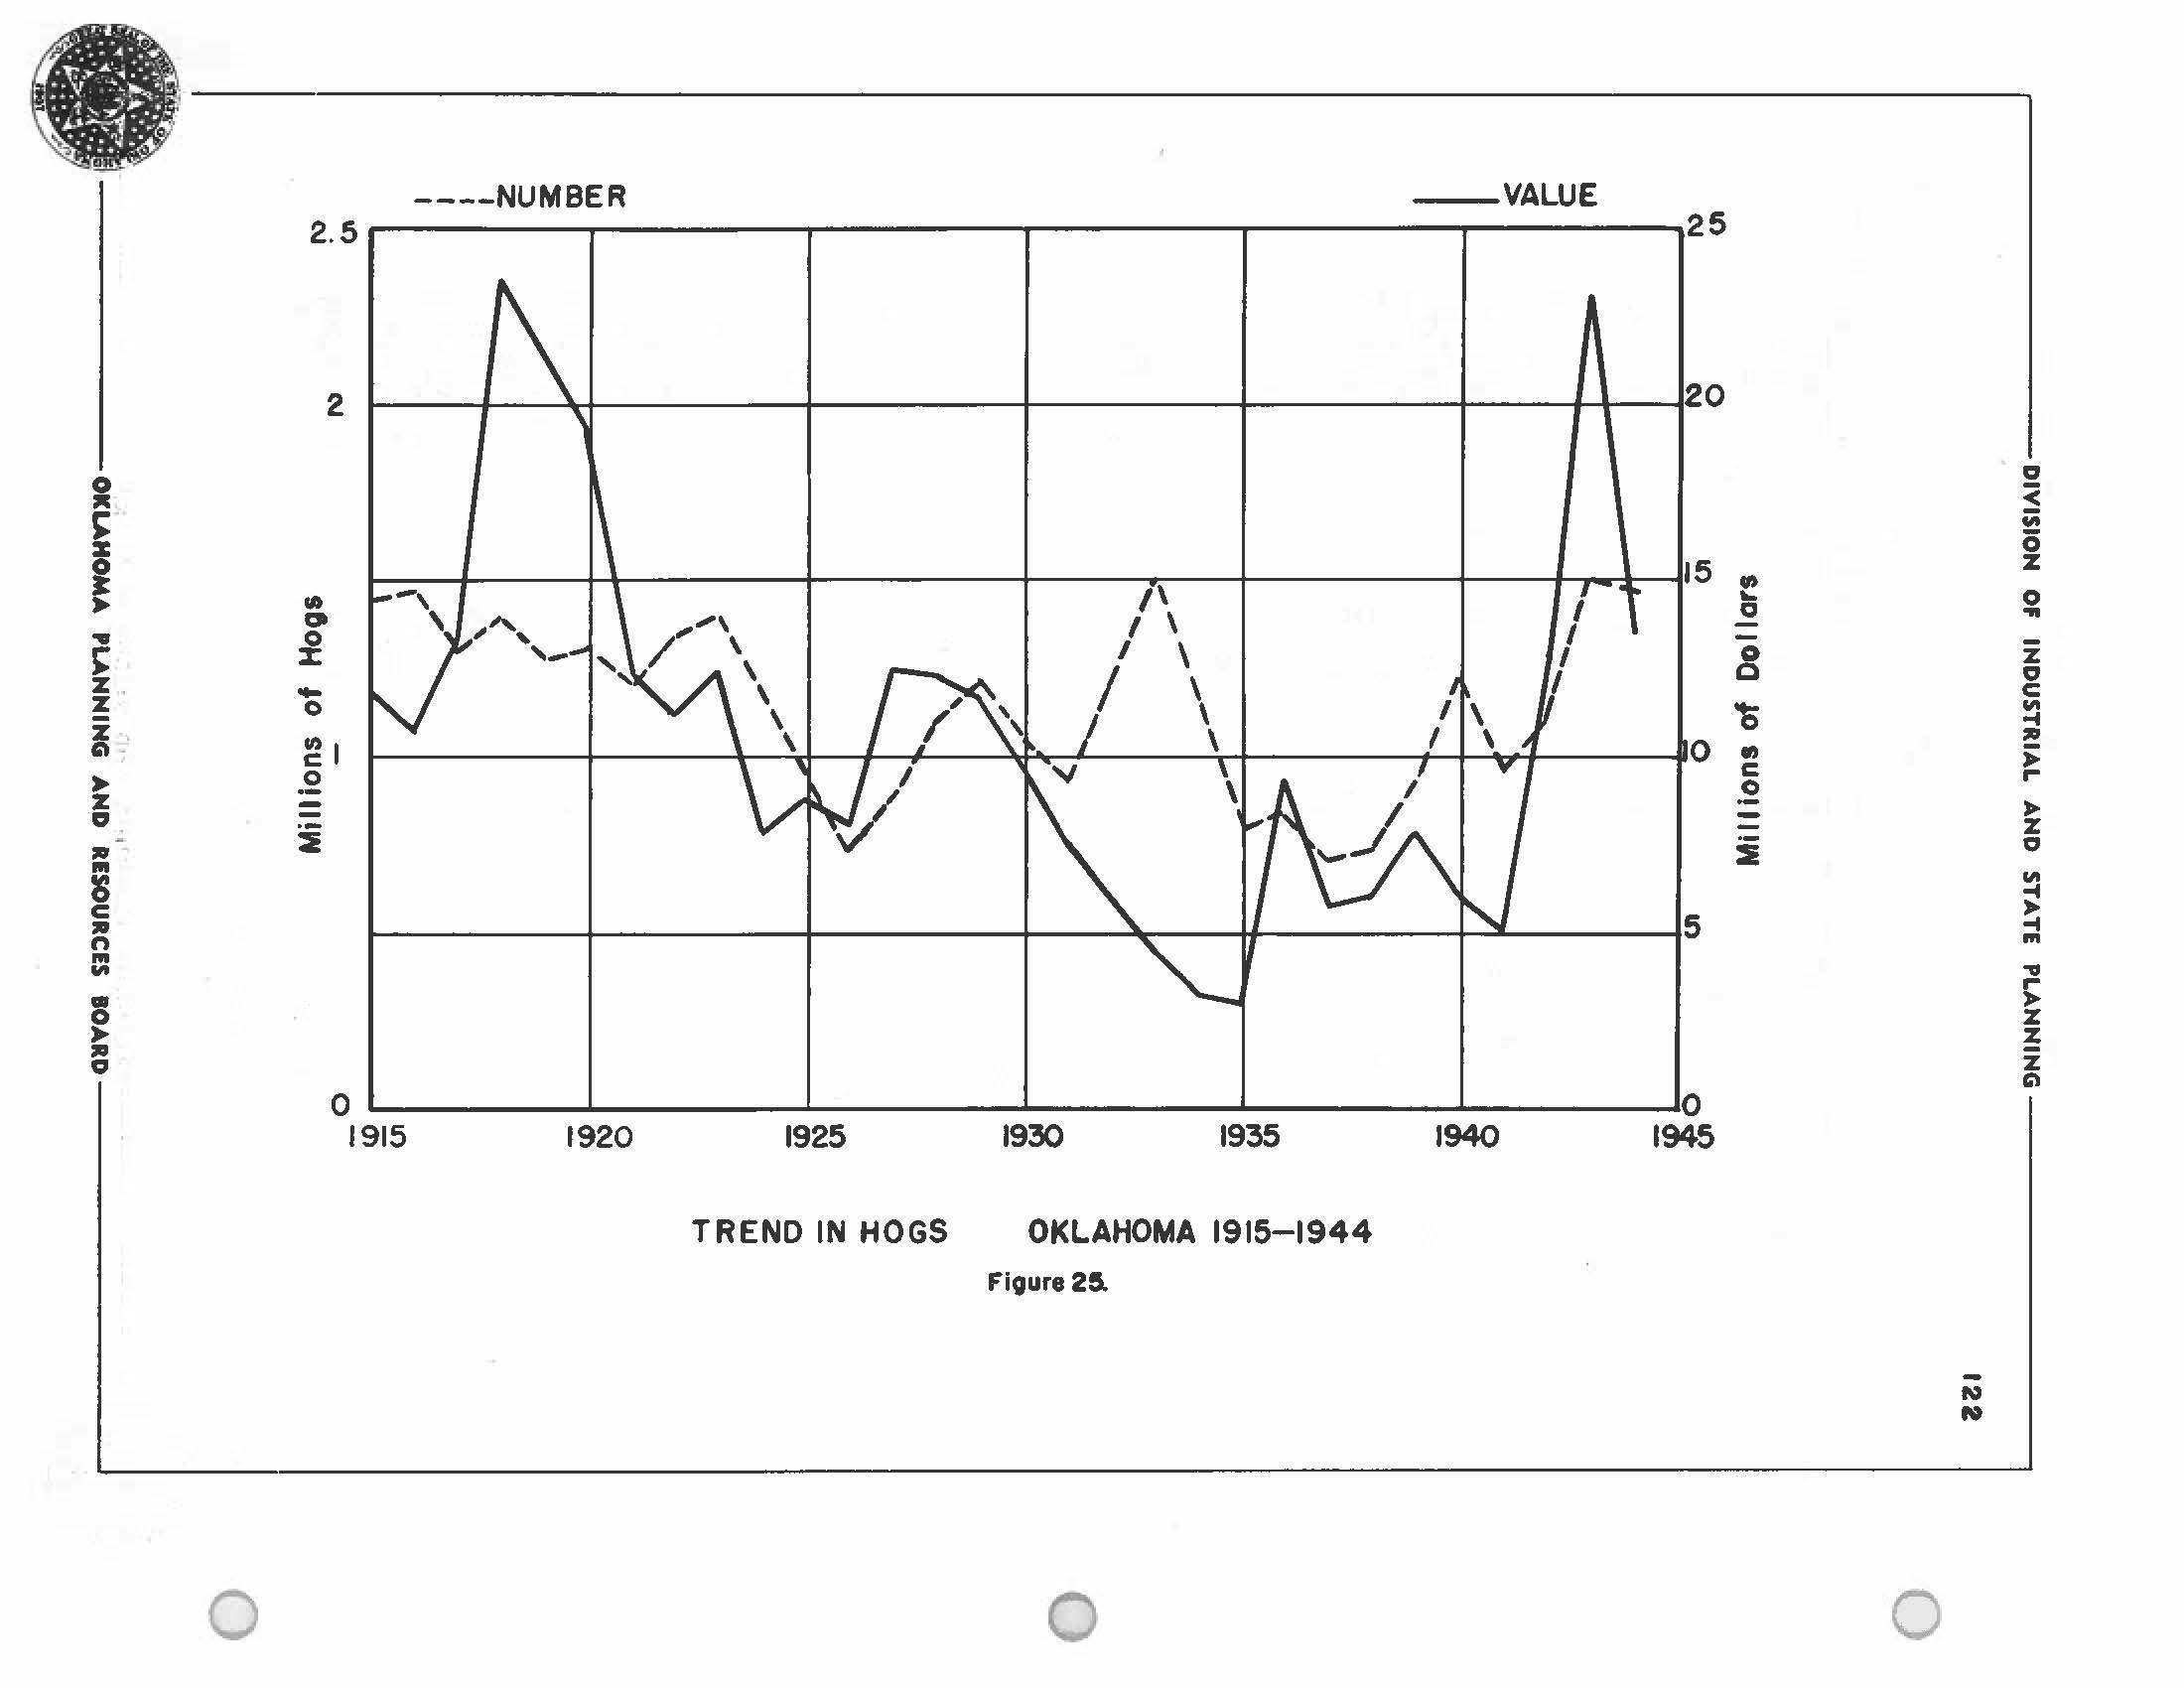
•-----0 z I .. z . Z' Z' G'I . Z' ""' Ill g C "' n "' 1111 • 0 " 'Cl 0 ----NUMBER --VALUE 2. 5 r-------,,----------,.------.----------------25 2 20 15 /\ I -, I \ I II) ....... , I c,I ' ~"', I \ I 0 ,_ I \ % I \ \\ I ' 0 0 ~I \ 0 ·-2 5 O'-------i.-----'-----.._____,i. _.Q 1915 1920 1925 1930 1935 1940 1945
IN
TREND
HOGS OKLAHOMA 1915-1944
0 I 10' "' 0 z .. 0 .. ... 00 z 10' 0 C: Ill '15 -i "' ., C: ,.. 0z i 0 1111 -i -i '" .,, ,.. z ?: z G'IN N 0
Figure 25.

.----------- DIVISION OF INDUSTRIAL AND STATE PLANNING-----------,
123
TABLE NO. 38
Year : Number on Farms - Jan. l : Value ~er Head J : Total Va!ue ' 1891 26,000 3.70 : 96,000 1892 : 33 000 : 3.90 129,000 1893 : 100:000 I 4.50 450,000 1894 400,000 5.20 . 2,080,000 . 1895 450,000 : 5.20 : 2,340,000 1896 495,000 : 4.76 : 2,351,000 1897 : 650,000 : 4.10 : 2,255,000 1898 : 600,000 : 4.70 2,820,000 1899 650,000 4.25 : 2,762,000 : : 1900 700,000 5.40 : 3,780,000 1901 : 850,000 6.00 : 5,100,000 1902 : 920,000 : 5.40 4,968,000 1903 1,200,000 6.80 8,160,000 1904 1,375,000 5.20 7,150,000 1905 : 1,300,000 : 5.00 6,500,000 1906 : 1,100,000 5.20 6,720,000 1907 : 1,300,000 6.80 8,840,000 1908 !' 1,400,000 5.30 7,420,000 1909 l, 450,000 5.20 : 7,540,000 1910 1,560,000 !' 7.70 11,936,000 1911 1,600,000 8.30 13,280,000 1912 : 1,2:::0.000 5.60 6,766,000 1913 . 1,200,000 8.90 10,680,000 1914 1,300,000 8.40 10,920,000 1915 : 1,450,000 a.20 11,890,000 1916 : 1,480,000 7.20 10,656,000 1917 1,300,000 10.20 13,260,000 C 1918 1,390,000 . 17.00 : 23,630,000 1919 1,275,000 16.70 21,292,000 1920 1,304,000 14.80 19,299,000 1921 l, 213,000 10.10 12,251,000 1922 1,334,000 8.30 11,072,000 1923 :; 1,401,000 8.60 12,049,000 1924 1,175,000 6.60 7,755,000 1925 969,000 9.20 8,916,000 1926 736,000 10.90 8,022,000 1927 883,000 14.10 12,450,000 1928 1,104,000 11.10 12,254,000 1929 1,215,000 9.60 11,664,000 1930 1,053,000 9.40 9,898,000 1£131 927,000 8.10 7,509,000 1932 1,205,000 5.00 6,025,000 1933 1,506,000 3.00 4,518,000 1934 1,180,000 2.75 3,268,000 1935 800,000 3.90 3,139,000 1936 824,000 11.30 9,336,000 1937 : 700,000 a.20 5,756,000 1938 730,000 8.30 6,069,000 1939 927,000 8.50 7,880,000 1940 1,225,000 4.90 6,002,000 1941 956,000 5.40 5,194,000 1942 1,099,000 11.00 12,068,000 1943 1,495,000 16.40 22,996,000 1944 . 1,466,000 . 9.20 13,428,000 l, ..el; - -;:.... ,i
HOGS I N OKLAHOMA 1891- 1944
~1 1 -...!!
OKLAHOMA PLANNING AND RESOURCES BOARD

CIMARRON ., 0 < JI OKLAHOMA PLANNING a RESOURCES ecwm ;; t 0 % % 0 0 ... ,i z ,., % SCAU' -STATUT/f //it/LU C % w 1111 i 0 /0 20 30 +o so :Ill " ;; DISTRIBUTION OF SWINE ,z 1945 ., z :Ill ., '" "' "' 0 C :Ill I I "' n 1,000- 4,999 ... ,i "' r• WM 0 5,000- 9,999 % % ™ :Ill z ., 10,000-14,999 " - 15,000-19,999 - Over 20,000
..... l\: "" 0 0
Figure 26.

.-----------DIVISION OF INDUSTRIAL
PLANNING-----------,
AND STATE
Year t Number on Farms - Jan. l : Value ~er Head i : Total Value i 18Sl 40,000 1.95 78,000 1892 ' 44,000 : 2.10 92,000 1893 46,000 : 2.10 . . 97,000 1894 : 48,000 : 2.10 . 101,000 . 1896 58,000 2.80 : 162,000 1896 : 58,000 : 1.65 96,000 1897 61 000 1.40 85,000 1898 : 61:000 : 2.05 : 137,000 1899 67,000 2.30 154,000 1900 67,000 : 2.50 168,000 1901 64,000 : 2.85 : 182,000 1902 65,000 2.40 156,000 1903 57,000 2.66 151,000 1904 54,000 2.45 : 132,000 1906 55,000 2.80 : 154,000 1906 57,000 3.25 185,000 1907 59,000 t 3.20 189,000 1908 60,000 : 2.90 174,000 1909 58,000 3.20 186,000 1910 58,000 3.30 191,000 1911 67,000 3.60 241,000 1912 69,000 3.30 195,000 1913 57,000 3.60 205,000 1914 46,000 4.00 180,000 1916 : 45,000 4.20 189,000 1916 : 75,000 5.00 375,000 ( 1917 104,000 6.30 655,000 1918 114,000 11.30 1,288,000 1919 111,000 11.80 1,310,000 1920 105,000 10.60 1,118,000 1921 90,000 6.20 559,000 1922 83,000 : 4.40 363,000 1923 65,000 5.80 321,000 1924 63,000 : 5.90 ; 369,000 1926 54,000 7.50 405,000 1926 67,000 9.20 522,000 1927 ; 72,000 9.70 696,000 1928 95,000 9.00 856,000 1929 130,000 10.30 1,335,000 1930 143,000 9.30 1,327.000 1931 138,000 4.70 644 000 1932 146,000 3.10 441:000 1933 148.000 2.80 408,000 1934 163,000 3.25 532,000 1936 190,000 : 3.85 732,000 1936 212,000 5.50 1,166,000 1937 201.,000 5.10 1,045,000 1938 266,000 5.70 l, 479,000 1939 301,000 4.85 1,475,000 1940 340,000 5.30 l,802,000 1941 333,000 5.60 1,820,000 1942 363,000 7.30 2,631,000 1943 359,.000 8.40 3,0l 7,000 1944 304,000 7.40 . 2,248,000 Souroei
l. OKLAHOMA
TABLE NO.~ 126 STOCK SHEEP Ui OKLAIKll.A 1891 - 1944
u. S. Depar1aent of Agrioul 'bl.re
PLANNING .AND RISOURCIS IO.ARD

,------------ DIVISION
40 126 0 ..orQES H OKLJJtLU1891 -
Year : 1umber on r arms - Jan. l Value er Head i . Total Value :i . ,000 35.00 ,,625,000 1892 : 85,000 : 33.00 2,805,000 1893 : 145,00d : 31.00 4,495,000 1894 : - 350,000 28.00 9,800,000 1895 400,000 : 25.00 10,000,000 1896 420,000 :.: 3.00 : 9,660,000 1897 449,000 22.00 9,878,000 1898 : 460,000 21.00 9,660,000 1899 480,000 22.00 10,560,000 1900 : 501,000 : 2 4.00 12,024,000 1901 5,5,000 : 29.00 15,225,000 1902 580,000 35.00 20,SOO,OOO 1903 : 610,000 : 42.00 25,620,000 1904 640,000 47.00 30,0W ,OOO 1905 660,000 : 49.00 32,340,000 1906 680,000 : 62.00 42,160,000 1907 700,000 72.00 50, 400,000 1908 715,000 : 73.00 52,195,000 190~ 730,000 73.00 53,290,000 1910 745,000 81.00 60,345,000 1911 765,000 86.00 65,790,000 1912 780,000 76.00 59,28 0,000 1913 785,000 84.00 65,940,000 1914 790,000 85.00 67,150,000 1915 785,000 81.00 63,565,000 1916 775,000 : 85.00 65,875,000 1917 ; 770,000 86.00 66,220,000 1918 : 760,000 94.00 71,440,000 1919 750,000 83.00 62,250,000 1920 738,000 : 84.00 61,904,000 1921 720,000 : 64.00 46,131,000 1922 705,000 46.00 32,340,000 1923 680,000 41.00 ~8,183,000 1924 640.000 ::.5.00 22,516,000 1925 614,000 41.00 25,174,000 1926 593,000 37.00 21,941,000 1927 570,000 ::..5.00 19,950,000 1928 548,000 38.0C 20,8,4,000 1929 527,000 39.00 20,553,000 1930 507,000 39.00 19,773,000 1931 461,000 : 33.00 15,213,000 1932 436,000 : 30.00 13,080,000 1933 416,000 33.00 13,726,000 1934 421,000 b3.00 22,105,000 1935 426,000 57.00 : 24,288,000 1936 426,000 71.00 30,175,000 1937 417,000 70.00 29,145,000 1938 400,000 62.00 24,969,000 1939 379 ,ooo 56.00 ~1,982,000 1940 362,000 53.0C 19,186,000 1941 355,000 46.0(,- 16,2e3,ooo 1942 344,000 43.00 14,C22,000 1943 ~51,000 60.00 zl, 139,000 1944 : 351,000 46.00 16,152,000
OF INDUSTRIAL AND STATE PLANNING------------, TABLE NO.
1944
0 OKLAHOMA
AND
Source: U. s. Lepe.rtment of Atricul ture
PLANNING
RESOURCES BOARD

DIVISION OF INDUSTRIAL AND STATE PLANNING r
127
Year 1Number on t:'arms - Jan. Is Vaiue per Beaa I 'l'o~e.I Value !891 : 18,000 44.00 792,000 1892 30,000 42,00 I 1,260,000 1893 s 50,000 40.00 2,000,000 1894 : 60,000 : 36.00 2,160,000 1896 65,000 33.00 2,145,000 1896 72,000 : 30,,00 2,160,000 1897 I 70.,000 28.00 2,240,000 1898 88,000 27.00 : 2,736,000 1899 98,000 28.00 2,744,000 1900 105,000 I 37.00 3,885,000 1901 110,000 47.00 5,170,000 1902 115,000 54.00 6,210,000 1903 : 122,000 63.00 7,686,000 1904 I 130,000 : 63.00 8,190,000 1905 150,000 74.00 11,100,000 1906 165,000 83.00 13,695,000 1907 I 185,000 98.00 18,130,000 1908 200,000 . . 96.00 19,200,000 1909 220,000 96.00 21,120,000 1910 250,000 105.00 2s,eso,ooo 1911 : 270,000 113.00 ~0,510,000 1912 272,000 . . 98.00 26,656,000 ( 1913 280,000 107.00 t 29,960,000 1914 290,000 104.00 : 30,160,000 1915 300,000 96.00 : 28,800,000 1916 305,000 : 98.00 29,890,000 1917 310,000 104.00 32,240,000 1918 317,000 114.00 : 36,138,000 1919 325,000 I 110.00 35,750,000 1920 : 337,000 I 120.00 40,521,000 1921 337,000 90.00 30,355,000 1922 350,000 67.00 I 23,434,QQQ 1923 360,000 60.00 21,736,000 1924 ; 360,000 66.00 20,104,000 1926 369,000 : 61.00 : 22,509,000 1926 360,000 : 57.00 20,520,000 1927 350,000 . . 51.00 17,850,000 1928 340.,000 52.00 17,680.,000 1929 330.,000 : 68.00 19,140.,000 1930 318,000 : 59.00 I 18,762,000 1931 305,000 47.00 14,335,000 1932 290,000 : 43.00 I 12,470,000 1933 275,000 45.00 12,375,000 1934 268,000 71.00 : 18.,414.,000 1935 247,000 79.00 19,544,000 1936 235,000 96.00 22,603,000 1937 198,000 96.00 19,008.,000 1938 166.,000 90.00 14,850,000 1939 167.,000 = 82.00 12,874,000 L
TAF!LE no. 41
MULES IN OKLAHOMA 'I89l. - 1944
OKLAHOMA PLANNING AND RESOURCES BOARD ________.
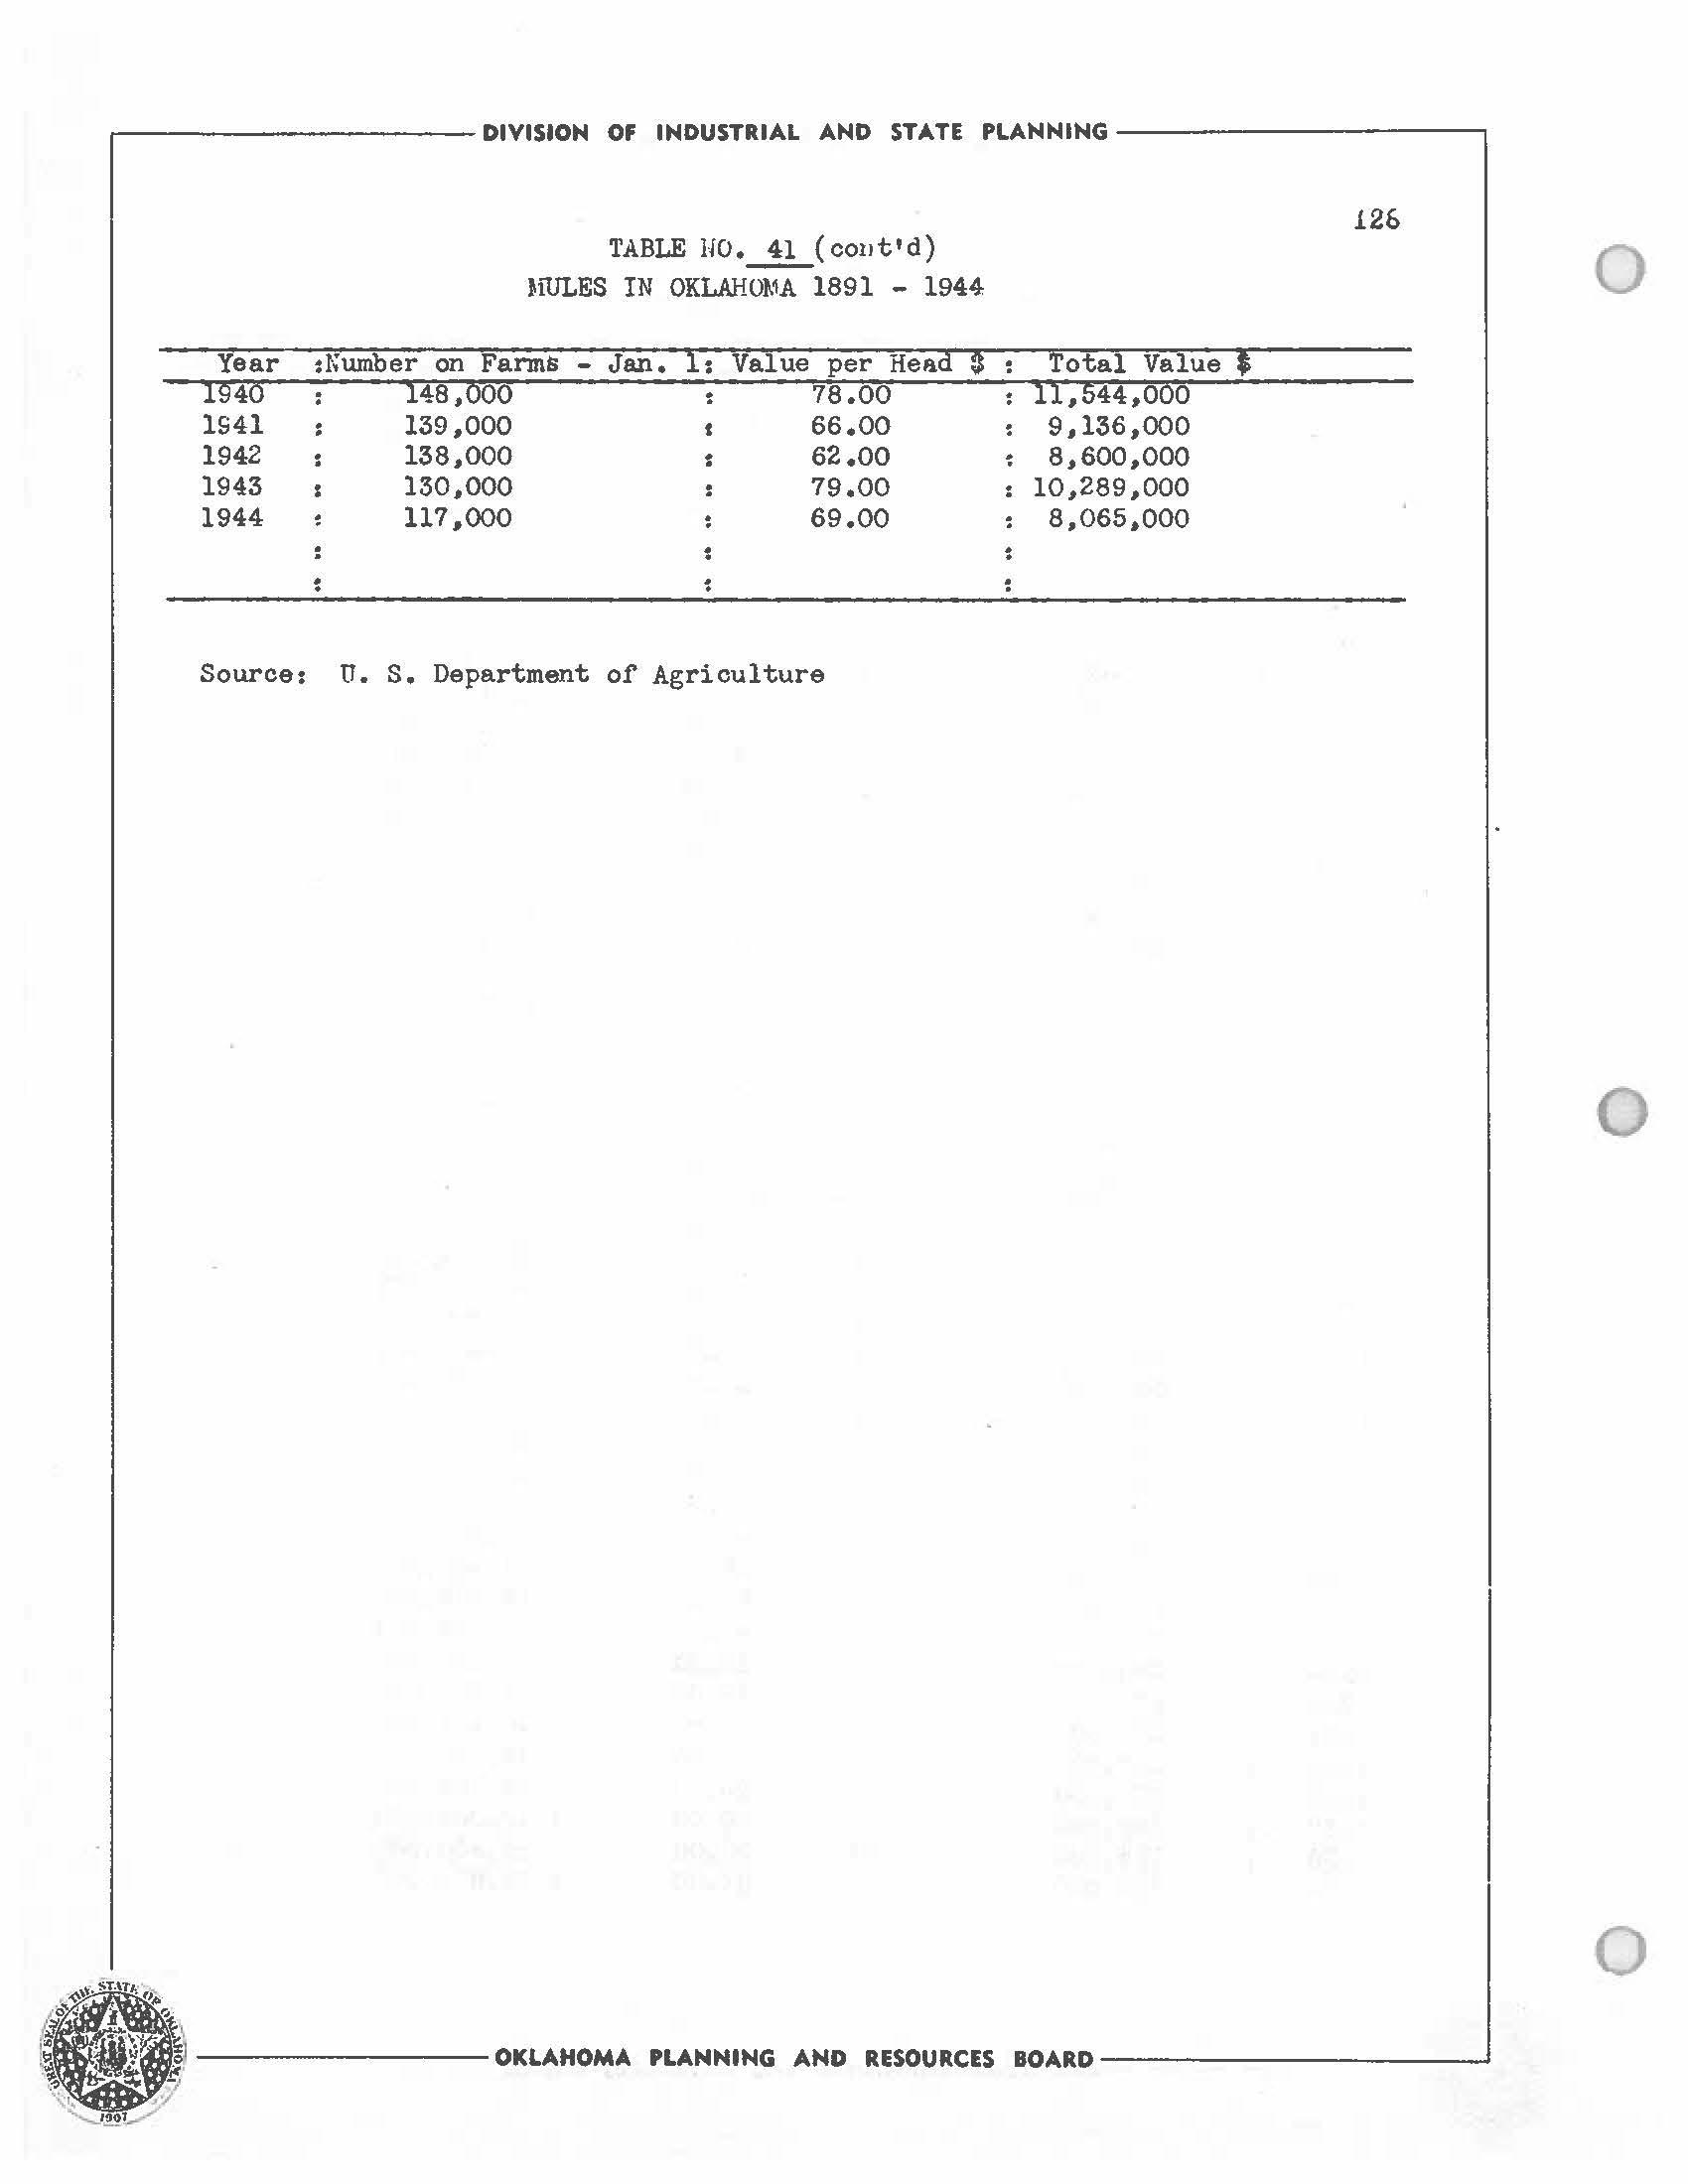
,-----------DIVISION OF INDUSTRIAL AND STATE PLANNING-------------, ~T \l' Year l940 1941 1942 1943 1944 TABLE
JiULES IN OKLAHOMA 1891 - 1944 :t;umber on Farms - Jan. l: Value per Head $ 148,000 78.00 139,000 66.00 138,000 : 62.00 130,000 79.00 117,000 69.00 Source: U. s. Department or Agriculture 126 Total Value • 11,544,ooo 9,136,000 8,600,000 10,289,000 8,065,000 I, i~ ) ---------OKLAHOMA PLANNING AND RESOURCES BOARD------------' • 0 0 0
HO
•....!L( COIi t Id)
The production of poultry plays an importen-c part in the program of the Oklah,oma farmer by increasing his purchasing power ~d stabilizing income. 1''igur• No.~ ahowa the distribution of· chickens 1940. In ieneral Oklahoma is well ~dapted to poultry production. lhe principal obstacle to gooCI poultry production is the hot swnmer weather which tends to check egg produ ~tion, deore~se egg size and siow growth.
The number or normal laying hens on i'arms at present i8 slightly ' less than the number on !'arms in the early twenties.
The produotiun and va1ue 01' chickt:ins by years is given in Table No. 43 •
Produo tion
Through the development of better hens ana improved f·eeding pratice the egg production per hen has been praotioally doublea. The weight of eggs has increased approxim~tely 5 pounds per case. ~gg production by years 1s given in '.l'&ble No.~.
Hatchery Prouuction I
!11 1923 there were no hatcheries in the istate. As of" January 1946 there ~ere approximately 280 oomme~cial h&toheries with a capacity of 11.000,000, eggs per setting. A reduotion of ohiok mortality from 257~ to sro hb.s resulted f'rom the adoption of' en improved testing progrem.
lr.arketa
The amount 01' u ve poultry, shipped out oi' Oklahoma htl.s decreased while the emount 01· dressed poultry shipped out has incree.seti. '.l'he . prinoipal market hus changed from the ea s t to the southeast and south-
C .------------DIVISION OF INDUSTRIAL AND STATE PLANNING-------------, 129
POULTRi
•---------OKLAHOMA PLANNING AND RESOURCES BOARD----- -----" 1901
west. The prociuction of broilers has increased, mainly in metropolitan areas.
The establishment oi' a large number of freezing lockers has increased the number of small kil j ing &Ild dressi?li, pl&Ilts with a corresponding increase in local poultry consumption. Coma,ercial dressing plants number 17 and one plant is canning ahicken and 5 plants dry eggs.
Table No • ..l!__giTes poultry sales data for 1944.
'furkeys
Oklahoma turkey production is now 1n a transition period. 1n past years the principal producing area v.-as the ud I<iver Valley. current production is well ~catterea over the state with some flocks numbering as high as 10.000.
A great opportunity exists for Oklahoma to expand the production of early turkey eggs. Some hatoheries are specializing in the incubai:ion or 'turkey tiggs.
Table No.~gives turkey proauction by years.
:OUoks
Duck pr-eduction has been a neglected field in uklahoma. Conditions unsatisfe,.ctol'y ror chickens will in many oases support ducks ~n d they are also good eg g producers. Opportunity exists ~no some interest i~ being sho~n in COJ1U11ercia~ duck r~rms.
.------------ DIVISION OF INDUSTRIAL AND STATE PLANNING----------~ 130
OKLAHOMA PLANNING AND RESOURCES BOARD ---------------J 0 0 0
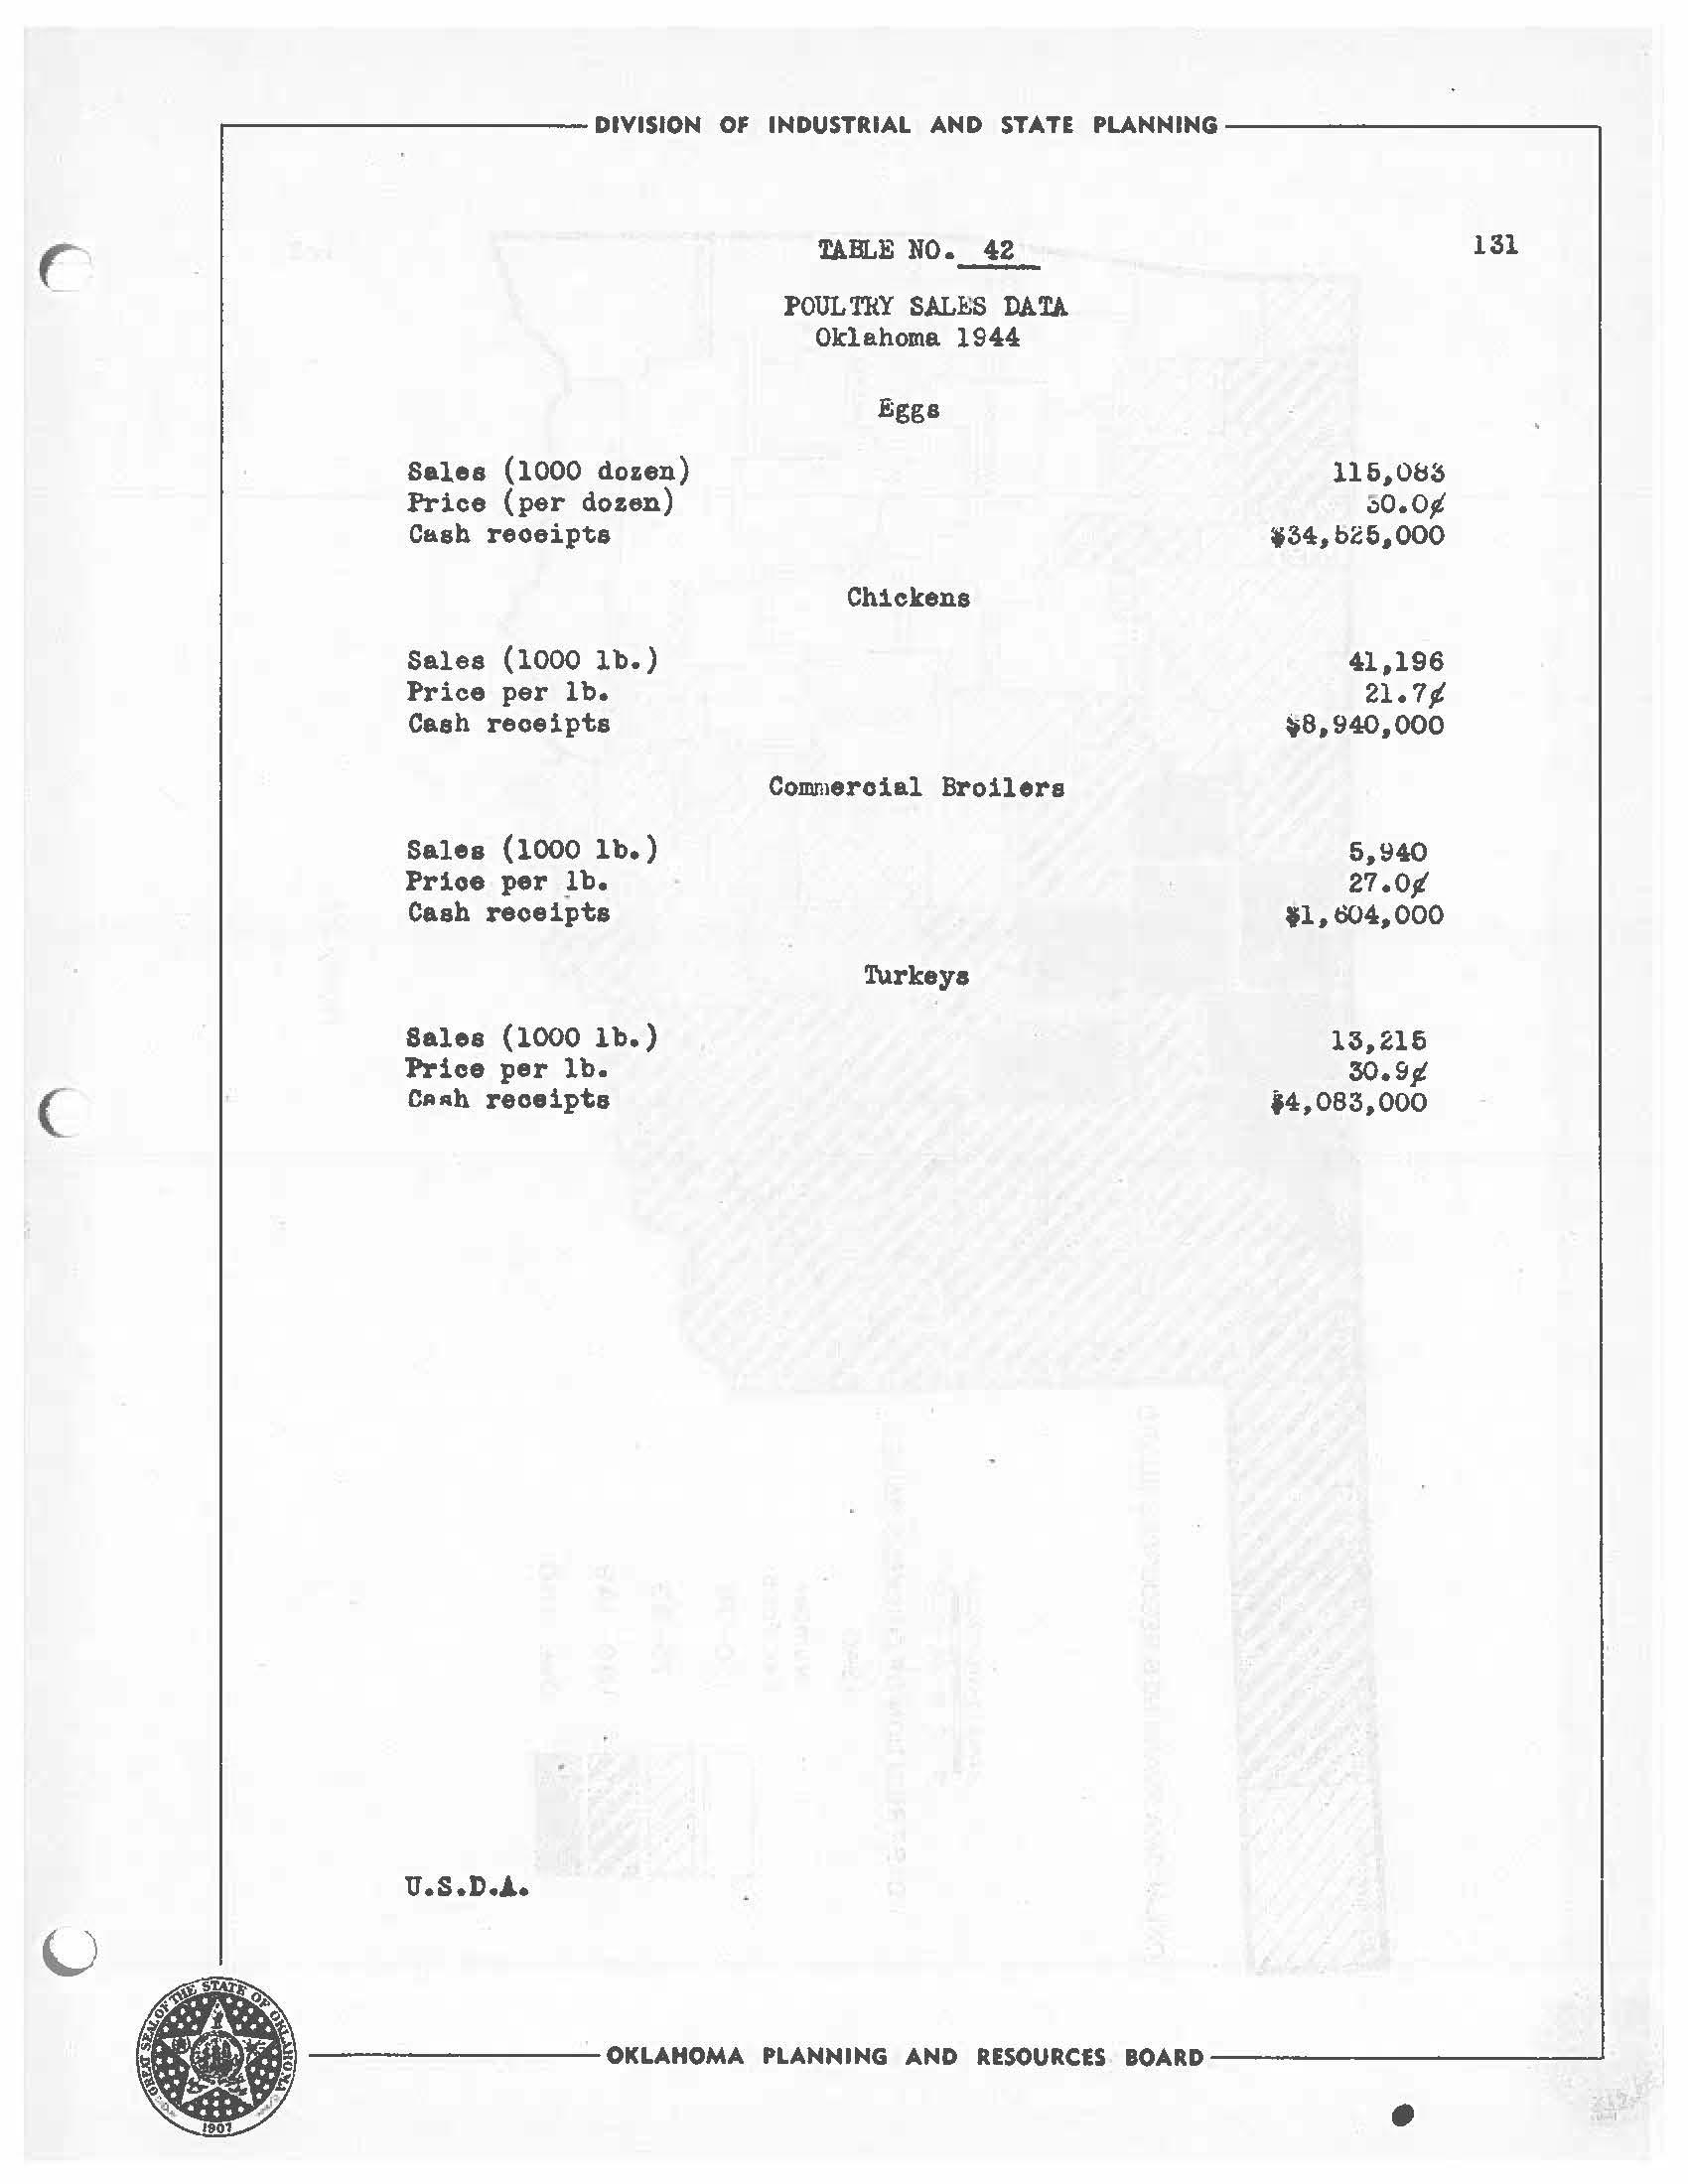
,----------- DIVISION Of INDUSTRIAL AND STATE PLANNING-----------. ,-- TABLE NO. 42 131POULTRY SALBS DATA Oklahoma 1944 Eggs Sales (1000 dozen) 116,.0fj~ Price (per dozen) :S 0.O¢ Cash reoeipta ¥34,.b26.00O Chickens Sales (1000 lb.) 41,196 Price per lb. 21.1; Cash receipts ~8,940,000 Commercial Broilers Sales (1000 lb.) s.~40 Prioe per lb. 27.0/ Cash reoeipta ,1.004,.000 Turkeys Sales (1000 lb.) 13,.216 Price per lb. 30.fJ.¢ C CAAh receipts f4,0B3,.000 u.s.D •.1.. u --------OKLAHOMA PLANNING AND RESOURC£S BOARD------------' •

0 :,ii: OKLAHOMA Pl.ANNING 8 RESOURCES BOARD :z: i .,, rz ! SCA~E-STArUTE liltUS z w ti) 0 ,o 20 ~o to so DISTRIBUTION OF CHICKENS RAISED z C, ,., 1940 Ill f> Number C: Per Farm ,., n I I "' 50-74 ... .. 111 W//21 0 75-99 ,., C, 100- 149 .> I - Over 150 o·
0 ..... (,-: (\) 0 C, < ;;; 0 :Z:· 0 ... z C, C ... -I ,., r:z: C, en -I -I Ill .,, z z z C,
Figure 27.
TABLE NO. 43
CHICKF.:NS PRODl 1CF,D rn OKLAJIOMA
Souroes U. s. Department of Agriculture
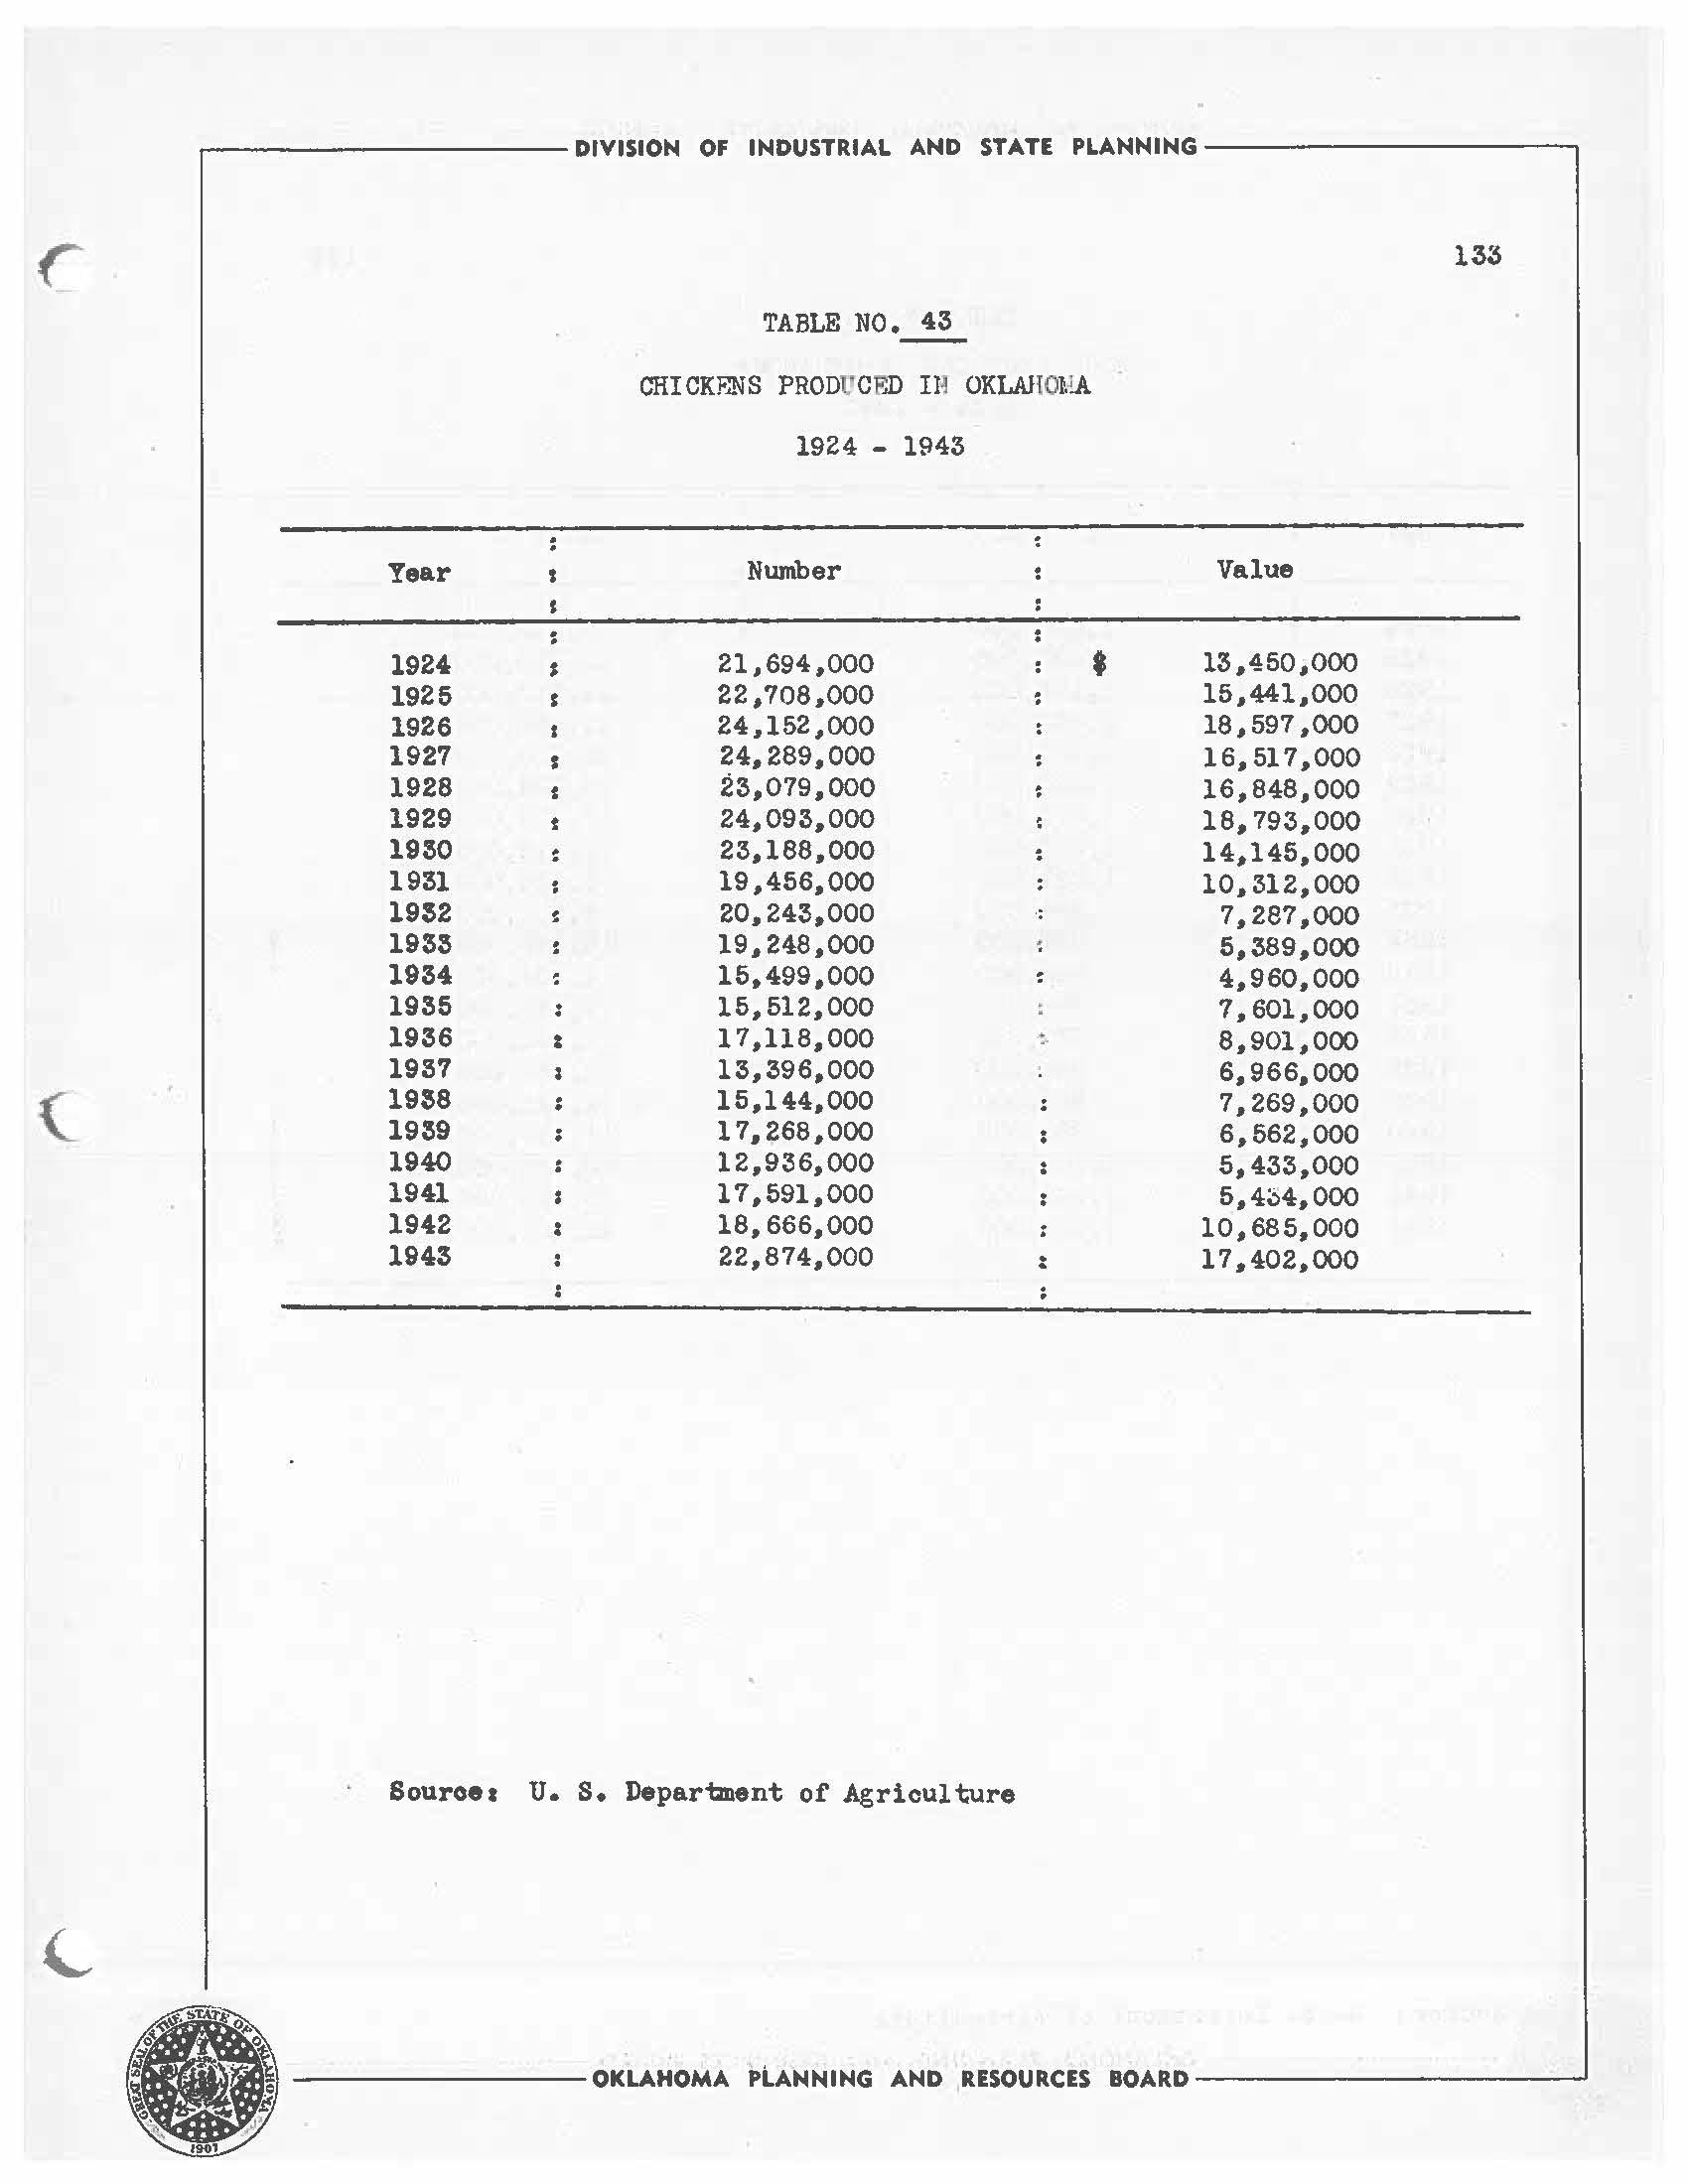
(_ ...-----------DIVISION OF INDUSTRIAL AND STATE PLANNING------------, Year 1924 $ 1925 ' 1926 1927 s 1928 1929 t 1930 1931 1932 1933 1934 1935 1936 : 1937 1938 : 1939 1940 1941 1942 1943
1924 - 1943 Number 21,694,000 22,708,000 24,152,000 24,289,000 23,079,000 24,093,000 23,188,000 19,456,000 20,243,000 19.248,000 15,499,000 16,512,000 17,118,000 !13,396,000 15,144,000 17,268,000 12,936,000 17,591,000 18,666,000 22,874,000 :
133
• 13,450,000 15,441,000 18,597,000 16,517,000 16,848,000 18,793,000 14,145,000 10. 312,000 7,287,000 5,389,000 4,960,000 7,601,000 8,901,000 6,966,000 7,269,000 6,562,000 5,433,000 5,4~4,000 10,685,000 17,402,000
Value
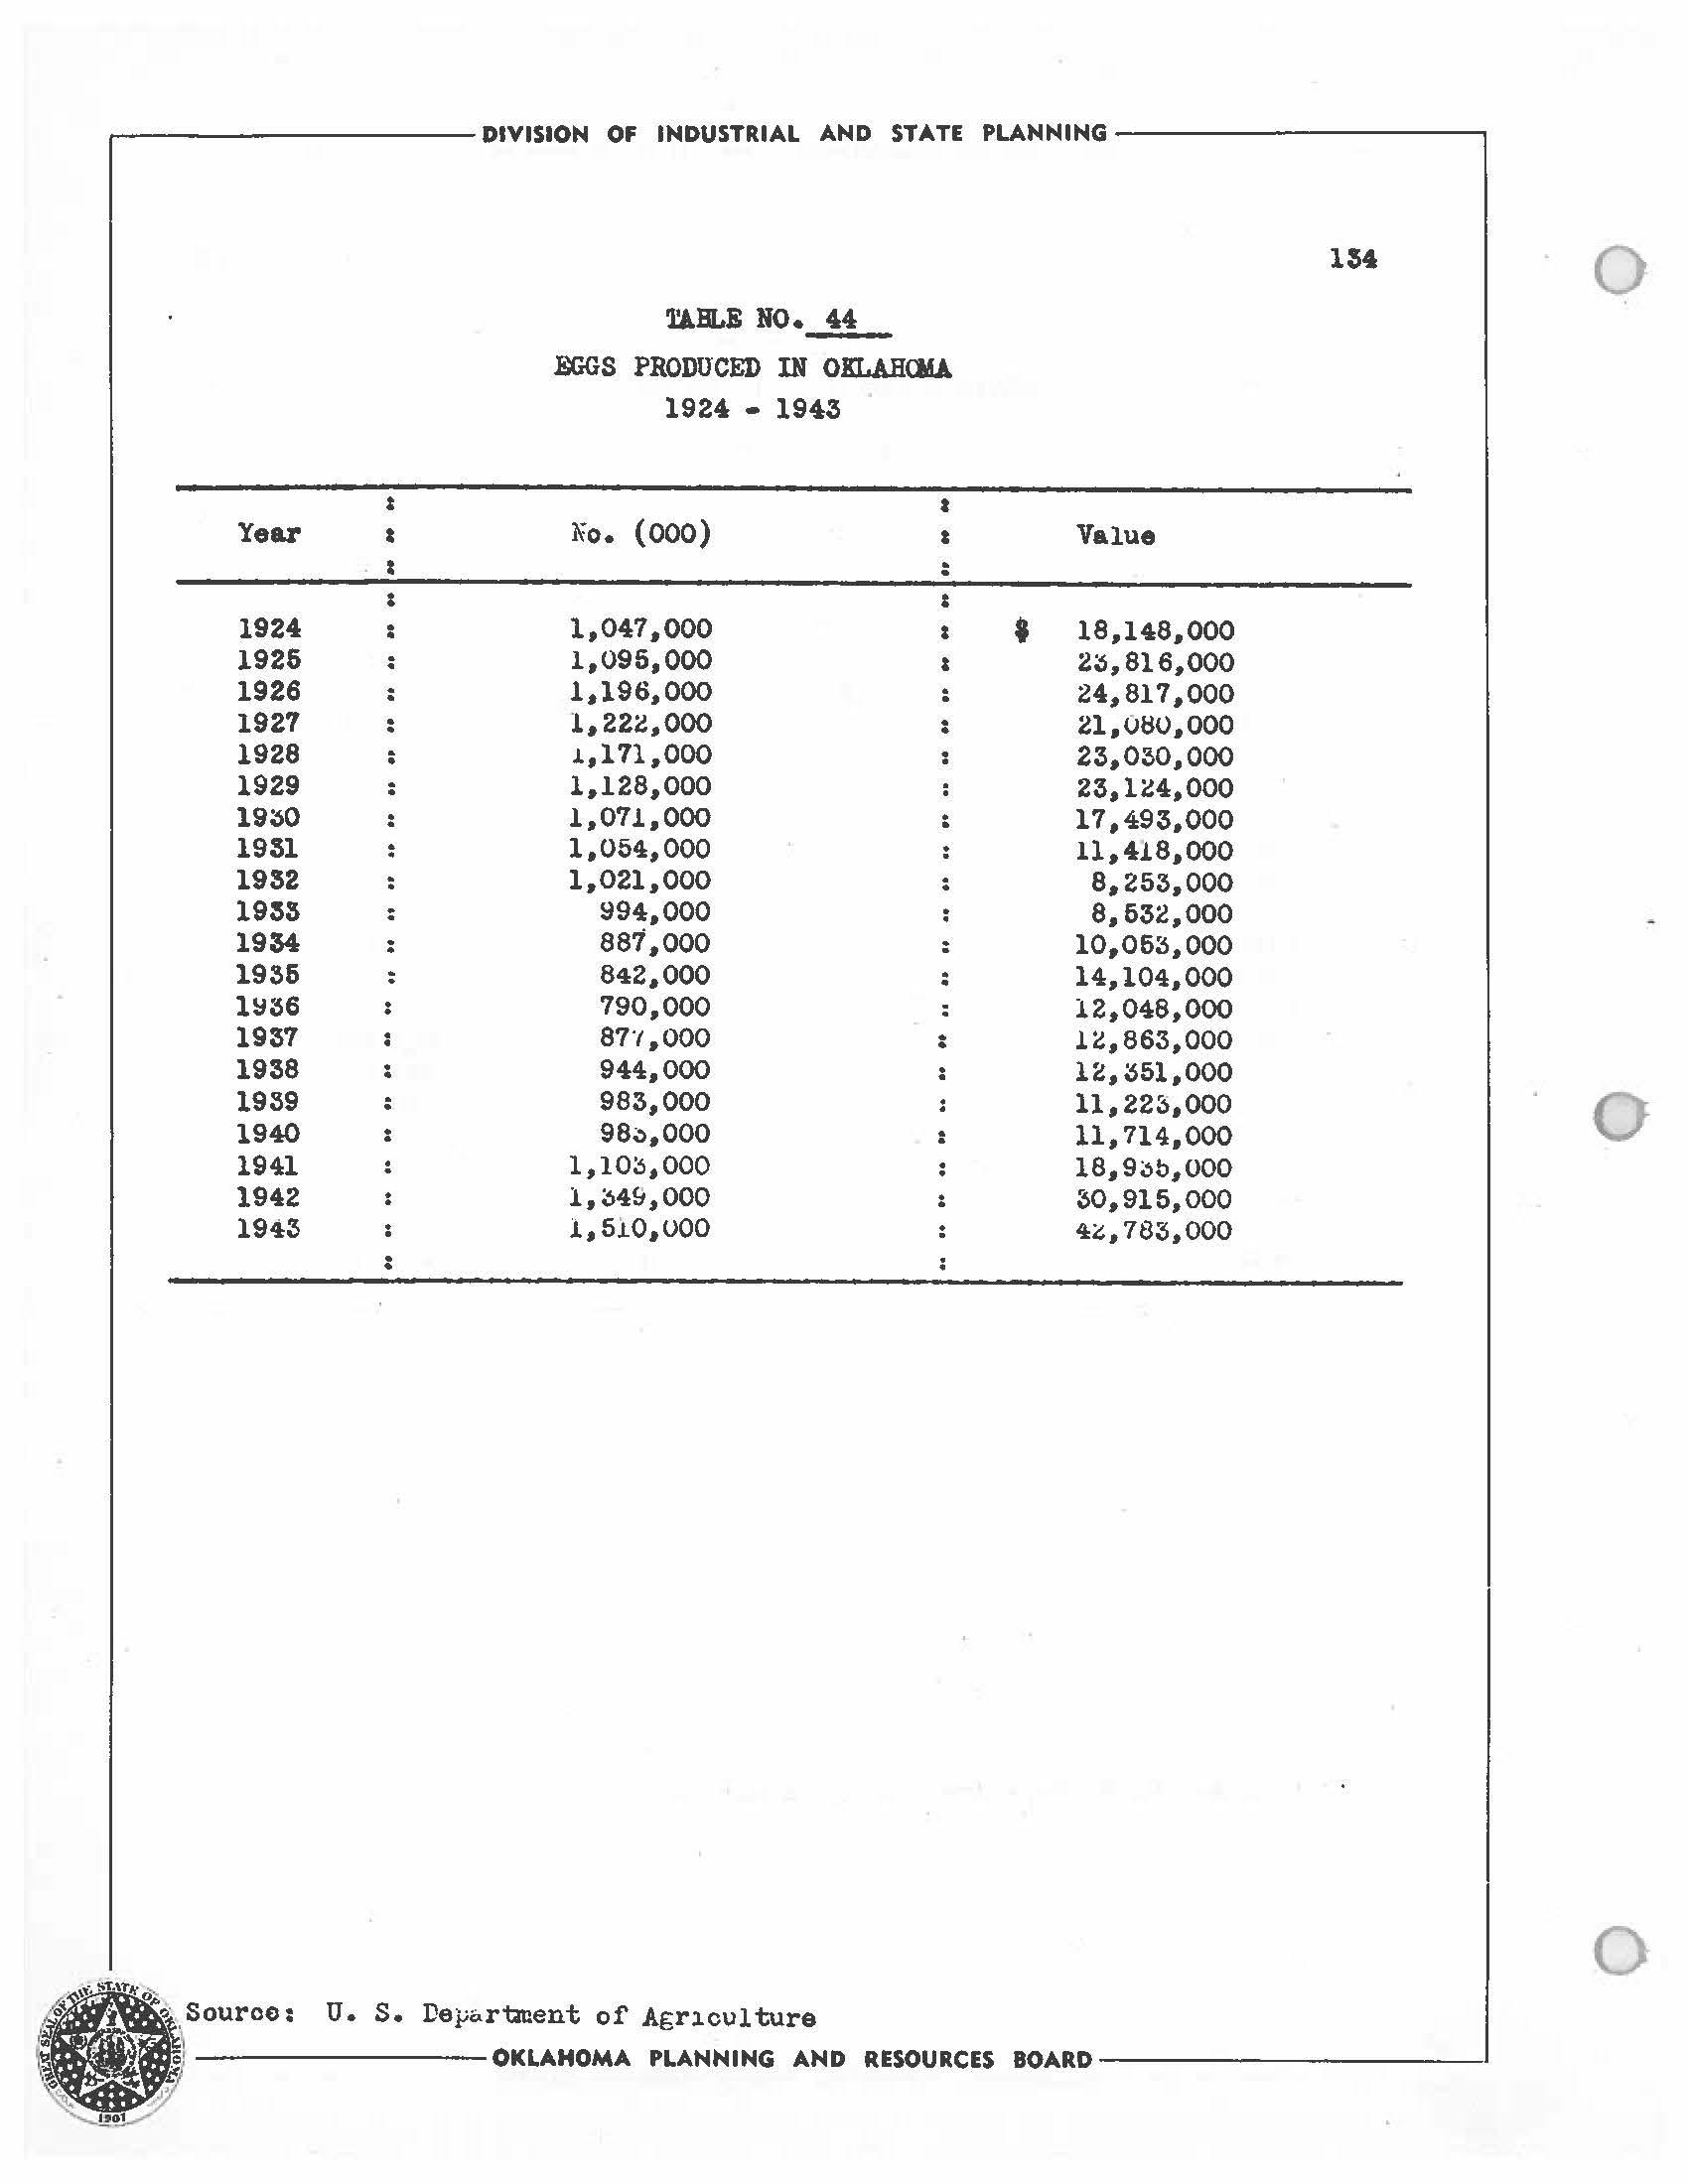
.------------DIVISION OF INDUSTRIAL AND STATE PLANNING------------, 1$4
HO. 44 EGGS PRODUCED IN OKLAHCMA 1924 • 1943 : a Year a Ko. (000) I Value . . : : 1924 1,047,000 * • 18,148,,000 1925 : 1,095,000 a 23,816,000 1926 1,,196,000 24,,817,000 1927 1,222,,000 : 21,,01.iO,,OOO 1928 .1.,l 71 ,,000 23,030,000 1929 1,128,000 23,124,000 1930 1,071,000 17,493,,000 1931 1,,054,000 11,418,000 1952 1,,021,,000 8,253,,000 1953 : 994,000 8,632,000 1934 881,000 10,063,000 1935 842,,000 . 14,104,000 . 1~36 790,000 12,048,000 1937 s1·, ,,ooo : 1i,863,000 1938 944,000 H,~51,000 1939 983,000 11,22:-s,ooo 1940 98;),000 ll, 714,000 1941 1,10~,ooo l8,9~b,OOO 1942 l,M9,000 30,915,000 1943 l,5 i.O,,UOO 4~ , 783,000 : • ST. Source: U.S. De~artment or Agriculture ;1111..>lll'llF.l _ OKLAHOMA PLANNING AND RESOURCES BOARD------- -----' ~ · _!!0 1 0 0 0
TAa:..E
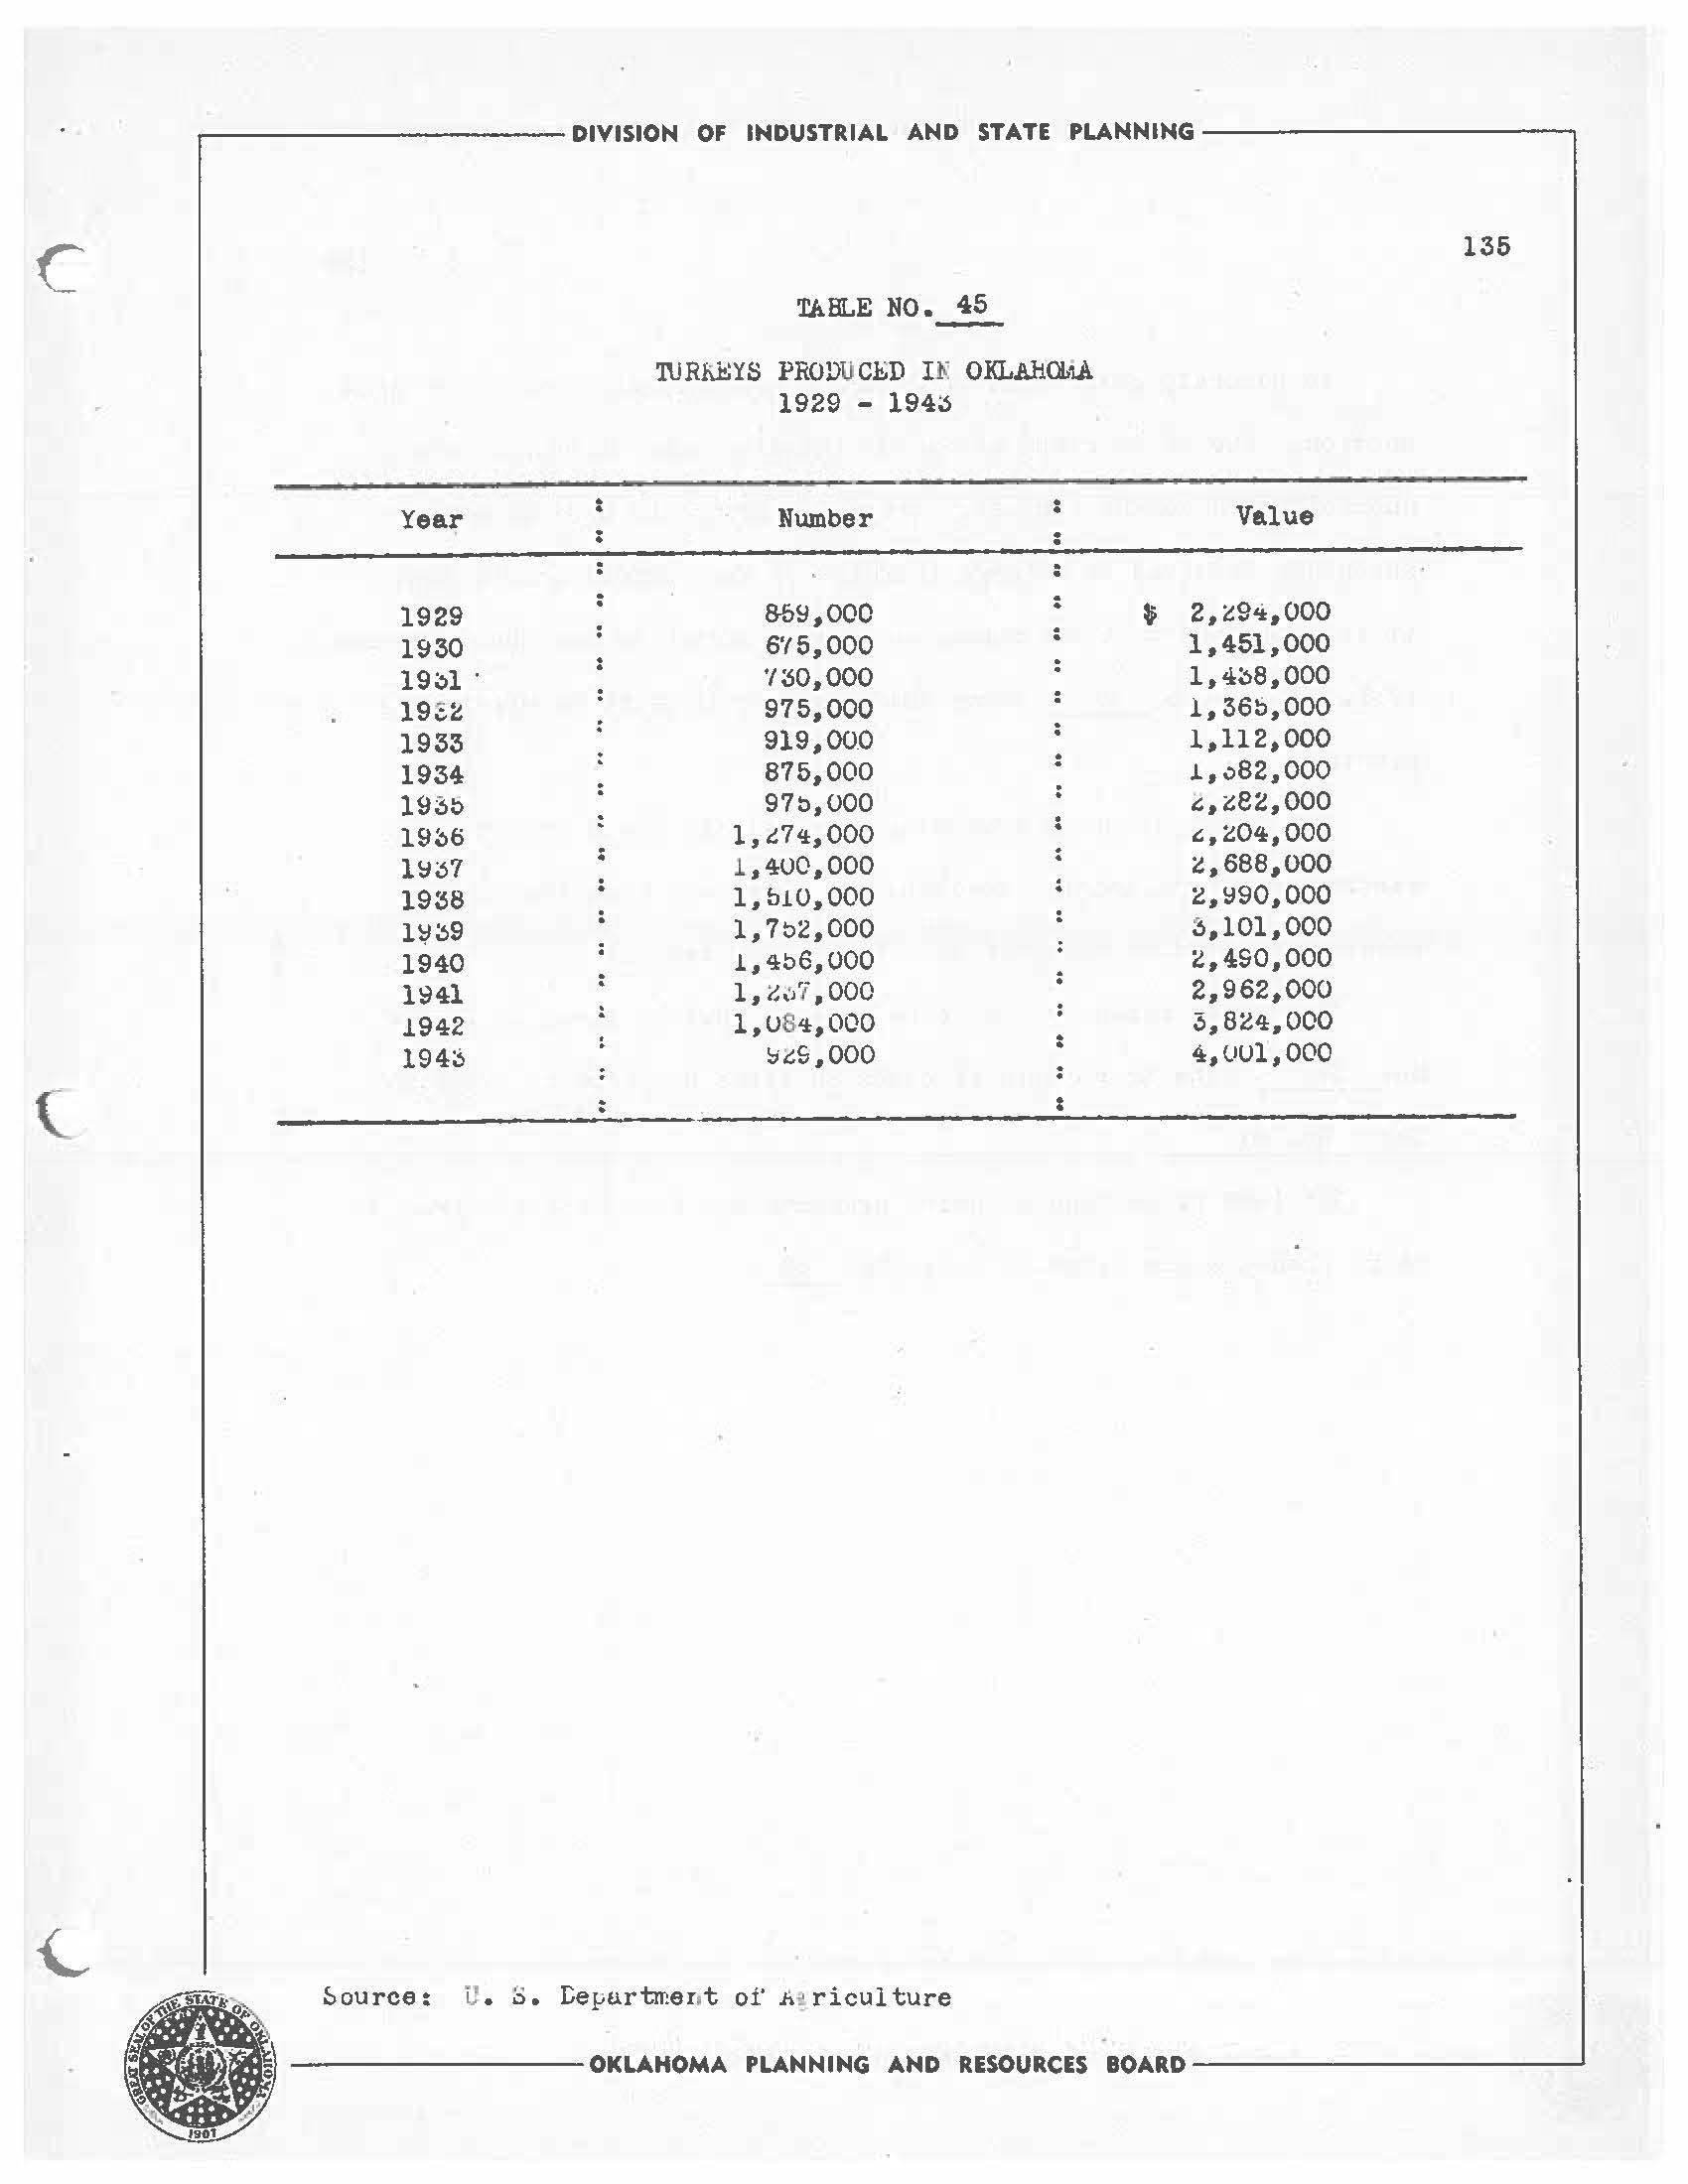
C ( -----------DIVISIOM OF IMDUSTRIAL AND STATE PLANMING ------------. Year 1929 1930 19::il · 19.;~ 1933 1934 1930 19~6 1~;57 1938 ll;/~9 1940 1941 1942 194~
'.NRl'J!:YS PRODU C1D H OI<L.AliCl,tA 1929 - 194~ Number : 8-f,~,ooc : 6'/5,000 '/:S0,000 975,000 919,000 875,000 970,000 l,G74,000 J. ,400,000 l,b!0,000 1,702,000 1,406,000 l, '1,,,i , 000 l,U8 4,000 ~.cS,000 ~ource: U. S. I:e:purtme n t oi' f. ~ ricul ture 135 Value t& 2,i::94,000 1,451,000 l,4~8,000 l,36b,00O 1,112,000 1,v82,000 c:,t82,000 '• ,04, 000 ;!,688,000 z,~so,ooo ~,101,000 ,,490,000 2,962,000 3,824,000 4,uul,OOO ---------OKLAHOMA PLAMMING AMD RESOURCES BOARD-------------'
TABLE NO. 45
VA1.:::t1NG
In gencr&.l, com;iti'-DS in Okl&.homa are a vorao1e tor c.airy production. Cue to m1.li u.ry and ns.ve.1 insta.1la taons tr.ere he.s been an unpreciden'ted ciem&na tcr c.a1ry rrocucts our1n6 'the last i'ive years which has reGul ted in a lc.rge incree..se or the number o!' milk COY16. It is estimated tl:at the ntlllloer or cheese re.c'tories has doubled sinoe 1941. Fip;ure No. 28 plants.
shows distr1Lu'tion of dairy m&nui'acturing
The principal dairy proaucinf. aret..s 01· the ste:te inciude the central a.nc north cer;tral ree,ions, ana l'ulsa ana 1 uskogee county areas. The southwest corner is a fair ctairy region.
The trend in numJer a.na value 01 mi1k cows is shov.n on figure No. 37. The to ,;;al mi1K pro<!uced on ranns by years is given in Table No. 4"/ • ----
Thr 1~44 prouuo'tion or aairy prooucts a.nc. casi1 1 ece ::. p;s from aa1ry p·oaucts l.l.re t;iven in Taole No. 46 •
,------------ DIVISION OF INDUSTRIAL AND STATE PLANNING-------------, 136
---------OKLAHOMA PLANNING AND RESOURCES BOAR D _____, 0 0 0
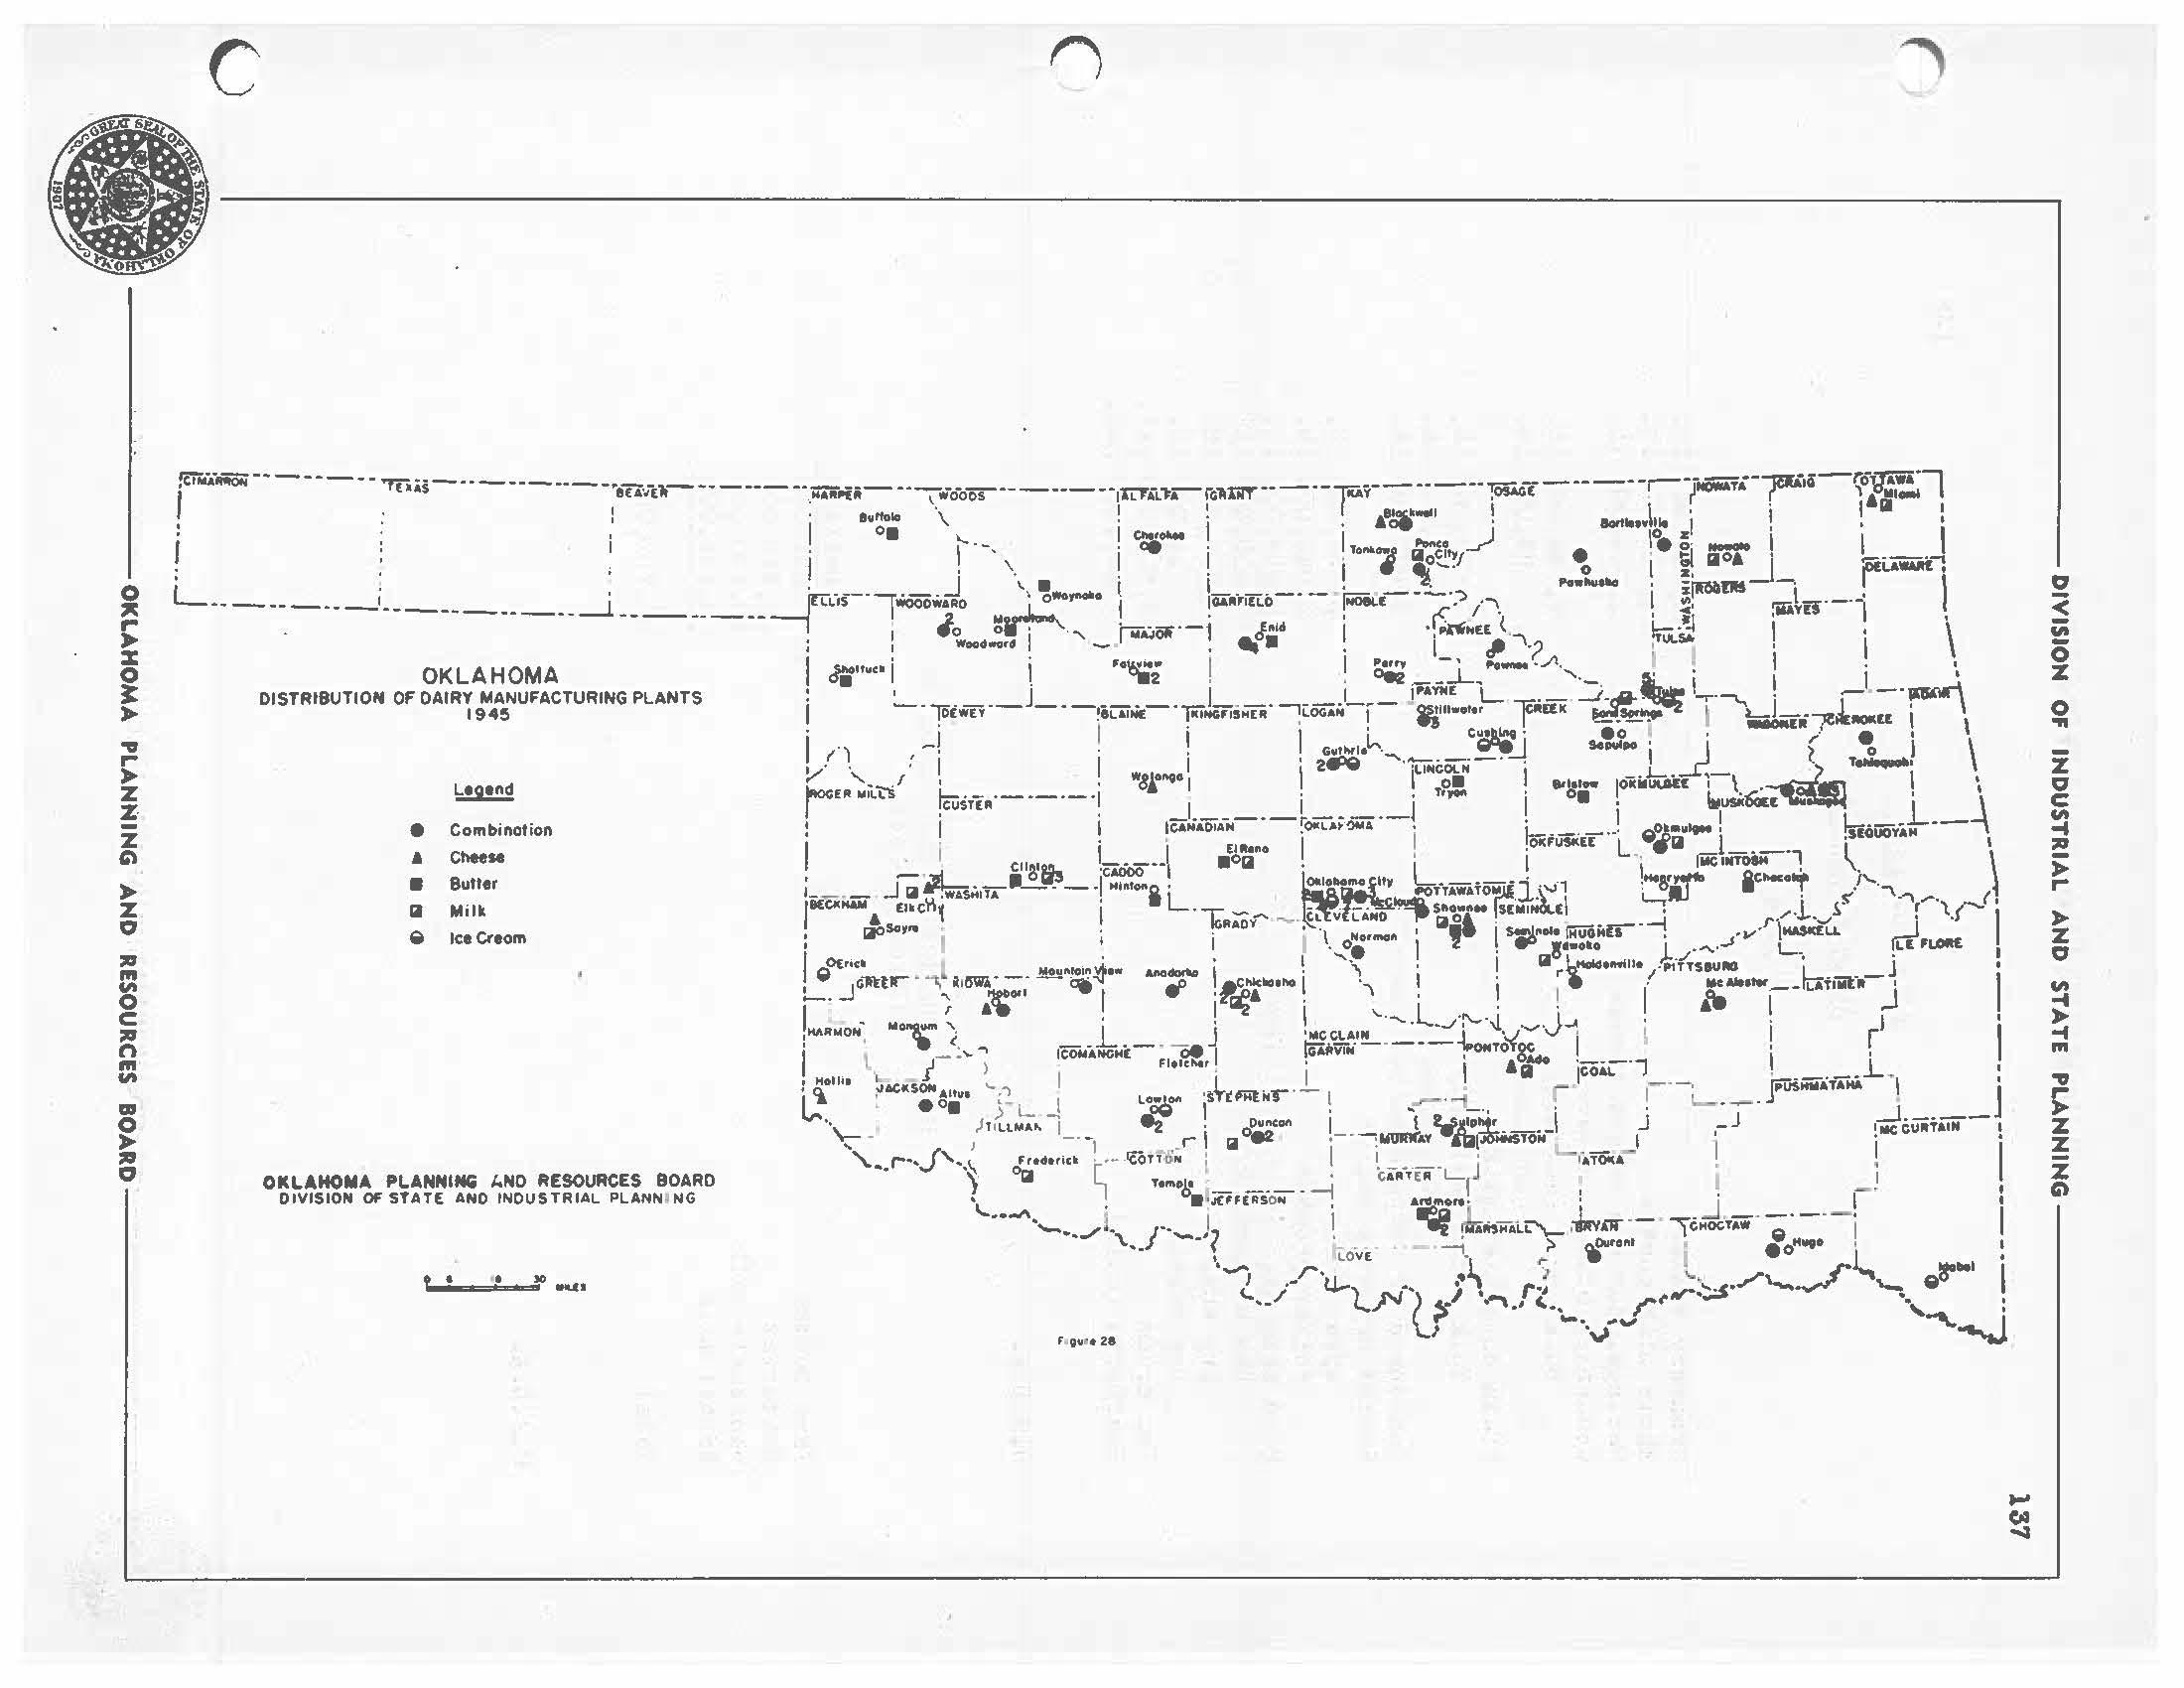
0 % 0 .,, rz % z G\ z 0 "' r; C n "' "' m 0 C, C I""'; l lei"...-.;;;;;;;---------··--·-------- -----·- ------illir-ro•"fiiii·7 I ' r(l&S .,.1£i;,l'Jt-•------·,iwi~ii-"•t•-0-00$"--• -•-1l:rJ'.('L't~rGll~-----T-ii,y-----••;oii.G( r- ,.,_TA (' - lu ,,ts~,~ I • • ,.,,. .\ f ""'-'""'' I I . 1 I II ' . ' I • . .109 ' llo I I ' .__ I I I 10 ., ' \ 1 • 1 ··. ·.,. · , " ~,,,__,,, • • !!i - ! I ; . ' I . \ I ! i • .;_~-' o I t 110& _j ru~7 L ' ' . ··-· ___ J \ • { I _______ • -·-·-:) Pow..... i(ll&!lllt ~I ' I ··----·--'---------·----1-._-··-----r"'s 7wooowuo ,_ I !,i,,ori&LO F-• .• /'. ! i ' :a;.vu·-·1 , • • I lo oi":I·--," j",i"·o1o·-1 J:••"' I .~ u t , i..._J I • \ OKLAHOMA DISTRIBUTION OF DAIRY MANUFACTURING PLANTS 1945 • .I • II 'Legend Com bi notion Cheese Butter Milk lceCreom OIi.LAHOMA PLANNING I.NO RESOURCES BOARD DIVISION OF STATE ANO INDUSTRIAL PLANN I NG • • JO IM.H • I - • I .,, ? ' ' I c?.f"•"i j ••"-•"• I I ••,,. -, Po-·-" ..,_ ! ! I . . -.2 . . "W_ • ..L... ·- ~I I I • :.._ _____ J ________ ] _____ 1 ___ -1••""• L __ ..J_ ...----.... · - -· , I 7-rwu '•LA'"' v,,..,.,.,. ;LOGAN I fa"'".,.' "f"U• I ~,;""}l:J.-u I ·1 _J I i ] i,.. C".!Jl."'t ! , ,.· • ' \ ,·, • · G., ,. · lil"'e_j ....... I _) > 0 l \ 'I I '2~ -~----· C T-• v· ., r' 1 1 ••,.... 1 1L,NcOL• 1 .• .1-. ,- 1 • 1 oa I ., ,.. otc111U\.AH 1 \ ~·• ••Li:°s lcu;ffo-•-•-•J i • ,.,.. i ! li,us,ibo[[ ' · · _J. _____ r.-----l 1 1 , .L \ 1 1 1 ICA"•o••• ·"'"••· ,,.., . k.--· ___ . ffJ.•••, 'Uouo••• ---; i ; 1 ""... I ! ,Ol<Fl$l[ L .-11 j ____ i I Cll••a. .- • -·- • L I i fiie IIITOtM 1 '\ \ - • Oli'a, CAOOO i I • L ,..... _ _J li~w.&.$tt1n-~ - -·I M lltOtt OIIIONIMI Hy if'OfU,w,.fo111 ·j:....11 :"'&jif'48 aeti.•! !{,I'- ,.,,,.._.,1..c,, & mcllt j iL.~.-r ~ ·'• v~~$••,-•.. F.:·..,.l,I '7 ,...1......,.1.· r ·\r.l•] ' Iii" ,.. '1 i ·1 AO • ·1 ' Iii I s...1 ,. liluiitu·-! ,-v·r\-u. I 0. 1 , _,, g••••• I • ...._.- L.. (Li",LOH I r P'Cricll l MOul\frOill •• • ! ""- I Ii rn. 1;;·ftseu• • j • ,~_JG-.ttr ·, t1!!Wl,·-·-"ili-:d' -~la(;"""''""l ·\ I 1 r• l ,....,.,.. __ tifiiin-, I - "' l)tOO<I I • 't'd>A I I .Q,. J I . . .. ... ,-. · ! i " --- .l _,,.:----- · ·.... . ,. ! , :...."""" · ,; ' .L __ J ...c~•!!.._ __ .:.....-1..o.,'\<,....,..J _ '· i r, I I t _:-..., 1cou•NC•• oe I IG'u vi• , 10 I 1 • , , "°'"' · , J >._ I ""'"'' . i I •11 jco.r-·1 _ . __ .L . : '"' ~AGUON.,... ") ,.I--· r ·- I r I ' iplJS ATAH& I j I~ • - L I 1:•.. ,•""""" ..- •; 1.- - .J·I.,,, > . -· , ' . _] '•\- ) TILUm 7 ce:;.<"" I _ 1 "-.Jt'•"t. ___ _\ J ,-J •11ecuorw- 1 , • , -· -1 r \ 1,1 :WUllll'•• IQJ-'"" I • , ',,. _r·•.f'•,',,. ,,,•.,i.. , •- -'con <>• 1 I \ . __ J , L-,;.roi<•- 1 ! [ ) · °fil TOffiOO ..-•-- 4;&flT E: A L' _,I f \. _...,,, , - ,c,F[RSON A,;r'J'"' , j - •-•-•-' I ...._ __ _, l. 1.......J, 1 ""9f r&,..,.-.1.--..... ~nr -- 1 e.oc••• 1 j '\.,. i --1 ;> al'"'••• eo•..• ' I LOVE. - .r • I I • ·-, r, ~\ t ,. ./ .r" !P , I ... ;- u.-) ,,..,i·l j • r·• ..,.:~- '-.......,. 8"' ·,_,,. • c.- "'., "'·· r" ·, : r" -. ~.., ....__ I I -~ OVJ ,t 2• 0 ... 0 z 0 ... z g C: ;;111 rz C, ... -t -f '" .,, z z G\
'l:ABLE NO. 46
DAlrlY PttODUCTS Okl.tihoma 1944
Creamery Butter
Y4hole milk cheese
C~tr.e.ge, pot ana oak~rs cheeae
Conc1enstt<i milk (a ...ee~ned)
Bulk goods (~kimmed) ( unslnuuned)
Plain condensed milk
Bulk eoods (sKimmed) (unskimmea)
Condens~d or evaporated buttermilk:
Nont'at dry milk: solids
spray process
roller prooess
Pure skim milk i'oi rmimul fee<1
Dry buttermilk
Dry whey
lJry casein
Ice oream
Sherberts (milk)
Wholesale milk Retail milk
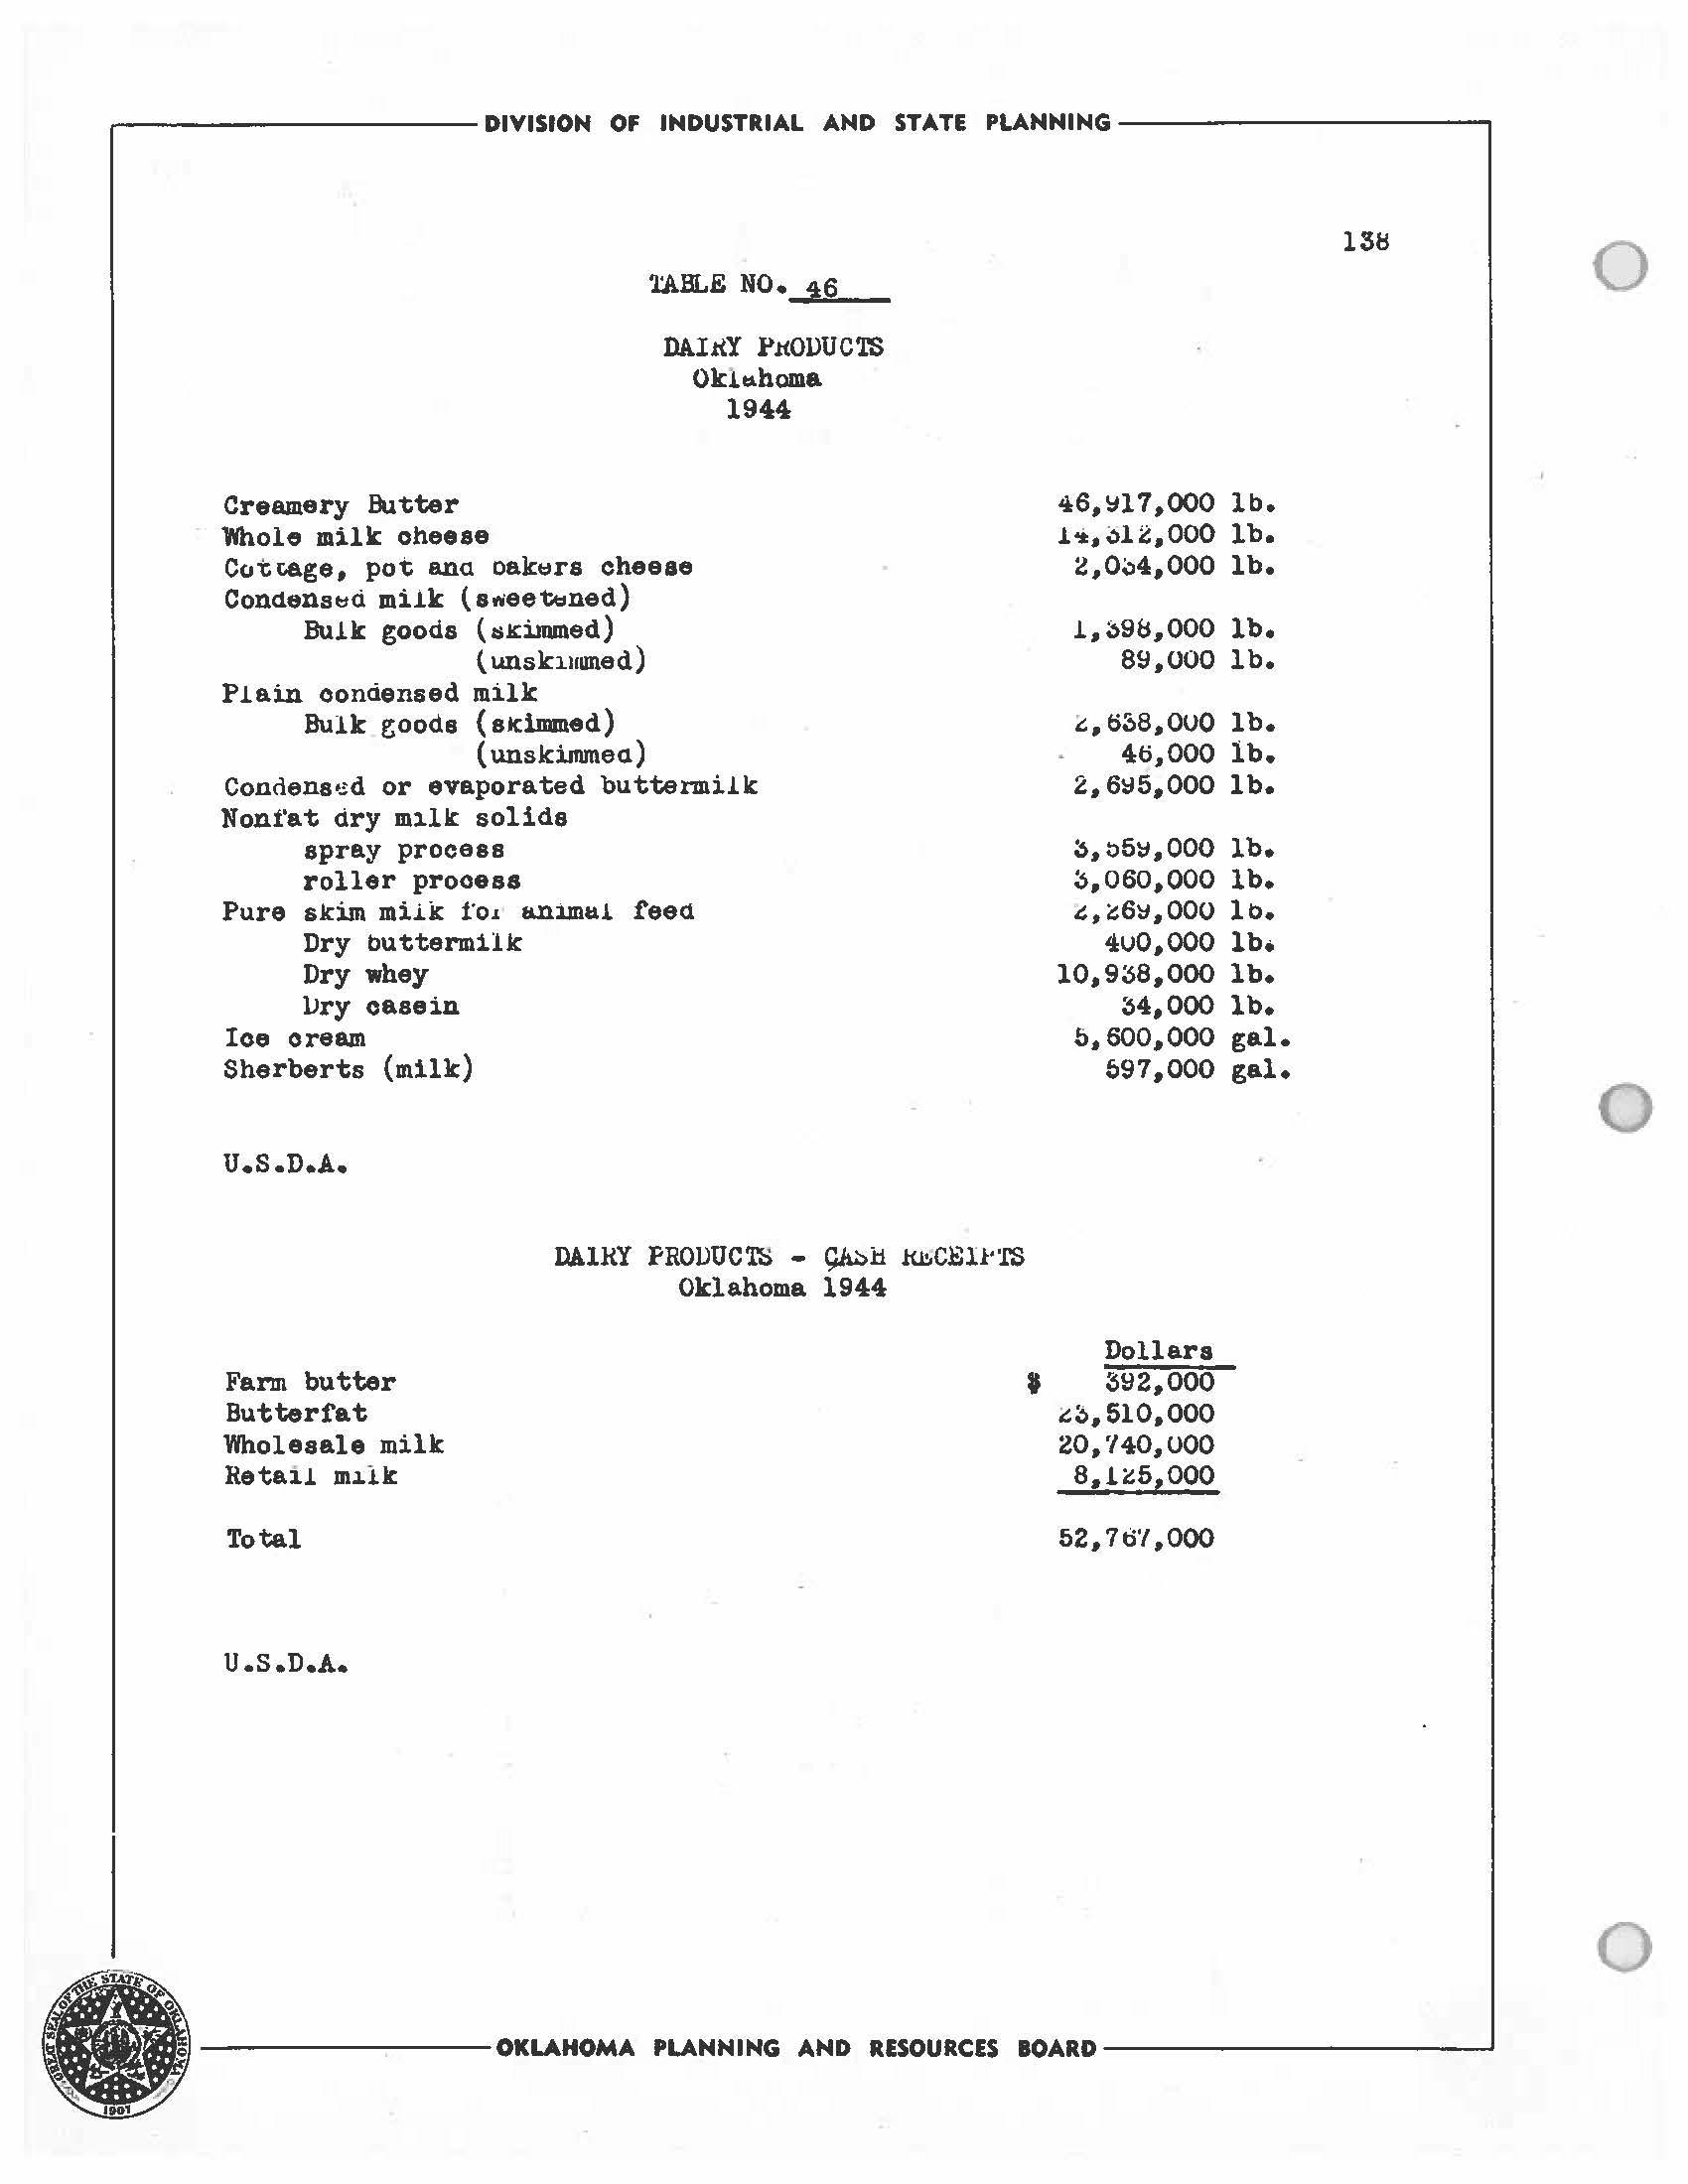
,------------ DIVISION OF INDUSTRIAL AND STATE PLANNING----------.........,
u.s.n.A.
Farm butter Butterfat
Total u.s.D.A. DAIRY PRODUCTS - 9-W:>:i:1 lUl.C.C:H'TS Oklahoma 1944 46,~17,000 1-i, ~l 2,000 2,0.:i4,000 1,~9&.,000 89,000 .::,6~8,0UO 4o.,OOO 2,6~5,000 ~,:,5~,000 3,060,000 l!,~6~,000 4uO,OOO 10,938,000 34,000 5,600,000
Dollars I 392,000 ;::~.510,000 20 ,'/40, uoo 8,U5,000 f>2. 7ti'/ ,000 131:1 lb. lb. lb. lb. lb. lb • lb. lb. lb. lb. lb. lb. lb. lb. gal. gal. ---------OKLAHOMA
0 0
()97,000
PLANNING AND RESOURCES BOARD------------'
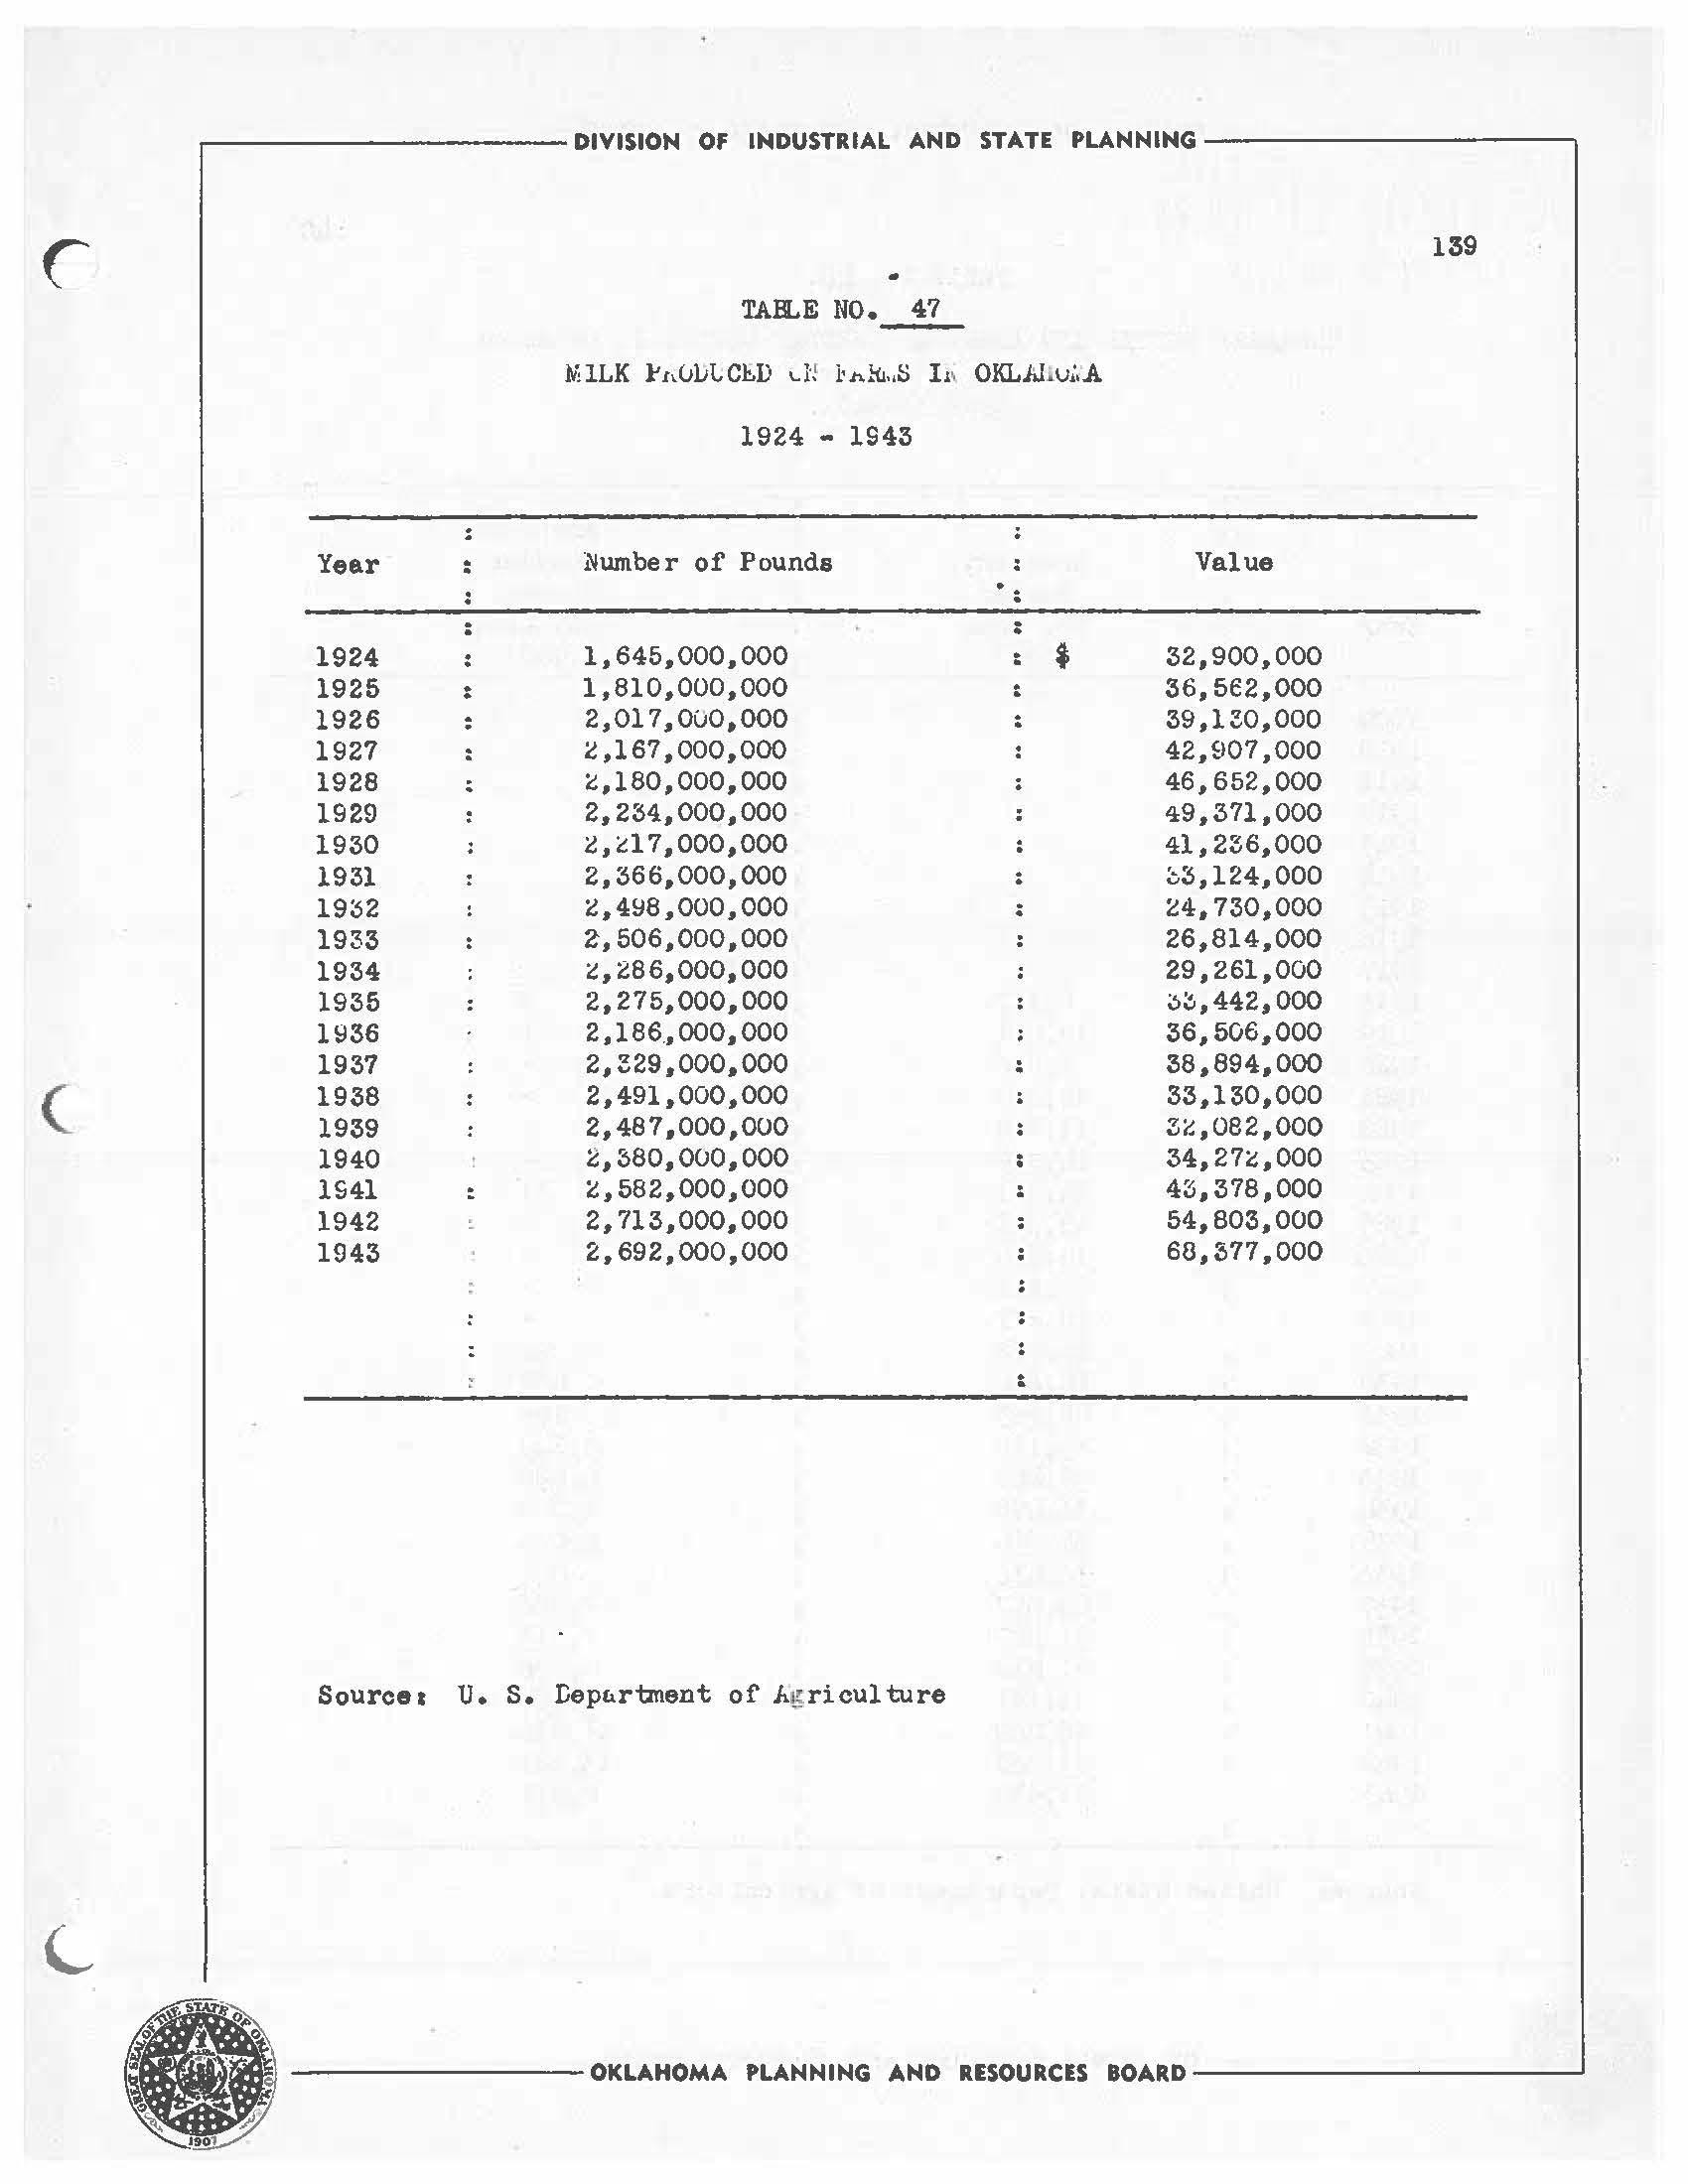
~---------- DIVISION OF INDUSTRIAL AMD STATE PLAMMIMG -----------. 139
NO. 47
b,01.JLCED d t l•.n1<! S h OKL.l;hu,,A 1924 - 1943 : Year ~umber of Pounds Value : : 1924 1,645,000,000 * 32,900,000 1925 : 1,810,000,000 36,5€2,000 1926 : 2,017,0UO,OOO 39,lW,OOO 1927 2,167,000,000 42,907,000 1928 l::,180,000,000 46,652,000 1929 2,234,000,000 49,371,000 1930 2,d 7,000,000 41,236,000 1931 2,366,000,000 ::.3,124,000 19:52 l,4!:18,000,000 l::4,730,000 1933 2:,506,000,000 26,814,000 1934 l,286,000,000 29,261,000 1935 2,275,000,000 ;:.~,442,000 1936 2,186,000,000 36,506,000 1937 2,i29,000,000 38,894,000 ( 1938 2,491,000,000 33,130,000 1939 2,487,000,000 Zr.,082,000 1940 2,~80,0CJ0,000 34,27l::,OOO 1941 l::,582,000,000 43,378,000 1942 2,713,000,000 54,803,000 1943 2,692,000,000 68,377,000
TAJLE
MILK
•---------OKLAHOMA PLAMMIMG AMD RESOURCES BOARD------------'
Source, U. s. Depllr"bnent of.hg riculture
OF OKLAHOMA CITY/ Table No. 48.
CREAMERY BUTTER AND AMERICA:N CHEDDAR CHEE.SE IN OKLAliOMA.
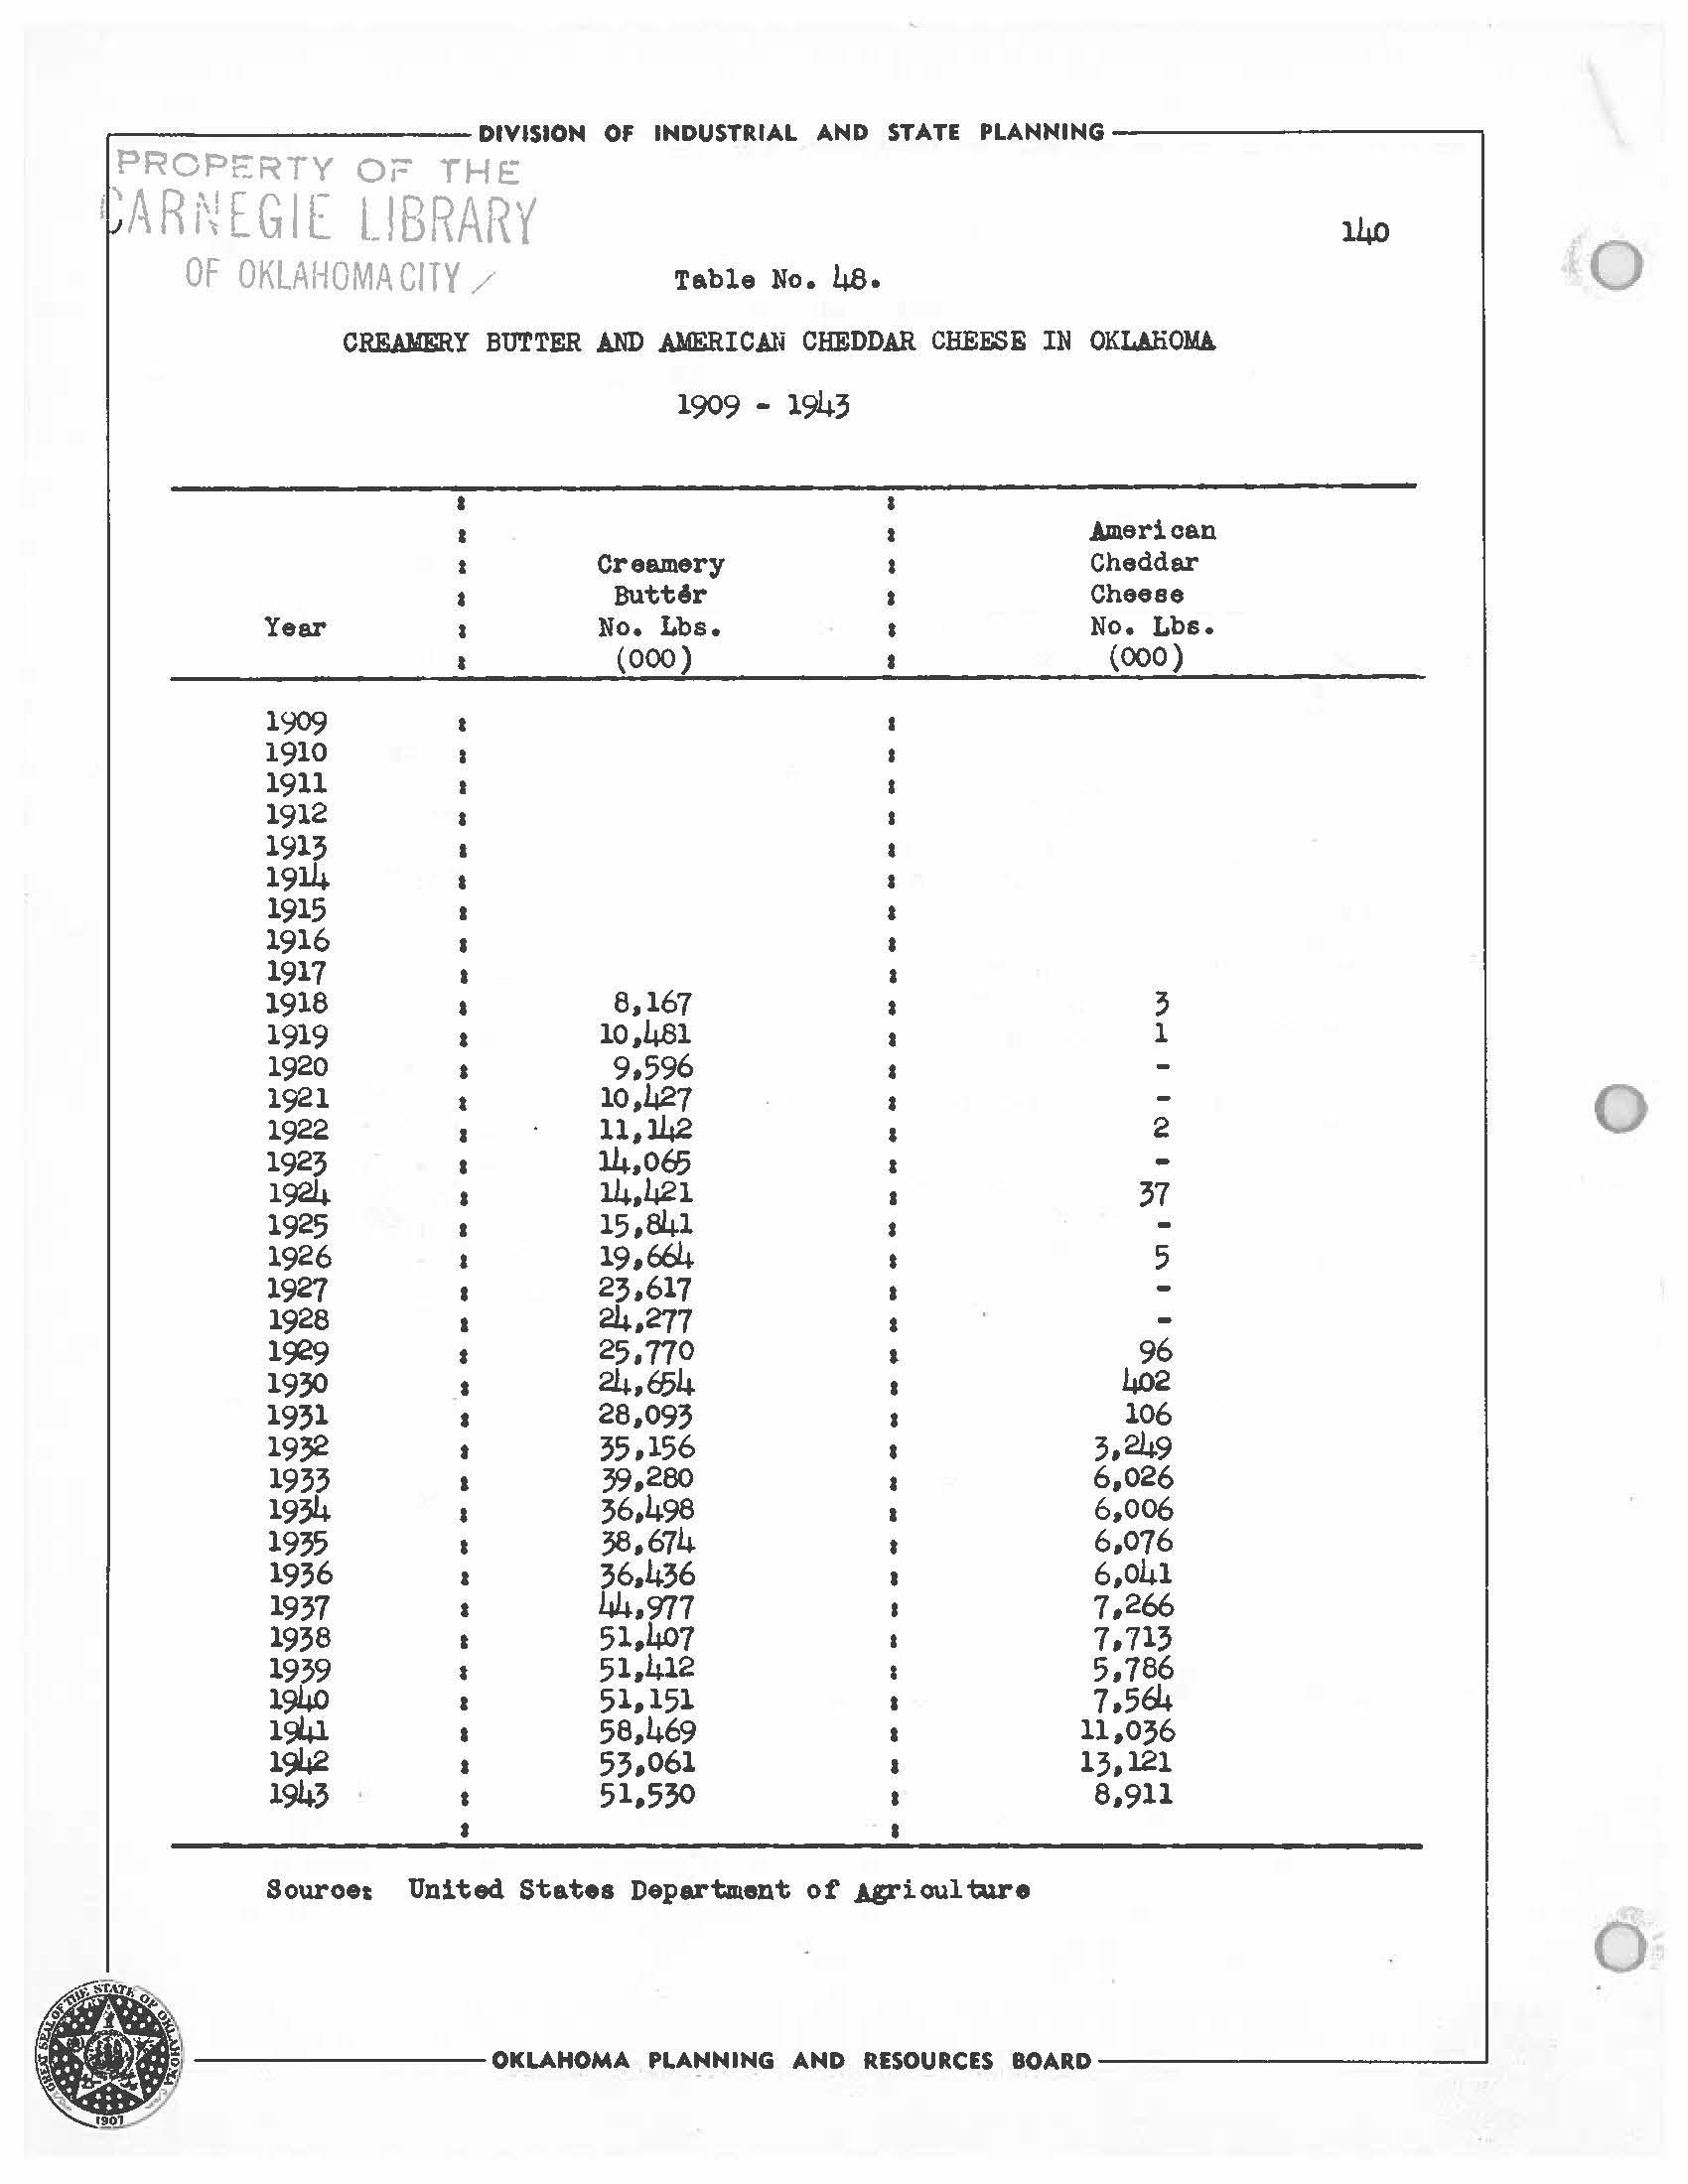
DIVISION OF INDUSTRIAL AMD STATE PLANNING PROPERTY Or
0
THE 1'ARNEGIE LIBRARY
1909 - 1943 • I I ~erioe.n I Creamery • Cheddar • Buttar • Cheese Year I No. Lbs. a No. Lb,;. I {000) {000) 1909 1910 1911 1912 a I 1913 • t 1914 I a 1915 • 1916 • 1917 • 1918 • 8,167 • 3 1919 I 10,481 a l 1920 • 9,596 I 1921 I 10,427 t 0 1922 11,142 & 2 1923 14,065 & 1924 I 14,421 & 37 1925 & 15,84.l I 1926 • 19,664 5 1927 23,617 • 1928 l 24,277 I 1~ l 25,770 l 96 1930 I 24,654 I 4o2 1931 I 28,093 I 106 1932 • 35,156 3,249 1933 l 39.,280 6.,026 19;4 • 36,498 6.,006 1935 38.,674 • 6.,076 1936 I 36.,436 • 6,041 1937 I 44,977 7,266 1938 I 51,4o7 7,713 1939 • 51,412 I 5,786 194,o I 51,151 I 7,564 lSlµ. l 58.,469 I 11,036 1~ I 53.,061 I 13,121 1943 I 51.,530 8.,911 I Souroet United States Departlllent of J.grioul ture 0
OKLAHOMA PLAMMING AND RESOURCES BOARD
The attached material is supplied to brins the 1early production figures tor the state up to date. Changes may be made an the pagee indicated, or the Addenda sheets inserted. at the back of the report.
( ....----------- DIVISION OF INDUSTRIAL AND STATE PLANNING ----------,
OKLAHCW. AGRICUL'IURE ADDEND,\
--------OKLAHOMA PLANNING AND RISOURC£S BOA.RD -----'
PROPERTY OF TH I= CARNEGIE L!BRAR~ OF OKLAHOMA CITY
\ 0 0 0 --------OKLAHOMA
PLANNING AND RESOURCES BOARD----------~

DIVISION OF INDUSTRIAL AND STATE PLANNING OKIAHOMA r AGRICUL'roRE ADDENDA Page 56 Table No. 10 Year Total Prod. Ac. Harve't. YieldLAc. Price~u. ($) Value (Dollars) 1945 73,875,000 5,910,000 12.5 1.45 107,119,000 1946 88,262,000 6,087,000 14.5 1.81 159,754,000 Paee 63 Table No. 12 Year Total Prod. Ac. Ha.rvs't. Yield/Ac . Price/Lb.(¢) Value $10001945 285,000 1,085,000 126 20.o6 28,595 1946 262,000 1,020,000 123 30.0 39,297 Page 69 Table No. 14 Year Total Prod . Ac . Ha.rve 't. Yield/Ac. Price~u. Value (Dollars) 1945 22,644,000 1,332,000 17,0 1.19 26,946,000 1946 25,882,000 1,479,000 17.5 1.53 39,599,000 C Page 76 Table No. 16 Year Total Prod. Ac. Harvs•t. Yield/Ac. Price~u. Value {Dollars) 1945 20,976,000 1,104,000 19.0 .72 15,103,000 · 1946 24,780,000 1,180,000 21.0 .91 22,550,000 Page 81 Table No. 18 Year Total Prod. Ac. Harvs't. Yield/Ac. Price~u. Value (Dollars) 1945 740,000 74,000 10.0 1.12 829,000 1946 432,000 48,ooo 9.0 1.60 691,000 Page 83 Table No .1:2..,_ Year Total Prod. Ac. Harvs I t. Yield/Ac. Price~u. Value (Dollars) 1945 2,960,000 185,000 16.0 .98 2,901,000 1946 1,820,000 130,000 14.0 1.32 2,402,000 Page 89 Table No. ·22 Year Acreage Harvested Yield (Gallon) Production (Gallon) 1945 5,000 43 215,000 1946 4,ooo 47 188,000

.---------- DIVISION OF INDUSTRIAL AND STATE PLANNING --,
90 Table No._§_
: All Sorghums For Grain: All Sor ume for S11 e: All Sorghume,Forage : Ac.Har.:Yield(Ac):Prod.: Ac.Har.:Yield(Ac :Prod.: Ac.Har:Yield:Prod. 000 : 000: 000 000 000 : : 000 : 12.0 11.5 Page 92 Table No. 24 . . . . :7632: :7314: 70 82 4.5 4.o . . 315 1,118 : 328: 1,107 . . 1.25:1,398 1.30:1,439 Year Total Prod. (tons) 1,102,000 1,195,000 Ac. Harvs't. Yield/Ac. (ton) 1.36 1.38 Price/Ton 12.50 13.50 Value (Dollars) 13,775,000 16,132,000 1945 1946 Page 93 Table No._gz_ 813,000 867,000 Year Total Prod. (tons) 546,ooo 428,000 Ac. Ra.rvst'd. Yield Ac. ton 1.25 1.00 Price/Ton 10.90 11.50 Value(Dollare) Page 95 Table No. 26 Year Acreaee (Acree) 1945 1914-6 368,000 357,000 .Page 96 Table No .11-, Year Acres 1946 108,000 Page 98 Table No. 28 437,000 428,000 Yield (Tons) 2.0') 1.70 Production (Bushels) 184,ooo 5,951,000 4,922,000 Production (Tons) 754,ooo 607,000 Year Total Prod. (tons) 11,600 16,100 Ac. Ha.rvs't. Yield/Ac. (lbs.) 290 310 Price/Ton 275.00 30').00 Value(Dollare) 3,190,000 4,910,000 1914-5 1946 Page 100 Table No._& Year 1914-5 1946 Total Equi T. Solid Ac. 208,000 244,000 80,000 1o4,ooo Picked & Threshed Ac. 185,000 221,000 Yield Rarvst'd. Production (lbs.) lbs. 475 540 87,875,000 119,340,000 -------OKLAHOMA PLANNING AND RESOURCES BOARD _ _, \ 0 0 0
ADDENDA - Continued Page
Year

( ~-------- DIVISION OF INDUSTRIAL AND STATE PLANNING---------, ADI!:NDA - Cont'd. , Pase 3 Page 105 Table No.~ Year Improved (lbs.) 1,500,000 1,400,000 Page lo8 Table No.~ Seedling (lbs.) 24,500,000 7,600,000 Total (lbs.) 26,000,000 9,000,000 Year Total Prod. Ac. Harvst'd. Yield/Ac. Price/Bu. Value (Dollars) 990,000 1,500,000 Page 109 Table No ..lL 18,000 20,000 · 55 75 1.85 . 1.48 1,832,000 2,220,000 Year Total Prod. Ac . Harvst'd. Yield/Ac. Price/Bu. Value (DoUars) 1945 1946 585,000 520,000 9,QO0 8,000 2.44 2.60 1,427,000 1,352, ooo Pase 110 Table No . ~ Year Apples {Bu.) Peaches (Bu. ) 734,ooo 667,000 Peare (Bu.) 203,000 168,000 Page 118 Table No . .]§,_ Year 1945 1946 1947 No . on Farms Je.n. 1 3,150,000 2,867,000 2,724,000 Page 121 Table No._lL Year No. on Farms Jan. 1 885,000 823,000 765,000 Page 123 Table No _1L Year 1946 1947 No. an Farms Jan. l 968,000 962,000 731,000 Value per Head$ 51.40 55.20 71.60 Value per Head$ 70.00 74.oo 96.00 Value per Head$ 15.10 16.10 24.20 Grapes (Tone) 2,500 3,300 Total Value {Dollars) 161,910,000 158,258,000 195,038,000 Total Value (Dollars) 61,950,000 60,902,000 73,440,000 Total Value 13,7u,ooo(Dollars) 15,488,000 17,690,000 - OKLAHOMA PLANNING AND RESOURCES BOARD----- - --'
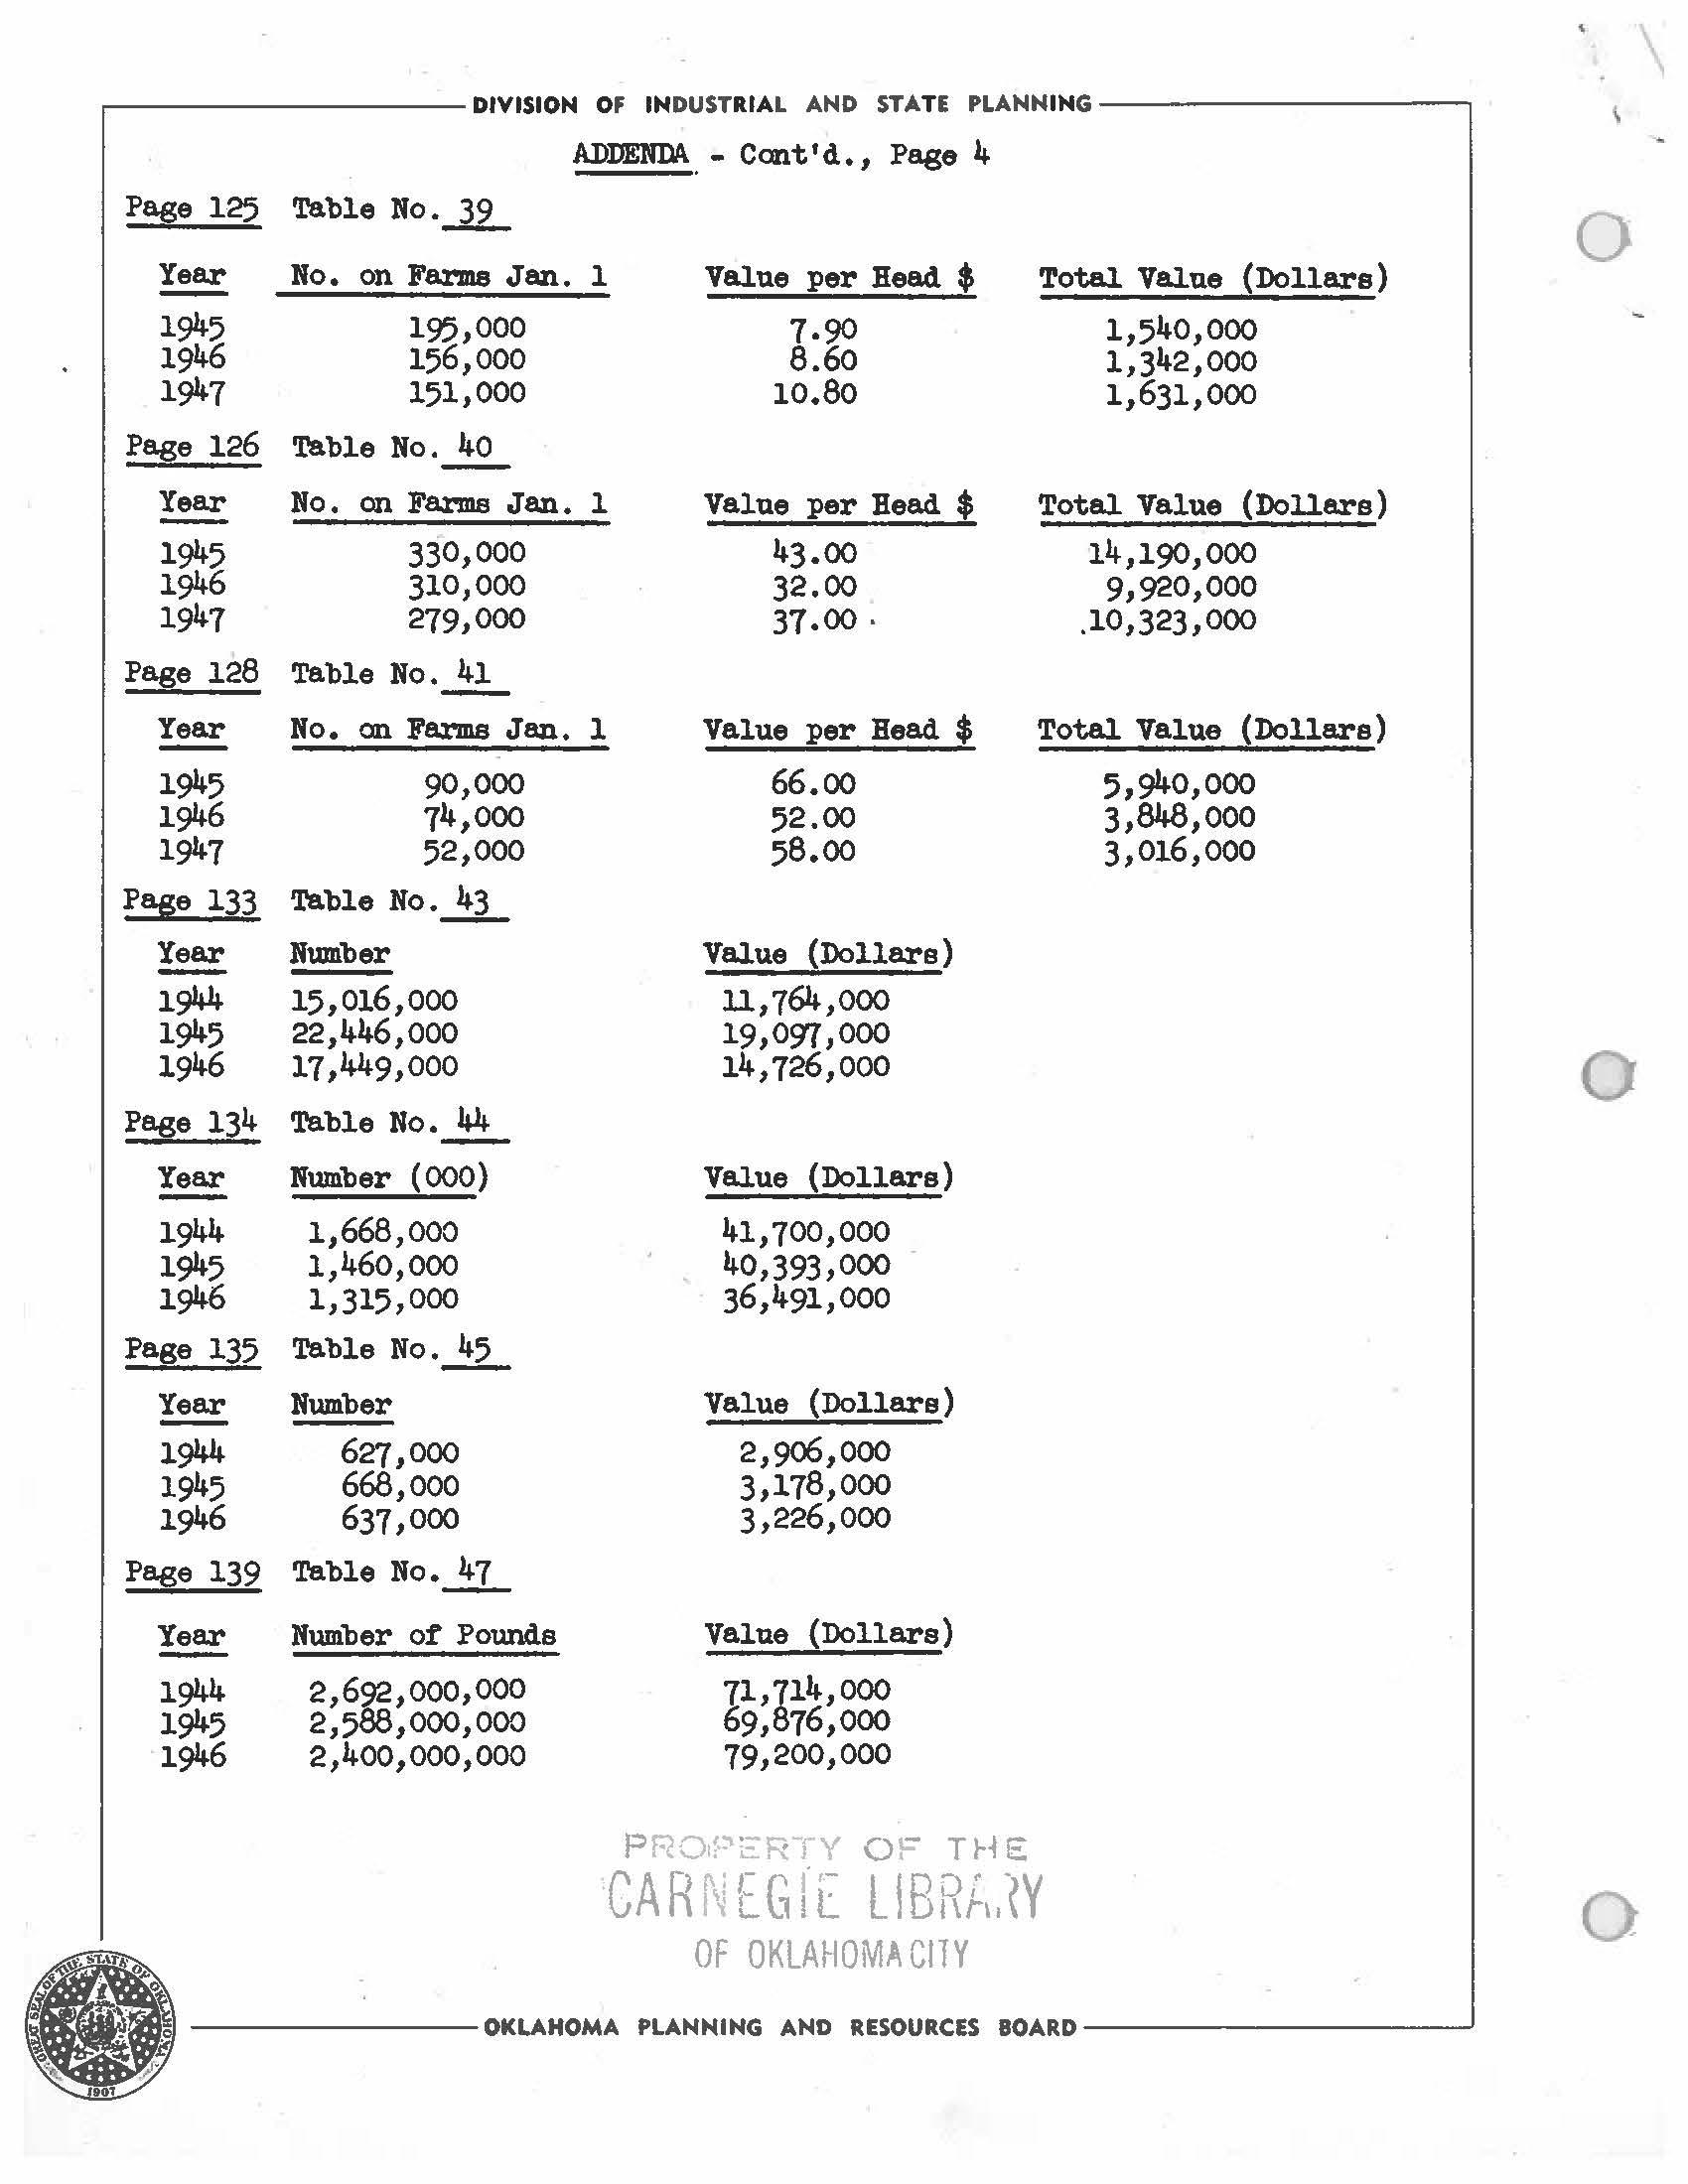
.---------- DIVISION OF INDUSTRIAL AND STAT E PLANNING---------, ADDENm. - Cont'd., Page 4 Page 125 Table No._l2_ Year No. on Farms Jan. 1 1945 1946 194-7 195,000 156,000 151,000 Page 126 Table No. 40 Year 194-5 1946 1947 No. an Far.ms Jan. 1 330,000 310,000 279,000 Page 128 Table No. 41 Year 1945 1946 1947 No. an Farms Jan. l 90,000 74,000 52,000 Page 133 Table No.~ Year 194,4 194-5 1946 Number 15,016,000 22,446,000 17,449,000 Page 134 Table No.~ Year Number (000) 1944 194-5 1946 Page 135 Year 1944 1945 194,6 1,668,000 1,460,000 1,315,000 Table No •..!2.,.. Number 627,000 668,ooo 637,000 Page 139 Table No.~ Year 1944 1945 1946 Number o~ Pounds 2,692,000,000 2,588,000,000 2,400,000,000 Value per Bead$ 7.90 8.60 10.80 Value per Bead$ 43.00 32.00 37.00 · Value per Bead$ 66.oo 52.00 58.00 Value (Dollars) 11,764,000 19,097,000 14,726,000 Value (Dollars) 41,700,000 40,393,000 36,491,000 Value (Dollars) 2,906,000 3,178,000 3,226,000 Value (Dollars) 71,714,000 69,876,000 79,200,000 P Ro~~::..R ( o- THE Total Value (Dollars) 1,540,000 1,342,000 1,631,000 Total Value (Dollars) 14,190,000 9,920,000 .10,323,000 Total Value (Dollars) 5,940,000 3,848,000 3,016,000 CA RI'\ ,- G f - L!BD , . y '\ C. :t I l l\h, ( OF OKLAHOMA Cl1Y -------OKLAHOMA PLANNING AND RESOURCES BOARD----------' \ 0 0 0