TL/DR: AWS QuickSight makes it easy to build visualizations, perform ad-hoc analysis, and quickly get business insights from their data, anytime, on any device. Hacker and security researcher Ryan Elkins (@ryanelkins) breaks down how you can use it.
Are you drowning in output files from your bash one-liners? Do you spend hours sifting through the data?
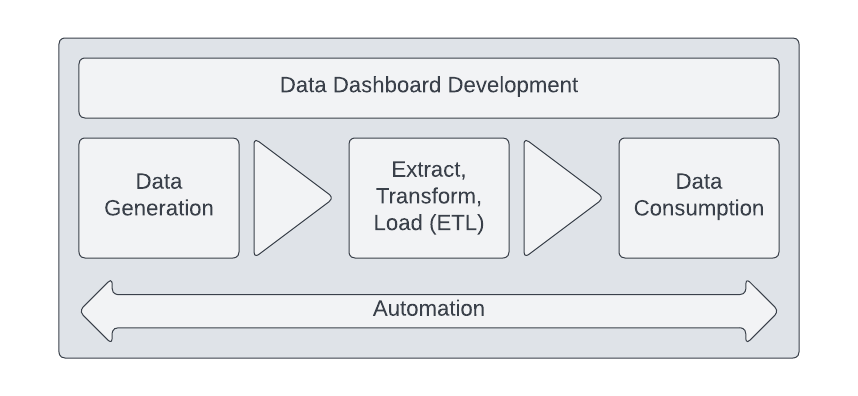
An underutilized opportunity for optimization and analysis is to develop dashboards to visualize and navigate the data outputs from a collection of bug bounty tools. After an initial time investment to configure, these dashboards can provide ongoing filtering to quickly present relevant data.

The base setup requires configuration of the services, access, and authorization. Once the dependencies are established, the dashboard will remain up-to-date with the most recent output data from our bug bounty hunts.
There are numerous visualization tools to select from with varying degrees of configuration and tuning required. Some examples include Microsoft PowerBi, Tableau, Bokeh, Matplotlib, Plotly, D3.js, and Seaborn. For this walkthrough, we are going to leverage Amazon QuickSight which is a cloud-native service offering by Amazon Web Services (AWS).
The QuickSight service can ingest and display data from many services although, for this use case, we will utilize Amazon Simple Storage Service (S3) as our raw data source. The cloud-based SaaS options eliminate the need for infrastructure support and can scale based on a balance of demand, speed, and cost. The dashboard performance and responsiveness is delivered using a super-fast, parallel, in-memory calculation engine (SPICE).
The dashboards will continually refresh data from an integrated source and newly added data will have immediate visibility and reporting benefits.
In order to maintain consistency and reduce errors, new data is processed through an ETL (extract, transform, and load) process. If you have ever performed engineering to normalize data into a Security Information and Event Management (SIEM) platform for monitoring by a Security Operations Center (SOC), you would have established ETL capabilities.
This walkthrough will comprise of 3 components:
- Infrastructure/Service Configuration
- Data Extract, Transform, Load (ETL)
- Dashboard Generation
The final product will be a sample dashboard with seven key measures. Some of the services do have a minimal cost associated, but if you generate a new AWS account for this tutorial, everything configured is included within the AWS free tier.
Infrastructure/Service Configuration
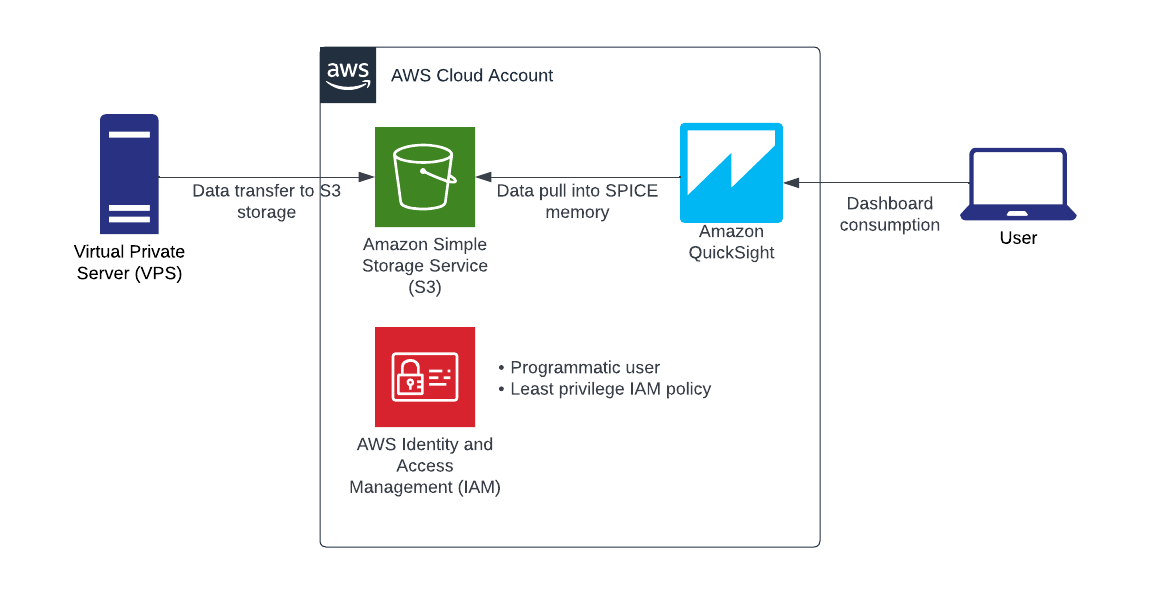
The configuration section will build the cloud infrastructure depicted above. This tutorial will demonstrate console-based creation although there is tremendous value in building cloud environments using infrastructure as code because it provides change management when tracked in a source code management system such as GitHub, repeatability, consistent deployment, and recovery options.
S3 Bucket Creation
To begin, you will need an AWS S3 bucket to store the data.
- Login to your AWS account and navigate to the S3 service.
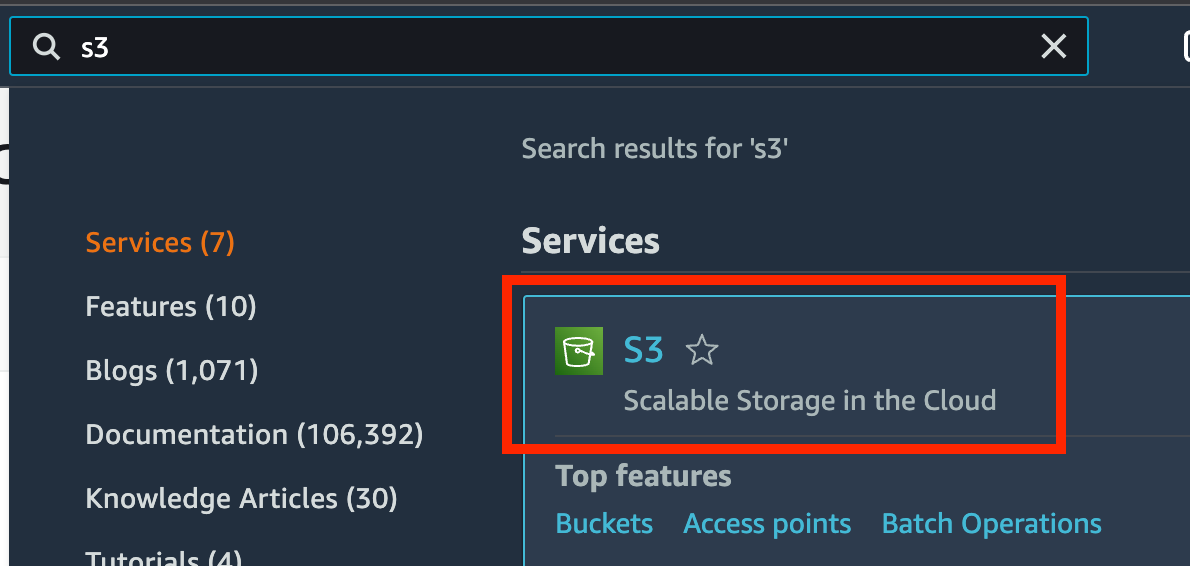
- Once you access the service, click “Create bucket”.

- Provide the bucket with a globally unique name.
- Select a region. Ideally, the region would be near your geographic location although just be sure to create all of the resources within the same region to avoid data transfer costs.
- Object Ownership can remain the default – “ACLs disabled (Recommended)”
- Leave the default “Block all public access” checked.
- Bucket Versioning: disabled.
- Default encryption – Select Enable and then select Amazon S3-managed keys (SSE-S3).

Since many of us will be working from a non-GUI virtual private server (VPS) or Linux server, we will want to transfer the files directly to the newly created S3 bucket. In order to do that, we need to establish authentication and authorization.
Create an IAM policy
- Search for and select the IAM service.


- Within the Create policy Visual editor, search and select the S3 service.

- Expand the “Actions” section, expand “Write”, and select the “PutObject” permission.
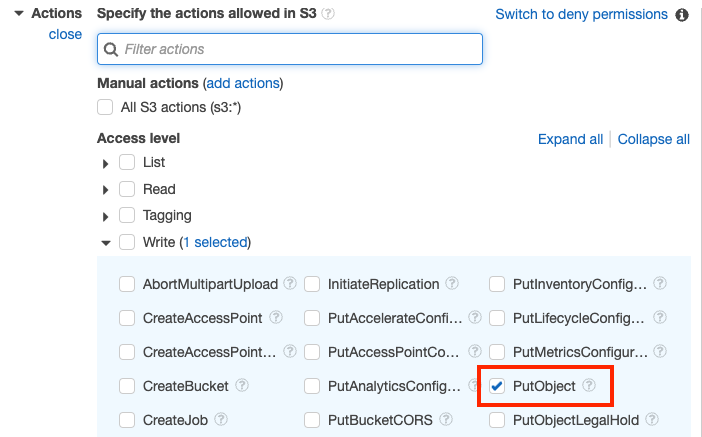
- Enter the Bucket name [the bucket that was previously created].
- Add an asterisk to permit PUT Object actions for any file in the bucket.
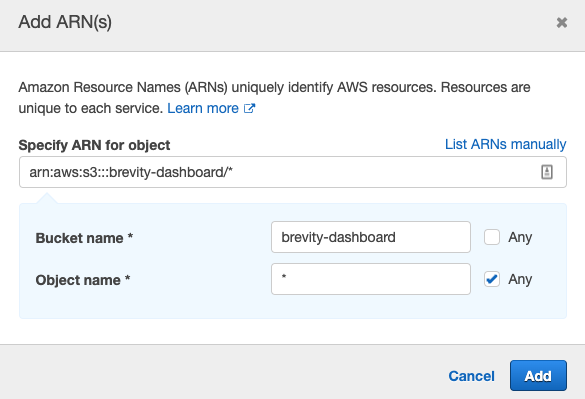
- Click “Add”
- Click “Next: Tags”
- No tags are needed. Click “Next: Review”
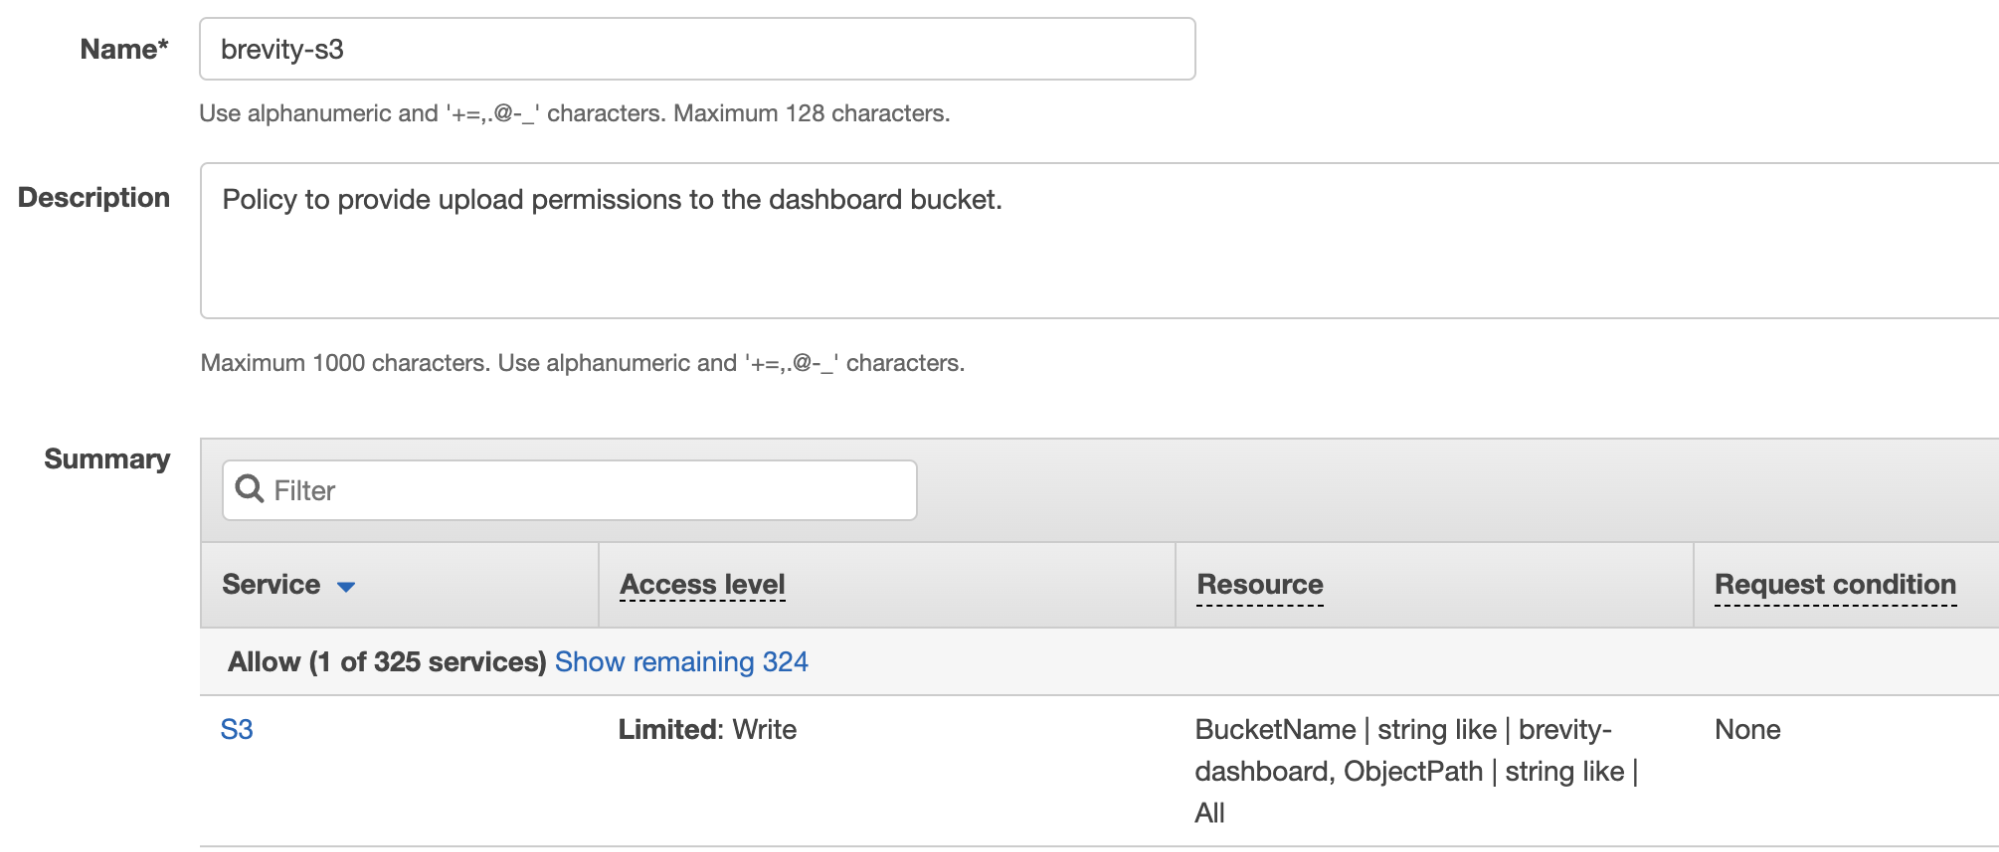
- Provide a Name and Description for the policy. The completed policy should look like the following:
Create an IAM programmatic user
- Open the IAM service and select Users.

- Click “Add users”
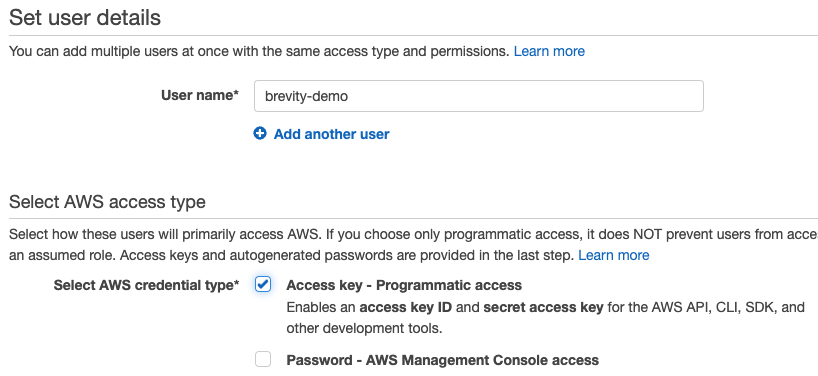
- Provide a User name value.
- Select the box for “Access key – Programmatic access” and leave the “Password – AWS Management Console access” box unchecked. Leaving the box unchecked provides additional security value by not introducing a password to the user which would be in addition to the programmatic access secret key.
- Click “Next: Permissions”
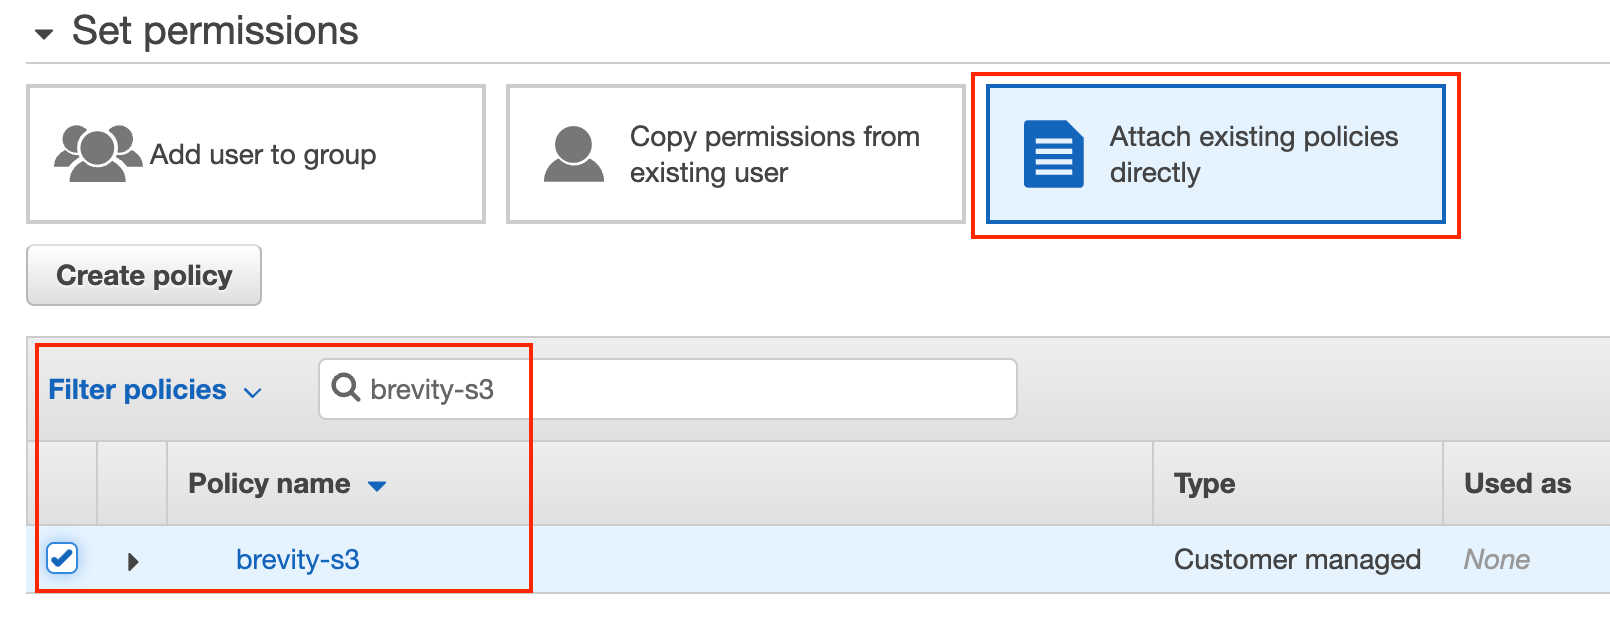
- Select “Attach existing policies directly”. It is best practice to assign policies to groups and then add users into the group but for limiting steps within this demo, the policy can be attached directly to the user.
- Within the “Filter policies” section, type the name of the previously created policy and check the box to assign it to the user.
- There is no need to configure a boundary policy.
- Click “Next: Tags”
- No tags are needed. Click “Next: Review”
- The review summary should look similar to the following:
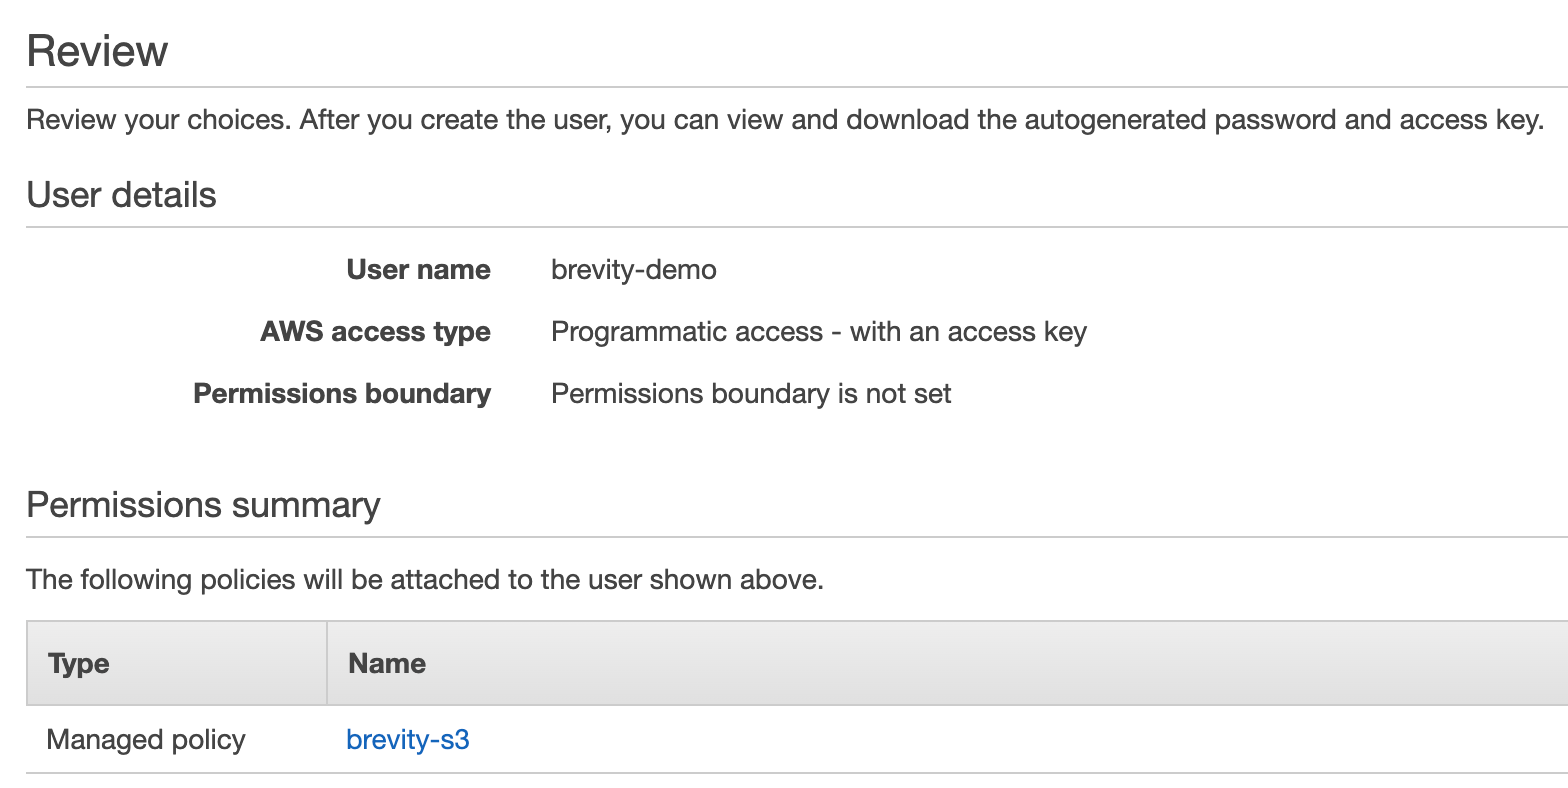
- Click “Create user”
- This screen is the only opportunity that will be provided to retrieve the secret key for the user. The best option is to likely click “Download .csv” or if you have a password manager readily available, you can copy the Access key ID and the Secret access key directly to the vault. This will be utilized within the command line on our hacking server.

Completion of the AWS dependency configurations
At this point, the AWS environment should have:
- S3 bucket for data storage.
- IAM policy granting least privilege access to the S3 bucket.
- Programmatic user account with the IAM policy attached for uploading the target data to the S3 bucket.
Data Extract, Transform, and Load (ETL)
The next step is to actually collect the data and normalize it to be published within the QuickSight dashboard. This use case will build the dashboards based on the raw JSON output files from a tool developed by Projectdiscovery called httpx. It has a rich dataset within the output and gives us extensive options to visualize.
If you already have httpx data output, you can skip this step or modify the schema and dashboard steps to match the specific data that you plan to utilize. For simplicity, we will not need to modify the httpx output for this tutorial. Some of the power in AWS QuickSight is that it can auto-detect the schema. If we were trying to analyze files from different sources, we would need to normalize the keys, data types, and format into a consistent JSON schema.
Install the dependent tools
To generate the data for the dashboard, your environment will need both Go and Python 3 installed.
``` go install -v github.com/projectdiscovery/httpx/cmd/httpx@latest
``` curl "https://awscli.amazonaws.com/awscli-exe-linux-x86_64.zip" -o "awscliv2.zip"
``` unzip awscliv2.zip
``` sudo ./aws/install
If you do not already have an existing URL list, you can install the following tools to generate a scoped URL list:
``` go install github.com/hakluke/hakrawler@latest
Generate a URL list
If you do not have an existing URL list, you can select one of the following three options to generate the httpx output for this walkthrough:
- Use your own URL list and name it urls.txt to conform with the commands within the walkthrough.
``` cat urls.txt | httpx --json -o demo-httpx.json -sc -cl -ct -rt -lc -wc -title -server -td -method -ip -cname -asn -cdn
- Download a list of sample URLs.
``` curl https://raw.githubusercontent.com/brevityinmotion/goodfaith/main/samples/brevityinmotion-urls-max.txt --output urls.txt
Once the urls.txt file is downloaded, run the following to generate the dashboard data file:
``` cat urls.txt | httpx --json -o demo-httpx.json -sc -cl -ct -rt -lc -wc -title -server -td -method -ip -cname -asn -cdn
- Generate a list of URLs from a bug bounty target. Example command (you can customize the URL in the echo statement):
``` echo https://www.brevityinmotion.com | hakrawler | httpx --json -o demo-httpx.json -sc -cl -ct -rt -lc -wc -title -server -td -method -ip -cname -asn -cdn
This command will pass a URL to be crawled by hakrawler and then the discovered URLs will be piped to httpx to initiate requests and collect the URL information.
Update the configuration file
All three options will create a JSON based output file called demo-httpx.json and will be the data file for the dashboard.
In order to ingest the data into AWS QuickSight, we will need to upload a manifest file to the S3 bucket. An example manifest template can be downloaded using the following command:
``` curl https://raw.githubusercontent.com/brevityinmotion/goodfaith/main/samples/manifest-s3-httpx.json --output manifest-s3-httpx.json
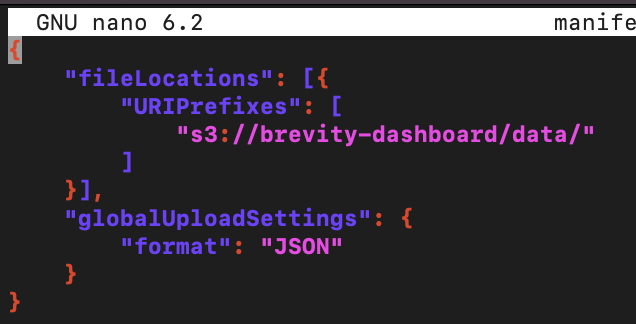
Using your favorite text editor (i.e. nano manifest-s3-httpx.json), make sure to modify the URIPrefixes to reflect the bucket specific to your environment.
- The URIPrefixes will be the bucket name and path to the data to be visualized.
Load the data
Once the data is ready, the AWS credentials need to be configured for the IAM user previously configured. There are multiple methods for establishing AWS cli credentials. The AWS region is in the format of us-east-1 and the following commands can be utilized:
``` export AWS_ACCESS_KEY_ID={PASTE ACCESS KEY FROM AWS USER}
``` export AWS_SECRET_ACCESS_KEY={PASTE SECRET KEY FROM AWS USER}
``` export AWS_DEFAULT_REGION={aws-region}
Once the environmental variables are set, run the following:
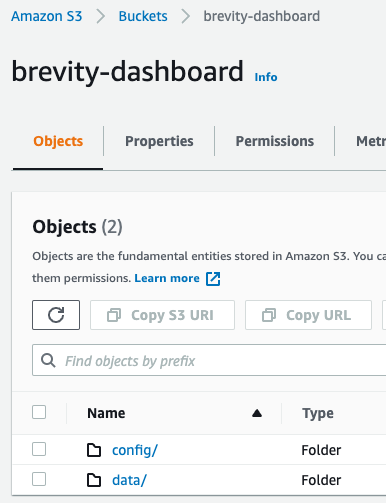
``` aws s3 cp manifest-s3-httpx.json s3://brevity-dashboard/config/manifest-s3-httpx.json
``` aws s3 cp demo-httpx.json s3://brevity-dashboard/data/demo-httpx.json
Once these steps are completed, they will be visible when browsing the objects in the S3 bucket from the AWS console.
Dashboard Generation
The final section of the tutorial is to create, customize, and publish the dashboard for consumption.
Configuring AWS QuickSight
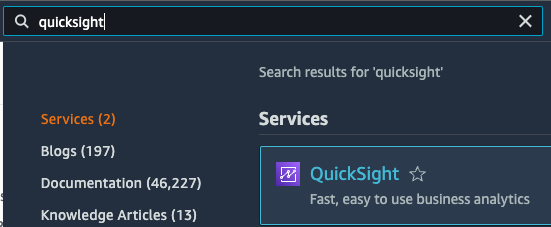
To configure AWS QuickSight, begin by searching for QuickSight within the AWS console search pane and then open QuickSight.
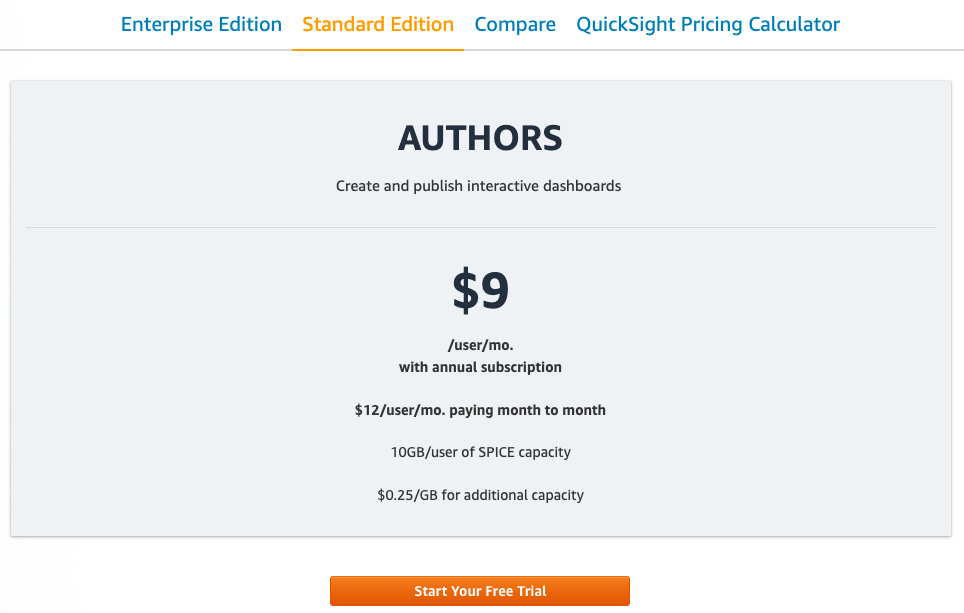
The next step is to create a QuickSight account which will require you to submit your email address.

Note: as mentioned earlier, AWS QuickSight has a 30 day free trial period which is sufficient to cover this walkthrough although it will cost $12/user/monthly ongoing. Make sure to delete the created user within the “Manage QuickSight” profile section before the end of the trial to avoid the ongoing costs.
Prior to connecting to the Dataset, we will need to grant the QuickSight service access to the S3 data.
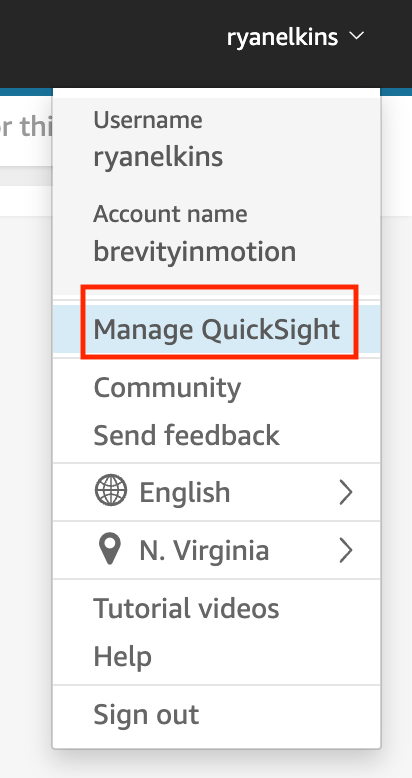
- In the top right corner, click on your user id and select “Manage QuickSight”.
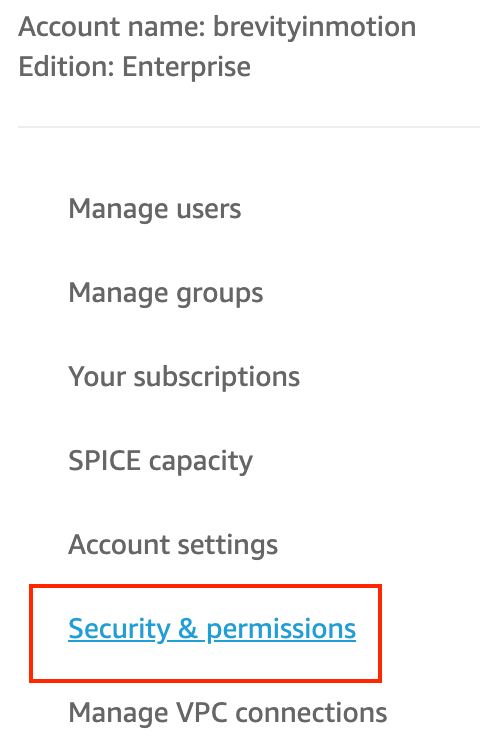
- In the left-column, select “Security & permissions”.
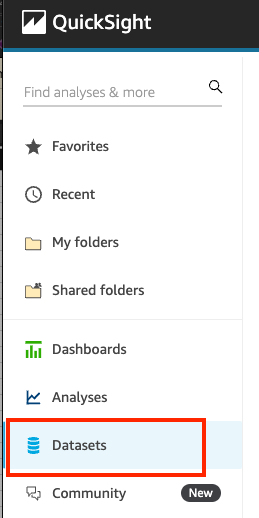
- Once the QuickSight service is loaded, click on “Datasets”.
- Within the “QuickSight access to AWS services” section, click “Manage”.
- Check the box for “Amazon S3” and then click “Select S3 buckets”.
- In the next window, make sure to check the box for the S3 bucket containing the data and then click “Save”.

QuickSight data source connection
At this point, we are ready to create the data source connection.
- Return to the main QuickSight page by clicking the logo in the top left corner.
- Click on “Datasets” from the left-pane menu.
- Select “New dataset” from the top right-corner.
- Select the “S3” data source.
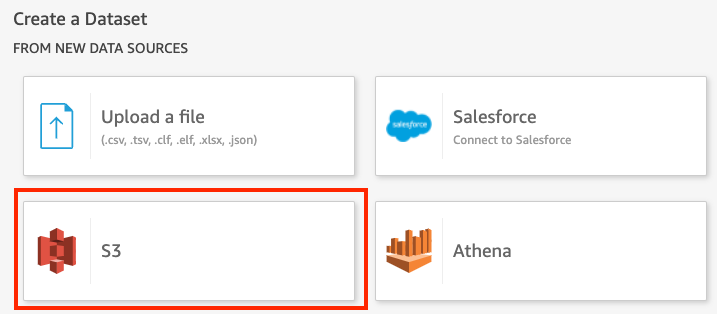
- Upon clicking S3, it will introduce a window to configure the New S3 data source.
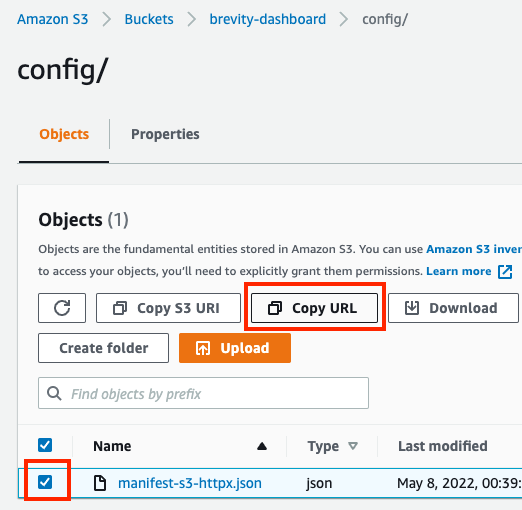
- To retrieve the manifest file URL from the bucket, using a new tab or window, you can navigate to the file within the S3 service, select the object, and click “Copy URL”.
- Provide a name for the data source.
- Select URL has the radio button option.
- Paste the copied URL from S3 to point to the manifest file.

- Click “Connect”.
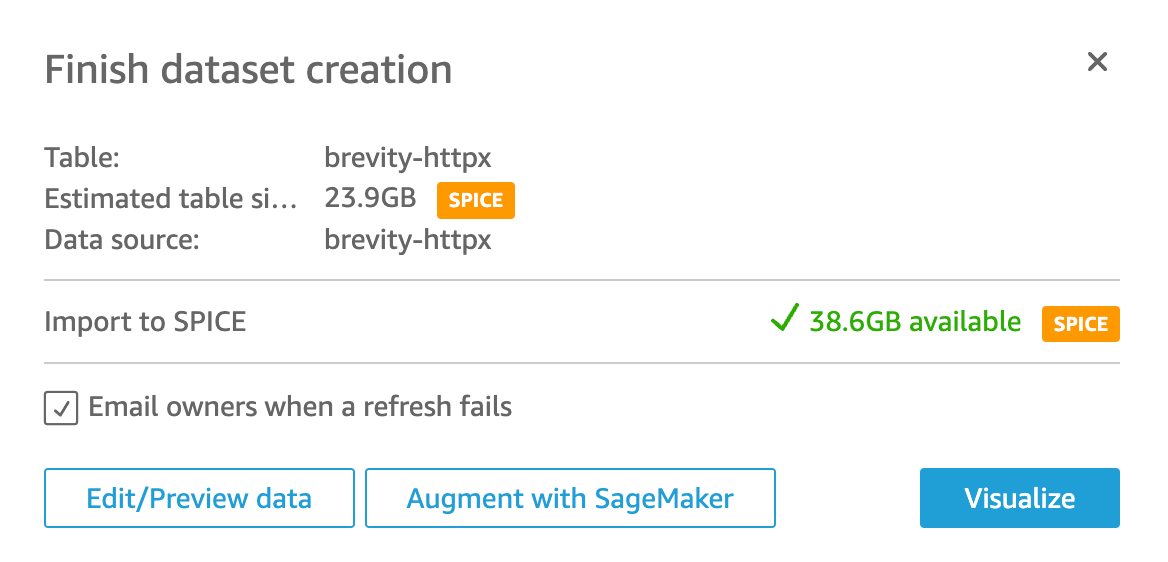
- If the connection is successful and discovers the manifest file, the return result will provide a set of options.
- Click on “Edit/Preview data”.
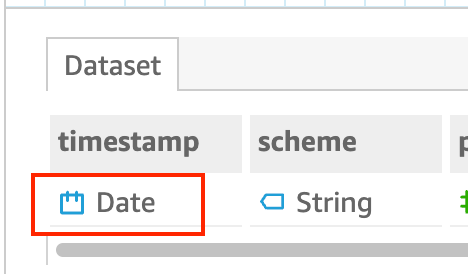
Initially, there will be no data shown because the data import fails due to the format of the timestamp field. Although there is an error in the initial process, it still saves time because it auto-detects and applies the column types. When there are data processing issues, it is typically a type formatting error or mismatch that can be quickly resolved.
- To resolve the issue, click on “timestamp” and change the “Date” format to “String” by clicking on the “Date” and selecting “String”. Completion of this step will resolve the data import issue.
Upon completion, the data load will refresh and the table will be populated with data from the httpx json file.
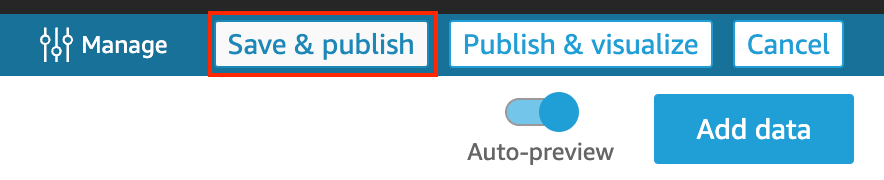
- To save the data connector, click “Save & publish” in the top right corner.
- Next, click the “Publish & visualize” button to move to the next step.
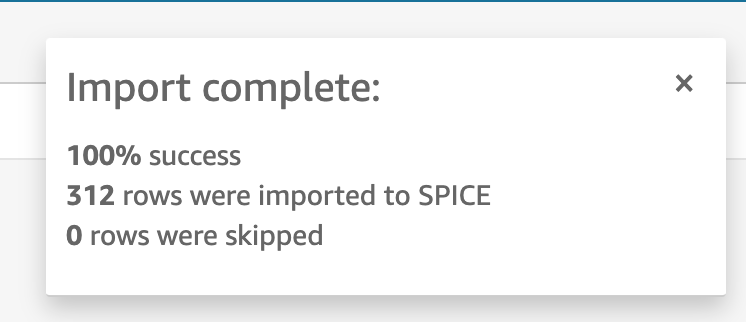
Often, the top right corner will have a status box of the data ingestion. It is important to monitor it to ensure 100% ingestion of data and then resolve any issues if they arise.
Develop the dashboard
For this tutorial, we will create seven valuable measurements to publish into the dashboard. This is where you can tweak and customize to either copy these directly, adjust them to your objective outcomes, or creatively develop brand new insights.
In the prior step, if you clicked “Publish & visualize” you will already have Analysis to develop. Otherwise, you can select the newly created Dataset and click “Create analysis”.
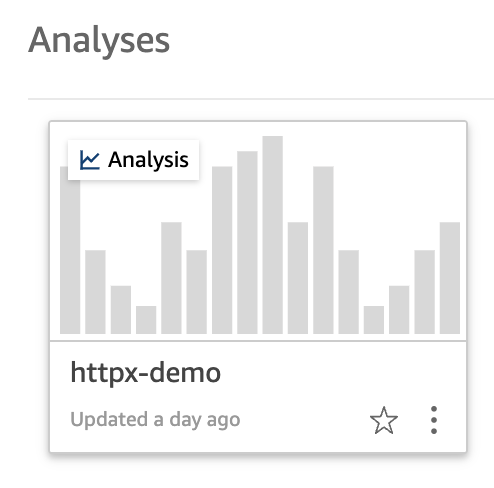
To access the Analysis object, click “Analyses” on the left pane of the main QuickSight page. This will display all of the objects.

Select the intended Analysis to modify.
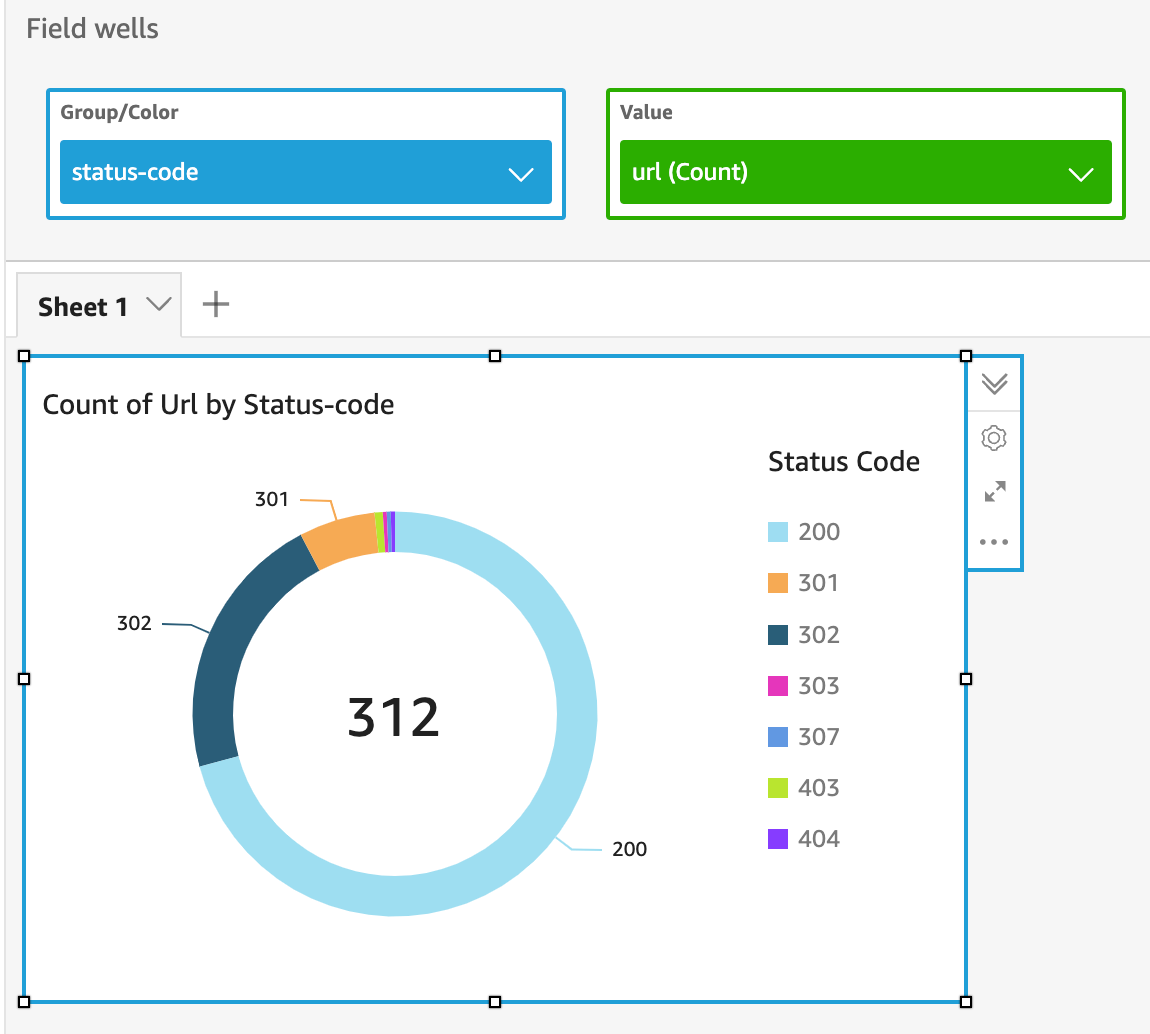
Measurement #1 – Count of URLs by status code
Status codes are useful and may indicate the type of attack necessary such as authentication bypass if a lot of 403 status codes are returned. It may also highlight unique status codes which may indicate further investigation.
- With the Visualize tab selected on the left panel, click on the “status-code” field.
- Select the “Donut chart” visual type.
- At the top, there is a “Field wells” section and the “Value” column will be blank. Click on “Value” to expand the section.
- Drag and drop the “url” field into the value box and ensure that the calculation is “Count”. The Field wells should look like the below image.
- The title can be updated by double-clicking on the default text.
- The box size can be adjusted and dragged to a desirable location on the dashboard.
Measurement #2 – Count of Unique URLs
- Click on URL field.
- Select the “Insight” (lightbulb) visual type.
- To modify the Insight text, click the ellipsis (…) on the right side of the box and then click “Customize narrative”.

- In the Computations box, the categoryField should have uniqueGroupValuesCount.

- The narrative text can be modified to:
“There were UniqueGroupValues.uniqueGroupValuesCount unique URLs across the dataset.

- The completed visual will be:

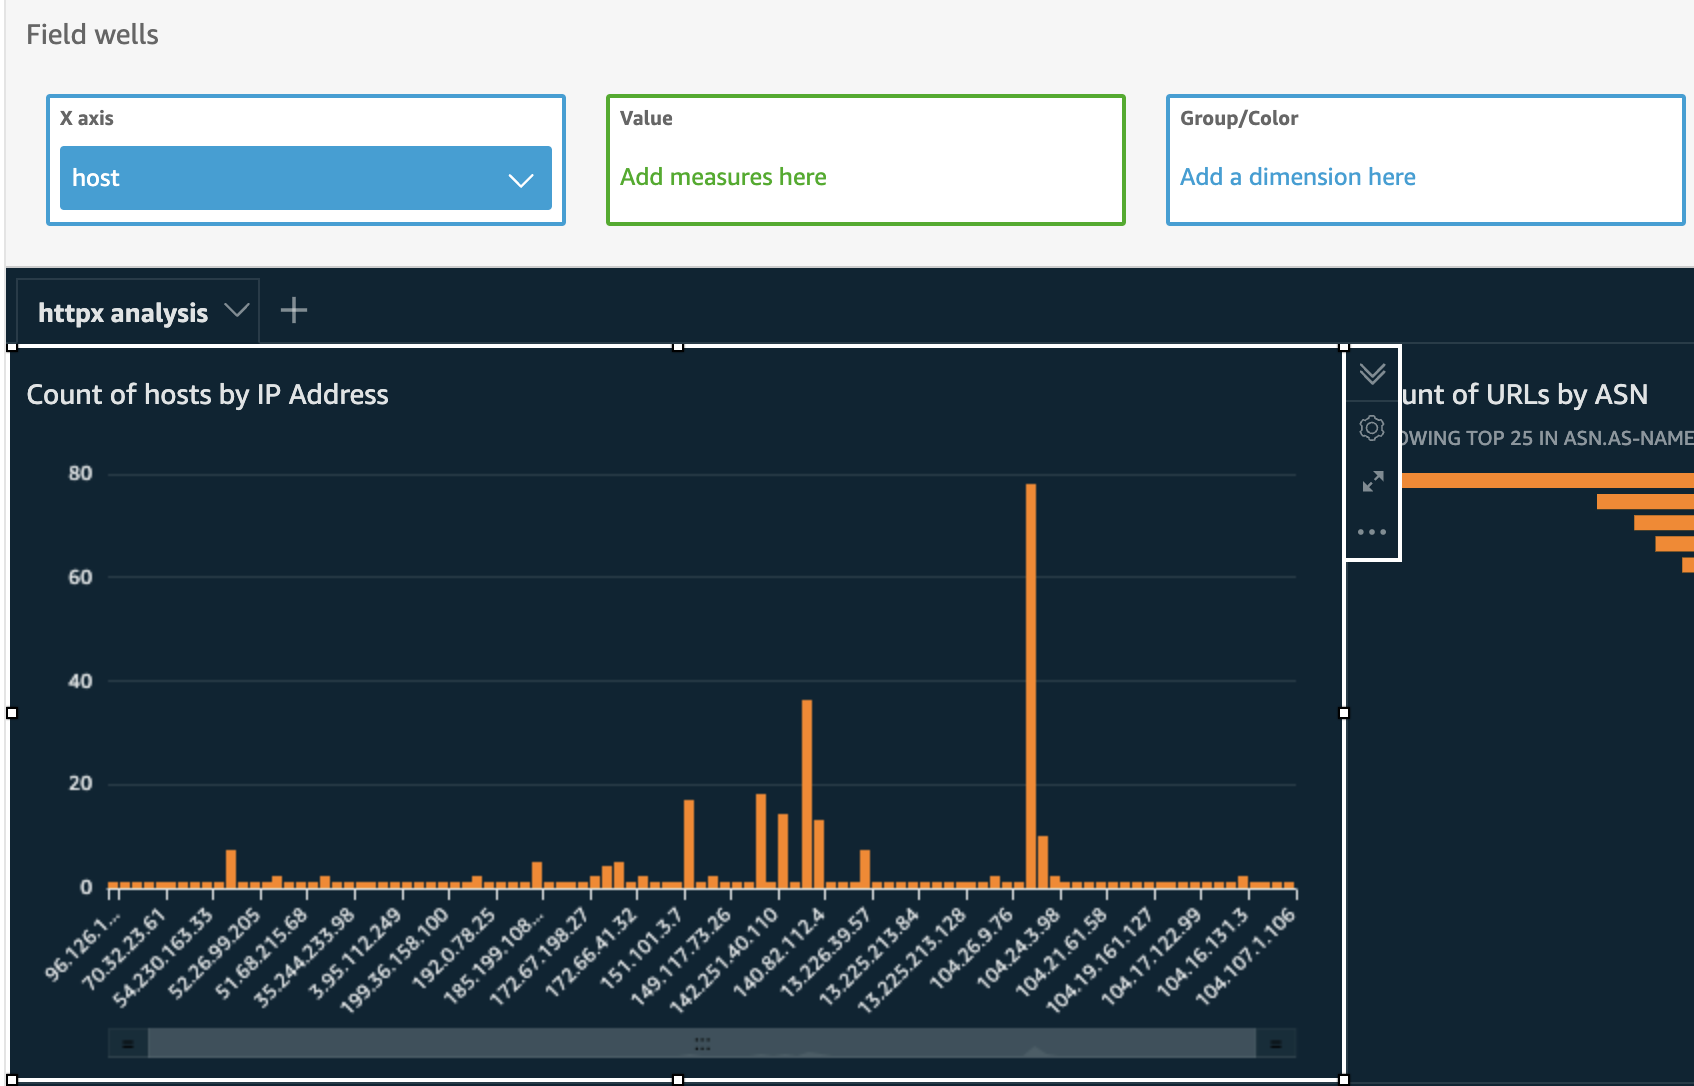
Measurement #3 – Count of URLs by IP Address
The value of this metric highlights the size of a website running on a single or set of IP addresses. Large numbers of URLs on an IP address may indicate more attack surface.
- Click on the “host” field.
- Select “Vertical bar chart” as the visual type.
Measurement #4 – Count of URLs by Web Server
A review of the composition and specific hosting web servers may indicate vulnerable platforms.
- Click on the “webserver” field.
- Select “Pie Chart” as the visual type.

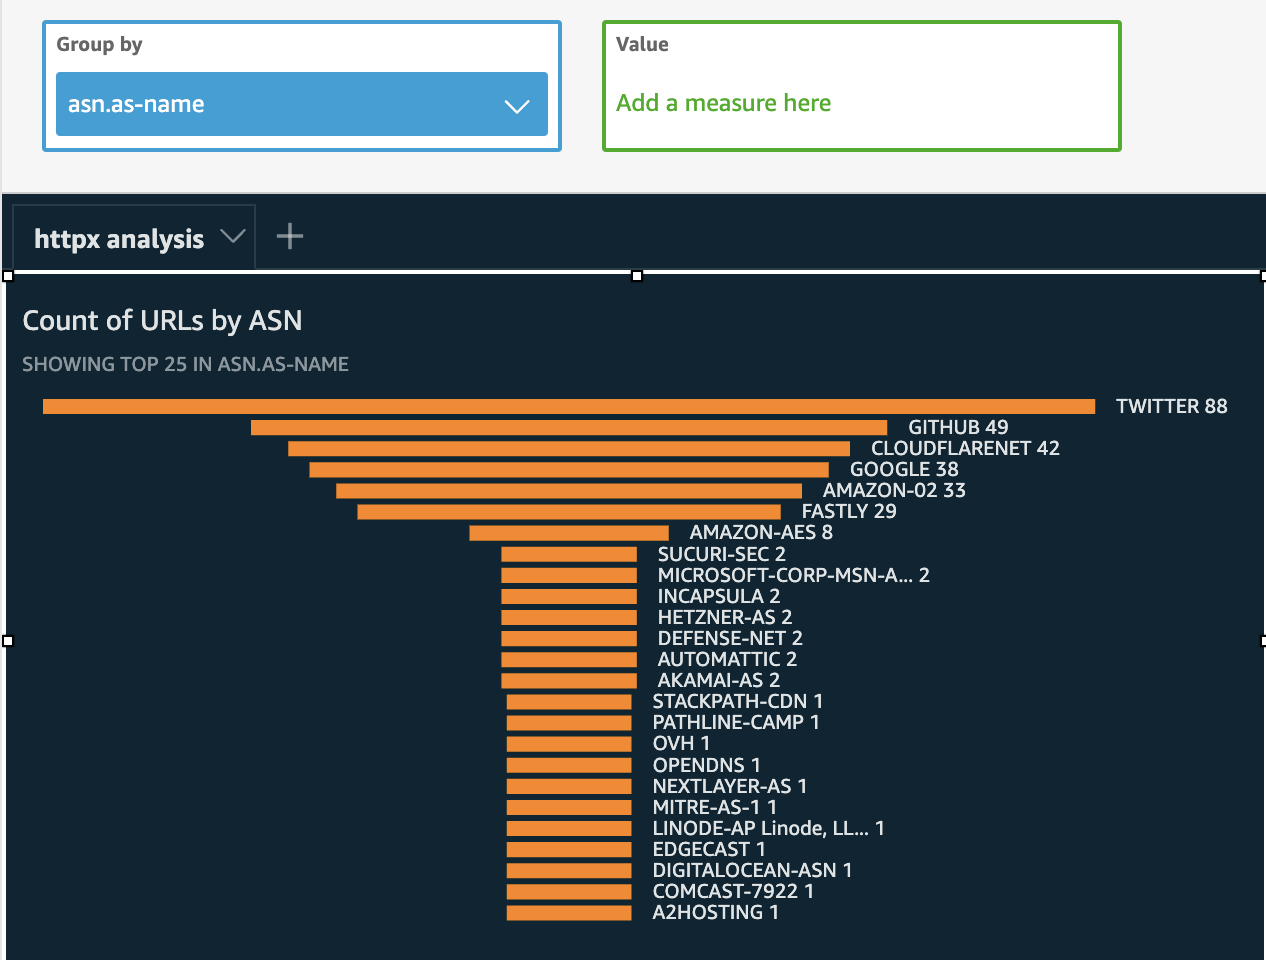
Measurement #5 – Count of URLs by ASN
An autonomous system number (ASN) is assigned to a corporation or entity and includes a block of IP addresses assigned. This information can provide insight into the various hosting services for a target.
- Click on the “asn.as-name” field.
- Select “Funnel chart” as the visual type.
Measurement #6 – Geographic visual of ASN country origins
- Select the “asn.as-country” field.
- Select the “Points on map” visual type.

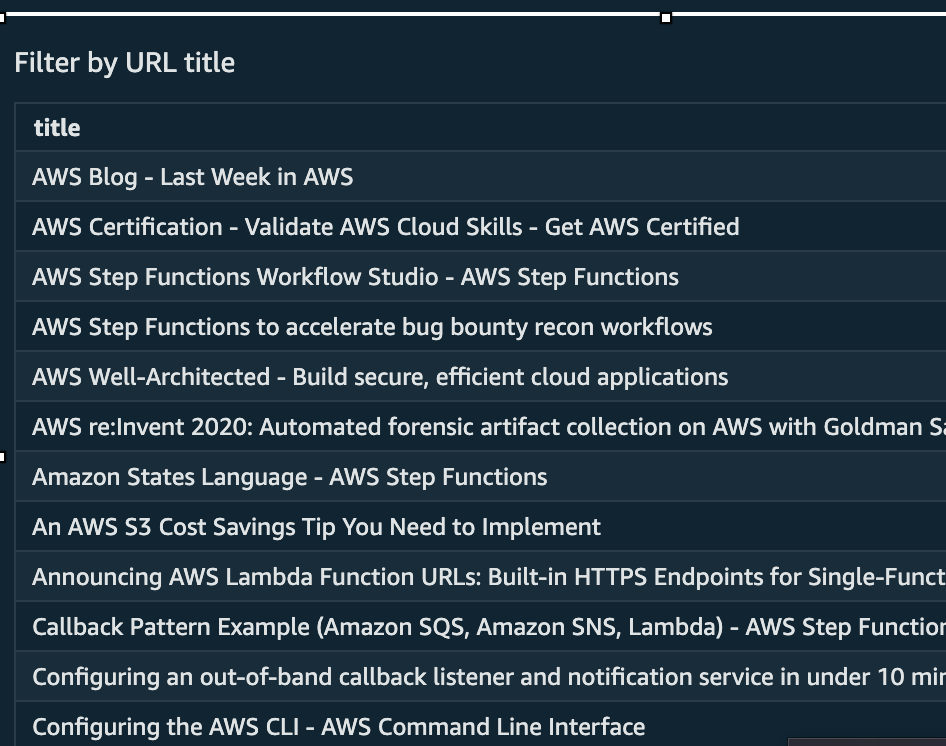
Measurement #7: Filter table based on URL title
With a small sample set, this is not as effective, but when this analysis scales across millions of URLs, you can add a listing of OR filter conditions such as “admin”, “dashboard”, “error”, “tomcat”, etc. to quickly identify URLs of interest.
- Select the “title” field.
- Select the “Table” visual type.
In order to maximize the value of this table, a filter can be added.
- With the Table selected, click the “Filter” tab on the left-side.
- Click “Create one…”

- Select the “Title” field as the filter.
- Click on “Include all” to expand the options.
- For filter type, select “Custom filter” and select “Contains”.
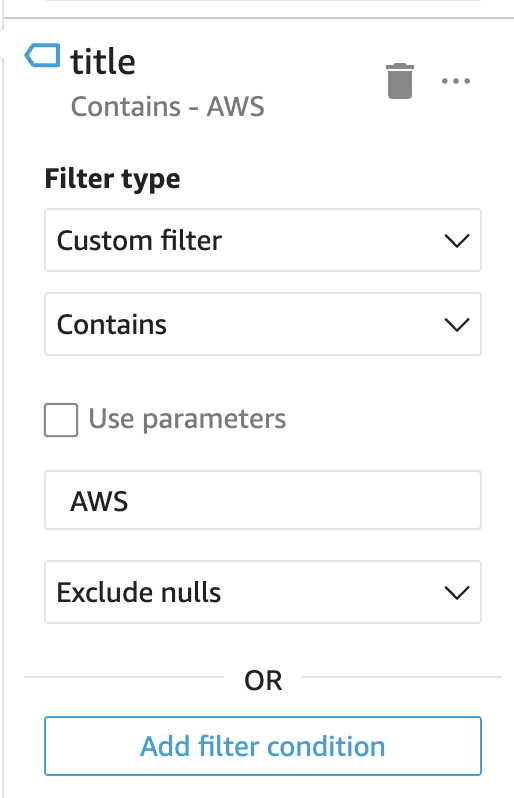
- Once the selections are added, click “Apply”.
- If prompted on whether to change the scope of the filter, select “No”.

- The filtered table will look like:
Quick Insights
In order to add additional visuals, the “Insights” tab can be selected and it will provide a listing of pre-made options to add.

Publishing the Dashboard
Once all of the visuals are organized across the Analysis window, the analysis is ready to be published as a Dashboard.
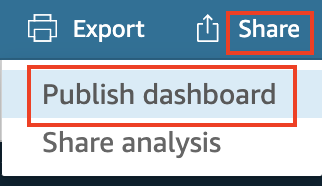
- In the top right corner, select “Share” and click “Publish dashboard”.
- Add the additional checkbox to “Enable ad hoc filtering” as this is convenient as a single user of the dashboard.
- If collaborating with others, sometimes the details behind the visuals may need to remain protected. This is where the download options can be disabled.
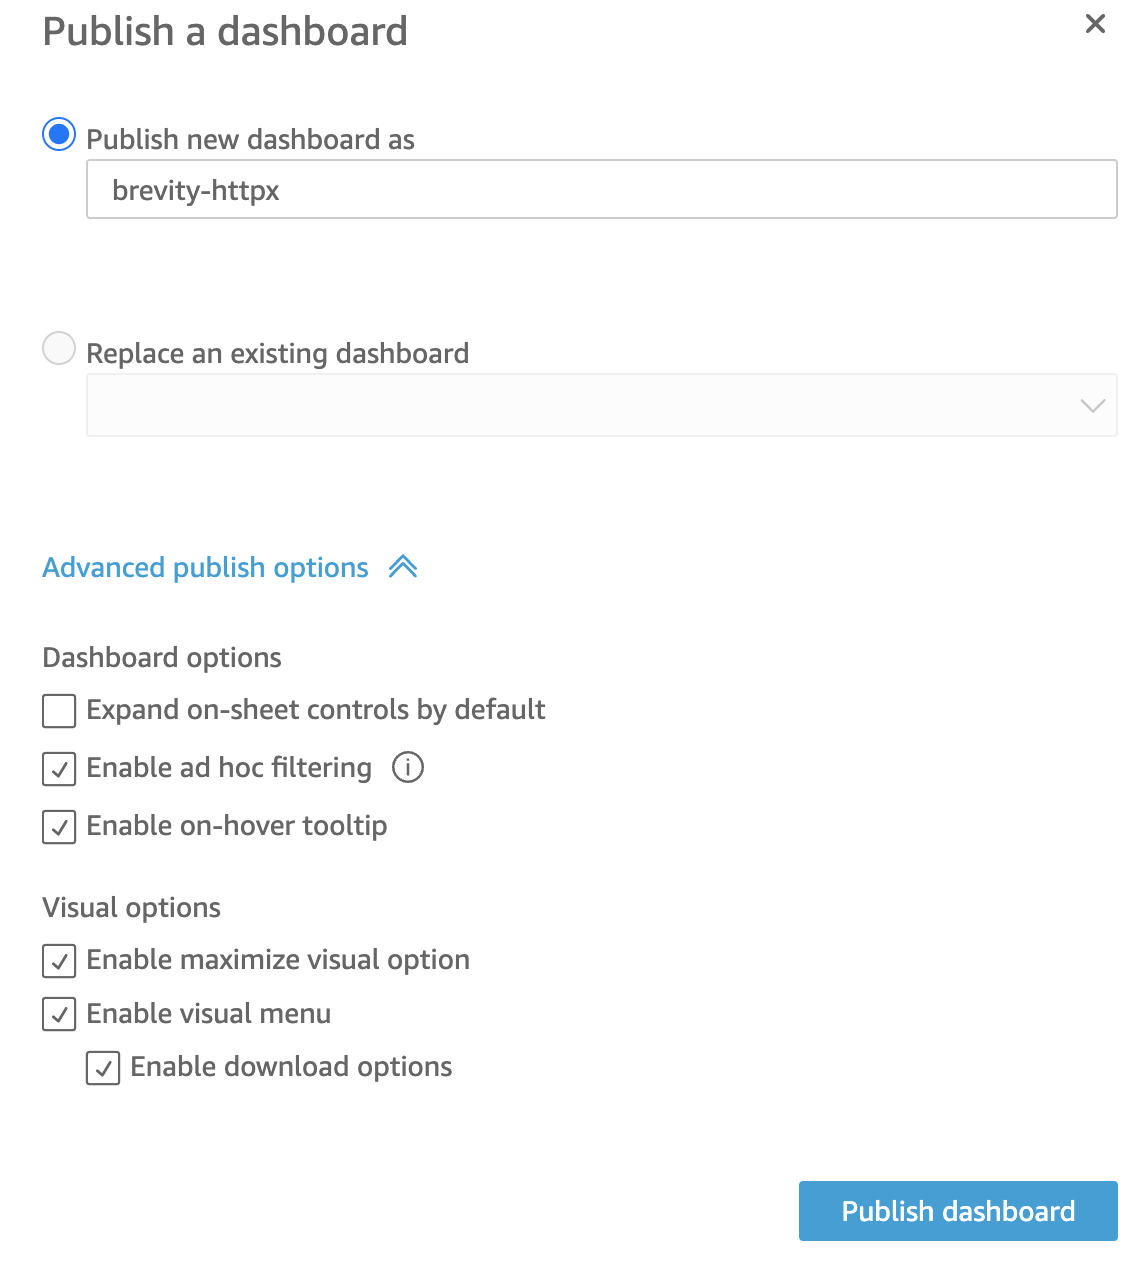
- Click “Publish dashboard”.
- The final dashboard will be available for ongoing analysis as data is added to the S3 bucket.

Expanding the usage
This is only a small use case for beginning the journey into data dashboards and visualizations. The capabilities that can integrate with object-based storage in AWS S3 are very powerful and often underutilized in the hacker community. All future output files added to the bucket will be ingested and displayed when the dataset is refreshed and the solution can scale as the dataset grows. Ad-hoc filtering will result in subsets of data that can be downloaded and further leveraged in bug bounty workflows. As we search for anomalies and outliers, visual images and insights make it much more efficient for the human brain to identify records of interest to further triage and investigate. Happy hunting!
Written by:
Ryan Elkins (@ryanelkins) who has over 15 years of experience leading security architecture and application security programs across multiple industries. Ryan is passionate about software security, cloud automation, sharing knowledge, and supporting other creators. You can learn more at his blog or on GitHub.


