Pros:
• Free to use
• Compatible with hundreds of devices and apps, including Garmin, Wahoo, Lezyne, Hammerhead, Apple, TrainerRoad, and Zwift
• In-app training plans available for purchase
Cons:
• It may be too much if you are not performance-oriented
• For best results, you may need gear like a heart rate monitor and a power meter
If you ride a bike to get fitter and faster, chances are good you’ve heard of TrainingPeaks, the most popular online and mobile coaching platform on the planet.
When you’re on a training ride and folks are rattling off their current CTL (Chronic Training Load) and the TSS (Training Stress Score) of their last ride, and talking about their FTP (Functional Threshold Power) tests, that’s thanks to TrainingPeaks, who trademarked many of the common training terms like TSS and Normalized Power we use today.
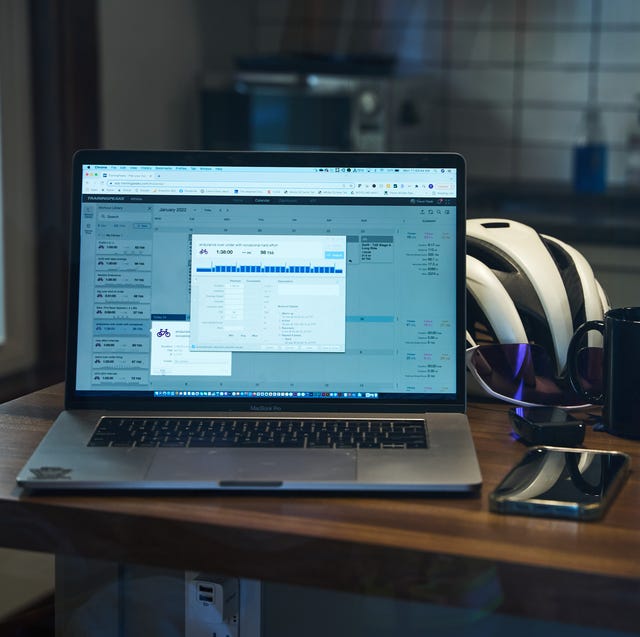
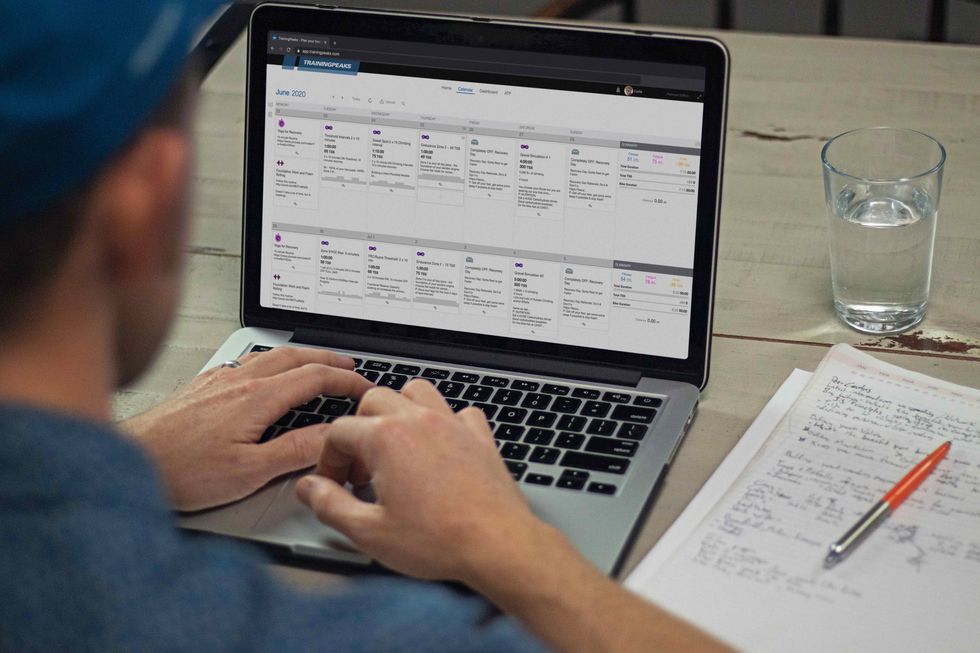
In its most barebones form, TrainingPeaks is a free online training log that allows you to map out and upload your workouts, set goals, add events, and view your workout summaries. To use it at its fullest potential, there’s a premium subscription version for about $10 a month, which provides dozens of metrics and detailed insights on your form and fitness so you can reach your goals. Or, if you work with a coach, you can use the free version and let them dig into the rest.
If you’re new to the platform, especially if you don’t have a coach, all the terminology and analytics can be a bit daunting. So let us simplify it for you. Here’s a dive into how TrainingPeaks works, who it’s best for, and how to get the most out of it.
Related Story: Everything You Need to Know About the FTP Test
Bringing Power Training to the People
When power meters came out in the 1990s, everyone (who could afford one) was geeking out on watts—the new metric that showed exactly how much power you could produce with your pedals. But like heart rate data before it, folks really didn’t know what the numbers meant. They just knew bigger meant more power. How to apply those wattage numbers in training and racing was still a mystery to most.
Then in the 2000s, along came some now-legendary exercise physiologists and analytical coaches including Andy Coggan, Ph.D., Hunter Allen, and Joe Friel who melded the metrics with the human cycling experience to develop a language for training and racing using this new technology.
Joe Friel’s son and then pro cyclist Dirk and his engineering friend Gear Fisher funneled that knowledge into an online coaching and training platform, and TrainingPeaks was born. Now riders had a place where they could upload their rides and receive summaries of their workout based on the power they were producing. More importantly, they could track their progress over time to see if they were becoming fitter and stronger or plateauing or backsliding.
“They changed everything,” says PROthirteen Cycling Coach Lee Sandstead. “They were the first people to talk about watts per kilogram and use it as a metric and put it on a platform to be analyzed and coached. Now if you go on Zwift, you see 10,000 riders using watts per kilogram on any given ride! Everything in training is based off their work.”
How TrainingPeaks works
TrainingPeaks is simple to use. The platform provides detailed instructions for getting started, including setting up your profile and inputting all the relevant training information. The more information you have, such as max and resting heart rate and functional threshold power (FTP, the power you can sustain for one hour as measured by an FTP test), the better your outcome using the platform. If you don’t have heart rate or power data, the app will just set defaults based on your age.
TrainingPeaks is compatible with hundreds of devices and apps, including Garmin, Wahoo, Lezyne, Hammerhead, Apple, TrainerRoad, and Zwift. Any device or app that lets you create a compatible file type (e.g. .fit or .tcx) can be manually uploaded to TrainingPeaks. The only major player you can’t sync directly to TrainingPeaks is Strava. So, if you only use Strava (as opposed to a cycling computer) to track your rides, you’ll need to export the .tcx files.
What TrainingPeaks analyzes
TrainingPeaks analyzes your training load, both in the short term and over time to help you ride (and rest) your way to better fitness on the bike. The more metrics you can provide, the better analysis you get. It works best with a power meter and a heart rate monitor, but you can use it with heart rate alone; it just won’t give you as finely tuned feedback.
There are dozens of metrics you can analyze in TrainingPeaks, including the typical duration, distance, speed, calories burned, elevation, and cadence. The specific personal performance metrics it tracks (for premium users) include:
Training Stress Score (TSS or hrTSS)
This is a metric TrainingPeaks created that assigns a number designating the physiological stress of any given ride based on the intensity and duration of that session. If you use a power meter, it will use your functional threshold power (FTP) as a benchmark. For reference, a 60-minute workout at your FTP would equate to a 100 TSS. If you’re using a heart rate meter alone, you will get an hrTSS score based on your threshold heart rate.
Normalized Power (NP)
Another trademarked TrainingPeaks term, NP is an estimate of the power you could have maintained for the same physiological work if your power had been perfectly constant throughout the session.
Intensity Factor (IF)
This is the ratio of your NP to your FTP. It tells you how intense the ride was relative to your threshold power. It’s used to calculate your TSS.
Variability Index (VI)
This is NP divided by average power. It tells you how steadily paced (or not) your workout was. You’d expect a crit or mountain bike race (which are very punchy) to have a lot of variability (1.3 or higher). But if you’re a time trialist or a triathlete, you may want to see a low variability index (1.05 or less).
Acute Training Load (ATL)
This is a measure of your most recent training load. You can think of it as a rolling average of your TSS over the past seven days. Beginner riders may start around 30 to 50. Experienced, high-volume riders may sit around 100 to 150.
Chronic Training Load (CTL)
This is a weighted average of your daily TSS during the past seven weeks. On the low end, it would be around 40 or 50. It would be 100 to 175 on the high end.
Training Stress Balance (TSB)
This is the balance between your CTL and your ATL. This one matters most when you’re cycling competitively and want to peak for events. Your TSB during heavy training blocks will be negative. Going into an event, you want it to be positive.
Velocity Ascended in Meters (VAM) & VAM w/kg
These are metrics for the climbers in the pack. VAM is used to measure how fast you climbed a particular hill or segment based on the elevation and your speed. VAM w/kg is the watts per kilogram that you generated while climbing.
Mood (as indicated by Emoji)
This isn’t a “metric” that TrainingPeaks provides, but it’s an important one that it tracks—how you felt during your ride. After you finish, the app asks, “How did you feel?” You choose emojis on a scale from Strong (big smiley face) to Weak (big frown face with Xs for eyes). Mood is an important early indicator of too much overreaching without enough rest.
Perceived Exertion
Like Mood, Perceived Exertion is an important metric to track. After your ride, the app asks you to rate your workout on a sliding scale from Very Easy to All Out. It means two very different things if you felt like you were going All Out and felt Weak and unhappy versus if you perceived you were going All Out and felt Strong and happy.
Performance Management Chart (PMC)
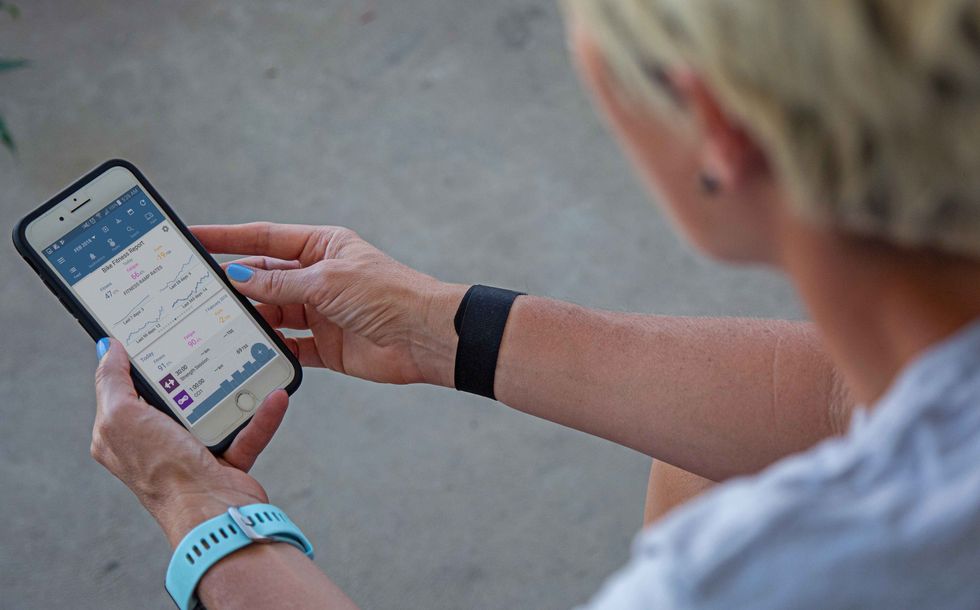
TrainingPeaks boils down all your training metrics into a daily PMC that breaks down your current Fatigue, Fitness, and Form.
😫 Fatigue: This is how tired you are. The metric used to determine this is your ATL. If you just had a big training block, you would expect this number to be high.
🏋🏾 Fitness: This is a measure of how trained you are. The metric used to determine this is your CTL. A high CTL does not necessarily mean you’re ready to rock. You may have high fitness, but also high fatigue. You can show up to a race with a super-high “Fitness” score and easily get beat by someone who has a lower “Fitness” score but is fresher and less fatigued.
🚴🏿♀️ Form: This is the one that helps show how ready you are to perform your best. The metric used for Form is your TSB. “In our world, a rest day is just as or more important as your hard day,” Friel says. “You need your CTL to go down and your TSB to go up when you want to be on form.”
There is an art and science to interpreting all these metrics when it comes to your personal best performance. Any cross-training and/or strength training you do also influence how you feel in ways these numbers may not reflect. And, of course, you can have great numbers and still feel lousy for any number of reasons or have not-so-great numbers and be able to bang out a great ride.
Working with a coach is the easiest way to put them all into perspective and use them to make progress in your training. The platform also has explanatory articles to help you get started.
Related Story:Your 8-Week Century Training Plan
What else does TrainingPeaks do?
Since TrainingPeaks is most powerful when used in conjunction with a coach, it makes sense that the platform is also the number one marketplace for athletes and coaches to find one another. Just fill out a questionnaire and they’ll help match you with a coach that meets your training, goal, and budget needs.
If you’re not interested in a coach, but still want structure, there are in-app training plans available for purchase that automatically populate your training calendar. You also can build workouts and create annual training plans around key events with or without a coach or specific pre-purchased plan.
Finally, you can track personal metrics like weight, heart rate variability (HRV), sleep, resting heart rate, and others to meet health and wellness goals.
Related Story:How to Calculate Your Power to Weight Ratio
What are the downsides?
The main downside to TrainingPeaks is that it is a metric geek’s paradise. You can drown yourself in numbers and charts and graphs and daily, weekly, monthly, yearly analytics. That makes it a powerful tool for serious competitors and a perfect platform for working with a coach, who will do the analytics for you and help you put it all into perspective. But it may be too much if you are not performance-oriented.
If you’re a rider who is interested in seeing the stats from your rides, but not systematically working toward training goals, TrainingPeaks may feel like overkill. It’s also purely a training app. You won’t find social networking and leaderboards here. If that’s your jam, Strava is the place for you.

