Evidence of a small, island-associated population of common bottlenose dolphins in the Mariana Islands
 Karen K. Martien1*‡
  Marie C. Hill2‡
  Frederick I. Archer1
  Robin W. Baird3
  Andrea R. Bendlin4
  Louella Dolar5†
  Allan D. Ligon6
  Erin M. Oleson7 Kelly M. Robertson1
  Samuel M. Woodman8† Adam C. Ü9
  Kymberly M. Yano2
  Amanda L. Bradford7
- 1Southwest Fisheries Science Center, National Marine Fisheries Service, La Jolla, CA, United States
- 2Cooperative Institute for Marine and Atmospheric Research, Research Corporation of the University of Hawai‘i, Honolulu, HI, United States
- 3Cascadia Research Collective, Olympia, WA, United States
- 4Lynker, Leesburg, VA, United States
- 5Ocean Associates, Inc, Arlington, VA, United States
- 6Independent Researcher, Erin, TN, United States
- 7Pacific Islands Fisheries Science Center, National Marine Fisheries Service, Honolulu, HI, United States
- 8Department of Biology, Harvey Mudd College, Claremont, CA, United States
- 9Independent Researcher, Glacier, WA, United States
Small, island-associated populations of cetaceans have evolved around numerous oceanic islands, likely due to habitat discontinuities between nearshore and offshore waters. However, little is known about the ecology and structure of cetacean populations around the Mariana Islands, a remote archipelago in the western Pacific Ocean. We present sighting, photo-identification, and genetic data collected during twelve years of surveys around these islands that reveal the existence of a small, island-associated population of bottlenose dolphins. Nearly half of the photo-identified individuals were encountered in more than one year. Both haplotypic and nuclear genetic diversity among sampled individuals was low (haplotypic diversity = 0.701, nuclear heterozygosity = 0.658), suggesting low abundance. We used mark-recapture analysis of photo-identification data to estimate yearly abundance in the southern portion of the population’s range from 2011 to 2018. Each abundance estimate was less than 54 individuals, with each upper 95% confidence interval below 100. Additional survey effort is necessary to generate a full population abundance estimate. We found extensive introgression of Fraser’s dolphin DNA into both the mitochondrial and nuclear genomes of the population, suggesting at least two hybridization events more than two generations in the past. The Mariana Islands are used extensively by the U.S. military for land and sea training operations. Thus, this unique bottlenose dolphin population likely faces high exposure to multiple threats.
1 Introduction
Many islands are home to small, resident populations of cetaceans (Karczmarski et al., 2005; Parsons et al., 2006; Oremus et al., 2007; Baird et al., 2008; Silva et al., 2008; Tezanos-Pinto et al., 2009; Andrews et al., 2010; Martien et al., 2012; Oremus et al., 2012; Baird et al., 2013; Albertson et al., 2016). The existence of these island-associated populations is surprising given the lack of physical barriers to movement in the oceans and the ability of most cetaceans to travel long distances and thrive in the pelagic realm. The evolution of genetically distinct and demographically independent insular populations may be due to the strong habitat gradients that exist around oceanic islands. The presence of shallow-water habitat, the interaction of islands with prevailing oceanographic and atmospheric currents (known as the island mass effect; Doty and Oguri, 1956; De Falco et al., 2022), and the run-off of nutrient-rich water from islands can all contribute to higher productivity in nearshore waters compared to surrounding pelagic waters. The ecological and behavioral adaptations necessary to exploit insular habitats may serve as barriers to gene flow between insular and pelagic populations and have been invoked as possible explanations for the development of island-associated populations (Hoelzel et al., 1998; Natoli et al., 2005; Möller et al., 2007; Andrews et al., 2010; Martien et al., 2012; Martien et al., 2014a; Albertson et al., 2016; Martien et al., 2017).
The Mariana Islands, henceforth referred to as the Marianas, are a remote archipelago in the western Pacific Ocean, roughly 150 km west of the Mariana Trench. Spanning nearly 900 km from the island of Guam in the south to Farallon de Pajaros in the north, the chain is comprised of 15 islands and numerous atolls and seamounts, with a total land area of only around 1,000 km2 (Figure 1). The southernmost islands of Guam, Rota, Tinian, and Saipan are the largest, comprising nearly 90% of the land area of the archipelago (Eldredge, 1983), and are the only inhabited islands (Williams et al., 2015). Saipan, Tinian, and the small, uninhabited island of Aguijan are henceforth collectively referred to as the 3-Islands region. The archipelago lies within the North Equatorial Current (Suntsov and Domokos, 2013), in the southwestern-most portion of the low-productivity waters of the North Pacific Gyre.
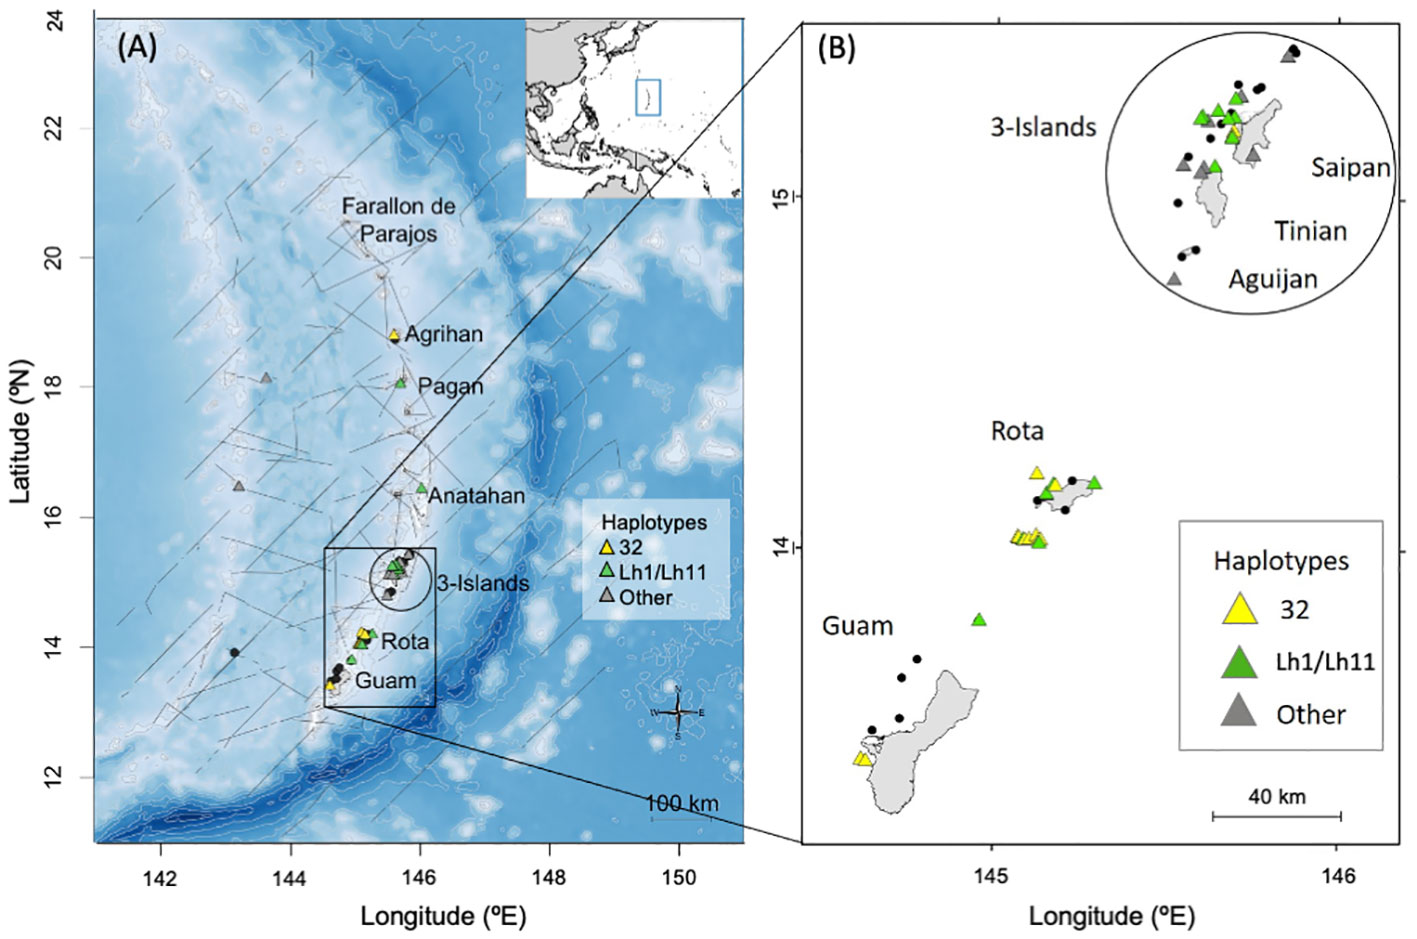
Figure 1 Maps of the Mariana Islands study area showing the locations of bottlenose dolphin group sightings (n = 48) during shipboard (in 2015, 2018, and 2021; panel A) and small-boat (from 2011 to 2019; panels A, B) surveys by PIFSC. Sightings where no samples were collected are depicted by black dots (n=22), while those with biopsy samples are shown with triangles (n = 43 biopsy samples from 26 sightings). In panel (A), light gray lines represent 500m isobaths from depths of 0 to 2,000m and 1,000m isobaths below 2,000m, while dark gray lines represent ship tracks from PIFSC 2015, 2018, and 2021 surveys. Location of the study area within the western Pacific is shown in the inset with a blue rectangle.
The Marianas lie within the Mariana Islands Training and Testing (MITT) Study Area, which serves as the primary U.S. military training location in the western Pacific. Operations within the MITT include large, multinational naval training operations and smaller U.S. joint military training exercises that occur both on land and at sea (Simonis et al., 2020). The high level of military activity on and around the islands raises concerns for marine mammals due to the impacts of ship traffic, pollution from run-off, and mid-frequency active sonar (Parsons et al., 2008; Lawrence et al., 2015; Southall et al., 2016; Forney et al., 2017), the last of which was recently implicated in multiple beaked whale strandings around the Marianas (Simonis et al., 2020).
Until recently, relatively little was known about the marine mammal assemblage in the waters surrounding the Marianas. Most data came from strandings, whaling records, anecdotal reports, and several scientific surveys conducted in the western Pacific that spent short amounts of time (1 to 10 days) in portions of the Marianas (see review in Hill et al., 2020). In 2007, two dedicated cetacean surveys took place in the Marianas – one shipboard line-transect survey that included the portion of the archipelago south of Pagan (Fulling et al., 2011) and one 5-day aerial survey that primarily focused on offshore waters, but included Guam and Rota (Mobley, 2007).
Since 2010, the U.S. National Marine Fisheries Service’s Pacific Islands Fisheries Science Center (PIFSC) has been conducting regular survey work in the Marianas. PIFSC efforts have included small-boat visual surveys in the nearshore waters immediately surrounding the southernmost islands (Guam to Saipan) from 2010 to 2019, and three large shipboard visual and passive acoustic surveys that included oceanic waters surrounding the archipelago in 2015, 2018, and 2021 (Hill et al., 2020; Yano et al., 2022). A primary goal of the PIFSC surveys was to document which species of marine mammals occur within the U.S. Exclusive Economic Zone (EEZ) around the Marianas, as well as to gather data on distribution, abundance, movements, and population structure necessary to designate and assess stocks, as required under the U.S. Marine Mammal Protection Act.
One of the most commonly sighted species during the PIFSC surveys of the Marianas was common bottlenose dolphins (Tursiops truncatus), henceforth referred to as bottlenose dolphins (Hill et al., 2020). Nearly all of the sighted groups occurred close to islands (Figure 1). Six bottlenose dolphins sighted near Rota and the 3-Islands region were satellite tagged and all remained closely associated with the islands and seamounts of the archipelago (Hill et al., 2020).
In a summary of mitochondrial genetic diversity of four cetacean species around the southern islands of the Marianas, Martien et al. (2014b) found very low haplotypic diversity among 14 bottlenose dolphins sampled there, suggesting the existence of a small, island-associated population. Martien et al. (2014b) also found that five out of the 14 bottlenose dolphins possessed haplotypes characteristic of Fraser’s dolphins (Lagenodelphis hosei), which they attributed to introgressive hybridization (Shaw, 2002; Kingston et al., 2009).
In this study, we present sighting, photo-identification, and genetic data supporting the existence of a small, island-associated population of bottlenose dolphins in the waters surrounding the Marianas. We use mark-recapture methods to estimate the abundance of the population in the southern part of its range, and use mitochondrial and nuclear genetic data to investigate the extent of introgression of Fraser’s dolphin DNA into the population. Our results highlight the importance of managing potential human impacts, particularly from military activity, on this small, unique population.
2 Materials and methods
2.1 Study area and data collection
Hill et al. (2020) and Yano et al. (2022) provide an overview of PIFSC shipboard and small-boat survey effort in the Marianas from 2010 to 2021. Three line-transect shipboard surveys consisted of systematic and non-systematic tracklines along the full length of the archipelago in 2015, between Guam and Pagan in 2018 (Hill et al., 2020), and throughout the entire EEZ in 2021 (Yano et al., 2022). The small-boat effort consisted of non-systematic surveys for cetaceans aboard 6–12 m vessels in 2010–2019 (Hill et al., 2020). During each yearly project period, surveys were conducted successively off different island areas (Guam, Rota, and 3-Islands), with the survey team flown between locations. Survey tracks were spread out daily to maximize coverage of each island area, but were also influenced by weather conditions and sea state. Four to six observers collectively scanned 360-degrees around the vessel using unaided eye or handheld binoculars.
Cetacean groups were approached for species confirmation, group size estimation, photo-identification, and biopsy sampling when possible. Digital single-lens reflex cameras with 70–200 mm or 100–400 mm lenses were used to collect photographs of the dorsal fin and surrounding area. During photo-identification efforts, an attempt was made to photograph each member of the group regardless of the distinctiveness of the fin. Biopsy samples were collected remotely using a Barnett RX-150 crossbow and Ceta-Dart bolts with sterilized, stainless steel biopsy tips (25 mm long × 8 mm diameter).
Because some of the biopsied animals included in our data set have previously been shown to exhibit evidence of introgressive hybridization with Fraser’s dolphins (Martien et al., 2014b), we expanded our sample set to include 177 tissue samples collected from bottlenose dolphins in the central and eastern North Pacific (outside of the Marianas) and 47 tissue samples from Fraser’s dolphins collected in the Pacific and Indian Oceans. Most of the additional bottlenose dolphin samples were collected within the U.S. EEZ surrounding the Hawaiian Archipelago (hereafter Hawaiʻi EEZ samples), primarily during either shipboard surveys conducted by the Southwest Fisheries Science Center (SWFSC) and PIFSC or during small-boat surveys conducted by Cascadia Research Collective. All samples were part of SWFSC’s Marine Mammal and Sea Turtle Research Tissue Collection.
2.2 Photo-identification
The processing and analysis of bottlenose dolphin photos were carried out by two to three experienced photo analysts. One person made initial matches of individuals within each sighted group, and those matches were checked by a second analyst. Both analysts also compared the individually identified fins with all others within a particular group to look for missed matches. Marks along the leading and trailing edges of the dorsal fins were used as the primary identifiers, while marks or scars on the body, dorsal fin surface, and peduncle were used as secondary identifiers. Each fin within each photo was rated by a senior photo analyst for quality based on numeric scores within four categories (focus/clarity, contrast/lighting, angle, extent visible) and assigned an overall photographic quality (Q) rating based on the combined scores (Q-1 = high, Q-2 = moderate, Q-3 = poor). Two photo analysts assigned a distinctiveness (D) rating to each individual based on the number, size, and shape of the features located on the leading and trailing edges of the dorsal fin (D-1 = high, D-2 = moderate, D-3 = low, D-4 = clean fin and no marks on the peduncle directly behind the dorsal fin) (see Supplementary Material for quality and distinctiveness rating protocols). If there was a disagreement between analysts on the distinctiveness rating, a third analyst was consulted. After the completion of matching and rating within sighted groups, both analysts compared the identified individuals with high to moderate distinctiveness between groups. The photo-identification catalog included only those fins with high or moderate distinctiveness (D-1 or D-2) and quality (Q-1 or Q-2) ratings.
Only cataloged individuals were used in the mark-recapture abundance estimation in order to reduce the possible bias from false positive or false negative matches (Urian et al., 2015). Recaptures of cataloged individuals with lower quality photos were retained as supplemental sighting records but were not used in the mark-recapture analysis. Individuals with low to no fin distinctiveness were retained within group sighting folders for estimation of the proportion of distinctive individuals in each sighted group.
2.3 Mark-recapture modelling and abundance estimation
A mark-recapture analysis was conducted to estimate the abundance of bottlenose dolphins within the southern islands (Guam to Saipan) of the Marianas. There were not sufficient data to allow abundance estimation in the northern portion of the archipelago, where surveys were limited due to its remoteness.
Abundance was estimated using the POPAN formulation of the Jolly-Seber open population model, which allows for births, deaths, immigration, and emigration in the study population between sampling periods (Schwarz and Arnason, 1996). Models were constructed and subsequently fit using the package RMark (v. 2.2.7; Laake, 2013), an interface for Program MARK (White and Burnham, 1999), written in the statistical programming language R (R Development Core Team, 2022). Estimated parameters include the super-population size (N), which is the total number of distinctive bottlenose dolphins that used the study area during the study period; the apparent survival probability (φ), which is the probability of dolphins surviving between the sampling years i and i + 1 and being available for recapture; the capture probability (p) of individuals within the study area; and the probability of entry (b), which is the probability that an individual from the super-population entered the population within the study area either by acquiring identifiable marks or immigration between years i and i + 1. Assumptions of the modeling framework are that (1) markings on all distinctive individuals were unique, permanent, and correctly identified; (2) distinctive individuals had an equal survival probability; (3) distinctive individuals had an equal capture probability; (4) there was independence between distinctive individuals in terms of survival and capture; (5) sampling was instantaneous; and (6) the study area was constant. The first assumption was likely met by the use of thorough photo-identification procedures and restriction of the data set to distinctive individuals represented by moderate to high quality images. An evaluation of dorsal fin mark changes of cataloged individuals was conducted by comparing the best images for each individual from all sighted groups and documenting the number and size of the new marks. Although 25% of the cataloged bottlenose dolphins had mark changes on their dorsal fins, none had changes significant enough to cause misidentification.
Differences in survival and capture probabilities between distinctive individuals were unlikely, but other potential factors influencing capture probability, including time and effort, were modeled. Dependence between individuals (e.g., resulting from social behavior) can lead to overdispersion in the sighting data, which was addressed using goodness-of-fit testing as described below. Potential violations to assumptions five and six were likely given variability in the location, spatial extent, timing, and duration of each survey effort (Table 1). In order to address this sampling variability, captures of individual bottlenose dolphins made during the same year were pooled into yearly encounters (i.e., individuals were tallied as encountered or not within each year), and each year was treated as a sampling occasion. Eight capture occasions were represented by each year of the study (2011–2018; see Results for details of why 2010 and 2019 were excluded from the mark-recapture analysis). Sensitivity analyses were conducted to address the potential bias from the non-instantaneous capture occasions and the variability in survey timing and extent (see Supplementary Materials for sensitivity analysis methodology).
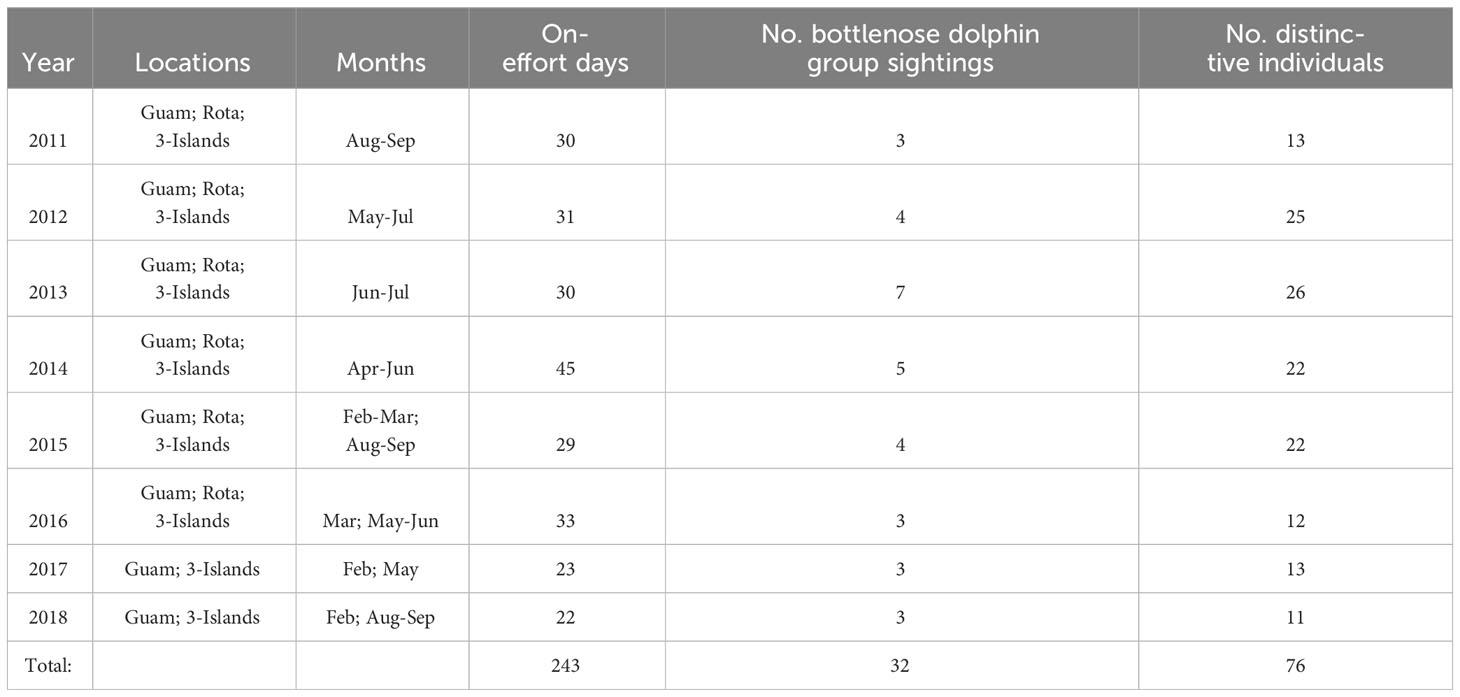
Table 1 Summary of cetacean visual survey effort within the southern Marianas study area from 2011 to 2018 by year and survey area (Guam, Rota, 3-Islands = Saipan, Tinian, Aguijan), including the number of bottlenose dolphin group sightings during which high and moderate quality photos were collected and the resulting number of distinctive individuals used for mark-recapture analysis (i.e., the number of distinctive individuals excludes within-year recaptures).
Models were built with the apparent survival probability held constant, φ(.), to facilitate parameter estimation with sparse data. In addition, given the longevity of bottlenose dolphins relative to the length of this study, detectable changes in true survival were not expected. Capture probability was modeled with time dependence by year, p(t), linear dependence on survey effort, p(eff), or held constant, p(.). The probability of entry was modeled with time dependence by year, b(t), or held constant, b(.). Given the confounding of the initial p and b (Schwarz and Arnason, 2021), an additional time-dependent model of capture probability, p(t*), was included for testing with b(t) (i.e., model φ(.) p(t) b(t) N(.) was replaced with φ(.) p(t*) b(t) N(.)). In p(t*), capture probability was assumed to be equal across the first two sampling years. Models were fitted using a logit link function for φ and p, the multinomial logit link function for b, and a log link for N.
Goodness-of-fit of the fully time-dependent model was assessed within RMark by calling the program RELEASE (Burnham et al., 1987) to obtain an estimate of overdispersion by calculating the variance inflation factor (ĉ) (Lebreton et al., 1992). For a correctly specified model, ĉ should be approximately equal to one (Cooch and White, 2022). A ĉ > 1 is indicative of overdispersion in the encounter data, which is mitigated by multiplying all variance estimates by ĉ (Cooch and White, 2022).
Models were evaluated using Akaike’s information criterion (Akaike, 1973) corrected for small sample sizes (AICc) (Burnham and Anderson, 2002). The best model had the lowest AICc value and other models were ranked based on their ΔAICc from the best model. If ĉ was determined to be >1 in the base model or sensitivity analyses, quasi-AICc (QAICc) values were calculated (Anderson et al., 1994). To account for model uncertainty, weighted averages of the model parameters and derived yearly abundance estimates of distinctive individuals in the study area (Ni) were calculated across all models proportional to their Akaike weights.
Because the yearly estimates of Ni account for only distinctive individuals, the estimates were corrected to also account for non-distinctive individuals. The Ni estimates were adjusted using the proportion of distinctive individuals (θ) encountered following Bradford et al. (2018). In brief, θ was calculated as the mean proportion of distinctive individuals (D-1 and D-2) across sighted groups with four or more individuals, as proportions from small groups may be biased. Non-distinctive individuals (D-3 and D-4) within each group were differentiated using secondary and ephemeral marks. Only individuals represented by high or moderate quality photos were used to estimate θ. The yearly abundance of all individuals (distinctive and non-distinctive) in the study area was then estimated:
where Ntotal,i is the abundance of all individuals associated with the study area at each capture occasion i, where i = 2011, 2012, …, 2018, and Ni is the model-averaged abundance of distinctive individuals at each capture occasion i. The delta method (Seber, 1982) was used to estimate the variance (var) of Ntotal,i:
Log-normal 95% confidence intervals for Ntotal,i were calculated as in Burnham et al. (1987).
2.4 Genetic data generation
DNA extractions were performed using either a silica-based filter purification (Qiaxtractor, DX reagents; Qiagen) or a sodium chloride protein precipitation (Miller et al., 1988). Standard protocols were used for PCR amplification, as well as for mitochondrial DNA (mtDNA) sequencing (Saiki et al., 1988; Sambrook et al., 1989; Palumbi et al., 1991). A 400 basepair region of the 5’ end of the hypervariable mtDNA control region was amplified using the primers and conditions described in Martien et al. (2012), with the exception that the annealing temperature was changed to 56°C to increase amplification efficiency. Both the forward and reverse strands of the amplified DNA product were sequenced as mutual controls on the Applied Biosystems Inc. (ABI) 3730 DNA Analyzer. All sequences were aligned using Sequencer v4.1 software (Gene Codes Corp., 2000).
Samples were analyzed using microsatellite DNA primers for fourteen loci (all dinucleotide repeats): KWM1b, KWM2a, KWM2b, and KWM12a were derived from killer whales (Orcinus orca; Hoelzel et al., 1998); D5 from beluga whales (Delphinapterus leucas; Buchanan et al., 1996); Ttr11, Ttr34, Ttr48, Ttr58 (Rosel et al., 2005), TexVet5, TexVet7 (Rooney et al., 1999), and D08 (Shinohara et al., 1997) were all derived from bottlenose dolphins (Tursiops sp.); EV94 from humpback whales (Megaptera novaeangliae; Valsecchi and Amos, 1996); and SL125 from spinner dolphins (Stenella longirostris; Galver, 2002). Extracted DNA was amplified using a 25 μL reaction of 1x PCR buffer (50 mM KCl, 10 mM Tris-HCl, pH 8.3, and 1.5 mM MgCl2), 0.15 mM of each dNTP, 0.3 μM of each primer, 0.5 units of Taq DNA polymerase, and approximately 10 ng of DNA. The PCR cycling profile consisted of 90°C for 2.5 min, followed by 35 cycles of 94°C for 45 sec, 1 min at annealing temperature, and 72°C for 1.5 min, then a final extension at 72°C for 5 min. The optimal annealing temperatures were 55°C (D08, TexVet5, TexVet7, Ttr48, Ttr11, and SL125), 45°C (KWM1b, KWM2a, KWM2b, and KWM12a), 57°C (D5 and Ttr34), 52°C (EV94), and 60°C (Ttr58).
The amplifications were assessed for quality and size on a 2% agarose gel prior to sequencing. ABI Genemapper v4.0 and an internal standard marker (Genescan-500 ROX, Applied Biosystems Inc.) were used to determine allele fragment size.
Samples were genetically sexed by amplification and Real-Time PCR (Stratagene) of the zinc finger (ZFX and ZFY) genes (Morin et al., 2005).
2.5 Data review
Prior to analysis, the mtDNA and nucDNA data sets were reviewed for quality using the standards described in Martien et al. (2014a) and Morin et al. (2010). This included 10% random replication, re-sequencing of unique haplotypes, having all allele size calls reviewed by two independent genotypers, and eliminating samples deemed to be of poor quality.
For the bottlenose dolphin data set, each microsatellite locus was assessed for deviations from Hardy-Weinberg equilibrium (HWE) using tests for heterozygote deficiency (Raymond and Rousset, 1995) and exact tests of HWE (Guo and Thompson, 1992), as implemented in the R package strataG (Archer et al., 2017). The same software was used to evaluate linkage disequilibrium for each pair of loci using Fisher’s method and the Markov chain method. All HWE and linkage disequilibrium tests were conducted using 1,000 dememorization steps, 10,000 batches, and 1,000 iterations per batch. The tests were conducted separately for the Marianas and the Hawaiʻi EEZ and combined across the two strata to calculate a global P-value for each locus (Fisher, 1935). The jackknife procedure described in Morin et al. (2009) was used to identify samples that were highly influential (i.e., log-odds greater than two) in deviations from HWE. The genotypes identified by the jackknife procedure were removed from the data set. HWE and linkage disequilibrium analyses were not conducted for the Fraser’s dolphin data set, as there were not enough samples in that data set to stratify into putative populations, and equilibrium is not expected when samples from multiple populations are combined into a single stratum.
Pairs of samples that matched in sex, mtDNA haplotype, and microsatellite genotype were considered duplicate samples. In addition, all samples from the Marianas were confirmed to have come from unique individuals via photo-identification. The software program DROPOUT (McKelvey and Schwartz, 2005) was used to identify additional pairs of samples whose genotypes differed at four or fewer loci. These pairs could represent duplicate samples with genotyping errors. One sample from each duplicate pair was removed prior to analysis. We also used DROPOUT to calculate the probability of two randomly selected individuals sharing an identical genotype.
Martien et al. (2012) conducted genetic analyses on bottlenose dolphins sampled from the main Hawaiian Islands, which included mitochondrial control region sequences from 119 animals and genotypes from 116 animals at eight of the 14 microsatellite loci used in this study. We included the data from Martien et al. (2012) in all of our mtDNA analyses. However, we did not include nucDNA data from Martien et al. (2012) since doing so would have substantially reduced the number of microsatellite loci.
2.6 Genetic diversity and ancestry
We calculated haplotypic diversity (h) and nucleotide diversity (π) for the mtDNA data set using strataG (Archer et al., 2017). These calculations were made both including and excluding the Marianas individuals that possessed Fraser’s dolphin haplotypes, as those individuals strongly influence diversity estimates. For the nucDNA data set, we used strataG to calculate average number of alleles per locus, expected and observed heterozygosity, and allelic richness. The nucDNA diversity estimates include all individuals, regardless of haplotype.
To estimate the proportion of the nuclear ancestry of the Marianas animals that comes from bottlenose and Fraser’s dolphins, we used the Bayesian clustering program STRUCTURE (Pritchard et al., 2000; Falush et al., 2003; Hubisz et al., 2009). We first used STRUCTURE to analyze all bottlenose dolphin samples, clustering them into K = 1 to 6 groups using an admixture model with correlated allele frequencies and no prior information on group membership. We then re-ran the same analysis, but included the Fraser’s dolphin samples and examined values of K from 1 to 4. In each case, the range of K values was chosen to span the number of clusters STRUCTURE was likely to detect. We evaluated the different values of K by computing both the posterior probability for each value of K (L(K)) and the second order rate of change of the likelihood with respect to K (ΔK) (Evanno et al., 2005) and by examining the extent to which individual samples were clearly assigned to a cluster.
We conducted two STRUCTURE analyses using the USEPOPINFO option to look for evidence of Fraser’s dolphin ancestry in the nuclear genomes of the Marianas animals. In the first analysis, all bottlenose dolphin samples, including those from the Marianas, were labeled as bottlenose dolphins and all Fraser’s dolphin samples as Fraser’s dolphins. STRUCTURE then estimated the probability that each Marianas sample was a migrant (i.e., pure Fraser’s dolphin), had a Fraser’s dolphin parent (F1 hybrid), or had a Fraser’s dolphin grandparent (F2 hybrid). In the second USEPOPINFO analysis, we did not assign a species label to the Marianas samples. Thus, the analysis used an uninformative prior as to the species origin of the Marianas samples and estimated the proportion of their nuclear ancestry that came from each species. To examine the impact of unequal sample size on the results, we repeated both of the USEPOPINFO analyses but subsampled the non-Marianas bottlenose dolphins to equal the sample size for Fraser’s dolphins. For all of the USEPOPINFO analyses, we assumed that allele frequencies were independent between the two species.
All STRUCTURE analyses were run with a burn-in of 100,000 steps and a run length of 500,000 steps. We replicated each run 10 times and averaged the ancestry coefficients of individuals across replicate runs using the CLUMPP algorithm of Jakobsson and Rosenberg (2007). For the analyses that used a subset of the bottlenose dolphin samples, a different random subset was chosen for each of the 10 replicate runs. All STRUCTURE and CLUMPP analyses were conducted within strataG (Archer et al., 2017).
3 Results
3.1 Data collection
Across all PIFSC survey effort in the Marianas, there were 48 bottlenose dolphin groups sighted, 40 from the small-boat surveys and eight from the ship surveys (Hill et al., 2020; Yano et al., 2022). More than half of the sighted groups (52%, n = 25) were found in water depths less than 200 m and most (83%, n = 40) were found in water depths less 800 m (Figure S1). All but four were within 20 km from shore (Figure S1). During the shipboard surveys there were only four bottlenose dolphin groups from which photographs were collected, two in offshore waters and one each off the northern islands of Pagan and Agrihan. There were no bottlenose dolphin groups sighted during small-boat surveys in 2010, and only one group sighted during small-boat surveys in 2019 from which photographs were collected. Given the limited data from the 2010 and 2019 small-boat surveys, as well as from the shipboard surveys, mark-recapture analyses were based only on data from 2011 to 2018 small-boat surveys in the southern portion of the archipelago.
A total of forty-three biopsy samples were collected from five bottlenose dolphin groups sighted during shipboard surveys and from 20 groups sighted during small-boat surveys (Figure 1). Fifteen of the biopsies were collected prior to 2014 and were also part of the sample set used by Martien et al. (2014b). These fifteen samples were included in the nuclear DNA data set (see below). The remaining 28 biopsies were new to this study and were only included in the mitochondrial DNA and genetic sex data sets. All of the biopsies collected prior to 2014 and 25 of the 28 collected after 2014 were taken within 20 km of shore, and were considered part of the Marianas population for genetic analyses. The remaining three were taken more than 150 km from shore and were included in the western Pacific genetic stratum (see below).
3.2 Photo-identification and individual encounter histories
A total of 243 days of small-boat surveys were conducted within the southern Marianas study area (Figure 2) in 2011–2018, resulting in 32 sightings of bottlenose dolphin groups during which high to moderate quality photos of distinctive individuals were collected (Table 1). The resulting southern Marianas photo-identification catalog included 76 distinctive individuals represented by 144 yearly encounters (Figure S2A)1. In addition, the two sightings of groups in offshore waters and two sightings of groups off the northern islands of Pagan and Agrihan during shipboard surveys resulted in catalogs of six and four individuals for offshore and the northern islands, respectively. No matches were found between the separate catalogs, and no individuals were resighted offshore or in the northern islands.
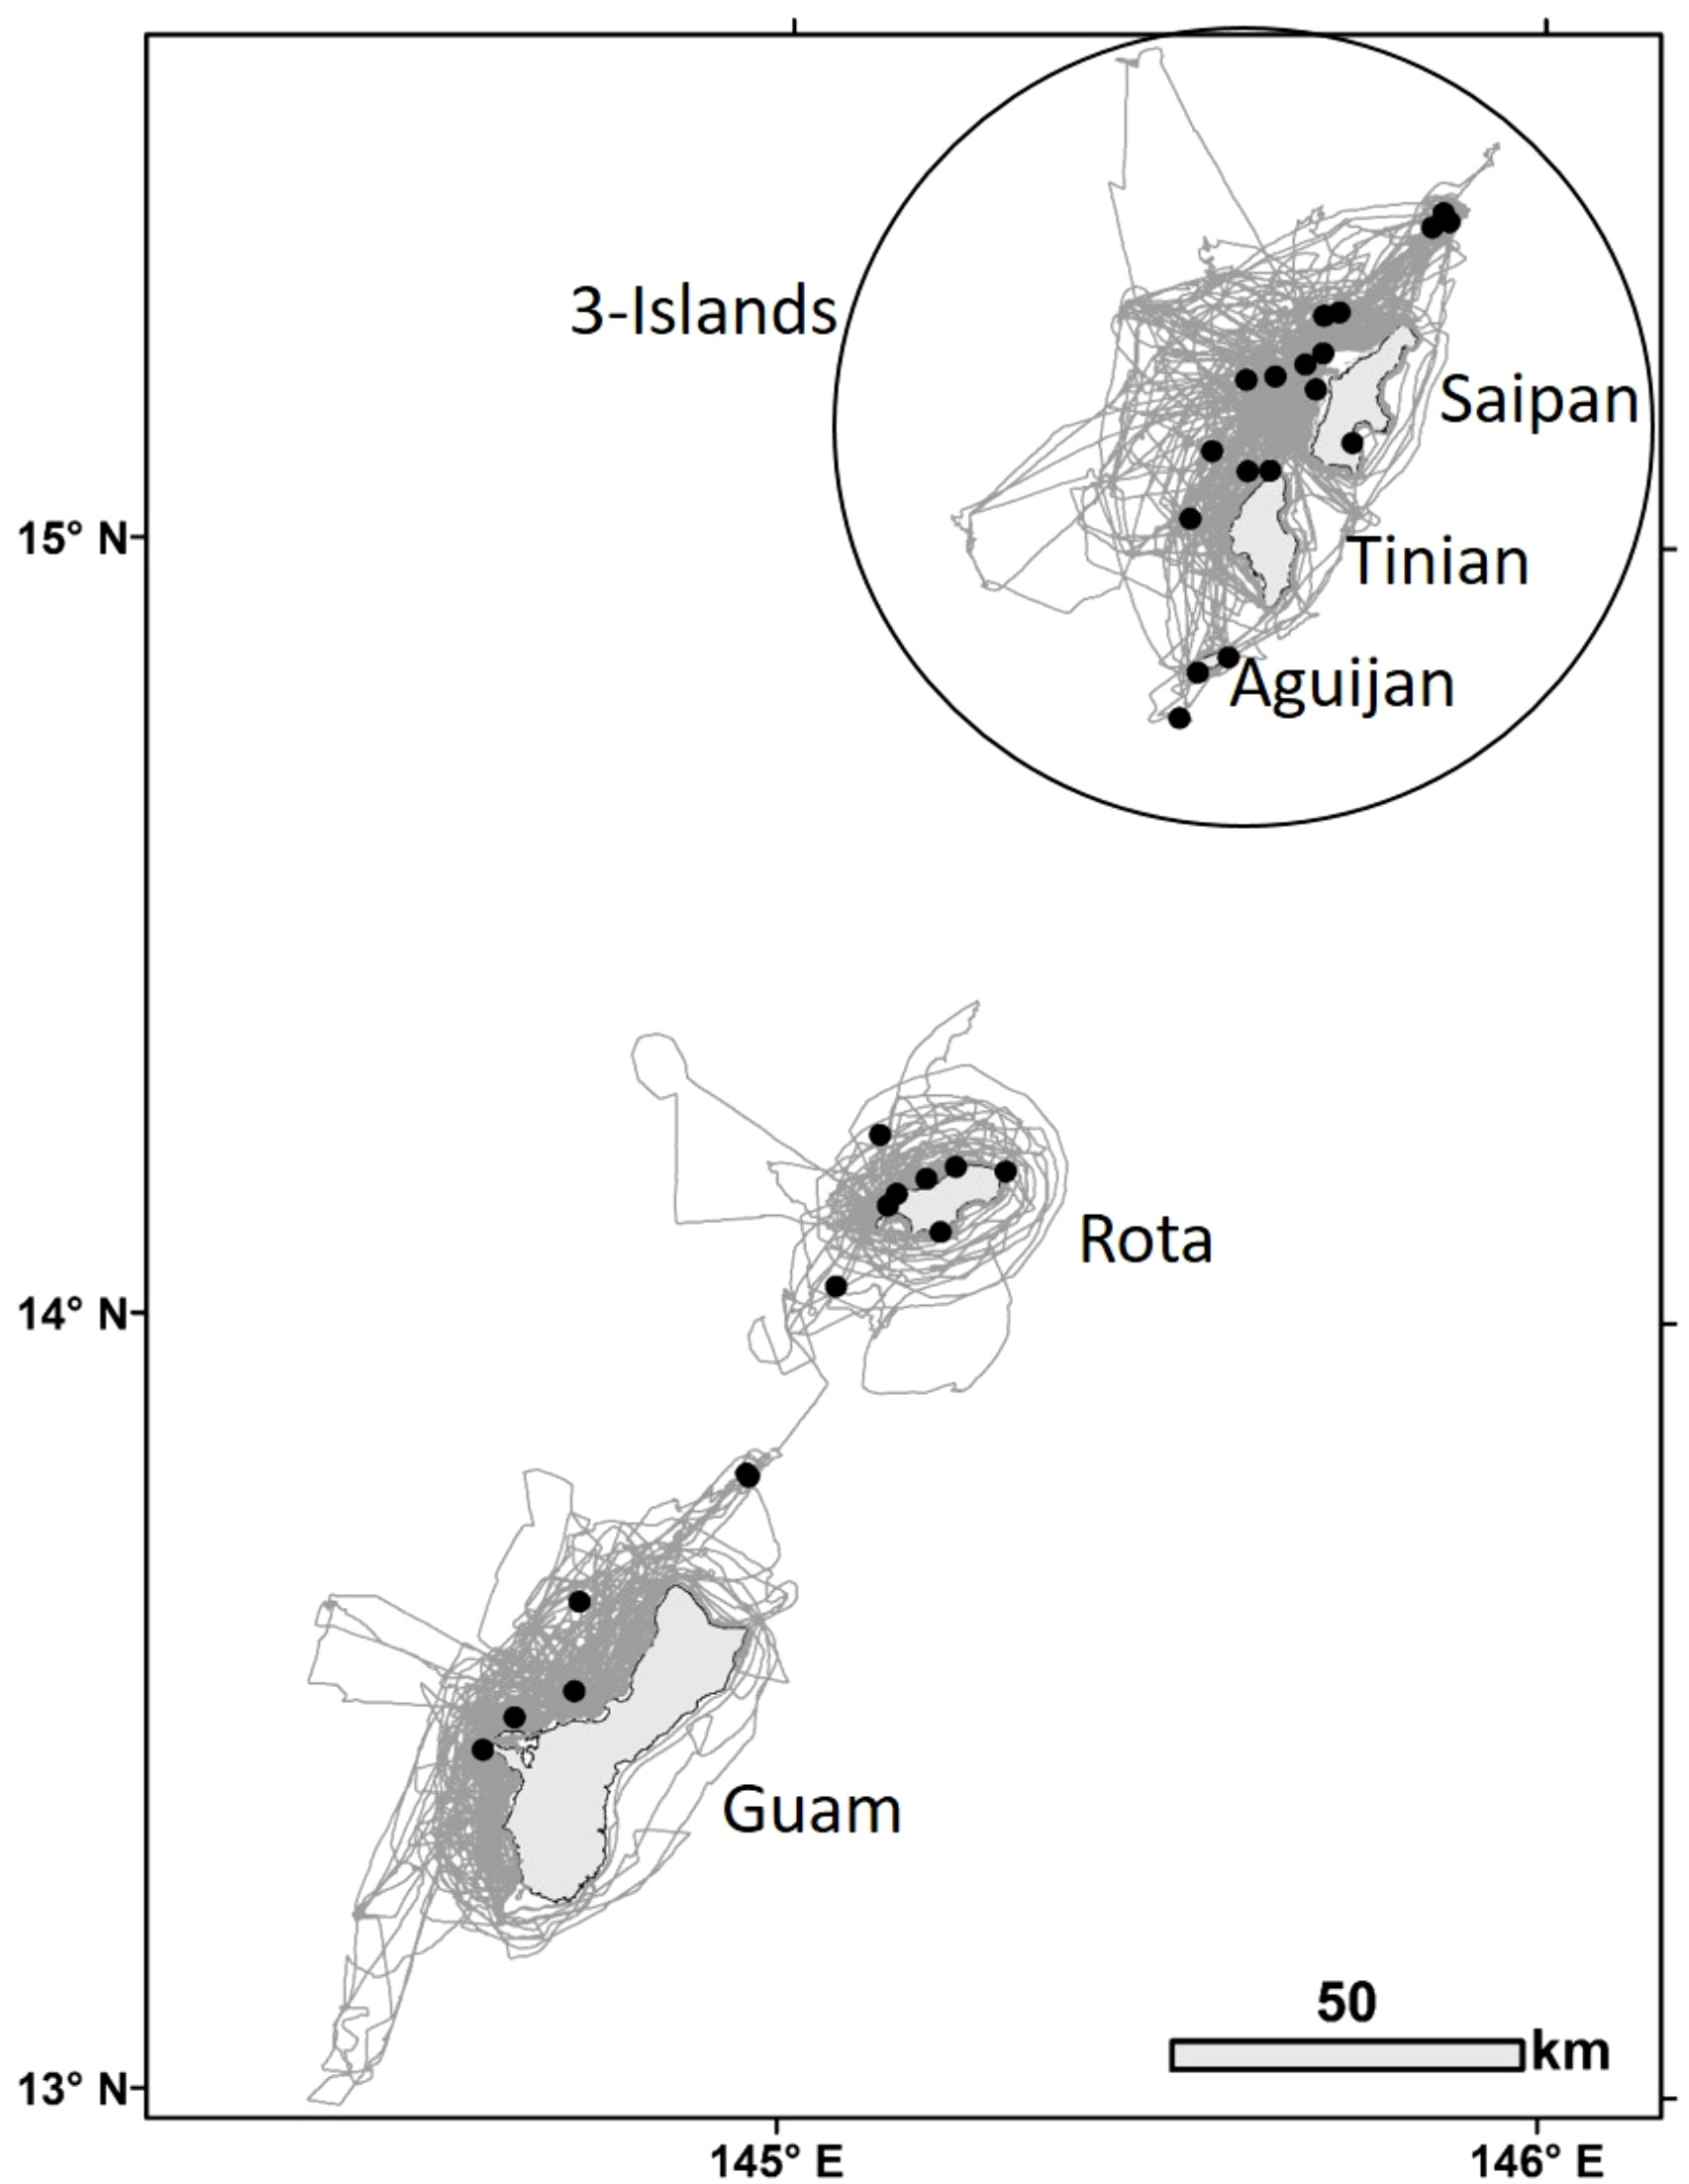
Figure 2 Bottlenose dolphin group sightings (black dots, n=32) for which high to moderate quality photos were taken of distinctive individuals during small-boat survey effort (gray lines) within the southern Marianas study area from 2011 to 2018.
Approximately half (47%, n = 36) of the cataloged individuals from the southern islands were encountered in more than one year, and 25% (n = 19) were encountered in three or more years, although no dolphins were seen in more than five years of the eight-year study (Figure 3A). The length of individual encounter histories ranged from one to 8 years (Figure 3B). Resightings occurred between all pairs of island groups (Table 2).
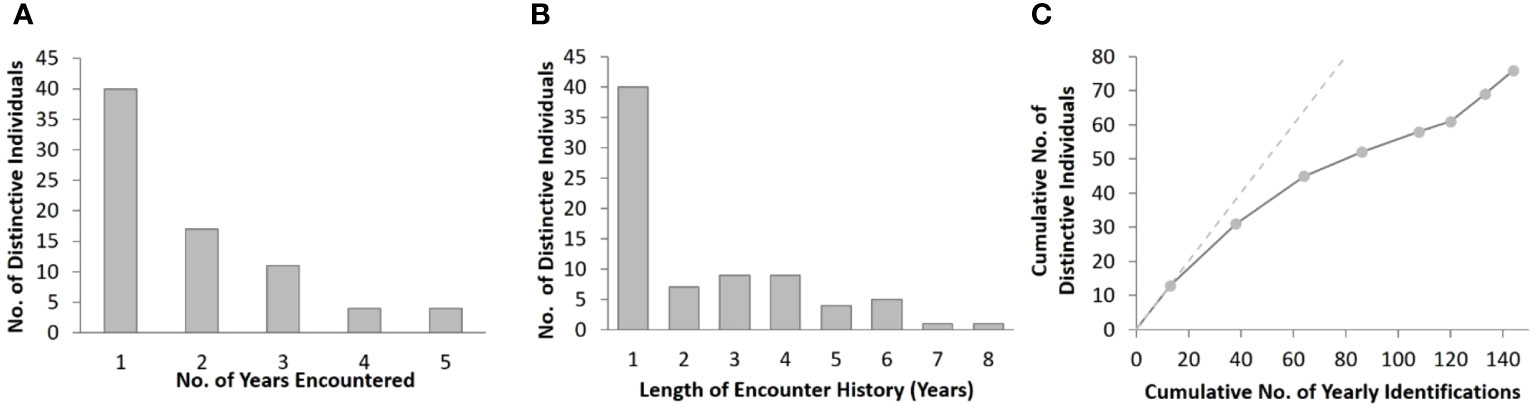
Figure 3 Summary of distinctive bottlenose dolphins encountered in the southern Marianas study area from 2011 to 2018 showing (A) the frequency of yearly encounters, (B) frequency of encounter history lengths, and (C) rate of discovery of distinctive individuals. The discovery curve relates the cumulative number of yearly encounters (n = 144) to the cumulative number of distinctive individuals (n = 76). The points represent each year of the study period, and the dashed line demonstrates the trajectory that would have resulted if each encountered distinctive individual was previously unidentified.
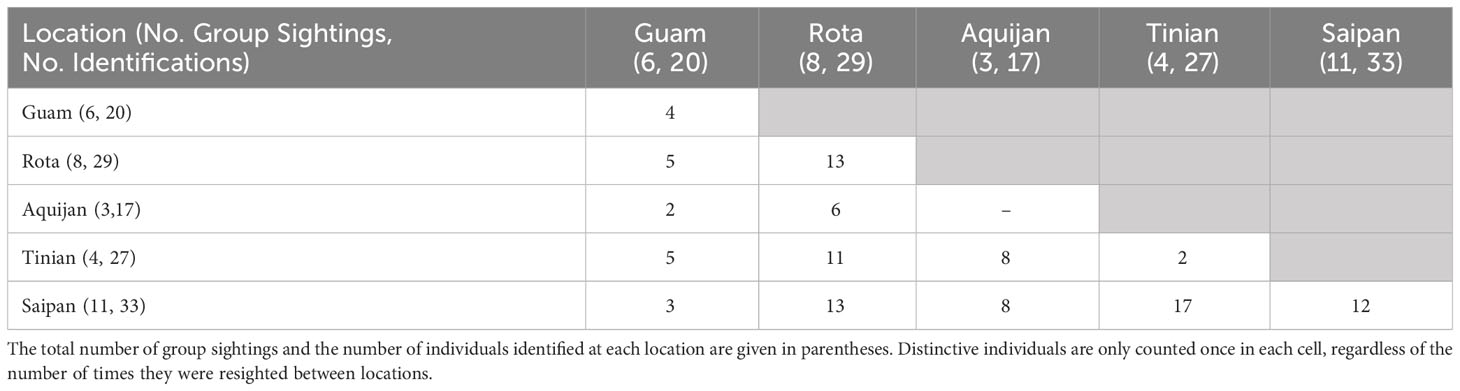
Table 2 Number of distinctive individuals resighted within and between locations in the southern Marianas study area across sightings during which high to moderate quality photos were collected (n=32).
The number of previously unidentified individuals encountered each year continued to increase throughout the study period without leveling off (Figure 3C). Cataloged individuals were encountered in every year, month, and location of the study, but with some variability in occurrence (Figures S2A, C, E). More yearly encounters of distinctive individuals occurred between 2012 and 2015 than in other years (Figure S2A) despite only small differences in survey effort between years (Figure S2B). Nearly half (43%, n = 65) of the yearly encounters of distinctive individuals occurred in May and June (Figure S2C), which were also the months with the greatest survey effort (Figure S2D). More yearly encounters of distinctive individuals occurred off the 3-Islands area (n = 73) compared to Rota (n = 47) and Guam (n = 24) (Figure S2E). The number of bottlenose dolphin groups sighted and the yearly encounters of distinctive individuals were higher off Rota than Guam despite the greater amount of survey effort off Guam in depths less than 800 m, where most of the group sightings occurred across all locations (Figures S1, S2F, S3).
3.3 Mark-recapture modelling and abundance estimation
Goodness-of-fit testing resulted in an estimate of ĉ = 0.82 (χ2 = 12.34; df = 15) for the full bottlenose dolphin data set. In the absence of a standard procedure for dealing with underdispersion in the data (i.e., ĉ< 1), ĉ was set to one following guidance from Cooch and White. (2022). The model that received the most AICc weight allowed capture probability to vary with time (Table 3). The model-averaged estimate of apparent survival probability is 0.79 (SE = 0.06), and the estimates of yearly capture probability range from a high in 2012 (0.56, SE = 0.13) and 2013 (0.56, SE = 0.12) to a low in 2018 (0.27, SE = 0.12) (Table S1). The super-population size, which does not account for losses over time or individuals that do not enter the study area, was estimated as 111 (SE = 12) distinctive individuals (Table S1).
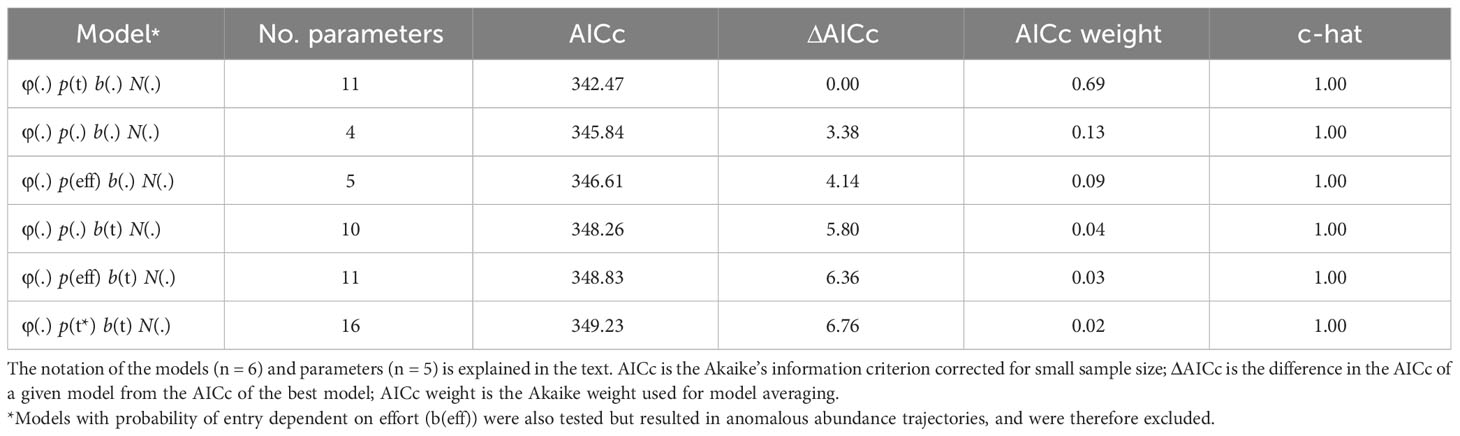
Table 3 Model selection results from the POPAN mark-recapture estimation of distinctive bottlenose dolphin abundance in the southern Marianas study area from 2011 to 2018.
Model selection results from the summer-only (2011–2018) and spatially-consistent (2011–2016) data subsets used in the sensitivity analyses are similar to those of the full Marianas bottlenose dolphin data set (Table S2). These subsets resulted in similar estimates of model-averaged parameters to estimates from the full dataset (Table S1), suggesting that the results are not sensitive to some forms of sampling variability and bias. The yearly abundances of distinctive individuals are also similar between data sets and the 95% CIs were overlapping, but the estimates from the full data set are more precise for most years (Figure S4).
Using data from 22 groups, the proportion of distinctive individuals in the study area was estimated as 0.90 (SE = 0.01) and was applied to the estimates of Ni from the full data set. The resulting yearly abundance estimates for both distinctive and non-distinctive individuals within the study area range from 41 (SE = 14, 95% CI = 21–79) in 2011 to 53 (SE = 17, 95% CI = 29–99) in 2018 (Table 4).
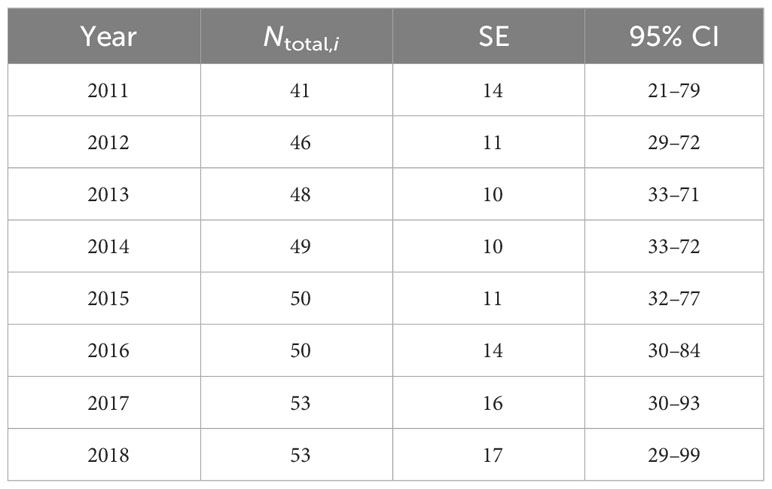
Table 4 Mark-recapture estimates of distinctive and non-distinctive bottlenose dolphins (Ntotal,i) associated with the southern Marianas study area from 2011 to 2018 including the standard error (SE) and 95% confidence intervals (CI).
3.4 Genetic data review
The bottlenose dolphin data set was divided into four strata: (1) western Pacific, (2) Marianas, (3) Hawaiʻi EEZ, and (4) northeastern Pacific. The probability of two individuals sharing the same genotype at all microsatellite loci is 1.99 x 10⁻¹¹ for unrelated individuals and 1.04 x 10⁻⁴ for siblings. Among the bottlenose dolphin samples, 18 pairs of replicate samples (three pairs from the Marianas, 15 from the Hawaiʻi EEZ) were identified either genetically or photographically, all of which also matched with respect to sex and mtDNA haplotype. One sample from each pair was therefore excluded from the final data set. In addition, twelve samples were found to be genetically identical to samples included in Martien et al.’s (2012) study. In these cases, the sample used by Martien et al. (2012) was excluded, as the newer samples had been genotyped at more loci. In all cases of replicate samples from the Hawaiʻi EEZ, both within our sample set and between our sample set and that of Martien et al. (2012) both samples were collected from the same island. Of the replicate samples collected in the Marianas, two pairs came from the same island (one from Saipan and one from Tinian), while the other pair involved one sample collected near Guam and one collected near Rota.
We excluded eight Fraser’s dolphin samples from the mtDNA data set and 22 from the microsatellite data set due to poor sample quality. One bottlenose dolphin sample was excluded from the mtDNA data set and five were excluded from the nucDNA data set due to poor quality, and 25 samples were collected from the Marianas after nucDNA laboratory work was completed and were therefore not included in the microsatellite data set. After all exclusions, our mtDNA data set includes 305 bottlenose dolphins (including 119 from Martien et al., 2012 and 40 from the Marianas) and 39 Fraser’s dolphins, while the nucDNA data set includes 164 bottlenose dolphins (including 14 from the Marianas) and 25 Fraser’s dolphins.
The jackknife analysis of the bottlenose dolphin data set identified one individual that is homozygous for a rare allele at locus SL125t and therefore has a disproportionate effect on HWE at that locus. That individual’s genotype at SL125t was treated as missing data for all microsatellite analyses. While none of the loci are out of HWE in the Marianas samples, three are out of HWE for the Hawaiʻi EEZ samples. However, the Hawaiʻi EEZ is known to contain multiple populations (Martien et al., 2012). When the HWE analysis was re-run separately for each of the four populations identified by Martien et al. (2012), none of the loci were out of HWE. Similarly, while seven pairs of loci are out of linkage equilibrium in the data set overall, none of them are out of equilibrium within any of the populations identified by Martien et al. (2012). Therefore, all loci were retained.
3.5 Genetic diversity and ancestry
We resolved 34 unique haplotypic sequences among the bottlenose dolphin samples we analyzed, 14 of which were also identified by Martien et al. (2012). Haplotypes 33 and 37 include heteroplasmic sites, which are the only sites that distinguished them from haplotypes 32 and 6, respectively. There are six haplotypes identified within the Hawaiʻi EEZ by Martien et al. (2012) that we did not detect in samples collected after that analysis. Thus, the final combined data set includes 40 haplotypes. All mtDNA analyses were conducted on this combined data set (Table 5).
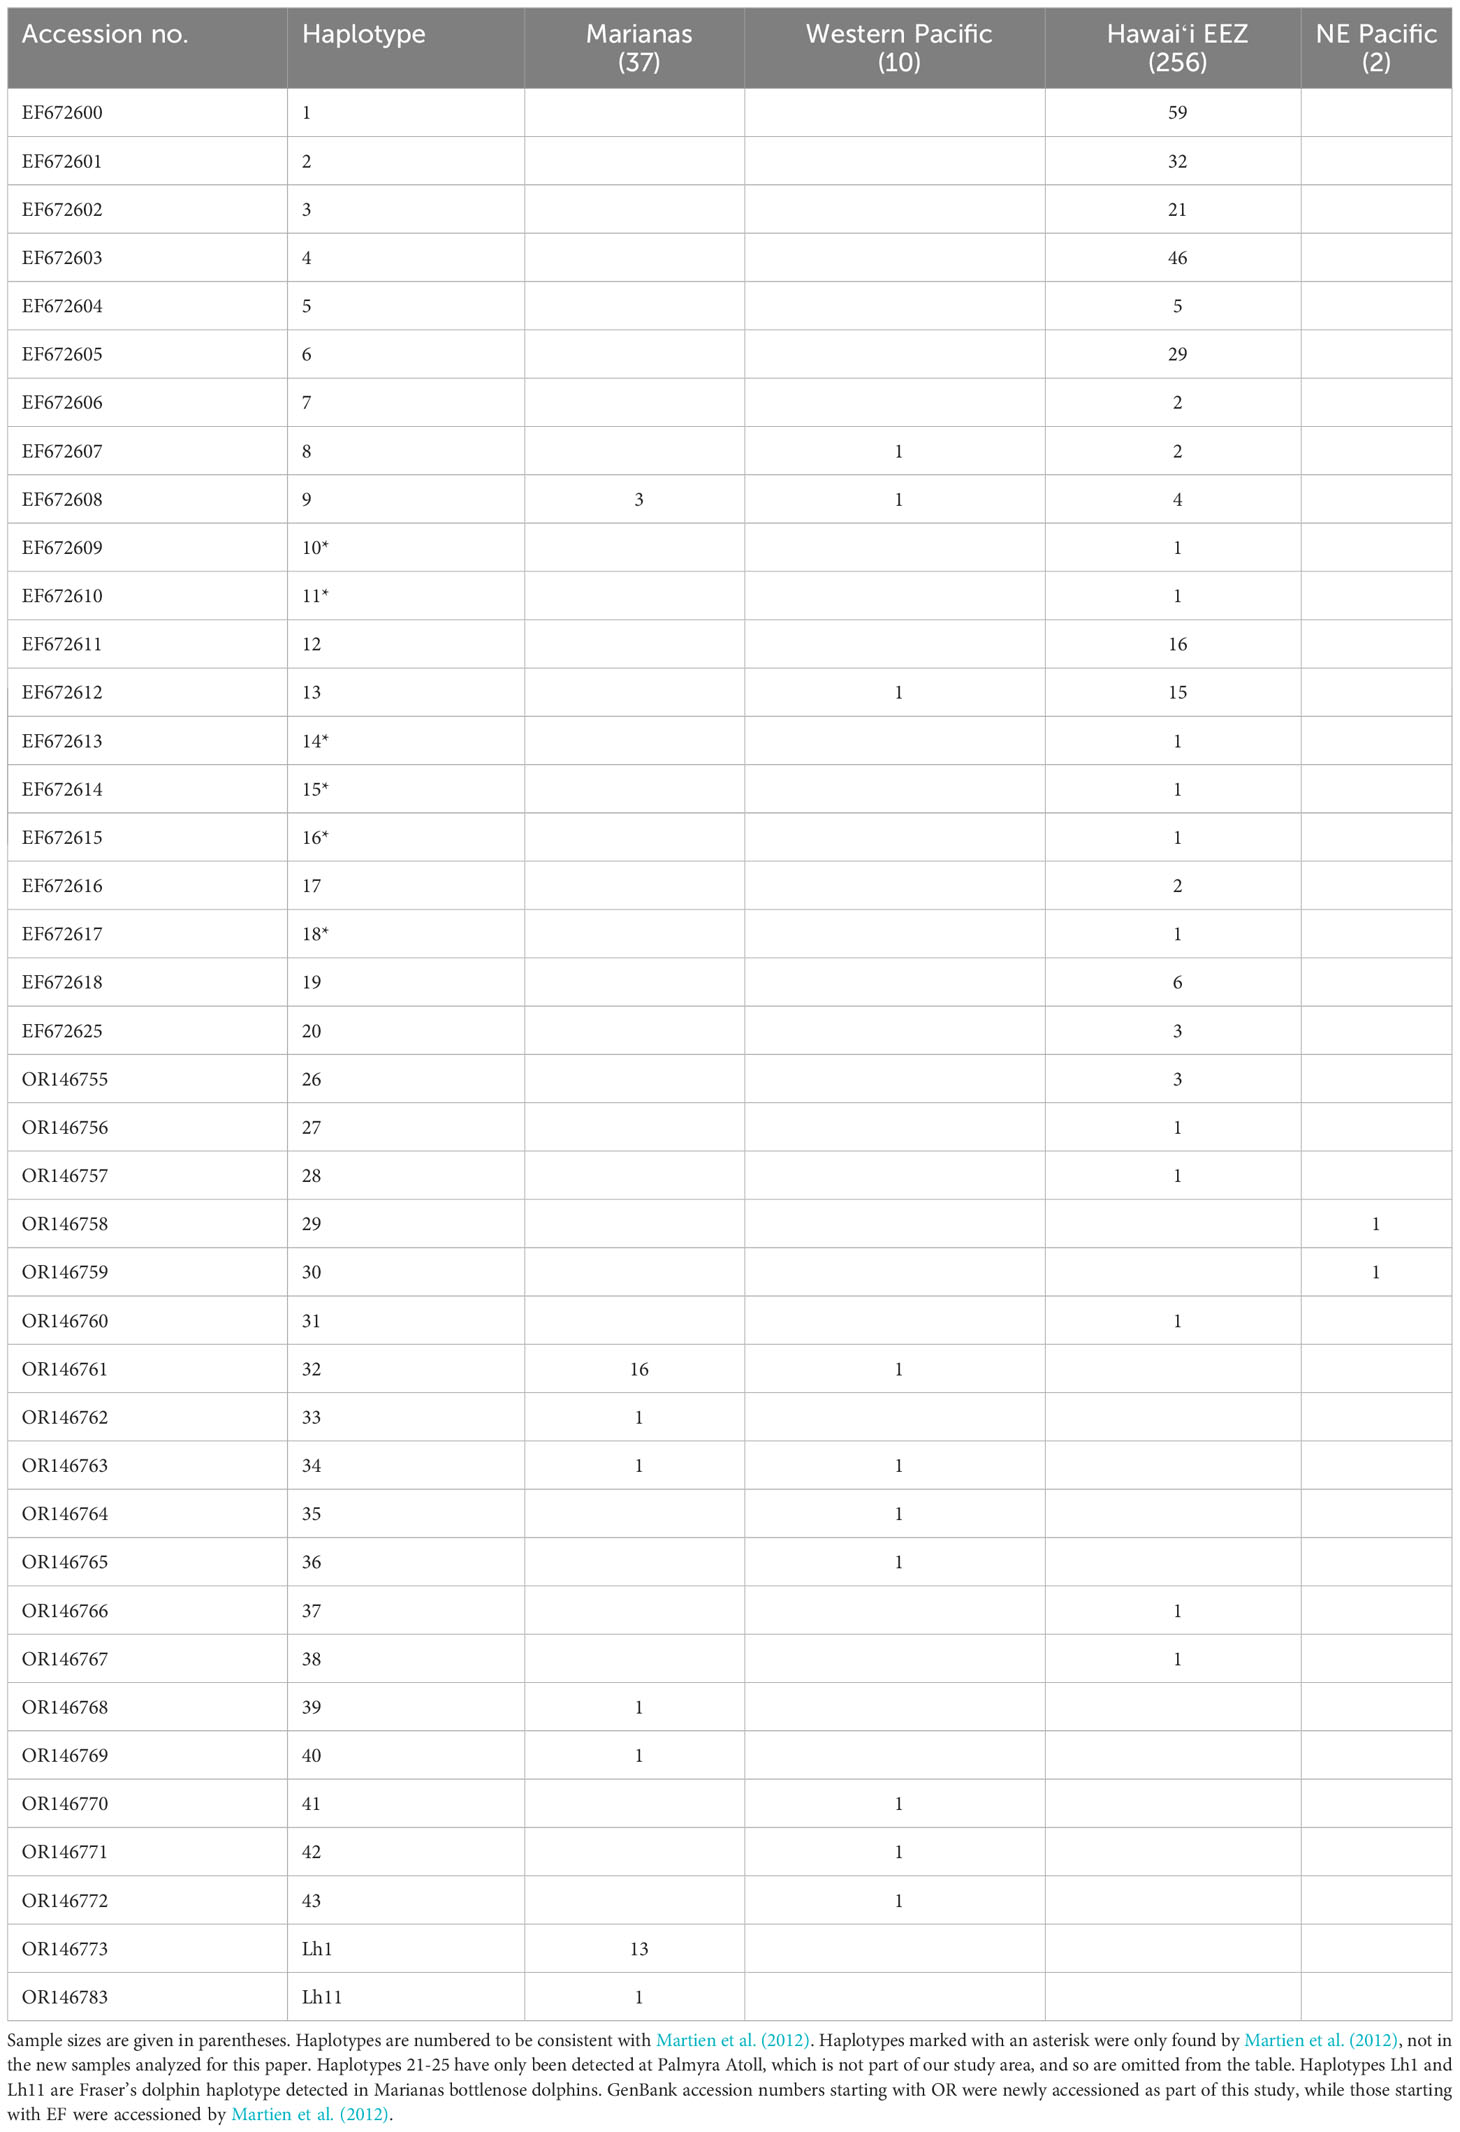
Table 5 Bottlenose dolphin haplotype frequencies by data collection location.
In addition to the Fraser’s dolphin haplotype reported by Martien et al. (2012), we detected a second Fraser’s dolphin haplotype, Lh11, among the Marianas bottlenose dolphin samples. The individual encounter rates (Figure S5A) and encounter history lengths (Figure S5B) are similar between the individuals possessing bottlenose dolphin and Fraser’s dolphin haplotypes.
We resolved 26 unique haplotypes among the Fraser’s dolphin samples (Table S4). Seven Fraser’s dolphin samples – five from the Philippines and two from Hawaiʻi – possess haplotypes (Lh1 and Lh11) detected in the Marianas bottlenose dolphin samples. Sixteen of the haplotypes we resolved, including Lh1 and Lh11, match haplotypes reported by Chen et al. (2020). Lh1 is also identical to the haplotype that Allen et al. (2016) found in a bottlenose dolphin population in northern Australia.
Haplotypic diversity is low among the Marianas bottlenose dolphin individuals (Table 6), with 78.4% (29 out of 37) individuals possessing haplotype 32 or Lh1 (Table 5). Nucleotide diversity is also very low when the individuals possessing Fraser’s dolphin haplotypes are excluded (Table 6). However, when those individuals are included, nucleotide diversity in Marianas bottlenose dolphins is higher than for any other stratum. Estimates of nuclear genetic diversity are also lower for the Marianas than for any other stratum (Table 7).
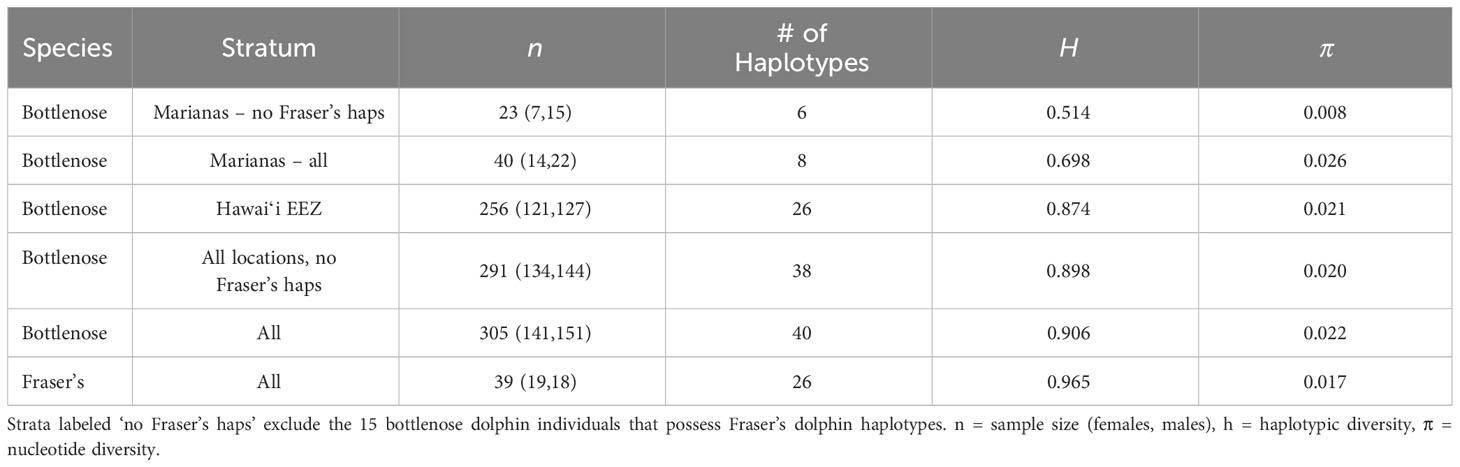
Table 6 Diversity estimates for the bottlenose and Fraser’s dolphin mtDNA data sets.
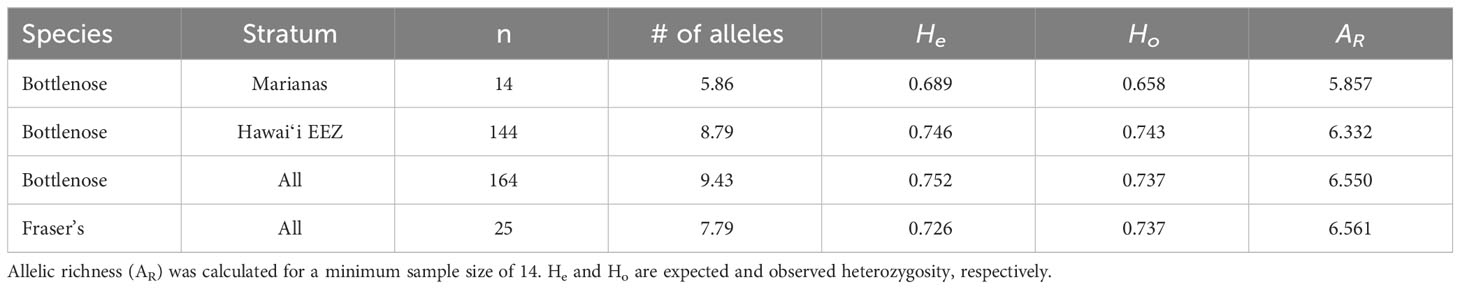
Table 7 Diversity estimates for the bottlenose and Fraser’s dolphin nucDNA data sets.
In the Fraser’s dolphin data set, there are 19 females and 18 males, while in the bottlenose dolphin data set there are 142 females, 153 males, and 13 animals that could not be genetically sexed (Table 6). Among the Marianas bottlenose dolphins there are 14 females, 22 males, and one animal that could not be genetically sexed (Table 6).
When we used the program STRUCTURE to cluster all bottlenose dolphin samples, including those from the Marianas, the models with K = 1, 2, and 3 had nearly identical values of L(K), while ΔK was highest for the model with 3 groups (Table S5). For the K=2 model, the Marianas samples have an average assignment probability of 91.2% to group 1, the other western Pacific samples have an average assignment probability of 86.1% to group 1, and the Hawaiʻi EEZ samples have an average assignment probability of 36.5% to group 1 (Figure S6A). In the K=3 model, the assignment probability of the western Pacific and Hawaiʻi EEZ samples to group 1 declines, with the remainder of their assignment probability split equally between 2 and 3 (Figure S6B).
When we included the Fraser’s dolphin samples in the analysis, L(K) steadily increases with increasing K, while ΔK peaks at K=2 (Table S5). However, the model with three groups clearly separates the bottlenose dolphin samples into two groups (Figure S7). Under this model, the Marianas samples have 88.1% assignment to group 1, the western Pacific and Hawaiʻi EEZ bottlenose dolphin samples have average assignments to group 2 of 73.0% and 95.8%, respectively, and the Fraser’s dolphins have an average assignment of 99.3% to group 3.
The STRUCTURE analysis with the USEPOPINFO option used to set informative species priors for all samples shows that the Marianas animals all have zero probability of being migrants (i.e., pure Fraser’s dolphins) and have, on average, a 0.057 probability of having either a Fraser’s dolphin parent or grandparent (Table 8). The average proportion of Fraser’s dolphin ancestry in the Marianas animals is estimated as 0.161 when we use an uninformative prior as to the species origin of the Marianas samples (Table 8). When the bottlenose dolphin samples were randomly subsampled to the same sample size (n = 25) as the Fraser’s dolphins, the average probability of having a Fraser’s dolphin ancestor in the last two generations declines to 0.007, but the average estimated proportion of Fraser’s dolphin ancestry increases slightly to 0.196 (Table S6).
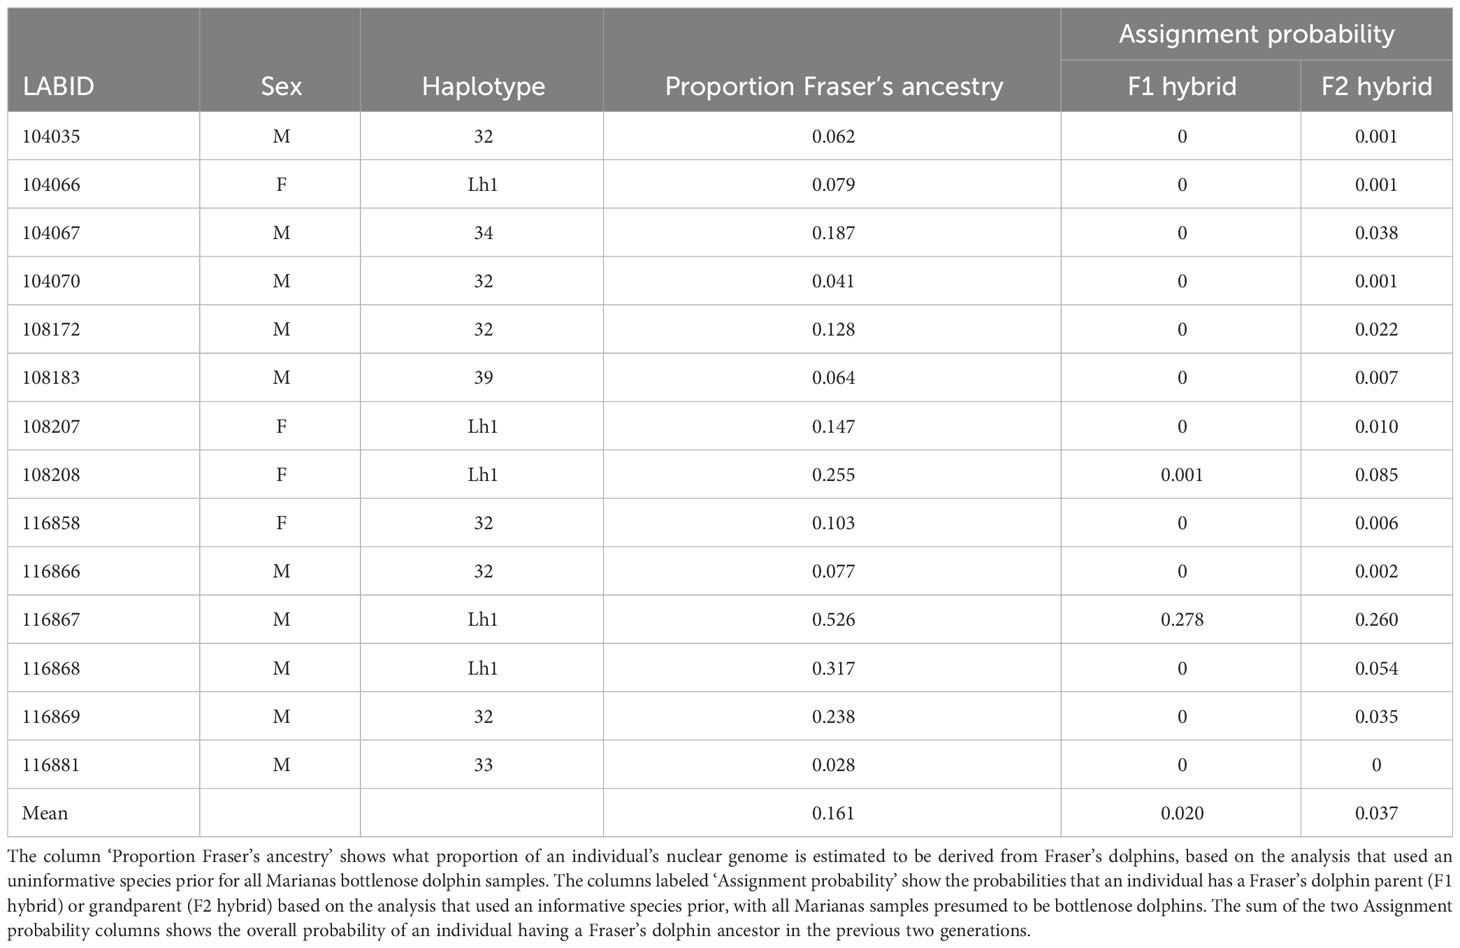
Table 8 Summary of STRUCTURE results for the Marianas bottlenose dolphin samples (n = 14).
4 Discussion
The sighting, photo-identification, and genetic data presented here all indicate the presence of a small, island-associated population of bottlenose dolphins in the Marianas. All of the sightings off the southernmost islands were within 20 km from shore and most were within 10 km (Figure S1). More than half of the sighted groups were in water depths less than 200 m (56%, n = 23; Figure S3). The between-year re-sighting rate (47% seen in 2+ years, 25% seen in 3+ years) and long encounter histories of some individuals are both indicative of an island-associated population. Bottlenose dolphin groups were sighted in every month that there was survey effort, indicating year-round presence. Most individuals that were encountered in multiple years during the small-boat surveys were documented moving between survey areas (Guam, Rota, and 3-Islands; Table 2). These movements suggest that, at least in the southern portion of the archipelago, animals travel between islands rather than being resident to a single island, as is largely the case in the main Hawaiian Islands (Baird et al., 2009; Martien et al., 2012). Though most of our data come from the southern portion of the archipelago (Guam to Saipan), the presence of haplotypes 32 and Lh1, the two dominant haplotypes, in samples collected off of Anatahan, Pagan, and Agrihan suggest that the population extends at least as far north as Agrihan, near the northern limit of the archipelago (Figure 1). This conclusion is supported by satellite tag data showing that animals tagged near Rota traveled north past Anatahan (Hill et al., 2020).
The yearly estimates of bottlenose dolphin abundance within the southern Marianas study area in 2011–2018 are each less than 54, with upper limits of the 95% confidence intervals from 71 to 99 (Table 4). Although the sensitivity analyses suggest that these yearly estimates are robust to some forms of temporal and spatial sampling variability and bias within the study area, other indicators suggest that sampling frequency and extent did not fully account for all dolphins in the population. For example, more than half of the individuals were encountered in only one year of the study and the discovery curve has yet to level off (Figure 3C), supporting the suggestion that population level coverage cannot be assumed in each year. Further, the estimate of apparent survival probability (0.79, SE = 0.06) is unusually low compared to those of other bottlenose dolphin populations (Silva et al., 2009; Speakman et al., 2010; Fruet et al., 2015; Carretta et al., 2016; Couet et al., 2019; Estrade and Dulau, 2020; Ludwig et al., 2021; Van Cise et al., 2021) and other odontocete populations (e.g., Santostasi et al., 2016; Bradford et al., 2018). This low apparent survival probability is likely a sampling artifact potentially caused by dolphins emigrating (either fully or temporarily) from the study area. Post-hoc analyses using a Cormack-Jolly-Seber (CJS) model (Cormack, 1964; Jolly, 1965; Seber, 1965) to estimate apparent survival directly found that a time-since-marking parameterization using a two age-class model (Cooch and White, 2023) could not mitigate the apparent transience in the Marianas population (Table S7). The apparent survival of newly captured individuals (including so-called “transients”) was estimated as 0.75 (SE = 0.09), while that of re-encountered individuals (“residents”) is 0.81 (SE = 0.09). An alternate ad hoc approach following Pradel et al. (1997), in which the first occurrence of each individual was removed prior to running models, resulted in an estimate of apparent survival for the “resident” population of 0.91 (SE = 0.07; Table S7). While preliminary, this estimate is more aligned with other bottlenose dolphin studies (Fruet et al., 2015; Estrade and Dulau, 2020; Van Cise et al., 2021).
As the genetic and movement data suggest, the survey effort in the southern Marianas on which the abundance estimate is based only covered a portion of the population’s likely range. This partial sampling would not necessarily lead to a biased estimate of the full population if all individuals in the population were available for capture at some point during each sampling period. However, despite evidence that individuals are moving throughout the study area, it is possible there is temporal or individual variation in home ranges. Such variation could result in unequal capture probabilities in the southernmost islands, limiting our ability to survey the full population. As a result, even if the estimates presented here accurately reflect the yearly abundance of bottlenose dolphins in the southern Marianas from 2011–2018, they likely underestimate the size of the broader population. Despite their limitations, these estimates indicate that the Marianas population is relatively small. The super-population size estimate of approximately 110 distinctive individuals (120 if non-distinctive individuals are included) may provide some insight into the magnitude of the full population size. However, this estimate does not account for losses over time and is thus difficult to interpret over long study periods. Further, it also does not account for individuals in the population that did not use the study area during the study period. Additional survey effort outside of the southern Marianas is needed in order to produce an estimate of abundance that accounts for the full population. In addition, the incorporation of auxillary data sources (e.g., satellite telemetry and opportunistic sightings) into integrated mark-recapture models could lead to improved estimates by providing estimates of availability or enabling parameterization of spatial capture-recapture models (McClintock et al., 2022).
The genetic data provide further evidence of an island-associated population in the Marianas and limited interchange with the offshore bottlenose dolphin population. Haplotypic diversity is low, with only two haplotypes accounting for over three-quarters of all individuals. These two haplotypes were observed in animals sampled throughout the full range of the study area and in every year of the study period (2011–2018). Thus, the low haplotypic diversity is unlikely due to the sampling of close maternal relatives during a single group sighting. Nuclear diversity is also low, again indicating a small population with limited interchange with the surrounding offshore population(s).
Both mitochondrial and nuclear genetic diversity in the Marianas bottlenose dolphin population are considerably lower than among the four island-associated populations around the main Hawaiian Islands (h = 0.0779-0.892, π = 0.018-0.022, He = 0.736-0.746, Ho = 0.692-0.750; Martien et al., 2012). The lower genetic diversity of the Marianas population compared to the main Hawaiian Islands resident populations could be the result of lower abundance (Van Cise et al., 2021). Alternatively, it could reflect a greater degree of genetic isolation. The main Hawaiian Islands support multiple populations that are separated from each other by only 38 to 110 km. Estimates of gene flow among the Hawaiian Islands range from 1 to 5.8 migrants per generation (Martien et al., 2012), which is sufficient to maintain substantially more genetic diversity than any of the populations could sustain alone. In contrast, the Mariana Islands appear to support only a single population that is separated from the nearest islands and atolls by over 500 km of open ocean.
The existence of an island-associated population of bottlenose dolphins around the Marianas is not unexpected, given previous findings of island-associated cetacean populations around other oceanic islands and island groups (Parsons et al., 2006; Oremus et al., 2007; Baird et al., 2008; Silva et al., 2008; Tezanos-Pinto et al., 2009; Andrews et al., 2010; Martien et al., 2012; Oremus et al., 2012; Baird et al., 2013; Albertson et al., 2016). The increased productivity caused by runoff, shallow-water habitat, and the island mass effect (Doty and Oguri, 1956; De Falco et al., 2022) likely result in the Marianas representing an “oasis” (sensu Silva et al., 2008) in the midst of the oligotrophic North Equatorial Current (Suntsov and Domokos, 2013). The habitat discontinuities that result from such conditions have been proposed as drivers of genetic differentiation for other coastal and island-associated cetacean populations (Hoelzel et al., 1998; Natoli et al., 2005; Möller et al., 2007; Andrews et al., 2010; Martien et al., 2012; Martien et al., 2014a; Albertson et al., 2016; Martien et al., 2017).
Unlike the main Hawaiian Islands, where each island area hosts its own demographically independent and genetically distinct population (Martien et al., 2012), the southern Marianas appear to support a single population. The lack of differentiation within the Marianas could be due to the relatively small amount of nearshore habitat. The total landmass in the Marianas is only 1000 km2, compared to 16000 km2 in the main Hawaiian Islands. Furthermore, the Marianas lack the large shallow-water plateaus that occur adjacent to most of the main Hawaiian Islands. It is possible that the available nearshore habitat in the southern portion of the archipelago is not sufficient to support multiple populations. However, given our small sample size and near lack of samples in the northern part of the archipelago, it is possible that additional sampling will reveal the existence of additional populations. Thus, future research should include the collection of more biopsy samples, as well as photo-identification and satellite tagging data, from the portion of the archipelago north of the 3-Islands area, where our data are sparse.
Martien et al. (2014b) concluded that the Fraser’s dolphin haplotype they detected in the Marianas population was the result of introgressive hybridization. However, their finding could also be due to incomplete lineage sorting, which occurs when two species share a haplotype that both inherited from their most recent common ancestor. Incomplete lineage sorting is particularly common in recently diverged species with high abundance, as is the case for many species in the family Delphinidae, which includes bottlenose dolphins and Fraser’s dolphins. The Fraser’s dolphin haplotype that was detected in 14 Marianas animals (Lh1) is identical to the Fraser’s dolphin haplotype that Allen et al. (2016) detected in a bottlenose dolphin population in northern Australia. The fact that this haplotype has been detected in two bottlenose dolphin populations is consistent with the presence of a shared haplotype between the species due to incomplete lineage sorting.
However, our STRUCTURE analyses of nuclear loci suggest that introgressive hybridization is more likely than incomplete lineage sorting. Nearly all of the Marianas animals, including those with bottlenose dolphin haplotypes, show greater than 5% Fraser’s ancestry, with some individuals showing over 50% Fraser’s ancestry (Table 8). Our finding of a second Fraser’s dolphin haplotype (Lh11) in the Marianas population further supports the hypothesis of introgressive hybridization, as the likelihood of the Marianas population containing two separate instances of incomplete lineage sorting is very low. Therefore, it is much more likely that the Marianas population occasionally hybridizes with Fraser’s dolphin, resulting in two introgressed haplotypes.
The low probabilities of the Marianas animals having Fraser’s dolphin ancestry within the last two generations (Table 8), despite nearly all of them showing evidence of nuclear introgression, suggest that hybridization occurred enough generations in the past to allow the Fraser’s dolphin alleles to spread throughout the population. This conclusion is also supported by photographs taken at the time of biopsy showing that all individuals, regardless of haplotype, appear to be morphologically typical bottlenose dolphins (Martien et al., 2014b), whereas first generation hybrids usually display morphologies intermediate between the parent species (Bérubé, 2002).
Phylogenetic analyses using genomic nuclear data would be valuable in further investigating the introgression of Fraser’s dolphin DNA into the Marianas bottlenose dolphin population (Payseur and Rieseberg, 2016). Genomic data could be useful in determining both the timing and likely number of introgressive hybridization events into the Marianas population. Given that our study and Allen et al.’s (2016) study that detected Fraser’s dolphin mtDNA in a bottlenose dolphin population both took place in the Indo-Pacific region, other bottlenose dolphin populations in the region should be sampled to determine the prevalence of hybridization with Fraser’s dolphins. Future studies should include more samples of Fraser’s dolphins and western Pacific bottlenose dolphins to further evaluate the extent and frequency of hybridization between the species. Genomic nuclear data from across the Indo-Pacific would be valuable in confirming that the Fraser’s dolphin haplotypes that we and Allen et al. (2016) detected in bottlenose dolphin populations are the result of introgressive hybridization, rather than incomplete lineage sorting (Durand et al., 2011; Lohse and Frantz, 2014; Payseur and Rieseberg, 2016; Moura et al., 2020).
Cetacean species are known to exhibit an unusually high rate of interspecific hybridization. Isolated hybridization events have been documented both in wild populations and among captive animals, and do not always involve sister species (Bérubé, 2002; Willis et al., 2004; Kingston et al., 2009; Schaurich et al., 2012; Martien et al., 2014b; Allen et al., 2016). Consequently, introgressive hybridization has long been suspected as a source of taxonomic confusion in the Delphinidae (Kingston et al., 2009; Amaral et al., 2014; Moura et al., 2020). Our results support the hypothesis that introgressive hybridization may be an important evolutionary force in the family.
The low abundance, relative isolation, and unique evolutionary history of the Marianas bottlenose dolphin population all raise concerns about its conservation and management. Coastal and island-associated populations face significant anthropogenic risks due to the concentration of pollutants (Reijnders et al., 2009; Ylitalo et al., 2009; Alonso et al., 2014), vessel traffic (Erbe et al., 2019; Carome et al., 2022; Carzon et al., 2023), and recreational and commercial fisheries effort (Martien et al., 2012; Oremus et al., 2012; Baird et al., 2015) near coastlines. In addition, the Marianas bottlenose dolphin population faces potentially significant noise impacts due to the frequent, large-scale military exercises that occur within its range. Chronic noise can have significant population-level impacts, especially for animals with high site fidelity (Forney et al., 2017), even in the absence of any obvious behavioral reaction to noise (Beale and Monaghan, 2004; Bejder et al., 2009). For island-associated populations, repeated noise disturbance can result in displacement from preferred habitat and the effective reduction in the amount of available habitat if noise renders parts of their habitat unusable a significant proportion of the time. Potential impacts to the Marianas bottlenose dolphin population due to military and other human activities should be evaluated and closely monitored.
Data availability statement
The data used in this study are all publicly available. Sighting data can be found in OBIS SEAMAP at the following locations: https://seamap.env.duke.edu/dataset/2071, https://seamap.env.duke.edu/dataset/2234, and https://seamap.env.duke.edu/dataset/2230. Sequences of all previously unpublished haplotypes are accessioned at GenBank, Ascenssion OR146755 (https://www.ncbi.nlm.nih.gov/genbank/). All computer code used for the analyses presented in this paper is available upon request to the first authors.
Ethics statement
The animal study was approved by NMFS Institutional Animal Care and Use Committee. The study was conducted in accordance with the local legislation and institutional requirements.
Author contributions
KM: Conceptualization, Data curation, Formal Analysis, Funding acquisition, Methodology, Project administration, Supervision, Visualization, Writing – original draft, Writing – review & editing. MH: Conceptualization, Data curation, Formal Analysis, Funding acquisition, Investigation, Methodology, Project administration, Visualization, Writing – original draft, Writing – review & editing. FA: Conceptualization, Formal Analysis, Writing – review & editing. RB: Data curation, Investigation, Writing – review & editing. AB: Formal Analysis, Investigation, Methodology, Writing – original draft, Writing – review & editing. ABe: Data curation, Investigation, Writing – review & editing. LD: Investigation, Writing – review & editing. AL: Investigation, Writing – review & editing. KR: Data curation, Investigation, Writing – original draft, Writing – review & editing. SW: Data curation, Formal Analysis, Visualization, Writing – review & editing. KY: Data curation, Investigation, Writing – review & editing. AÜ: Data curation, Investigation, Writing – review & editing. EO: Conceptualization, Funding acquisition, Project administration, Supervision, Writing – review & editing.
Funding
The author(s) declare financial support was received for the research, authorship, and/or publication of this article. Funding was provided by the U.S. Navy (Commander, U.S. Pacific Fleet), the Pacific Islands Fisheries Science Center, and the Southwest Fisheries Science Center.
Acknowledgments
We would like to thank Janelle Badger for her insightful suggestions for improving the mark-recapture analysis and her comments on an early draft of this manuscript. We are also grateful to three reviewers helped to improve this paper. This project would not have been possible without field logistical support and assistance from a great many individuals and organizations. We would like to thank our primary boat owners, captains and crews: John Eads, Sam Markos, Ben Sablan, Hideyuki Kaya, Alphonsus Ngirmeriil, Mark and Lynne Michael, Jason Hartup, Masao Tenbata, Fidel Mendiola, Jr., Ramon Castro, Ignacio Lizama, Crispen Ayuyu, Manny Blas, Todd Genereux, Monique Genereux, Rick Seidler, Ken King, and Greg Pynes. We would like to thank all of the researchers and volunteers that assisted with the surveys, biopsy and photo collection, laboratory processing, and provided logistical support for this project including Erik Norris (PIFSC- Honolulu), Eric Cruz (PIFSC-Guam), Mike Trianni (PIFSC-CNMI), Valerie Brown (Pacific Islands Regional Office (PIRO)-Guam), Julie Hartup, Chase Weir, Brent Tibbatts (Guam Department of Aquatic and Wildlife Resources), Manny Pangelinan, Mike Tenorio, (CNMI-Department of Fish and Wildlife), Steve McKagan, Dana Okano (PIRO-CNMI), Mark Deakos (HDR), Victoria Pease (SWFSC), Gabriela Serra-Valente (SWFSC), and Morgane Lauf (Ocean Associates Inc.). We also thank the Institute of Environmental and Marine Studies, Silliman University, for use of the Philippines samples. All data were collected under NMFS MMPA permits 14097, 15240 and CNMI-DFW permit license nos. 02260-11, 02444-12, 02694-13, 02868-14, 03086-15, 03292-16, 03564-17, 03752-18.
Conflict of interest
Author AB was employed by the company Lynker.
The remaining authors declare that the research was conducted in the absence of any commercial or financial relationships that could be construed as a potential conflict of interest.
Publisher’s note
All claims expressed in this article are solely those of the authors and do not necessarily represent those of their affiliated organizations, or those of the publisher, the editors and the reviewers. Any product that may be evaluated in this article, or claim that may be made by its manufacturer, is not guaranteed or endorsed by the publisher.
Supplementary material
The Supplementary Material for this article can be found online at: https://www.frontiersin.org/articles/10.3389/fmars.2023.1254959/full#supplementary-material
Footnotes
- ^ Full sighting histories of the distinctive individuals, including within-year resights are provided in Table S3.
References
Akaike H. (1973). “Information theory and an extension of the maximum likelihood principle,” in Proceedings of the Second International Symposium on Information Theory, eds Petrov B. N., Caski F., (Budapest: Akademiai Kiado) 267–281, Akademiai Kiado.
Albertson G. R., Baird R. W., Oremus M., Poole M. M., Martien K. K., Baker C. S. (2016). Staying close to home? Genetic differentiation of rough-toothed dolphins near oceanic islands in the central Pacific Ocean. Conserv. Genet 18, 33–51. doi: 10.1007/s10592-016-0880-z
Allen S. J., Bryant K. A., Kraus R. H., Loneragan N. R., Kopps A. M., Brown A. M., et al. (2016). Genetic isolation between coastal and fishery-impacted, offshore bottlenose dolphin (Tursiops spp.) populations. Mol. Ecol. 25, 2735–2753. doi: 10.1111/mec.13622
Alonso M. B., Azevedo A., Torres J. P., Dorneles P. R., Eljarrat E., Barcelo D., et al. (2014). Anthropogenic (PBDE) and naturally-produced (MeO-PBDE) brominated compounds in cetaceans–a review. Sci. Total Environ. 481, 619–634. doi: 10.1016/j.scitotenv.2014.02.022
Amaral A. R., Lovewell G., Coelho M. M., Amato G., Rosenbaum H. C. (2014). Hybrid speciation in a marine mammal: the clymene dolphin (Stenella clymene). PloS One 9, e83645. doi: 10.1371/journal.pone.0083645
Anderson D. R., Burnham K. P., White G. C. (1994). AIC model selection in overdispersed capture-recapture data. Ecology 75, 1780–1793. doi: 10.2307/1939637
Andrews K. R., Karczmarski L., Au W. W., Rickards S. H., Vanderlip C. A., Bowen B. W., et al. (2010). Rolling stones and stable homes: social structure, habitat diversity and population genetics of the Hawaiian spinner dolphin (Stenella longirostris). Mol. Ecol. 19, 732–748. doi: 10.1111/j.1365-294X.2010.04521.x
Archer F. I., Adams P. E., Schneiders B. B. (2017). strataG: an R package for manipulating, summarizing and analysing population genetic data. Mol. Ecol. Resour. 17, 5–11. doi: 10.1111/1755-0998.12559
Baird R. W., Gorgone A. M., McSweeney D. J., Ligon A. D., Deakos M. H., Webster D. L., et al. (2009). Population structure of island-associated dolphins: Evidence from photo-identification of common bottlenose dolphins (Tursiops truncatus) in the main Hawaiian Islands. Mar. Mammal Sci. 25, 251–274. doi: 10.1111/j.1748-7692.2008.00257.x
Baird R. W., Gorgone A. M., McSweeney D. J., Webster D. L., Salden D. R., Deakos M. H., et al. (2008). False killer whales (Pseudorca crassidens) around the main Hawaiian Islands: long-term site fidelity, inter-island movements, and association patterns. Mar. Mammal Sci. 24, 591–612. doi: 10.1111/j.1748-7692.2008.00200.x
Baird R. W., Mahaffy S. D., Gorgone A. M., Cullins T., McSweeney D. J., Oleson E. M., et al. (2015). False killer whales and fisheries interactions in Hawaiian waters: evidence for sex bias and variation among populations and social groups. Mar. Mammal Sci. 31, 579–590. doi: 10.1111/mms.12177
Baird R. W., Oleson E. M., Barlow J., Ligon A. D., Gorgone A. M., Mahaffy S. D. (2013). Evidence of an island-associated population of false killer whales (Pseudorca crassidens) in the Northwestern Hawaiian Islands. Pacific Sci. 67, 513–521. doi: 10.2984/67.4.2
Beale C. M., Monaghan P. (2004). Behavioural responses to human disturbance: a matter of choice? Anim. Behav. 68, 1065–1069. doi: 10.1016/j.anbehav.2004.07.002
Bejder L., Samuels A., Whitehead H., Finn H., Allen S. (2009). Impact assessment research: use and misuse of habituation, sensitisation and tolerance in describing wildlife responses to anthropogenic stimuli. Mar. Ecol. Prog. Ser. 395, 177–185. doi: 10.3354/meps07979
Bérubé M. (2002). “Hybridism,” in Encyclopedia of marine mammals. Eds. Perrin W. F., Würsig B., Thewissen J. G. M. (San Diego, CA, USA: Academic Press), 596–600.
Bradford A. L., Baird R. W., Mahaffy S. D., Gorgone A. M., McSweeney D. J., Cullins T., et al. (2018). Abundance estimates for management of endangered false killer whales in the main Hawaiian Islands. Endangered Species Res. 36, 297–313. doi: 10.3354/esr00903
Buchanan F. C., Friesen M. K., Littlejohn R. P., Clayton J. W. (1996). Microsatellites from the beluga whale Delphinapterus leucas. Mol. Ecol. 5, 571–575. doi: 10.1111/j.1365-294X.1996.tb00348.x
Burnham K. P., Anderson D. R. (2002). Model selection and multimodel inference: a practical information-theoretic approach (New York, NY, USA: Springer).
Burnham K. P., Anderson D. R., White G. C., Brownie C., Pollock K. H. (1987). Design and analysis methods for fish survival experiments based on release-recapture. Am. Fish. Soc. Monogr. 5, 437.
Carome W., Slooten E., Rayment W., Webster T., Wickman L., Brough T., et al. (2022). A long-term shift in the summer distribution of Hector’s dolphins is correlated with an increase in cruise ship tourism. Aquat. Conserv.: Mar. Freshw. Ecosyst. 32, 1660–1674. doi: 10.1002/aqc.3881
Carretta J. V., Danil K., Chivers S. J., Weller D. W., Janiger D. S., Berman-Kowaleski M., et al. (2016). Recovery rates of bottlenose dolphin (Tursiops truncatus) carcasses estimated from stranding and survival rate data. Mar. Mammal Sci. 32, 349–362. doi: 10.1111/mms.12264
Carzon P., Clua É., Dudzinski K. M., Delfour F. (2023). Deleterious behaviors and risks related to close interactions between humans and free-ranging dolphins: A review. Biol. Conserv. 279, 109948. doi: 10.1016/j.biocon.2023.109948
Chen I., Nishida S., Chou L. S., Isobe T., Mignucci-Giannoni A. A., Hoelzel A. R. (2020). Population genetic diversity and historical dynamics of Fraser’s dolphins Lagenodelphis hosei. Mar. Ecol. Prog. Ser. 643, 183–195. doi: 10.3354/meps13268
Cooch E. G., White G. C. (2022). “Goodness of fit testing,” in Program MARK: a gentle introduction. Eds. Cooch E. G., White G. C. (Fort Colins, CO, USA: Colorado State University). Available at: http://www.phidot.org/software/mark/docs/book/pdf/chap5.pdf.
Cooch E. G., White G. C. (2023). Program MARK: a gentle introduction (Fort Colins, CO, USA: Colorado State University). Available at: http://www.phidot.org/software/mark/docs/book/.
Cormack R. M. (1964). Estimates of survival from the sighting of marked animals. Biometrika 51, 429–438. doi: 10.1093/biomet/51.3-4.429
Couet P., Gally F., Canonne C., Besnard A. (2019). Joint estimation of survival and breeding probability in female dolphins and calves with uncertainty in state assignment. Ecol. Evol. 9, 13043–13055. doi: 10.1002/ece3.5693
De Falco C., Desbiolles F., Bracco A., Pasquero C. (2022). Island mass effect: A review of oceanic physical processes. Front. Mar. Sci. 9. doi: 10.3389/fmars.2022.894860
Doty M. S., Oguri M. (1956). The island mass effect. ICES J. Mar. Sci. 22, 33–37. doi: 10.1093/icesjms/22.1.33
Durand E. Y., Patterson N., Reich D., Slatkin M. (2011). Testing for ancient admixture between closely related populations. Mol. Biol. Evol. 28, 2239–2252. doi: 10.1093/molbev/msr048
Eldredge L. G. (1983). Summary of environmental and fishing information on Guam and the Commonwealth of the Northern Mariana Islands: historical background, description of the islands, and review of the climate, oceanography, and submarine topography (NOAA-TM-NMFS-SWFC-40) (La Jolla, CA, USA: U.S. Department of Commerce, National Oceanic and Atmospheric Administration).
Erbe C., Marley S. A., Schoeman R. P., Smith J. N., Trigg L. E., Embling C. B. (2019). The effects of ship noise on marine mammals—A review. Front. Mar. Sci. 6. doi: 10.3389/fmars.2019.00606
Estrade V., Dulau V. (2020). Abundance and site fidelity of bottlenose dolphins off a remote oceanic island (Reunion Island, southwest Indian Ocean). Mar. Mammal Sci. 36, 871–896. doi: 10.1111/mms.12693
Evanno G., Regnaut S., Goudet J. (2005). Detecting the number of clusters of individuals using the software STRUCTURE: a simulation study. Mol. Ecol. 14, 2611–2620. doi: 10.1111/j.1365-294X.2005.02553.x
Falush D., Stephens M., Pritchard J. K. (2003). Inference of population structure using multilocus genotype data: linked loci and correlated allele frequencies. Genetics 164, 1567–1587. doi: 10.1093/genetics/164.4.1567
Fisher R. A. (1935). The logic of inductive inference (with discussion). J. R. Stat. Soc. 98, 39–82. doi: 10.2307/2342435
Forney K. A., Southall B. L., Slooten E., Dawson S., Read A. J., Baird R. W., et al. (2017). Nowhere to go: noise impact assessments for marine mammal populations with high site fidelity. Endangered Species Res. 32, 391–413. doi: 10.3354/esr00820
Fruet P. F., Daura-Jorge F. G., Möller L. M., Genoves R. C., Secchi E. R. (2015). Abundance and demography of bottlenose dolphins inhabiting a subtropical estuary in the Southwestern Atlantic Ocean. J. Mammol. 96, 332–343. doi: 10.1093/jmammal/gyv035
Fulling G. L., Thorson P. H., Rivers J. (2011). Distribution and abundance estimates for cetaceans in the waters off Guam and the commonwealth of the Northern Mariana Islands. Pacific Sci. 65, 321–343. doi: 10.2984/65.3.321
Galver L. M. (2002). The molecular ecology of spinner dolphins, Stenella longirostris: genetic diveristy and population structure (La Jolla, CA, USA: University of California San Diego). Ph.D. Thesis192 pp.
Guo S. W., Thompson E. A. (1992). Performing the exact test of hardy-weinberg proportion for multiple alleles. Biometrics 48, 361–372. doi: 10.2307/2532296
Hill M. C., Oleson E. M., Bradford A. L., Martien K. K., Steel D., Baker C. S. (2020). Assessing cetacean populations in the Mariana Archipelago: a summary of data and analyses arising from Pacific Islands Fisheries Science Center surveys from 2010 to 2019 (NOAA Technical Memorandum NOAA-TM-NMFS-PIFSC-108). (Honolulu, HI, USA: U.S. Department of Commerce). doi: 10.25923/wrye-6h14
Hoelzel A. R., Dahlheim M., Stern S. J. (1998). Low genetic variation among killer whales (Orcinus orca) in the Eastern North Pacific and genetic differentiation between foraging specialists. J. Heredity 89, 121–128. doi: 10.1093/jhered/89.2.121
Hubisz M. J., Falush D., Stephens M., Pritchard J. K. (2009). Inferring weak population structure with the assistance of sample group information. Mol. Ecol. Resour. 9, 1322–1332. doi: 10.1111/j.1755-0998.2009.02591.x
Jakobsson M., Rosenberg N. A. (2007). CLUMPP: a cluster matching and permutation program for dealing with label switching and multimodality in analysis of population structure. Bioinformatics 23, 1801–1806. doi: 10.1093/bioinformatics/btm233
Jolly G. M. (1965). Explicit estimates from capture-recapture data with both death and immigration-stochastic model. Biometrika 52, 225–247. doi: 10.1093/biomet/52.1-2.225
Karczmarski L., Wursig B., Gailey G., Larson K. W., Vanderlip C. (2005). Spinner dolphins in a remote Hawaiian atoll: social grouping and population structure. Behav. Ecol. 16, 675–685. doi: 10.1093/beheco/ari028
Kingston S. E., Adams L. D., Rosel P. E. (2009). Testing mitochondrial sequences and anonymous nuclear markers for phylogeny reconstruction in a rapidly radiating group: molecular systematics of the Delphininae (Cetacea: Odontoceti: Delphinidae). BMC Evolution. Biol. 9, 245–263. doi: 10.1186/1471-2148-9-245
Laake J. L. (2013). RMark: an R interface for analysis of capture-recapture data with MARK (Seattle, WA, USA: NOAA, National Marine Fisheries Service, Alaska Fisheries Science Center).
Lawrence M. J., Stemberger H. L. J., Zolderdo A. J., Struthers D. P., Cooke S. J. (2015). The effects of modern war and military activities on biodiversity and the environment. Environ. Rev. 23, 443–460. doi: 10.1139/er-2015-0039
Lebreton J. D., Burnham K. P., Clobert J., Anderson D. R. (1992). Modeling survival and testing biological hypotheses using marked animals: a unified approach with case studies. Ecol. Monogr. 62, 67–118. doi: 10.2307/2937171
Lohse K., Frantz L. A. (2014). Neandertal admixture in Eurasia confirmed by maximum-likelihood analysis of three genomes. Genetics 196, 1241–1251. doi: 10.1534/genetics.114.162396
Ludwig K. E., Daly M., Levesque S., Berrow S. D. (2021). Survival rates and capture heterogeneity of bottlenose dolphins (Tursiops truncatus) in the Shannon Estuary, Ireland. Front. Mar. Sci. 8. doi: 10.3389/fmars.2021.611219
Martien K. K., Baird R. W., Hedrick N. M., Gorgone A. M., Thieleking J. L., McSweeney D. J., et al. (2012). Population structure of island-associated dolphins: evidence from mitochondrial and microsatellite markers for common bottlenose dolphins (Tursiops truncatus) around the main Hawaiian Islands. Mar. Mammal Sci. 28, E208–E232. doi: 10.1111/j.1748-7692.2011.00506.x
Martien K. K., Chivers S. J., Baird R. W., Archer F. I., Gorgone A. M., Hancock-Hanser B. L., et al. (2014a). Nuclear and mitochondrial patterns of population structure in North Pacific false killer whales (Pseudorca crassidens). J. Heredity 105, 611–626. doi: 10.1093/jhered/esu029
Martien K. K., Hancock-Hanser B. L., Baird R. W., Kiszka J., Aschettino J. M., Oremus M., et al. (2017). Black sheep of the blackfish family: patterns of global population structure in melon-headed whales (Peponocephala electra). Mar. Ecol. Prog. Ser. 577, 205–220. doi: 10.3354/meps12203
Martien K. K., Hill M. C., Van Cise A. M., Robertson K. M., Woodman S. M., Dolar L. L., et al. (2014b). Genetic diversity and population structure in four species of cetaceans around the Mariana Islands, (NOAA Technical Memorandum NMFS-SWFSC-536). (La Jolla, CA, USA: U.S. Department of Commerce).
McClintock B. T., Abrahms B., Chandler R. B., Conn P. B., Converse S. J., Emmet R. L., et al. (2022). An integrated path for spatial capture-recapture and animal movement modeling. Ecology 103, e3473. doi: 10.1002/ecy.3473
McKelvey K. S., Schwartz M. K. (2005). DROPOUT: a program to identify problem loci and samples for noninvasive genetic samples in a capture-mark-recapture framework. Mol. Ecol. Notes 5, 716–718. doi: 10.1111/j.1471-8286.2005.01038.x
Miller S. A., Dykes D. D., Polesky H. F. (1988). A simple salting out procedure for extracting DNA from human nucleated cells. Nucleic Acids Res. 16, 1215. doi: 10.1093/nar/16.3.1215
Mobley J. R. (2007). Marine mammal monitoring surveys in support of “Valiant Shield” training exercises (August 13-17, 2007), (Report prepared for Environmental Division Commander, U.S. Pacific Fleet under contract N62742-07-P-1903 to NAVFAC Pacific). (Pearl Harbor, HI, USA: U.S. Pacific Fleet).
Möller L. M., Wiszniewski J., Allen S. J., Beheregaray L. B. (2007). Habitat type promotes rapid and extremely localised genetic differentiation in dolphins. Mar. Freshw. Res. 58, 640–648. doi: 10.1071/MF06218
Morin P. A., LeDuc R. G., Archer F. I., Martien K. K., Huebinger R. M., Bickham J. W., et al. (2009). Significant deviations from Hardy-Weinberg equilibrium caused by low levels of microsatellite genotyping errors. Mol. Ecol. Resour. 9, 498–504. doi: 10.1111/j.1755-0998.2008.02502.x
Morin P. A., Martien K. K., Archer F. I., Cipriano F., Steel D., Jackson J., et al. (2010). Applied conservation genetics and the need for quality control and reporting of genetic data used in fisheries and wildlife management. J. Heredity 101, 1–10. doi: 10.1093/jhered/esp107
Morin P. A., Nestler A., Rubio-Cisneros N. T., Robertson K. M., Mesnick S. L. (2005). Interfamilial characterization of a region of the ZFX and ZFY genes facilitates sex determination in cetaceans and other mammals. Mol. Ecol. 14, 3275–3286. doi: 10.1111/j.1365-294X.2005.02651.x
Moura A. E., Shreves K., Pilot M., Andrews K. R., Moore D. M., Kishida T., et al. (2020). Phylogenomics of the genus Tursiops and closely related Delphininae reveals extensive reticulation among lineages and provides inference about eco-evolutionary drivers. Mol. Phylogenet. Evol. 146, 106756. doi: 10.1016/j.ympev.2020.106756
Natoli A., Birkun A., Aguilar A., Lopez A., Hoelzel A. R. (2005). Habitat structure and the dispersal of male and female bottlenose dolphins (Tursiops truncatus). Proc. R. Soc. B-Biol. Sci. 272, 1217–1226. doi: 10.1098/rspb.2005.3076
Oremus M., Poole M. M., Albertson G. R., Baker C. S. (2012). Pelagic or insular? Genetic differentiation of rough-toothed dolphins in the Society Islands, French Polynesia. J. Exp. Mar. Biol. Ecol. 432–433. doi: 10.1016/j.jembe.2012.06.027
Oremus M., Poole M. M., Steel D., Baker C. S. (2007). Isolation and interchange among insular spinner dolphin communities in the South Pacific revealed by individual identification and genetic diversity. Mar. Ecol. Prog. Ser. 336, 275–289. doi: 10.3354/meps336275
Palumbi S. R., Martin A. P., Romano S., McMillan W. O., Stice L., Grawbowski G. (1991). A simple fool’s guide to PCR (Honolulu, HI: University of Hawai’i).
Parsons E. C., Dolman S. J., Wright A. J., Rose N. A., Burns W. C. (2008). Navy sonar and cetaceans: just how much does the gun need to smoke before we act? Mar. pollut. Bull. 56, 1248–1257. doi: 10.1016/j.marpolbul.2008.04.025
Parsons K. M., Durban J. W., Claridge D. E., Herzing D. L., Balcomb K. C., Noble L. R. (2006). Population genetic structure of coastal bottlenose dolphins (Tursiops truncatus) in the Northern Bahamas. Mar. Mammal Sci. 22, 276–298. doi: 10.1111/j.1748-7692.2006.00019.x
Payseur B. A., Rieseberg L. H. (2016). A genomic perspective on hybridization and speciation. Mol. Ecol. 25, 2337–2360. doi: 10.1111/mec.13557
Pradel R., Hines J. E., Lebreton J. D., Nichols J. D. (1997). Capture-recapture survival models taking account of transients. Biometrics 53, 60–72. doi: 10.2307/2533097
Pritchard J. K., Stephens M., Donnelly P. (2000). Inference of population structure using multilocus genotype data. Genetics 155, 945–959. doi: 10.1093/genetics/155.2.945
R Development Core Team (2022). R: A language and environment for statistical computing (Vienna, Austria: R Foundation for Statistical Computing). Available at: http://R-project.org.
Raymond M., Rousset F. (1995). Genepop (Version-1.2) - Population-Genetics Software for Exact Tests and Ecumenicism. Journal of Heredity 86, 248–249.
Reijnders P. J. H., Aguilar A., Borrell A. (2009). “Pollution and marine mammals,” in Encyclopedia of marine mammals. Eds. Perrin W. F., Wursig B., Thewissen J. G. M. (Oxford, UK: Elsevier), 890–898.
Rooney A. P., Merritt D. B., Derr J. N. (1999). Microsatellite diversity in captive bottlenose dolphins (Tursiops truncatus). J. Heredity 90, 228–231. doi: 10.1093/jhered/90.1.228
Rosel P. E., Forgetta V., Dewar K. (2005). Isolation and characterization of twelve polymorphic microsatellite markers in bottlenose dolphins (Tursiops truncatus). Mol. Ecol. Notes 5, 830–833. doi: 10.1111/j.1471-8286.2005.01078.x
Saiki R. K., Gelfand D. H., Stoffel S., Scharf S. J., Higuchi R., Horn G. T., et al. (1988). Primer-directed enzymatic amplification of DNA with a thermostable DNA-polymerase. Science 239, 487–491. doi: 10.1126/science.2448875
Sambrook J., Fritsch E. F., Maniatis T. (1989). Molecular cloning, a laboratory manual (Cold Spring Harbor, NY, USA: Cold Spring Harbor Laboratory Press).
Santostasi N. L., Bonizzoni S., Bearzi G., Eddy L., Gimenez O. (2016). A robust design capture-recapture analysis of abundance, survival and temporary emigration of three odontocete species in the Gulf of Corinth, Greece. PloS One 11, e0166650. doi: 10.1371/journal.pone.0166650
Schaurich M. D. N., Vieira Lopes F. R., de Oliveira L. R. (2012). Hybridization phenomenon in cetacean and pinniped species. Neotropical Biol. Conserv. 7, 1292–1303. doi: 10.4013/nbc.2012.73.06
Schwarz C. J., Arnason A. N. (1996). A general methodology for the analysis of capture-recapture experiments in open populations. Biometrics 52, 860. doi: 10.2307/2533048
Schwarz C. J., Arnason A. N. (2021). “Jolly-Seber models in MARK,” in Program MARK: a gentle introduction. Eds. Cooch E. G., White G. C. (Fort Collins, CO, USA: Colorado State University). Available at: http://www.phidot.org/software/mark/docs/book/pdf/chap12.pdf.
Seber G. A. F. (1965). A note on the multiple recapture census. Biometrika 52, 249–259. doi: 10.1093/biomet/52.1-2.249
Seber G. (1982). The estimation of animal abundance and related parameters. 2nd edn (New York, NY, USA: Macmillan).
Shaw K. L. (2002). Conflict between nuclear and mitochondrial DNA phylogenies of a recent species radiation: what mtDNA reveals and conceals about modes of speciation in Hawaiian crickets. Proc. Natl. Acad. Sci. 99, 16122–16127. doi: 10.1073/pnas.242585899
Shinohara M., Domingo-Roura X., Takenaka O. (1997). Microsatellites in the bottlenose dolphin Tursiops truncatus. Mol. Ecol. 6, 695–696. doi: 10.1046/j.1365-294X.1997.00231.x
Silva M. A., Magalhães S., Prieto R., Santos R. S., Hammond P. S. (2009). Estimating survival and abundance in a bottlenose dolphin population taking into account transience and temporary emigration. Mar. Ecol. Prog. Ser. 392, 263–276. doi: 10.3354/meps08233
Silva M. A., Prieto R., Magalhães S., Seabra M. I., Santos R. S., Hammond P. S. (2008). Ranging patterns of bottlenose dolphins living in oceanic waters: implications for population structure. Mar. Biol. 156, 179–192. doi: 10.1007/s00227-008-1075-z
Simonis A. E., Brownell R. L. Jr., Thayre B. J., Trickey J. S., Oleson E. M., Huntington R., et al. (2020). Co-occurrence of beaked whale strandings and naval sonar in the Mariana Islands, Western Pacific. Proc. R. Soc. Biol. Sci. 287, 20200070. doi: 10.1098/rspb.2020.0070
Southall B. L., Nowacek D. P., Miller P. J. O., Tyack P. L. (2016). Experimental field studies to measure behavioral responses of cetaceans to sonar. Endangered Species Res. 31, 293–315. doi: 10.3354/esr00764
Speakman T. R., Lane S. M., Schwacke L. H., Fair P. A., Zolman E. S. (2010). Mark-recapture estimates of seasonal abundance and survivorship for bottlenose dolphins (Tursiops truncatus) near Charleston, South Carolina. J. Cetacean Res. Manage. 11, 153–162. doi: 10.47536/jcrm.v11i2.621
Suntsov A., Domokos R. (2013). Vertically migrating micronekton and macrozooplankton communities around Guam and the Northern Mariana Islands. Deep Sea Res. Part I: Oceanogr. Res. Pap. 71, 113–129. doi: 10.1016/j.dsr.2012.10.009
Tezanos-Pinto G., Baker C. S., Russell K., Martien K. K., Baird R. W., Hutt A., et al. (2009). A worldwide perspective on the population structure and genetic diversity of bottlenose dolphins (Tursiops truncatus) in New Zealand. J. Heredity 100, 11–24. doi: 10.1093/jhered/esn039
Urian K., Gorgone A. M., Read A. J., Balmer B. C., Wells R. S., Berggren P., et al. (2015). Recommendations for photo-identification methods used in capture-recapture models with cetaceans. Mar. Mammal Sci. 31, 298–321. doi: 10.1111/mms.12141
Valsecchi E., Amos W. (1996). MIcrosatellite markers for the study of cetacean populations. Mol. Ecol. 5, 151–156. doi: 10.1111/j.1365-294X.1996.tb00301.x
Van Cise A. M., Baird R. W., Harnish A. E., Currie J. J., Stack S. H., Cullins T., et al. (2021). Mark-recapture estimates suggest declines in abundance of common bottlenose dolphin stocks in the main Hawaiian Islands. Endangered Species Res. 45, 37–53. doi: 10.3354/esr01117
White G. C., Burnham K. P. (1999). Program MARK: survival estimation frm populations of marked animals. Bird Study 46 Supplement, 120–138. doi: 10.1080/00063659909477239.
Williams I. D., Baum J. K., Heenan A., Hanson K. M., Nadon M. O., Brainard R. E. (2015). Human, oceanographic and habitat drivers of central and western Pacific coral reef fish assemblages. PloS One 10, e0120516. doi: 10.1371/journal.pone.0120516
Willis P. M., Crespi B. J., Dill L. M., Baird R. W., Hanson M. B. (2004). Natural hybridization between Dall’s porpoises (Phocoenoides dalli) and harbour porpoises (Phocoena phocoena). Can. J. Zool. 82, 828–834. doi: 10.1139/z04-059
Yano K. M., Hill M. C., Oleson E. M., McCullough J. L. K., Henry A. E. (2022). Cetacean and seabird data collected during the Mariana Archipelago Cetacean Survey (MACS), May-July 2021, (NOAA Technical Memorandum NMFS-PIFSC-128) (Honolulu, HI, USA: U.S. Department of Commerce). doi: 10.25923/7pbh-zq68
Ylitalo G. M., Baird R. W., Yanagida G. K., Webster D. L., Chivers S. J., Bolton J. L., et al. (2009). High levels of persistent organic pollutants measured in blubber of island-associated false killer whales (Pseudorca crassidens) around the main Hawaiian Islands. Mar. pollut. Bull. 58, 1932–1937. doi: 10.1016/j.marpolbul.2009.08.029
Keywords: abundance, genetics, island-associated, photo-identification, common bottlenose dolphin, Mariana Islands
Citation: Martien KK, Hill MC, Archer FI, Baird RW, Bendlin AR, Dolar L, Ligon AD, Oleson EM, Robertson KM, Woodman SM, Ü AC, Yano KM and Bradford AL (2024) Evidence of a small, island-associated population of common bottlenose dolphins in the Mariana Islands. Front. Mar. Sci. 10:1254959. doi: 10.3389/fmars.2023.1254959
Received: 07 July 2023; Accepted: 22 December 2023;
Published: 18 January 2024.
Edited by:
Masao Amano, Nagasaki University, JapanReviewed by:
Francine Kershaw, Natural Resources Defense Council, United StatesStephen C.Y. Chan, Cetacea Research Institute, Hong Kong SAR, China
Copyright © 2024 Martien, Hill, Archer, Baird, Bendlin, Dolar, Ligon, Oleson, Robertson, Woodman, Ü, Yano and Bradford. This is an open-access article distributed under the terms of the Creative Commons Attribution License (CC BY). The use, distribution or reproduction in other forums is permitted, provided the original author(s) and the copyright owner(s) are credited and that the original publication in this journal is cited, in accordance with accepted academic practice. No use, distribution or reproduction is permitted which does not comply with these terms.
*Correspondence: Karen K. Martien, Karen.Martien@noaa.gov
†Present addresses: Louella Dolar, Institute of Environmental and Marine Sciences, Silliman University, Dumaguete City, PhilippinesSamuel M. Woodman, Southwest Fisheries Science Center, National Marine Fisheries Service, NOAA, La Jolla, CA, United States
‡These authors have contributed equally to this work and share first authorship