 Jun-Hong Wang
 Hua Li
 Hong-Kuan Yang
 Ru-Dong Chen
- Department of Neurosurgery, Tongji Hospital, Tongji Medical College, Huazhong University of Science and Technology, Wuhan, China
Objective: The aim of this study was to explore the correlation between the mean of 24-h venous blood glucose (BG) and in-hospital mortality and all-cause mortality (ACM) in patients with subarachnoid hemorrhage (SAH).
Methods: Detailed clinical information was acquired from the Medical Information Mart for Intensive IV (MIMIC-IV) database. The best cutoff value of mean BG was calculated using the X-tile program. Univariate and multivariate logistic regressive analyses were utilized to analyze the prognosis significance of mean BG, and survival curves were drawn using the Kaplan-Meier (K-M) approach. To improve the reliability of results and balance the impact of underlying confounders, the 1:1 propensity score matching (PSM) approach was utilized.
Results: An overall of 1,230 subjects were selected herein. The optimal cutoff value of the mean BG for in-hospital mortality was 152.25. In addition, 367 pairs of score-matched subjects were acquired after PSM analysis, and nearly all variables' differences were balanced. K-M analysis showed that patients with mean BG ≥ 152.25 mg/dl had significantly higher in-hospital, 3-month, and 6-month mortalities compared with patients with mean BG < 152.25 mg/dl (p < 0.001). The multivariable logistic regressive analyses revealed that patients with mean BG ≥ 152.25 mg/dl had significantly increased in-hospital mortality compared with patients with mean BG < 152.25 mg/dl after the adjustment for possible confounders (OR = 1.994, 95% CI: 1.321–3.012, p = 0.001). Similar outcomes were discovered in the PSM cohort.
Conclusion: Our data suggested that mean BG was related to ACM of patients with SAH. More studies are needed to further analyze the role of the mean of 24-h venous BG in patients with SAH.
Introduction
Subarachnoid hemorrhage (SAH) is one of the major health issues, with a 30-day death rate between 18 and 40% as per previously published studies (1, 2). Survivors are usually unable to regain independence from serious disability or have difficulties in communications, retention, or execution. Therefore, discovering prediction factors of the short-term or long-term prognostic results is imperative.
Previous researchers have discovered risky factors related to unsatisfactory prognoses (3–6). BG contents are usually increased on admission posterior to SAH, which might indicate a stress reaction to the bleeding (7–11). High blood glucose (BG) is common in critically ill patients (CPs), and the association between admission high BG and death rate was broadly researched as well. Liu et al. revealed that admission BG > 142.00 mg/dl (7.91 mmol/L) was related to elevated risks of modified 30- and 90-day all-cause mortality (ACM) in CPs (12). Moreover, statistically, Eagles et al. discovered a remarkable reduction in unsatisfactory prognoses among SAH sufferers maintaining the maximal BG contents lower than a determined best cutoff of 9.2 mmol/L (13). Meanwhile, Okazaki et al. found that minimum BG levels on admission were remarkably related to unsatisfactory neurological results in SAH sufferers (14). However, admission BG contents can change quickly due to stress response and altered nutrition consumption. In addition, BG is often measured clinically when there is aggravation, which might cause sampling bias. The objective of this research was to evaluate whether, in SAH sufferers, the mean of 24-h venous BG levels on ICU admission could be a better prediction factor of in-hospital death than single admission BG level alone.
Materials and methods
Data sources
Herein, data were acquired from a vital public database called MIMIC-IV (15). This database contains the information of sufferers admitted to the Beth Israel Deaconess Medical Center (BIDMC) between 2008 and 2019. Posterior to the completion of the National Institutes of Health (NIH) training course and the Protecting Human Research Participants test, our team acquired relevant information from MIMIC-IV. One researcher J-HW obtained approval to exploit the database. Besides, our research was accepted by the Ethics Board of our institution. The findings herein were reported using the Strengthening the Reporting of Observational Studies in Epidemiology guidelines (16).
Study population
The diagnosis of SAH was on the basis of the International Classification of Disease, Ninth Revision. Sufferers meeting the entire standards were selected for analyses: (1) first admission to ICU; (2) age >18 years; and (3) complete records of BG examination within the first 24 h of ICU admission. The exclusion criteria were as follows: (1) ICU patients with a length of stay <24 h and (2) only one BG information in the first 24 h in ICU.
Data acquisition
The variates stated below were acquired from the aforesaid database for the first day of ICU admission: (1) demographical variates: sex, age, and race; (2) vital signs (refer to the abbreviation list at the end of our thesis): HR, SBP, DBP, RR, temperature, and SpO2; (3) coexisting diseases: myocardium infarction, congestion-related cardiac failure, peripheral vascular illness, cerebral vascular illness, persistent lung illness, mild hepatic illness, diabetic illness, and high blood pressure; and (4) lab events (refer to the abbreviation list at the end of our thesis): WBC, neutrophil count, monocyte count, INR, PT, APTT, and BG were identified in the first 24 h of ICU admission. If a variate was identified more than once in the first 24 h, the average was utilized. (5) Severity at admission was identified via the SOFA scoring, the SAPS II, APS III, and GCS. (6) Duration of ICU stay, duration of hospitalization, in-hospital death, 3-month death, and 6-month death was recorded.
Endpoints
In-hospital death, duration of ICU stay, duration of hospitalization, 3-month death, and 6-month death were regarded as endpoints.
Statistics
The continuous variates were displayed as average ± standard deviation (SD) or mid-value (interquartile range). The Student's t-test or Mann-Whitney U-test was used according to the normality of the distribution. Categorical variates were displayed as case quantity (%), and the chi-square test (or Fisher's exact approach) was used for analyses.
The best cutoff value of mean BG was calculated by receiver operating characteristic (ROC) curve analysis using the highest Youden index for predicting survival status. Patients were separated into two groups according to mean BG, namely, low glucose (<152.25 mg/dl) and high glucose (≥152.25 mg/dl). Our team established a generalized additive model (GAM) to identify the non-linear association between mean BG and in-hospital ACM in CPs with SAH. Moreover, our team visualized the association between mean BG and sufferers' survival via the Kaplan-Meier (K-M) analysis and utilized the log-rank test for assumption verification.
The univariate and multivariate regressive analyses were completed to relieve the interference of possible confounding factors in the in-hospital mortality. The screening of confounders was based on: (1) the factor exerted an impact (>10%) on the research variate; (2) certain factors might remarkably affect the outcome variate according to past experiences. (3) For univariate analysis, our team modified the variates, of which p < 0.05. In the crude model, no variate was modified. In Model I, age, sex, and ethnicity were modified. Model II was modified in terms of age, sex, race, HR, RR, SpO2, PT, and APTT. Based on Model II, our team modified the other four variates, including hypertension, SOFA, GCS, and DBP in our Model III. Based on Model III, our team modified those variates in Model IV, including SAPS II, APS III, diabetes, mild liver disease, INR, vasospasm, DCI, urinary tract infection, sepsis, pneumonia, and WFNS grade.
Given that the sufferer screening standards can hardly be fully stochastic, our team utilized the propensity score matching (PSM) approach to realize the equilibrium of the impact of selection bias and underlying confounders. PSM analyses were on the basis of the logistic regressive model, and the propensity scoring was computed as per age and gender. The pairs of patients with low glucose (<152.25 mg/dl) and high glucose (≥152.25 mg/dl)were acquired using 1:1 matching with a caliper of 0.01. Ultimately, an overall 734 sufferers were propensity score-matched, and 367 pairs of score-matched sufferers were obtained.
Subgroup analyses were completed through a logistic regressive model as per age (<65 and ≥65 years), sex, myocardium infarction, congestion cardiac failure, peripheral vascular illness, cerebral vascular illness, persistent lung illness, mild hepatic illness, diabetic illness, and high blood pressure. Every test was two-sided, and p < 0.05 had significance on statistics.
Every analysis was completed via the statistic program packages R 3.3.2 (http://www.R-project.org, The R Foundation) and Free Statistic program 1.1. A two-tailed test was completed, and p < 0.05 had significance in statistics.
Results
Baseline features of patients
Overall, 1,230 sufferers meeting the standards were selected (Figure 1). The ROC curve of mean BG was plotted, and its AUC and Youden index were 0.673 (95% CI 0.630–0.715) and 0.308, respectively. The corresponding best cutoff value was 152.25, and the evaluation sensitiveness and specificness were 57.1 and 73.7%, respectively. Based on the cutoff value, 1,230 patients were divided into low glucose (mean BG < 152.25 mg/dl, n = 839) and high glucose (mean BG ≥ 152.25 mg/dl, n = 391). The demographics, vital signs, coexisting diseases, scoring, lab tests, and other related data between survivor and non-survivor groups are displayed in Supplementary Table 1. Compared with survivors, sufferers in the non-survivor group were older (age mid-value: 66.8 vs. 61.9 years, p < 0.001), with greater morbidity of coexisting diseases such as peripheral vascular illness and pneumonia; higher APS III scores, SAPS II scores, WFNS grade IV, and WFNS grade V; and lower GCS scores, WFNS grade I, and WFNS grade II (all p-values<0.05) (Supplementary Table 1).
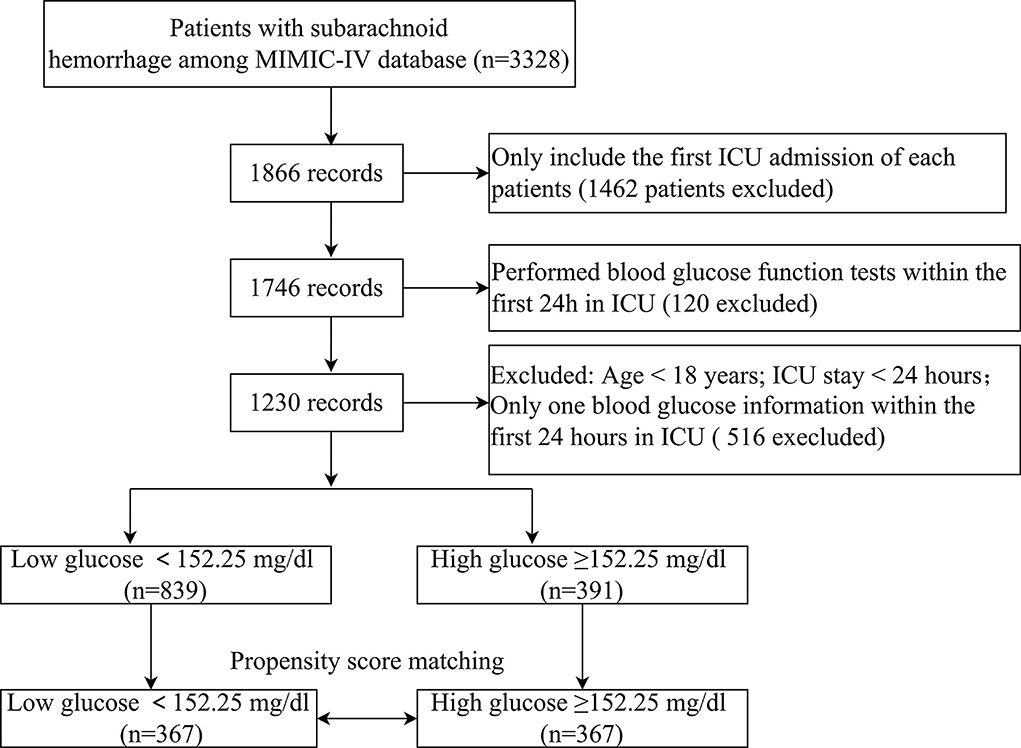
Figure 1. The flow chart of this study.
The clinical features of CPs with SAH across two groups based on mean BG contents are displayed in Table 1. In this study, the average age of patients was 62.7 ± 17.0 years, and approximately 49.0% of them were women. Remarkable diversities were identified in age, gender, ethnicity, HR, RR, SpO2, peripheral vascular disease diabetes, mild liver disease, INR, and PT between diverse groups (p < 0.05). Compared with patients with mean BG<152.25 mg/dl, patients with mean BG ≥ 152.25 mg/dl were at greater risks of longer ICU stay (6.0 vs. 5.0 days, p < 0.001), in-hospital death (32 vs. 11.2%, p < 0.001), 3-month death (33.2 vs. 12%, p < 0.001), and 6-month death (33.8 vs. 12%, p < 0.001) (Table 1).
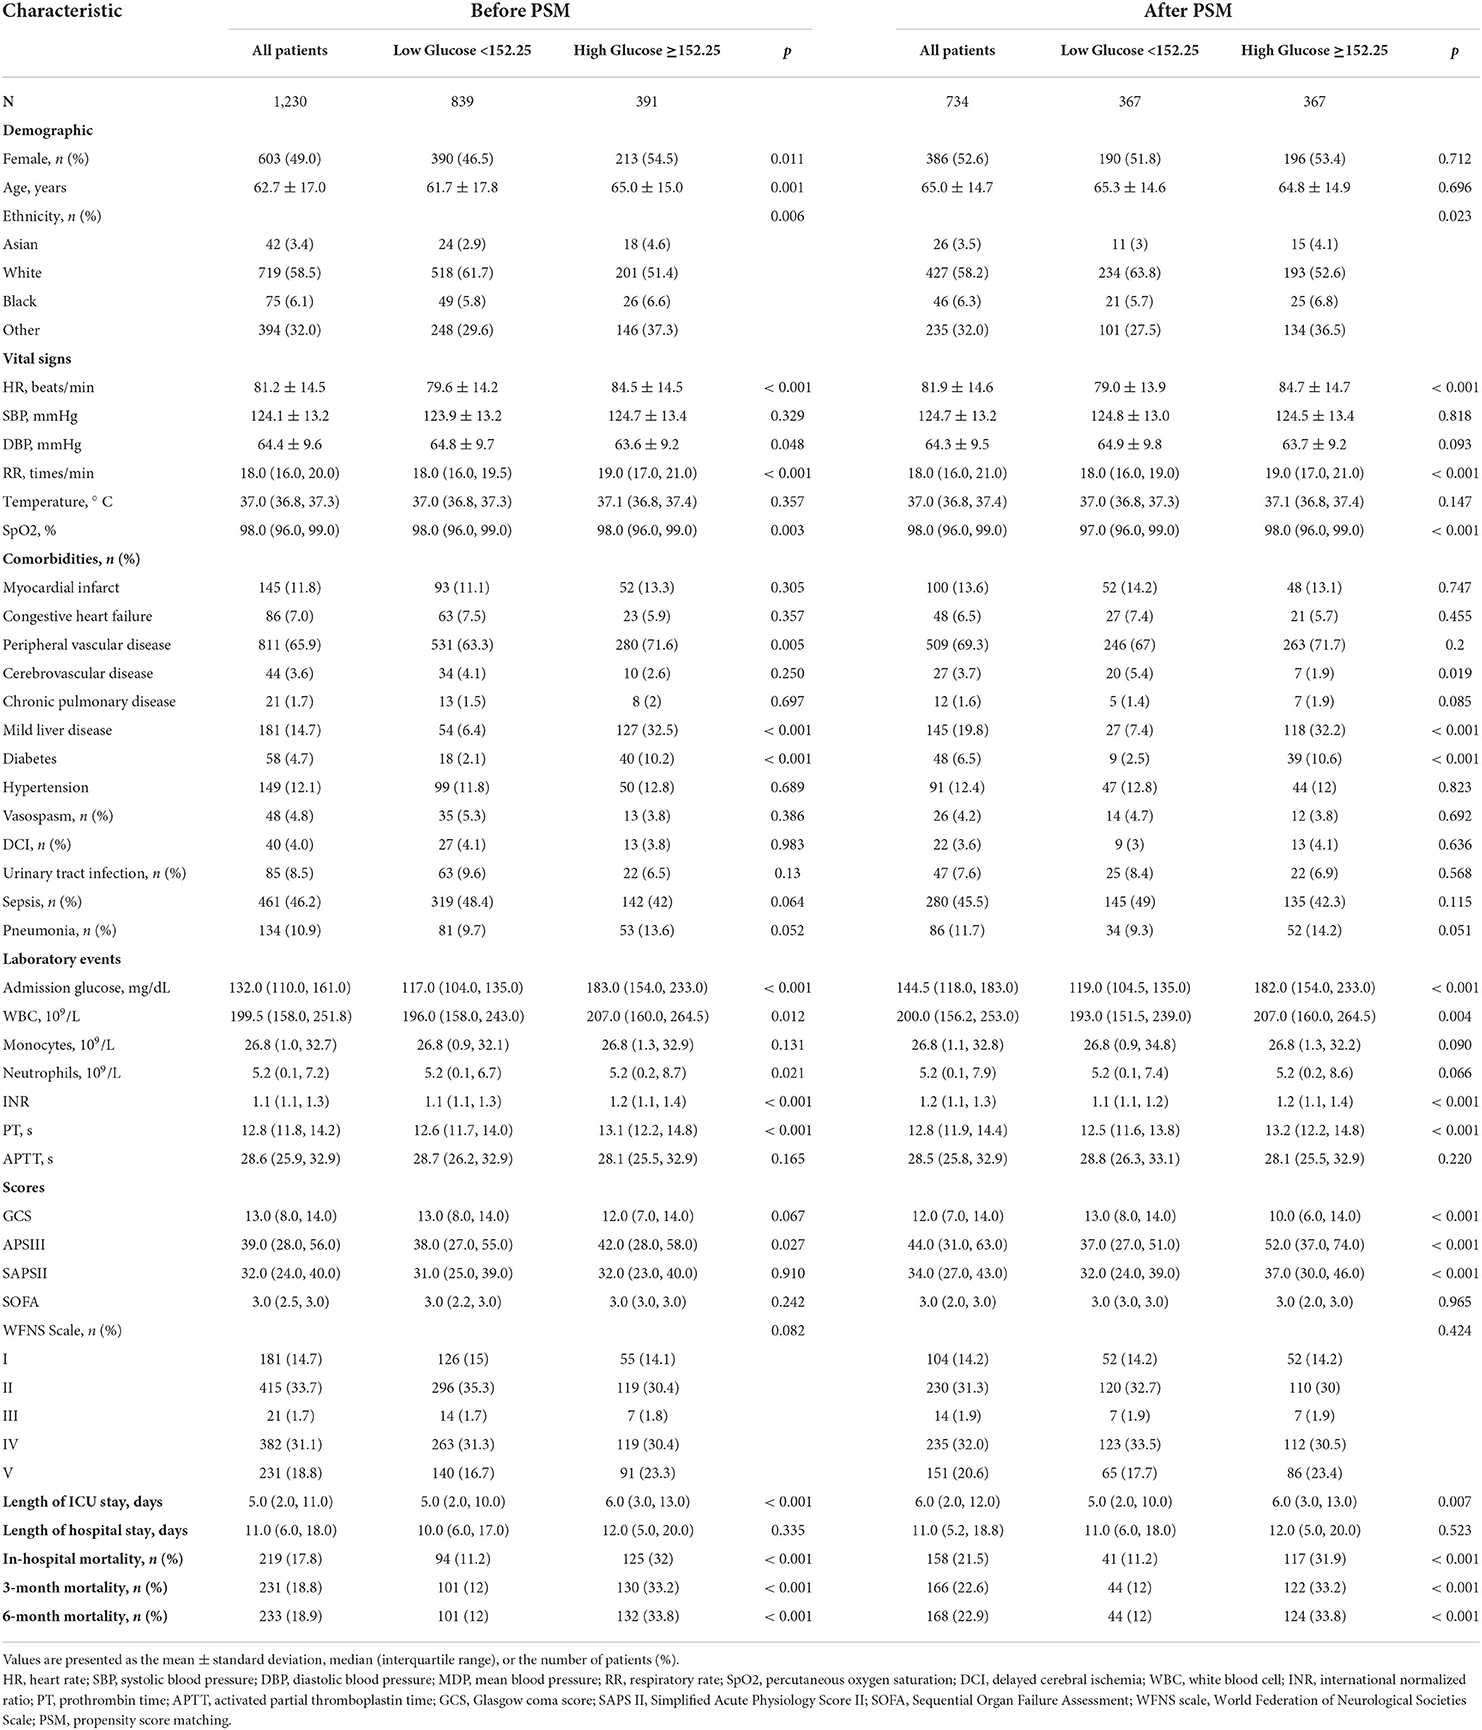
Table 1. The clinical characteristics in critically ill patients with SAH before and after PSM.
Association between mean bg and all-cause in-hospital mortality in patients with SAH
The GAM analysis revealed a U-shaped relationship between mean BG and in-hospital ACM in SAH sufferers, which revealed that aberrant mean BG might be related to elevated in-hospital death (Figure 2). The K-M curves contrasting the two groups are displayed in Figure 3. Sufferers with mean BG≥152.25 mg/dl had a significantly higher in-hospital mortality rate (Figure 3A), 3-month mortality (Figure 3B), and 6-month mortality (Figure 3C) compared with patients with mean BG < 152.25 mg/dl (p < 0.001). The mean BG group (≥152.25 mg/dl) exhibited a remarkably increased risk of in-hospital death (OR, 95% CI: 3.724, 2.754-5.037, p < 0.001), 3-month death (OR, 95% CI: 3.639, 2.707–4.892, p < 0.001), and 6-month death (OR, 95% CI: 3.724, 2.772–5.003, p < 0.001) compared with the mean BG group (< 152.25 mg/dl) (Figure 3D).
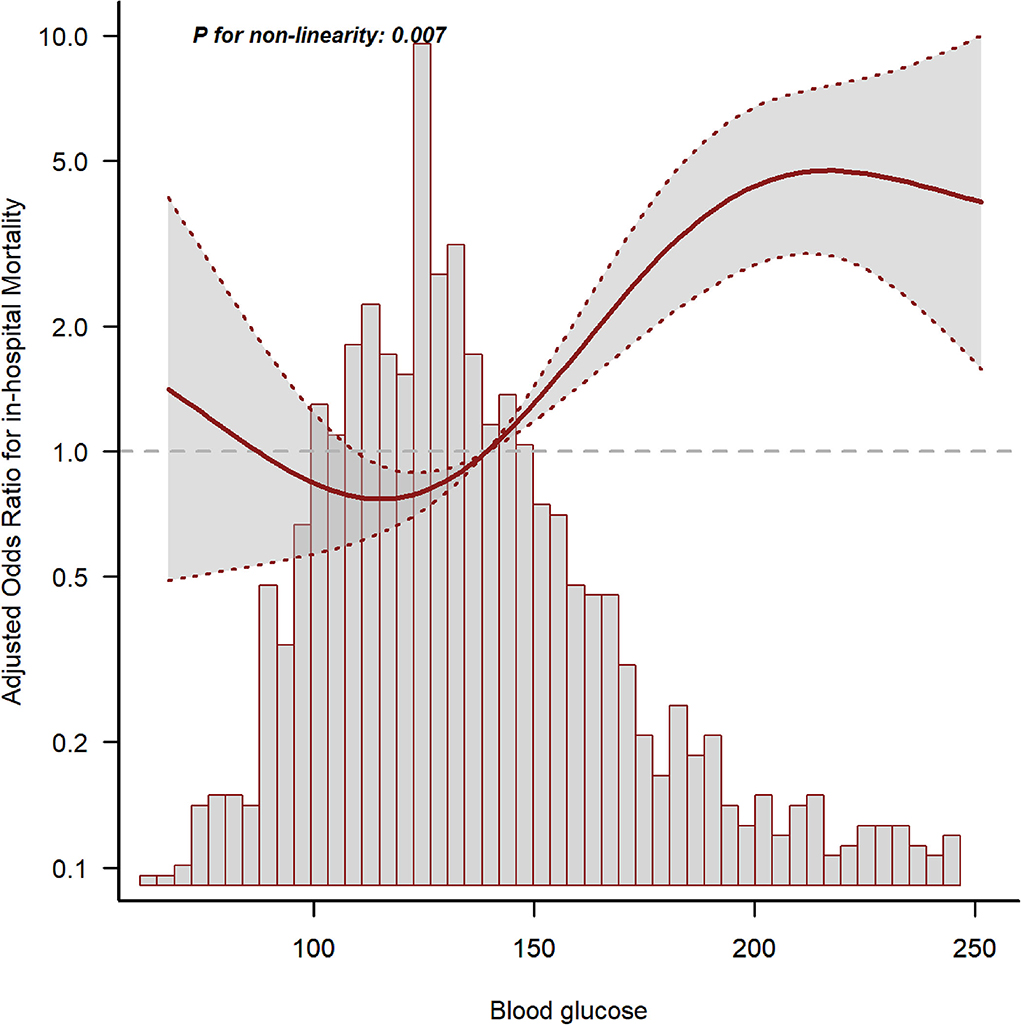
Figure 2. The relationship between mean blood glucose (BG) and in-hospital mortality. The solid line shows the smooth curve fit between variables. The red dotted line represents the 95% CI of the fit.
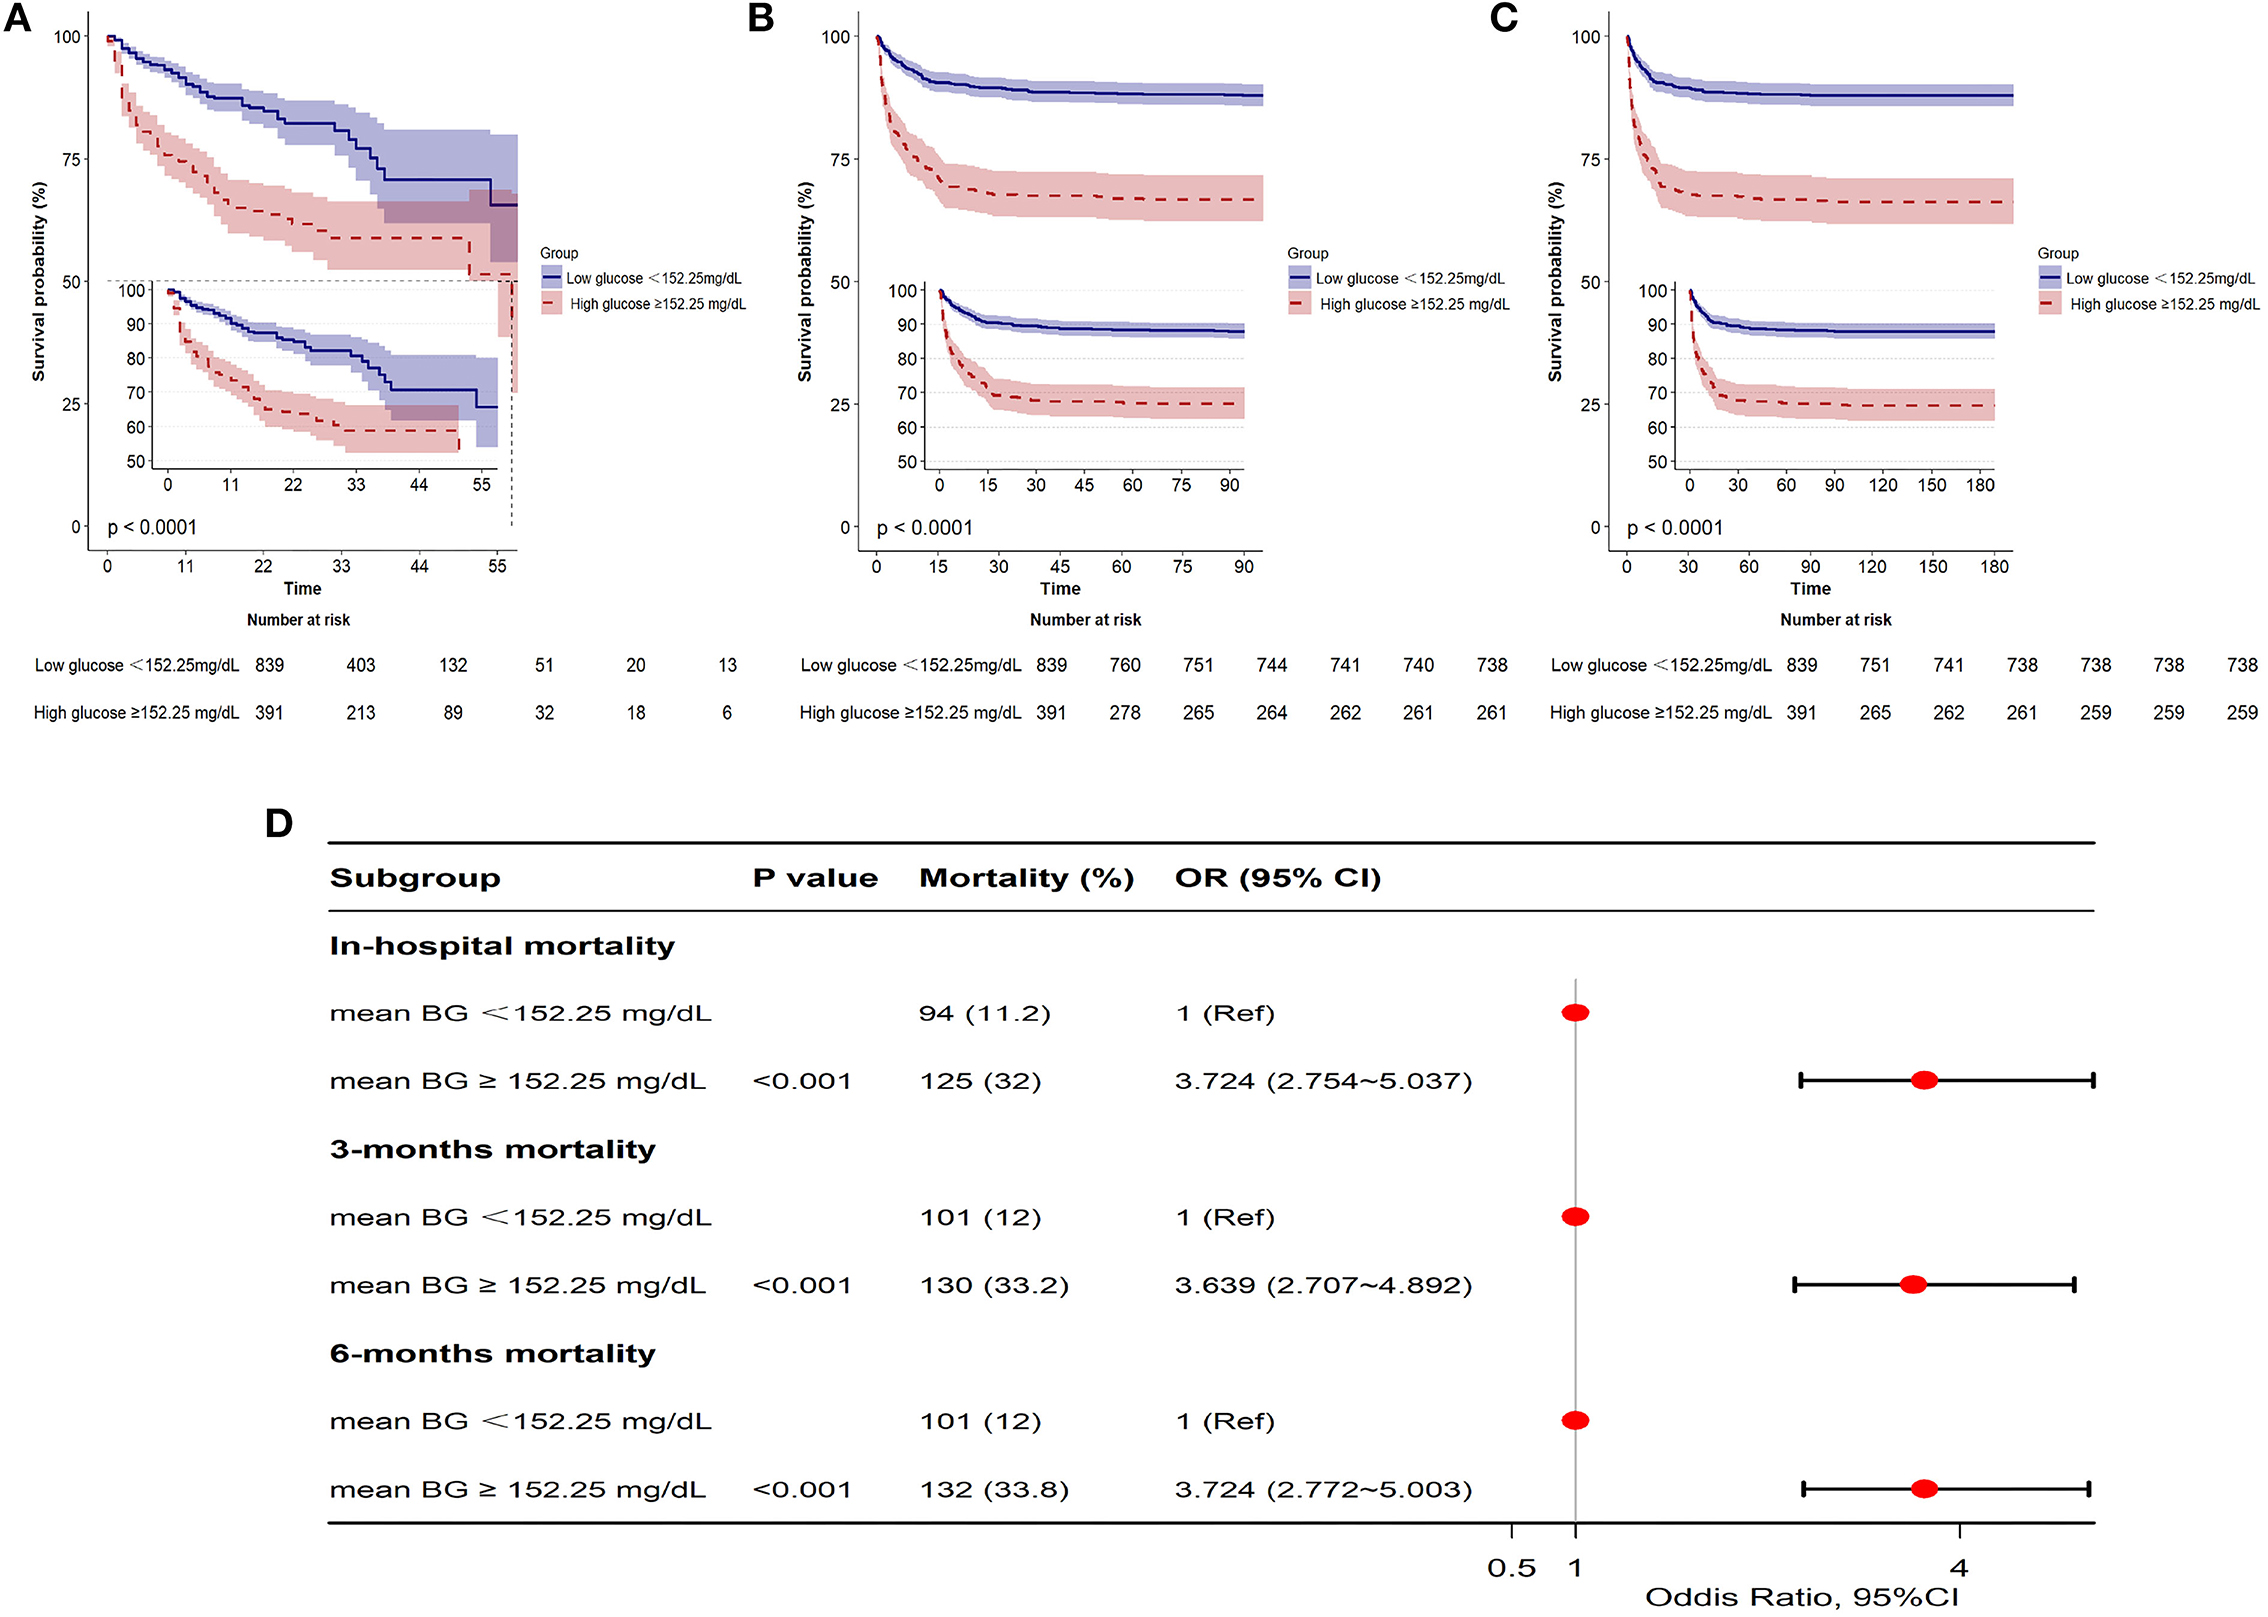
Figure 3. Kaplan-Meier (K-M) curves indicate the relationship between the mean BG and in-hospital mortality (A), 3-month mortality (B), and 6-month mortality (C). Red line: high glucose ≥152.25 mg/dl; blue line: low glucose <152.25 mg/dl. Forest plot of the results based on logistic regression analysis (D).
Our team utilized logistic proportion risk models to independently analyze the effects of mean BG on the risks of in-hospital death (univariable and multivariable logistic proportion risk models) (Supplementary Table 2; Table 2). In the crude model, the increase in mean BG was related to in-hospital death (OR = 1.009, 95% CI: 1.006–1.012, p < 0.001). In multivariate analysis, Model I was modified in terms of age, sex, and ethnicity; Model II was modified in terms of age, sex, ethnicity, HR, RR, SpO2, PT, and APTT; Model III was adjusted for Model II, DBP, hypertension, SOFA, and GCS. Based on Model III, we further modified those variates in Model IV, including SAPS II, APS III, diabetes, mild liver disease, INR, vasospasm, DCI, urinary tract infection, sepsis, pneumonia, and WFNS grade, and the results showed that patients with mean BG≥152.25 mg/dl had significantly higher in-hospital mortality compared with patients with mean BG<152.25 mg/dl (Model I: OR =3.453, 95% CI: 2.528–4.716, p < 0.001; Model II: OR = 2.825, 95% CI: 2.043–3.905, p < 0.001; Model III: 2.618, 95% CI: 1.875–3.656, p < 0.001; Model IV: OR = 1.994, 95% CI: 1.321–3.012, p = 0.001) (Table 2).
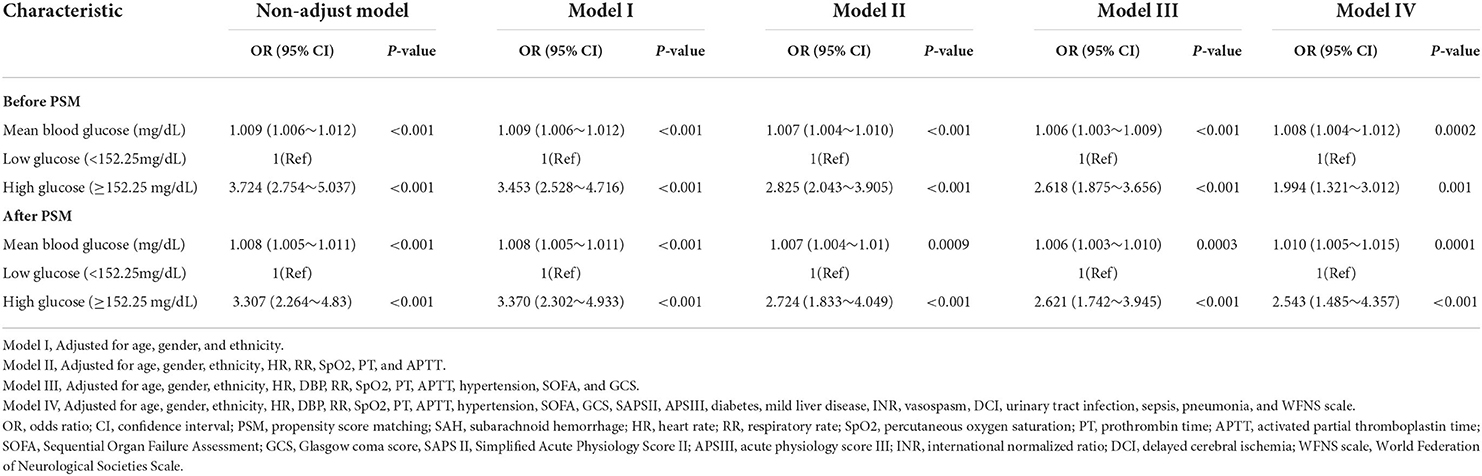
Table 2. Multivariate logistic regression analyses for in-hospital mortality in patients with SAH before and after PSM.
Cutoff values of mean BG and admission BG, and their correlation with in-hospital mortality
For the sake of evaluating the underlying prediction merit of the mean BG and admission BG for in-hospital mortality, ROC curve analyses were completed, and the AUC for mean BG and admission BG were 0.673 (95% CI: 0.630–0.715; p < 0.001) and 0.652 (95% CI: 0.610–0.694; p < 0.001), separately (Figure 4). The optimal cutoff values were 152.25 and 141.5, separately.
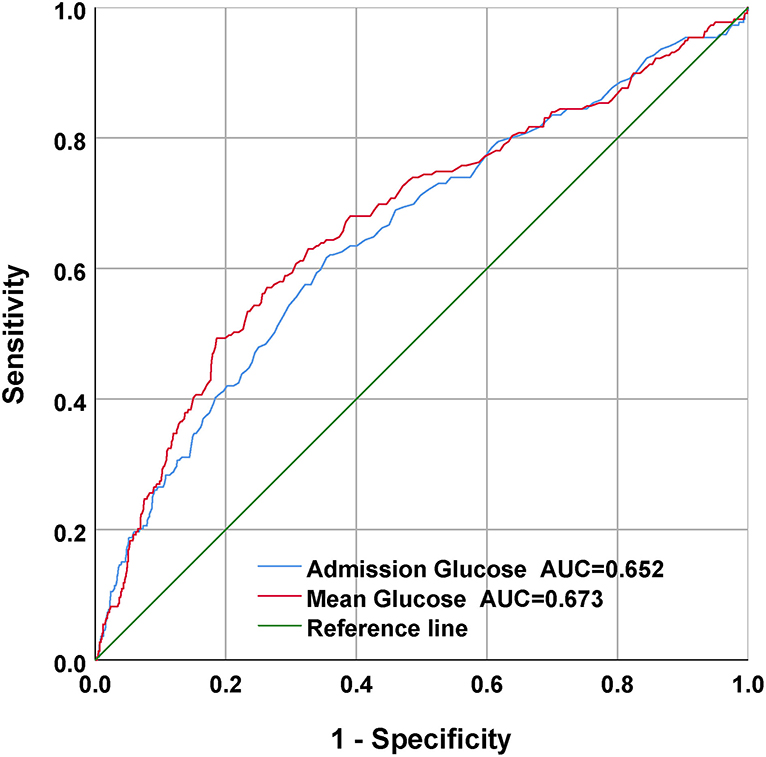
Figure 4. The receiver operating characteristic (ROC) curves of the predictive value of mean BG and admission BG for in-hospital mortality.
Subgroup analysis
Subgroup analyses of age (<65 and ≥65 years), sex, and coexisting diseases were utilized to compare the in-hospital mortality between the two groups, and the outcomes are displayed in Figure 5. The interplay between the mean BG and the entire subgroup factors was studied and no remarkable interplay was identified. (p > 0.05).
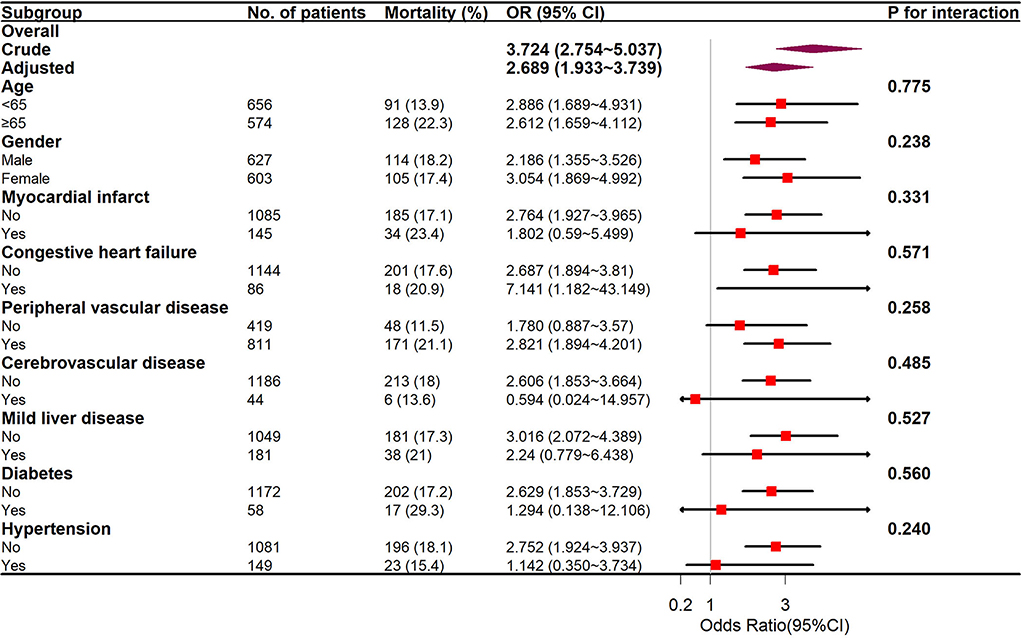
Figure 5. The relationship between mean BG and in-hospital mortality in subgroup analysis.
Prognosis value of mean BG after PSM
Given the imbalanced baseline features between the two groups, our team completed a 1:1 ratio PSM to realize the equilibrium of the latent confounders, and 367 pairs of score-matched sufferers were acquired. The baseline features of sufferers posterior to PSM analysis are displayed in Table 1. Posterior to PSM analysis, remarkable diversities between the two groups were still identified in the duration of ICU stay (6.0 vs. 5.0 days, p = 0.007), in-hospital death (31.9 vs. 11.2%, p < 0.001), 3-month death (33.2 vs. 12%, p < 0.001), and 6-month death (33.8 vs. 12%, p < 0.001).
The outcomes of multivariable logistic regressive analyses in sufferers posterior to PSM analysis revealed that mean BG ≥ 152.25 mg/dl was still an independent prediction factor of in-hospital death (Model I: OR = 3.370, 95% CI: 2.302–4.933, p < 0.001; Model II: OR = 2.724, 95% CI: 1.833–4.049, p < 0.001; Model III: OR = 2.621, 95% CI: 1.742–3.945, p < 0.001; and Model IV: OR = 2.543, 95% CI: 1.485–4.357, p < 0.001) (Table 2).
Discussion
Our research was completed to analyze the relationship between mean BG and in-hospital death in CPs with SAH. The results showed that mean BG, as a continuous or categorical variate, was remarkably related to in-hospital death in multivariable logistic regressive analyses. In addition, statistically, our team discovered a remarkable elevation in unsatisfactory prognoses among sufferers maintaining mean BG contents higher than a determined best cutoff value of 152.25. Moreover, mean BG had a higher AUC value in the ROC analysis and had a better prognostic performance for in-hospital mortality than admission BG, which had been largely ignored in previous studies.
McIntyre et al. published a single-center retrospective cohort research based on 217 SAH sufferers, which showed that elevated mean BG levels were independently associated with worse outcomes. Higher mean BG could independently serve as a risk factor for the death rate and could best discriminate patients with SAH at risk of death (17). Those outcomes resembled our discoveries. Nevertheless, our research merely selected 217 sufferers and neglected multiple vital confounding factors, such as hypertension (18) and GCS score (19). In this study, we conducted the largest cohort study (n = 1,230), utilized an extended model strategy to modify the latent confounding factors, and discovered a steady association between mean BG and in-hospital death.
The reasons why we used average BG in this study are as follows. First, previous studies have demonstrated that high BG is common in CPs (12, 20–23). Frontera et al. retrospectively completed a cohort study of 281 SAH sufferers and found that high BG posterior to SAH was related to severe complicating diseases, more ICU stay, and elevated risk of death or serious disability (8). The study finished by Latorre et al. demonstrated that valid GLU management to sustain BG < 140 mg/dl was related to superior neurological results in SAH sufferers (9). However, few studies on the relationship between the mean of 24-h BG and the prognosis of subarachnoid hemorrhage were carried out. Second, admission BG contents can vary quickly due to stress response, altered nutrition consumption, catecholamine, cortisol, and the use of beta-blockers, or insulin. In addition, GLU is usually determined clinically when there is aggravation, which might give rise to sampling bias. The objective of our research was to reveal whether, in sufferers with SAH, the mean of 24-h venous BG levels on ICU admission can be a better prediction factor of in-hospital death than single admission BG level alone. Third, our results revealed that mean BG had a higher AUC value in the ROC analysis and had a better prognostic performance for in-hospital mortality than admission BG, which had been largely ignored in previous studies (Figure 4). Moreover, multivariate regressive analyses showed that mean BG was still related to in-hospital mortality after we adjusted potential risk factors (p < 0.05) (Table 2). Nevertheless, admission BG was not related to in-hospital mortality after we adjusted these factors (p > 0.05). Therefore, the average BG was utilized in this study.
A meta-analysis revealed that posterior to aneurysmal SAH, high BG contents on admission were common and that high BG on admission was related to unsatisfactory prognoses (24). There are several potential explanations for the relationship between high BG and unsatisfactory prognoses posterior to SAH. First, high BG on admission and high mean BG contents could derive from the stress response; therefore, they could merely denote the magnitude of the initial insult. Normally, it is suggested that the two main causal links related to stress high BG in acutely ill sufferers are reinforced liver GLU generation and elevated insulin resistance (25, 26). Second, high BG indicates aberrant GLU metabolic activity in diabetic illnesses or preexistent but undiscovered diabetic illnesses. A previous study revealed that diabetes mellitus increased the risk of poor outcomes following aneurysmal subarachnoid hemorrhage (27). Third, in this study, patients with high mean BG were older and had more comorbidities, all of which could be latent confounders eliciting elevated in-hospital ACM in SAH sufferers.
There were certain strengths in our research. The sample size herein was sufficient to determine a remarkable relationship between mean BG and in-hospital mortality in SAH sufferers. In addition, the in-depth analyses of covariable data enabled us to modify latent confounders which might influence the relationship between mean BG and mortality. Our study also explored the non-linear association between mean BG and poor outcomes, which indicated that aberrant mean BG might be related to elevated in-hospital mortality.
Despite the values of these findings, there remained certain deficiencies. First, this single-center research was finished retrospectively; therefore, multicenter prospective studies are required to substantiate our discoveries. Second, the data regarding the mean BG of certain sufferers were absent or not suitable for analysis. Therefore, these patients were excluded from this research, which might elicit selection bias, and this was one of the causes why the PSM method was utilized herein. Third, the mean BG could be influenced by a variety of factors such as diabetes, inflammation, and insulin, which might have biased the results.
Conclusion
Our findings demonstrated that the mean of 24-h venous BG was associated with in-hospital mortality among patients with SAH. According to our results, compared with patients with mean BG < 152.25 mg/dl, patients with mean BG ≥ 152.25 mg/dl were at higher risk of prolonged ICU stay, in-hospital mortality, 3-month mortality, and 6-month mortality.
Data availability statement
Publicly available datasets were analyzed in this study. This data can be found here: PhysioNet, https://physionet.org/, doi: 10.13026/s6n6-xd98.
Ethics statement
The studies involving human participants were reviewed and approved by the Massachusetts Institute of Technology and Beth Israel Deaconess Medical Center. Written informed consent to participate in this study was provided by the participant's legal guardian/next of kin.
Author contributions
J-SY and J-HW designed this study, analyzed the data, and wrote the manuscript. H-KY, HL, and R-DC reviewed, interpreted, and checked clinical data. All authors contributed to the article and approved the submitted version.
Acknowledgments
We thank Dr. Liu Jie (People's Liberation Army of China General Hospital, Beijing, China) for helping in Data availability statement.
Conflict of interest
The authors declare that the research was conducted in the absence of any commercial or financial relationships that could be construed as a potential conflict of interest.
Publisher's note
All claims expressed in this article are solely those of the authors and do not necessarily represent those of their affiliated organizations, or those of the publisher, the editors and the reviewers. Any product that may be evaluated in this article, or claim that may be made by its manufacturer, is not guaranteed or endorsed by the publisher.
Supplementary material
The Supplementary Material for this article can be found online at: https://www.frontiersin.org/articles/10.3389/fneur.2022.904293/full#supplementary-material
Abbreviations
HR, heart rate; SBP, systolic blood pressure; DBP, diastolic blood pressure; MDP, mean blood pressure; RR, respiratory rate; SpO2, percutaneous oxygen saturation; DCI, delayed cerebral ischemia; WBC, white blood cell; INR, international normalized ratio; PT, prothrombin time; APTT, activated partial thromboplastin time; GCS, Glasgow coma score; SAPS II, Simplified Acute Physiology Score II; SOFA, Sequential Organ Failure Assessment; WFNS scale, World Federation of Neurological Societies Scale; PSM, propensity score matching; DCI, delayed cerebral ischemia; WFNS scale, World Federation of Neurological Societies Scale.
References
1. Chang TR, Kowalski RG, Carhuapoma JR, Tamargo RJ, Naval NS. Impact of case volume on aneurysmal subarachnoid hemorrhage outcomes. J Crit Care. (2015) 30:469–72. doi: 10.1016/j.jcrc.2015.01.007
2. Udy AA, Vladic C, Saxby ER, Cohen J, Delaney A, Flower O, et al. subarachnoid hemorrhage patients admitted to intensive care in Australia and New Zealand: a multicenter cohort analysis of in-hospital mortality over 15 years. Crit Care Med. (2017) 45:e138–e45. doi: 10.1097/CCM.0000000000002059
3. Fang F, Wang P, Yao W, Wang X, Zhang Y, Chong W, et al. Association between D-dimer levels and long-term mortality in patients with aneurysmal subarachnoid hemorrhage. Neurosurg Focus. (2022) 52:E8. doi: 10.3171/2021.12.FOCUS21512
4. Wang P, Zhang Y, Wang X, Peng L, Jia L, Li T, et al. Association between serum albumin and hospital-acquired infections after aneurysmal subarachnoid hemorrhage. Neurocrit Care. (2021). doi: 10.1007/s12028-021-01421-y
5. Langer T, Zadek F, Carbonara M, Caccioppola A, Brusatori S, Zoerle T, et al. Cerebrospinal fluid and arterial acid-base equilibrium of spontaneously breathing patients with aneurismal subarachnoid hemorrhage. Neurocrit Care. (2022) 37:102–10. doi: 10.1007/s12028-022-01450-1
6. Wang J, Feng Q, Zhang Y, Qiu W, Gao H. Elevated glucose-potassium ratio predicts preoperative rebleeding in patients with aneurysmal subarachnoid hemorrhage. Front Neurol. (2021) 12:795376. doi: 10.3389/fneur.2021.795376
7. McGirt MJ, Woodworth GF, Ali M, Than KD, Tamargo RJ, Clatterbuck RE. Persistent perioperative hyperglycemia as an independent predictor of poor outcome after aneurysmal subarachnoid hemorrhage. J Neurosurg. (2007) 107:1080–5. doi: 10.3171/JNS-07/12/1080
8. Frontera JA, Fernandez A, Claassen J, Schmidt M, Schumacher HC, Wartenberg K, et al. Hyperglycemia after SAH: predictors, associated complications, and impact on outcome. Stroke. (2006) 37:199–203. doi: 10.1161/01.STR.0000194960.73883.0f
9. Latorre JG, Chou SH, Nogueira RG, Singhal AB, Carter BS, Ogilvy CS, et al. Effective glycemic control with aggressive hyperglycemia management is associated with improved outcome in aneurysmal subarachnoid hemorrhage. Stroke. (2009) 40:1644–52. doi: 10.1161/STROKEAHA.108.535534
10. Naidech AM, Levasseur K, Liebling S, Garg RK, Shapiro M, Ault ML, et al. Moderate hypoglycemia is associated with vasospasm, cerebral infarction, and 3-month disability after subarachnoid hemorrhage. Neurocrit Care. (2010) 12:181–7. doi: 10.1007/s12028-009-9311-z
11. Sadan O, Feng C, Vidakovic B, Mei Y, Martin K, Samuels O, et al. Glucose variability as measured by inter-measurement percentage change is predictive of in-patient mortality in aneurysmal subarachnoid hemorrhage. Neurocrit Care. (2020) 33:458–67. doi: 10.1007/s12028-019-00906-1
12. Liu D, Tang Y, Zhang Q. Admission hyperglycemia predicts long-term mortality in critically Ill patients with subarachnoid hemorrhage: a retrospective analysis of the MIMIC-III database. Front Neurol. (2021) 12:678998. doi: 10.3389/fneur.2021.678998
13. Eagles ME, Newton BD, Rosgen BK, Ayling OGS, Muram S, Tso MK, et al. Optimal glucose target after aneurysmal subarachnoid hemorrhage: a matched cohort study. Neurosurgery. (2021) 90:340–6. doi: 10.1227/NEU.0000000000001823
14. Okazaki T, Hifumi T, Kawakita K, Shishido H, Ogawa D, Okauchi M, et al. Blood glucose variability: a strong independent predictor of neurological outcomes in aneurysmal subarachnoid hemorrhage. J Intensive Care Med. (2018) 33:189–95. doi: 10.1177/0885066616669328
15. Johnson A, Bulgarelli L, Pollard T, Horng S, Celi LA, Mark R. (2021). MIMIC-IV (version 1.0). PhysioNet. https://doi.org/10.13026/s6n6-xd98.
16. Skrivankova VW, Richmond RC, Woolf BAR, Yarmolinsky J, Davies NM, Swanson SA, et al. Strengthening the reporting of observational studies in epidemiology using Mendelian randomization: the STROBE-MR statement. JAMA. (2021) 326:1614–21. doi: 10.1001/jama.2021.18236
17. McIntyre MK, Halabi M, Li B, Long A, Van Hoof A, Afridi A, et al. Glycemic indices predict outcomes after aneurysmal subarachnoid hemorrhage: a retrospective single center comparative analysis. Sci Rep. (2021) 11:158. doi: 10.1038/s41598-020-80513-9
18. Zuurbier CCM, Bourcier R, Constant Dit Beaufils P, Redon R, Desal H, Investigators I, et al. Number of affected relatives, age, smoking, and hypertension prediction score for intracranial aneurysms in persons with a family history for subarachnoid hemorrhage. Stroke. (2022) 53:1645–50. doi: 10.1161/STROKEAHA.121.034612
19. Epstein D, Freund Y, Marcusohn E, Diab T, Klein E, Raz A, et al. Association between ionized calcium level and neurological outcome in endovascularly treated patients with spontaneous subarachnoid hemorrhage: a retrospective cohort study. Neurocrit Care. (2021) 35:723–37. doi: 10.1007/s12028-021-01214-3
20. Jung HM, Paik JH, Kim SY, Hong DY. Association of plasma glucose to potassium ratio and mortality after aneurysmal subarachnoid hemorrhage. Front Neurol. (2021) 12:661689. doi: 10.3389/fneur.2021.661689
21. Kruyt ND, Biessels GJ, DeVries JH, Luitse MJ, Vermeulen M, Rinkel GJ, et al. Hyperglycemia in aneurysmal subarachnoid hemorrhage: a potentially modifiable risk factor for poor outcome. J Cereb Blood Flow Metab. (2010) 30:1577–87. doi: 10.1038/jcbfm.2010.102
22. Kruyt ND, Roos YW, Dorhout Mees SM, van den Bergh WM, Algra A, Rinkel GJ, et al. High mean fasting glucose levels independently predict poor outcome and delayed cerebral ischaemia after aneurysmal subarachnoid haemorrhage. J Neurol Neurosurg Psychiatry. (2008) 79:1382–5. doi: 10.1136/jnnp.2007.142034
23. Pasternak JJ, McGregor DG, Schroeder DR, Lanier WL, Shi Q, Hindman BJ, et al. Hyperglycemia in patients undergoing cerebral aneurysm surgery: its association with long-term gross neurologic and neuropsychological function. Mayo Clin Proc. (2008) 83:406–17. doi: 10.4065/83.4.406
24. Kruyt ND, Biessels GJ, de Haan RJ, Vermeulen M, Rinkel GJ, Coert B, et al. Hyperglycemia and clinical outcome in aneurysmal subarachnoid hemorrhage: a meta-analysis. Stroke. (2009) 40:e424–30. doi: 10.1161/STROKEAHA.108.529974
25. Mizock BA. Alterations in fuel metabolism in critical illness: hyperglycaemia. Best Pract Res Clin Endocrinol Metab. (2001) 15:533–51. doi: 10.1053/beem.2001.0168
26. Dungan KM, Braithwaite SS, Preiser JC. Stress hyperglycaemia. Lancet. (2009) 373:1798–807. doi: 10.1016/S0140-6736(09)60553-5
Keywords: subarachnoid hemorrhage, mean blood glucose, admission blood glucose, in-hospital mortality, MIMIC-IV database
Citation: Wang J-H, Li H, Yang H-K, Chen R-D and Yu J-S (2022) Relationship between the mean of 24-h venous blood glucose and in-hospital mortality among patients with subarachnoid hemorrhage: A matched cohort study. Front. Neurol. 13:904293. doi: 10.3389/fneur.2022.904293
Received: 25 March 2022; Accepted: 07 July 2022;
Published: 02 August 2022.
Edited by:
Keith Pennypacker, University of Kentucky, United StatesReviewed by:
Peicong Ge, Capital Medical University, ChinaQilin Yang, The Second Affiliated Hospital of Guangzhou Medical University, China
Copyright © 2022 Wang, Li, Yang, Chen and Yu. This is an open-access article distributed under the terms of the Creative Commons Attribution License (CC BY). The use, distribution or reproduction in other forums is permitted, provided the original author(s) and the copyright owner(s) are credited and that the original publication in this journal is cited, in accordance with accepted academic practice. No use, distribution or reproduction is permitted which does not comply with these terms.
*Correspondence: Jia-Sheng Yu, yujiasheng2000@sina.com