 Amna A. Saddiq1†
 Ali H. El-Far2*†Shymaa Abdullah Mohamed Abdullah3
 Kavitha Godugu4Omar A. Almaghrabi5
 Shaker A. Mousa6
- 1College of Sciences, Department of Biology, University of Jeddah, Jeddah, Saudi Arabia
- 2Department of Biochemistry, Faculty of Veterinary Medicine, Damanhour University, Damanhour, Egypt
- 3Molecular Biology Unit, Medical Technology Center and Applied Medical Chemistry Department, Medical Research Institute, Alexandria University, Alexandria, Egypt
- 4Pharmaceutical Research Institute, Albany College of Pharmacy and Health Sciences, Rensselaer, NY, United States
- 5College of Sciences, Department of Biology, University of Jeddah, Jeddah, Saudi Arabia
- 6Pharmaceutical Research Institute, Albany College of Pharmacy and Health Sciences, Rensselaer, NY, United States
Cancer can develop due to abnormal cell proliferation in any body’s cells, so there are over a hundred different types of cancer, each with its distinct behavior and response to treatment. Therefore, many studies have been conducted to slow cancer progression and find effective and safe therapies. Nutraceuticals have great attention for their anticancer potential. Therefore, the current study was conducted to investigate the anticancer effects of curcumin (Cur), thymoquinone (TQ), and 3, 3′-diindolylmethane (DIM) combinations on lung (A549) and liver (HepG2) cancer cell lines’ progression. Results showed that triple (Cur + TQ + DIM) and double (Cur + TQ, Cur + DIM, and TQ + DIM) combinations of Cur, TQ, and DIM significantly increased apoptosis with elevation of caspase-3 protein levels. Also, these combinations exhibited significantly decreased cell proliferation, migration, colony formation activities, phosphatidylinositol 3-kinase (PI3K), and protein kinase B (AKT) protein levels with S phase reduction. Triple and double combinations of Cur, TQ, and DIM hindered tumor weight and angiogenesis of A549 and HepG2 implants in the chorioallantoic membrane model. Interestingly, Cur, TQ, and DIM combinations are considered promising for suppressing cancer progression via inhibiting tumor angiogenesis. Further preclinical and clinical investigations are warranted.
Introduction
Cancer ranks as a leading cause of death worldwide (Bray et al., 2021). The International Agency for Research on Cancer estimated that lung cancer remained the leading cause of cancer death, with an estimated 1.8 million deaths (18%), followed by colorectal (9.4%), liver (8.3%), stomach (7.7%), and female breast (6.9%) cancers worldwide (Sung et al., 2021). Thai et al. (2021) reported that lung cancer was estimated at 2 million new cases and 1.76 million deaths per year worldwide. In the same context, liver cancer is one of the leading causes worldwide deaths. Hepatitis B virus, hepatitis C virus, alcohol consumption, and nonalcoholic fatty liver disease are the primary causes of liver cancer (Lin et al., 2020).
A healthy diet that reduces cancer incidence has led many researchers to focus on natural products to prevent cancer (den Hollander et al., 2013). Nutraceuticals fight cancer by inhibiting proliferation, migration, metastasis, angiogenesis, cell cycle arrest, and increasing cancer cells’ sensitivity to radiotherapy and chemotherapy (Li et al., 2017). The American Institute for Cancer Research and the World Cancer Research Fund stated that 30%–40% of all cancers could be prevented by appropriate diets and physical activity (Glade, 1999). Also, natural products in medicinal plants have been used to treat human diseases for thousands of years in Asia (Koehn and Carter, 2005). Curcumin (Cur) (Figure 1A), the active ingredient of Curcuma longa L. (Kew Medicinal Plant Names Services (MPNS) - validated), is the most studied compound described as a potential anticancer agent due to its multi-targeted signaling/molecular pathways (Sharma and Martins, 2020; Shah et al., 2021). Also, Cur targeted phosphatidylinositol 3-kinase (PI3K)/protein kinase B (AKT), Janus kinase/signal transducer and activator of transcription, and nuclear factor kappa B (NF-κB) pathways (Wong et al., 2021) in almost most cancer forms (El-Far et al., 2020a; Joshi et al., 2021). The taxonomic hierarchy of Curcuma longa L. is shown in Table 1 (USDA Plants Database, 2022a).
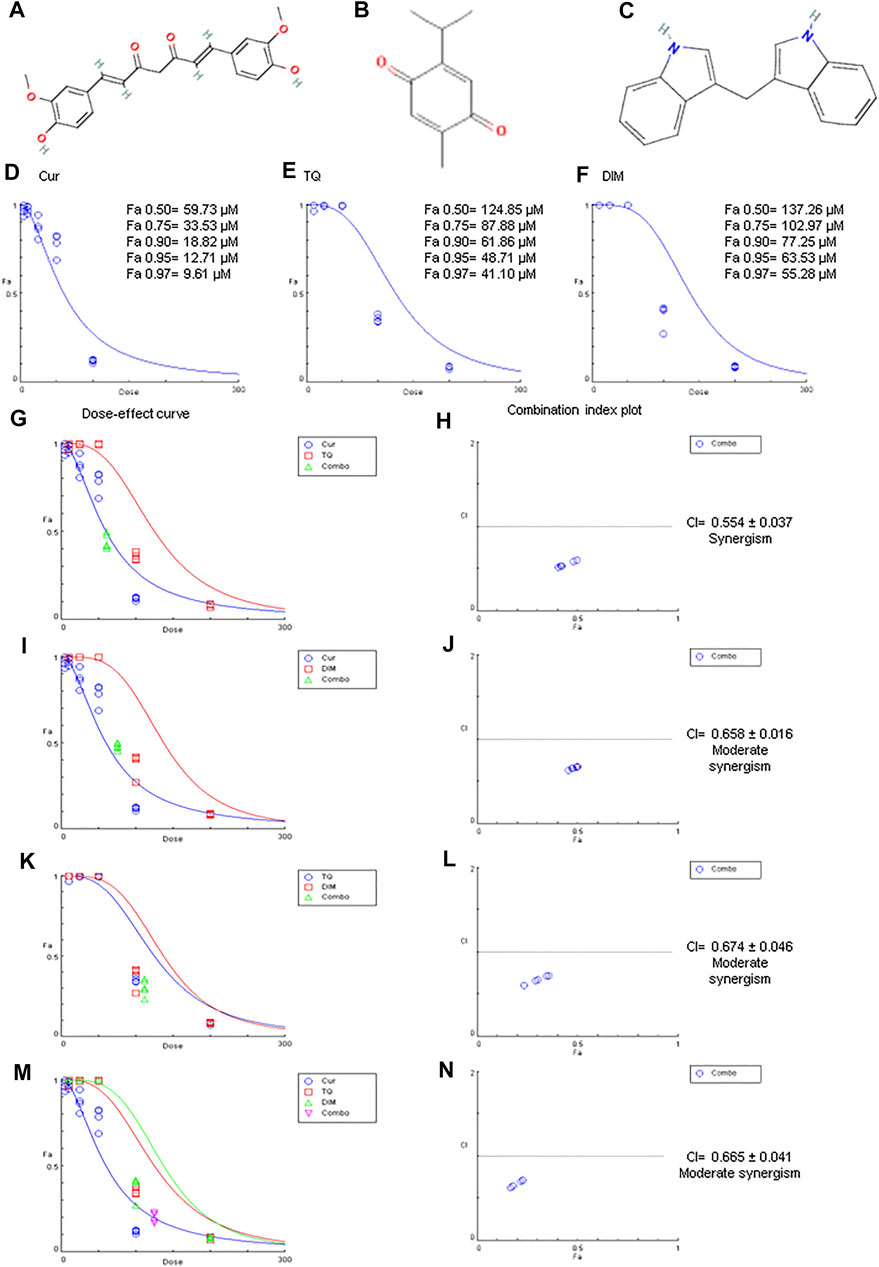
FIGURE 1. Chemical structures, Fa values, and combination index of curcumin (Cur), thymoquinone (TQ), and 3,3′-diindolylmethane (DIM) against A549. (A) Chemical structure of Cur. (B) Chemical structure of TQ. (C) Chemical structure of DIM. (D) Fa values of Cur against A549. (E) Fa values of TQ against A549. (F) Fa values of TQ against A549. (G) Dose-effect curve of Fa 95 of Cur (12.71 µM) and TQ (48.71 µM). (H) Combination index plot of Fa 95 of Cur and TQ. (I) Dose-effect curve of Fa 95 of Cur (12.71 µM) and DIM (63.53 µM). (J) Combination index plot of Fa 95 of Cur and DIM. (K) Dose-effect curve of Fa 95 of TQ (48.71 µM) and DIM (63.53 µM). (L) Combination index plot of Fa 95 of TQ and DIM. (M) Dose-effect curve of Fa 95 of Cur (12.71 µM), TQ (48.71 µM), and DIM (63.53 µM). (N) Combination index plot of Fa 95 of Cur, TQ, and DIM. The CI values represent the mean of four experiments. CI > 1.3: antagonism; CI (1.1–1.3): moderate antagonism; CI (0.9–1.1): additive effect; CI (0.8–0.9): slight synergism; CI (0.6–0.8): moderate synergism; CI (0.4–0.6): synergism; CI (0.2–0.4): strong synergism.
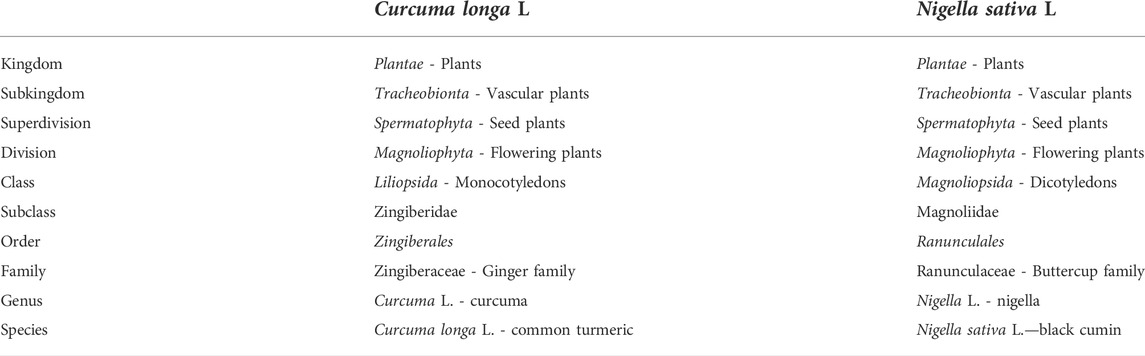
TABLE 1. Taxonomic hierarchy of Curcuma longa L. and Nigella sativa L.
Thymoquinone (TQ) (Figure 1B), the bioactive constituent of Nigella sativa L. (MPNS - validated) seeds, is a well-known natural bioactive compound used for the management of several cancer types (El-Far, 2015; El-Far AH. et al., 2018, 2020b, 2020a, El-Far et al., 2021 A. H.). TQ induced their anticancer potential by preventing inflammation and oxidative stress, inhibiting angiogenesis and metastasis, and inducing apoptosis of cancer cells (Alhmied et al., 2021). In the same context, 3,3′-diindolylmethane (DIM) (Figure 1C) is present in cruciferous vegetables, including broccoli, Brussels sprouts, cabbage, cauliflower, kale, turnips, collard greens, kohlrabi, and mustard rutabaga has antiproliferative and anticancer activities in various cancer cells (Zhang et al., 2014; Munakarmi et al., 2021). The taxonomic hierarchy of Nigella sativa L. is shown in Table 1 (USDA Plants Database, 2022b).
Cur, TQ, and DIM were incorporated in clinical trials (https://clinicaltrials.gov/) for cancer therapy, as stated in Supplementary Tables S1–S3, respectively. We have not found a study about the combination of Cur, TQ, and DIM exploring their role in cancer repression. Therefore, in the current study, we investigated the combinatory effect of Cur, TQ, and DIM on lung (A549) and liver (HepG2) cancer cell lines’ progression.
Materials and methods
Cell lines
Lung (A549) and liver (HepG2) cancer cell lines were purchased from ATCC (Manassas, VA, United States). A549 and HepG2 cells were grown in low-glucose Dulbecco’s Modified Eagle Medium supplemented with 10% fetal bovine serum and 1% penicillin/streptomycin solution.
MTT [3-(4,5-dimethylthiazol-2-yl)-2,5-diphenyltetrazolium bromide] and combination index assays
The half-maximal inhibitory concentration (IC50) of Cur, TQ, and DIM was determined by seeding A549 or HepG2 cells in 24-well plates (3 × 10⁴ per well in 1.5 ml) and incubated for 48 h at 37°C in a 5% CO2 incubator. Cells were treated with 1 ml of Cur (0, 5, 10, 25, 50, or 100 μM dissolved in DMSO), TQ (0, 10, 25, 50, 100, or 200 μM dissolved in DMSO), and DIM (0, 10, 25, 50, 100, or 200 μM dissolved in DMSO) and incubated for 24 h, then treated with MTT reagent (1.25 mg/ml) and incubated for 2 h. The resulting formazan crystals were dissolved in 1 ml DMSO, and the optical density was determined using a microplate reader at 570 nm (El-Far et al., 2020a). DMSO was used in a concentration of 0.1% of medium.
The data of the MTT assay was analyzed by CompuSyn software (https://www.combosyn.com/) to determine the IC50 of Cur and TQ against A549 and HepG2 cells. These experiments were repeated three times (Chou, 2011). The combination index of Cur, TQ, and DIM were determined by CompuSyn software at Fa 95 against A549 and HepG2 cells, shown in Table 2. The Fa is the fraction affected, so; the Fa 95 value means the concentration of the drug at which 5% of cells are affected by this drug.
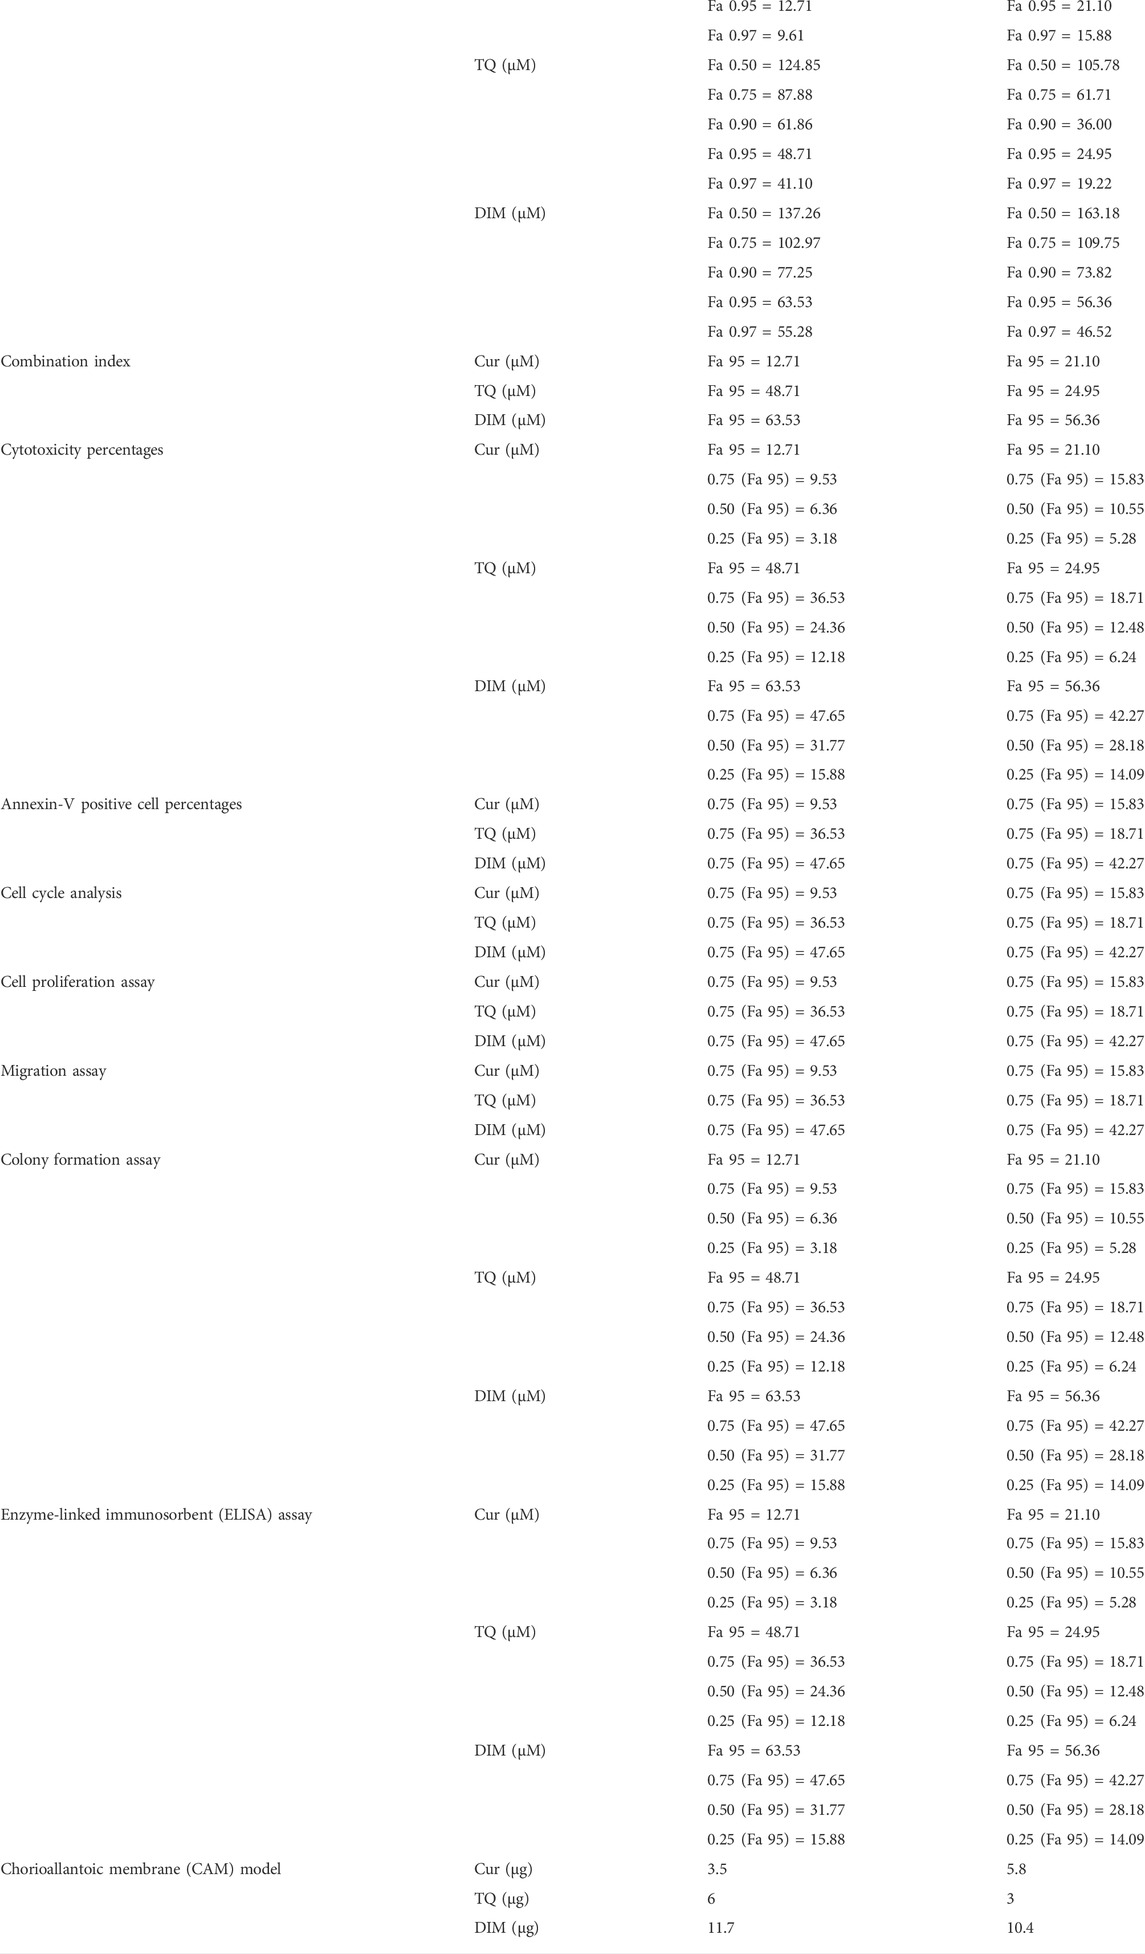
TABLE 2. Summarizes the data of Fa values and the concentrations of curcumin (Cur), thymoquinone (TQ), 3,3′-diindolylmethane (DIM) and their combinations that used in all assays.
Cytotoxicity assay
After determination of Fa 75, 90, 95, and 97 of Cur, TQ, and DIM using CompuSyn software against A549 and HepG2 cells, cells were seeded in 12-well plates (3 × 10⁴ per well in 1.5 ml) and incubated for 48 h at 37°C in a 5% CO2 incubator. Control, Cur, TQ, and DIM groups of A549 cells were treated with Fa 95, 0.75 (Fa 95), 0.50 (Fa 95), and 0.25 (Fa 95) in 1 ml of the medium. Similarly, control, Cur, TQ, and DIM groups of HepG2 cells were treated with Fa 95, 0.75 (Fa 95), 0.50 (Fa 95), and 0.25 (Fa 95) in 1 ml of the medium (El-Far et al., 2020a). After 24 h, cells were treated with MTT and visualized as described in the MTT assay. This experiment was repeated three times.
Annexin-V assay
Apoptosis was analyzed by flow cytometry using annexin V-fluorescein isothiocyanate (annexin-FITC) and propidium iodide (PI) detection kit (BD Biosciences, San Jose, CA, United States). A549 and HepG2 cells were cultured in T25 flasks for 48 h. A549 cells were treated with 0.75 (Fa 95) of Cur, TQ, DIM, and their double (Cur + TQ, Cur + DIM, and TQ + DIM) and triple (Cur + TQ + DIM) combinations in 10 ml of medium for 24 h (Table 2). Also, HepG2 cells were treated with 0.75 (Fa 95) of Cur, TQ, and DIM and their double and triple combinations in 10 ml of medium for 24 h (Table 2). Cells were collected and centrifuged at 500 ×g for 5 min at room temperature after their trypsinization. The pellet was rinsed twice with phosphate-buffered saline (PBS) and then resuspended in a proper volume of binding buffer. After adding 10 μl of annexin V-FITC followed by gentle mixing, incubated for 15 min at room temperature in the dark and washed. The fluorescence intensity of FITC was carried on a FACSCalibur™ (Becton Dickinson) instrument using Cell Quest software (El-Far et al., 2020a; El-Far et al., 2021).
Cell cycle analysis
Using a FACSCalibur™ flow cytometer (Becton Dickinson, San Jose, CA, United States) and Cell Quest software, the cell cycle status was analyzed in A549 and HepG2 cells that were cultured and treated with Cur, TQ, and DIM by the same method mentioned in the annexin-V assay.
Cell proliferation assay
A549 or HepG2 cells were cultured in 12-well plates (3 × 10⁴ per well in 1.5 ml) and incubated for 48 h at 37°C in a 5% CO2 incubator. Cells were treated with 0.75 (Fa 95) of Cur, TQ, DIM, and their double and triple combinations in 1 ml for 24 h (Table 2). Cells were visualized and counted by an inverted light microscope (Primovert, Zeiss, Carl Zeiss Industrielle Messtechnik GmbH, Oberkochen, Germany) at magnification, ×4 objective (El-Far AHAM. et al., 2018). The total viable cell number was counted using a hemocytometer using the dye exclusion method with 0.2% trypan blue at room temperature (Thermo Fisher Scientific, Inc.). This experiment was repeated three times.
Migration assay
Cell migration was evaluated using the monolayer denudation assay as previously described (El-Far AHAM. et al., 2018). Briefly, A549 or HepG2 cells were inoculated (5 × 10⁴ per well in 1.5 ml) and were cultured to 100% confluence in a 12-well plate. Cells were then wounded by denuding a strip of the monolayer with a 200 μl pipette tip. Cells were washed twice with PBS and then incubated with 0.75 (Fa 95) of Cur, TQ, DIM, and their double and triple combinations in 1 ml for 24 h (Table 2). The rate of wound closure was assessed in four separate fields of view using a light microscope (magnification, ×4 objective). This experiment was repeated three times.
Colony formation assay
Two thousand five hundred cells (A549 or HepG2) per well were plated in 12-well plates and were allowed to grow for about 4–5 days until small colonies could be seen. Cells were treated with 0.75 (Fa 95) of Cur, TQ, DIM, and their double and triple combinations in 1 ml for 24 h. Also, 0.50 (Fa 95) and 0.25 (Fa 95) of Cur, TQ, and DIM were used to determine colony formation in double and triple combinations (Table 2). Cells were fixed with 4% formaldehyde in PBS and stained with 0.1% crystal violet (Guzmán et al., 2014), and images were taken for each well. This experiment was repeated three times.
Enzyme-linked immunosorbent assay
A549 or HepG2 cells by the density of 30 × 104 were cultured in a T25 flask for 48 h. Seeded cells were treated with 10 ml 0.75 (Fa 95) of Cur, TQ, DIM, and their double and triple combinations for 24 h. Also, 0.50 (Fa 95) and 0.25 (Fa 95) of Cur, TQ, and DIM (Table 2) were used to determine the effect of double and triple combinations on caspase-3, PI3K, and AKT protein levels. Cells in each flask were trypsinized and centrifuged to produce a clear cell pellet. Cells were homogenized in RIPA buffer using TissueLyser (Qiagen Co., Germantown, MD, United States). Caspase-3, PI3K, and AKT levels were determined by the FineTest ELISA kit (Wuhan Fine Biotech Co., Wuhan, Hubei, China) according to the manufacturer’s instructions at 450 nm. The Bradford method determined protein levels in all samples (Bradford, 1976).
Chorioallantoic membrane model
The effect of Cur, TQ, DIM, and their combinations on A549 and HepG2 implants’ Chorioallantoic membrane model (CAM) of tumor weight and tumor angiogenesis were carried out as previously described by Mousa et al. (2020). Seven-day-old chick embryos were purchased from Charles River Avian Vaccine Services (Norwich, CT, United States) and incubated at 37°C with 55% relative humidity. A hypodermic needle was used to make a small hole in the shell of the air sac. A second hole was made on the broadside of the egg, directly over an avascular portion of the embryonic membrane that was identified by candling. A false air sac was created beneath the second hole by applying negative pressure at the first hole, causing the CAM to separate from the shell. A window, approximately 1.0 cm2, was made in the shell over the dropped CAM using a small craft grinding wheel (Dermal, Division of Emerson Electric Co., Racine, WI, United States), allowing direct access to the underlying CAM.
A549 or HepG2 cells were implanted at 1 million cells per CAM in Matrigel® in the 7-day-old fertilized chick egg. Treatment effects on tumor weight and angiogenesis were determined on day 7 after tumor cell implantation. For these studies, Matrigel was thawed overnight at 4°C and placed on ice. In the exponential growth phase, cells were harvested using 0.25% trypsin–EDTA, washed, and suspended in the medium. Only suspensions of single cells with viability exceeding 95% were used. Approximately 1 × 10⁶ cells in 30 μl of medium mixed with the same volume of Matrigel were implanted on the CAM. The treatment groups were Matrigel with A549 or HepG2 cells (control), Matrigel/A549 or HepG2 with Cur (3.5 μg/CAM and 5.8 μg/CAM), TQ (6 μg/CAM and 3 μg/CAM), DIM (11.7 μg/CAM and 10.4 μg/CAM), and their combinations of Cur + DIM, Cur + TQ, TQ + DIM, and Cur + TQ + DIM (Table 2).
After incubation at 37°C with 55% relative humidity for 3 days, the CAM tissue directly beneath each filter disk was resected from control and treated CAM samples. Tissues were washed 3 times with PBS and placed in 35-mm Petri dishes. Results are presented as mean tumor weight (mg) per treatment group (n = 5 eggs per group) and tumor hemoglobin (Hb) (mg/dl) ± standard deviation of the mean (n = 5 per group).
Results
MTT and Fa values of Cur, TQ, and DIM against A549 cells
As shown in Figures 1D–F, MTT assay data was analyzed by CompuSyn software revealing the Fa values of Cur (Fa 0.50 = 59.73, Fa 0.75 = 33.53, Fa 0.90 = 18.82, Fa 0.95 = 12.71, and Fa 0.97 = 9.61 µM) against A549 cells. Similarly, Fa 0.50 = 124.85, Fa 0.75 = 87.88, Fa 0.90 = 61.86, Fa 0.95 = 48.71, and Fa 0.97 = 41.10 µM were determined for TQ, while Fa 0.50 = 137.26, Fa 0.75 = 102.97, Fa 0.90 = 77.25, Fa 0.95 = 63.53, and Fa 0.97 = 55.28 µM for DIM against A549 cells, as shown in Table 2.
The most exciting aspect is the combination index of Cur + TQ (Figures 1G,H), Cur + DIM (Figures 1I,J), TQ + DIM (Figures 1K,L), and Cur + TQ + DIM (Figures 1M, N), which revealed synergistic effect for Cur + TQ and moderate synergism for the rest combinations.
Cytotoxicity percentages of Cur, TQ, and DIM against A549 cells
As shown in Figures 2A–D, Fa 95 concentrations of Cur, TQ, and DIM were used to determine the cytotoxicity percentages of Cur, TQ, DIM and their double and triple combinations. Also, 0.75 (Fa 95), 0.50 (Fa 95), and 0.25 (Fa 95) concentrations were elevated for cytotoxicity percentages compared with control untreated A549 cells. The data revealed that Cur, TQ, DIM, and their double and triple combinations at Fa 95 and 0.75 (Fa 95) concentrations significantly decreased the cytotoxicity percentages compared with control A549 cells except Cur at 0.75 (Fa 95).
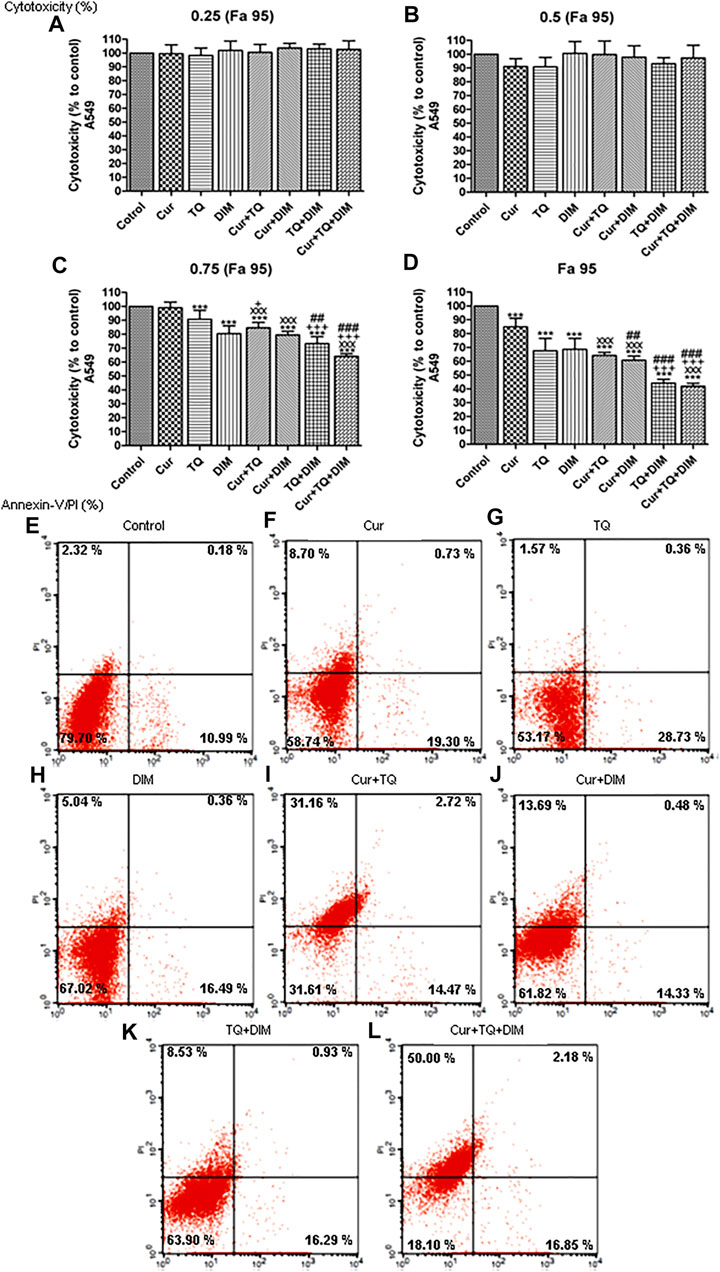
FIGURE 2. Cytotoxicity and annexin-V positive cell percentages of A549. (A) Cytotoxicity percentages of 0.25 (Fa 95), (B) 0.50 (Fa 95), (C) 0.75 (Fa 95), and (D) Fa 95 of curcumin (Cur), thymoquinone (TQ), and 3,3′-diindolylmethane (DIM) against A549. (E) Annexin-V positive cell percentages of control A549 cells. (F) Cur-treated cells with 0.75 (Fa 95) = 9.53 µM. (G) TQ-treated cells with 0.75 (Fa 95) = 36.53 µM. (H) DIM-treated cells with 0.75 (Fa 95) = 47.65 µM. (I) Cur + TQ treated cells with 0.75 (Fa 95) of Cur and TQ. (J) Cur + DIM treated cells with 0.75 (Fa 95) of Cur and DIM. (K) TQ + DIM treated cells with 0.75 (Fa 95) of TQ and DIM. (L) Cur + TQ + DIM treated cells with 0.75 (Fa 95) of Cur, TQ, and DIM. The data were analyzed with one-way ANOVA followed by Tukey’s multiple comparison test. Error bars represent mean ± SD. ***p < 0.001 vs. control. xxxP < 0.001 vs. Cur. +p < 0.05 and +++p < 0.001 vs. TQ. ##p < 0.01 and ###p < 0.001 vs. DIM.
Annexin-V positive cell percentages of A549 cells treated with Cur, TQ, DIM, and their combinations
Determination of annexin-V positive cell percentages is a key marker for cell apoptosis. In Figure 2F, we can see that Cur-treated cells exhibited 28.73% of annexin-V positive cells compared with control (Figure 2E). In Figure 2G, the annexin-V positive cell percentage of TQ-treated cells is 30.84%, while DIM (Figure 2H) was 21.89% compared with control A549 cells. The combination of Cur and TQ possessed 48.35% of annexin-V positive cells (Figure 2I). Similarly, Cur + DIM (Figure 2J), TQ + DIM (Figure 2K), and Cur + TQ + DIM (Figure 2L) exhibited annexin-V positive cells of 28.50, 25.75, and 69.03%, respectively.
Cell cycle analyses and proliferation assay of A549 cells treated with Cur, TQ, DIM, and their combinations
The results of cell cycle analysis are presented in Figures 3A–H showed S phase inhibition of A549 cells treated with Cur, TQ, DIM, Cur + TQ, Cur + DIM, TQ + DIM, and Cur + TQ + DIM by concentrations of 0.75 (Fa 95).
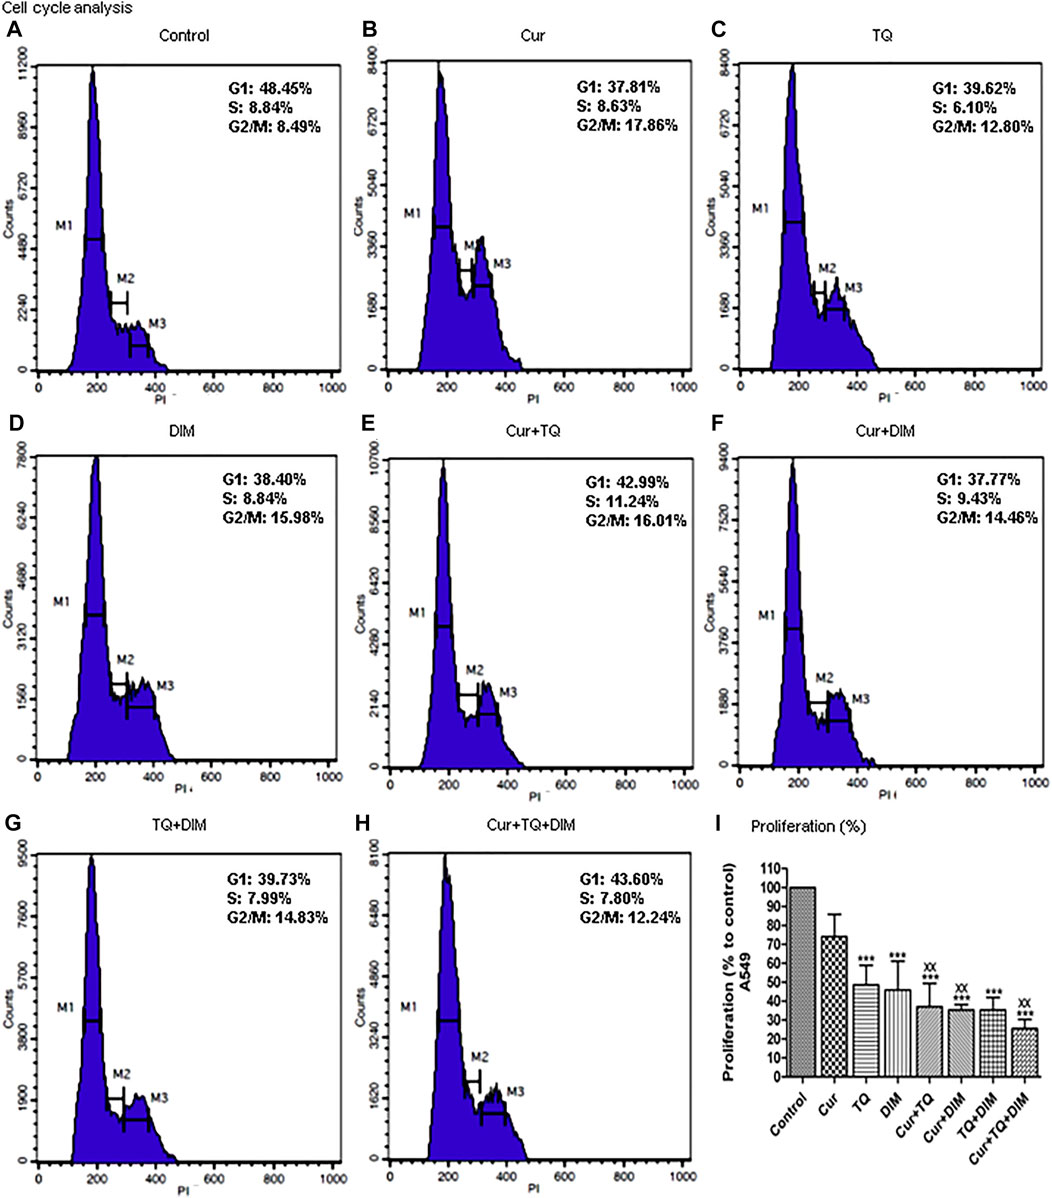
FIGURE 3. Cell cycle analysis and proliferation percentage of A549. (A) Cell cycle analysis of control A549. (B) Cell cycle analysis of Cur-treated cells with 0.75 (Fa 95) = 9.53 µM. (C) Cell cycle analysis of TQ-treated cells with 0.75 (Fa 95) = 36.53 µM. (D) Cell cycle analysis of DIM-treated cells with 0.75 (Fa 95) = 47.65 µM. (E) Cell cycle analysis of Cur + TQ treated cells with 0.75 (Fa 95) of Cur and TQ. (F) Cell cycle analysis of Cur + DIM treated cells with 0.75 (Fa 95) of Cur and DIM. (G) Cell cycle analysis of TQ + DIM treated cells with 0.75 (Fa 95) of TQ and DIM. (H) Cell cycle analysis of Cur + TQ + DIM treated cells with 0.75 (Fa 95) of Cur, TQ, and DIM. (I) Proliferation percentages of control and A549-treated cells with 0.75 (Fa 95) of Cur, TQ, DIM, Cur + TQ, Cur + DIM, TQ + DIM, and Cur + TQ + DIM. The data were analyzed with one-way ANOVA followed by Tukey’s multiple comparison test. Error bars represent mean ± SD. ***p < 0.001 vs. control. xxP < 0.01 vs. Cur.
The results obtained from the proliferation assay of Cur-, TQ-, DIM-, Cur + TQ-, Cur + DIM-, TQ + DIM-, and Cur + TQ + DIM-treated A549 cells with concentrations of 0.75 (Fa 95) are set out in Figure 3I and revealed significant decreases in proliferation percentages of A549 cells compared with control cells.
Migration and colony formation assays of A549 cells treated with Cur, TQ, DIM, and their combinations
Migration assay was performed by induction of a wound of A549 monolayer before and 24 h after treatment with Cur, TQ, DIM, and their combinations (Figure 4A). Cur-, TQ-, DIM-, Cur + TQ-, Cur + DIM-, TQ + DIM-, and Cur + TQ + DIM-treated A549 cells with concentrations of 0.75 (Fa 95) exhibited significant reductions in migration activity. Similarly, colony formation activities of Cur-, TQ-, DIM-, Cur + TQ-, Cur + DIM-, TQ + DIM-, and Cur + TQ + DIM-treated A549 cells with concentrations of 0.75 (Fa 95), Cur + TQ + DIM at a concentration of 0.50 (Fa 95), and Cur + TQ + DIM at a concentration of 0.25 (Fa 95) were significantly decreased compared with control (Figure 4B).
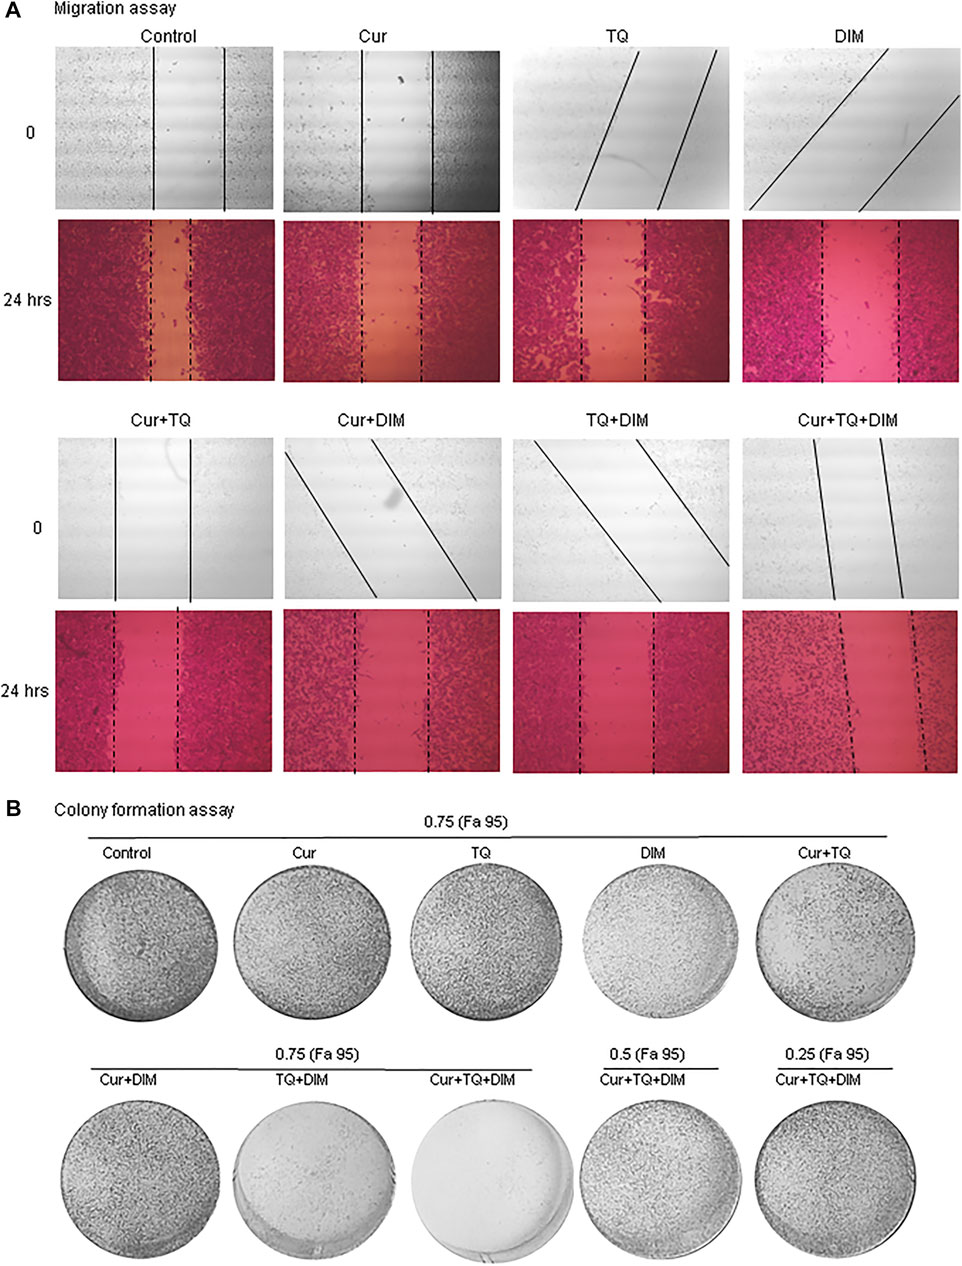
FIGURE 4. Migration and colony formation assays of A549. (A) Migration assay of control and A549-treated with 0.75 (Fa 95) of Cur, TQ, DIM, Cur + TQ, Cur + DIM, TQ + DIM, and Cur + TQ + DIM at 0 and 24 h. (B) colony formation assay of control, A549-treated with 0.75 (Fa 95) of Cur, TQ, DIM, Cur + TQ, Cur + DIM, TQ + DIM, and Cur + TQ + DIM, A549-treated with 0.50 (Fa 95) of Cur + TQ + DIM, and A549-treated with 0.25 (Fa 95) of Cur + TQ + DIM.
MTT and Fa values of Cur, TQ, and DIM against HepG2 cells
MTT assay has been used to determine the Fa values of Cur, TQ, and DIM against HepG2 cells (Figure 5). Fa values of Cur against HepG2 were 101.80 µM for Fa 0.50, 56.58 µM for Fa 0.75, 31.45 µM for Fa 90, 21.10 µM for Fa 0.95, and 15.88 µM for Fa 0.97 (Figure 5A). Also, Fa 0.50 = 105.78 µM, Fa 0.75 = 61.71 µM, Fa 0.90 = 36.00 µM, Fa 0.95 = 24.95 µM, and Fa 0.97 = 19.22 µM were recognized for HepG2 treated with TQ (Figure 5B). In addition, DIM exhibited Fa 0.50, Fa 0.75, Fa 0.90, Fa 0.95, and Fa 0.97 values of 163.18, 109.75, 73.82, 56.36, and 46.52 µM as shown in Figure 5C and stated in Table 2.
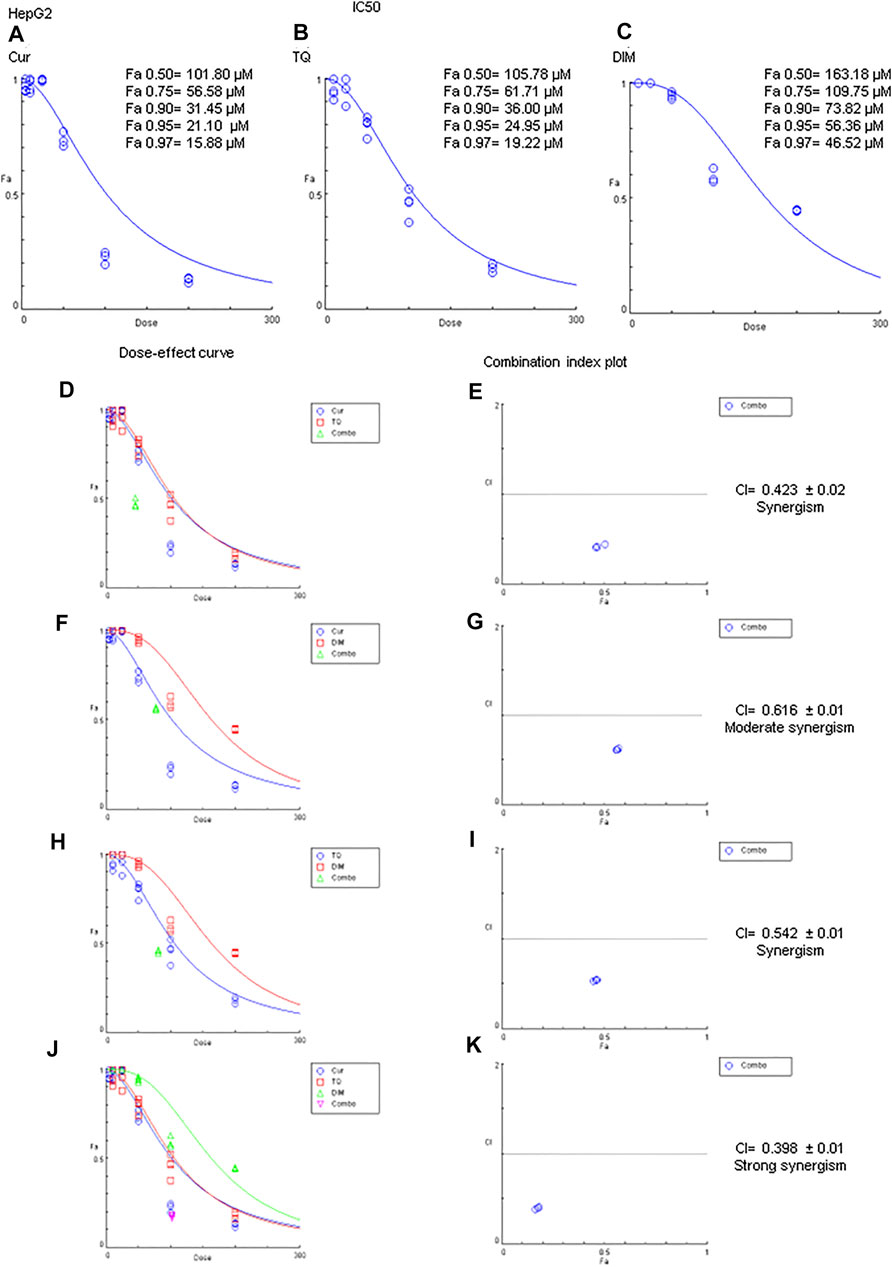
FIGURE 5. Fa values and combination index of curcumin (Cur), thymoquinone (TQ), and 3,3′-diindolylmethane (DIM) against HepG2. (A) Fa values of Cur against HepG2. (B) Fa values of TQ against HepG2. (C) Fa values of DIM against HepG2. (D) Dose-effect curve of Fa 95 of Cur (12.71 µM) and TQ (24.95 µM). (E) Combination index plot of Fa 95 of Cur and TQ. (F) Dose-effect curve of Fa 95 of Cur (21.10 µM) and DIM (56.36 µM). (G) Combination index plot of Fa 95 of Cur and DIM. (H) Dose-effect curve of Fa 95 of TQ (24.95 µM) and DIM (56.36 µM). (H) Combination index plot of Fa 95 of TQ and DIM. (J) Dose-effect curve of Fa 95 of Cur (21.10 µM), TQ (24.95 µM), and DIM (56.36 µM). (K) Combination index plot of Fa 95 of Cur, TQ, and DIM. The CI values represent the mean of four experiments. CI > 1.3: antagonism; CI (1.1–1.3): moderate antagonism; CI (0.9–1.1): additive effect; CI (0.8–0.9): slight synergism; CI (0.6–0.8): moderate synergism; CI (0.4–0.6): synergism; CI (0.2–0.4): strong synergism.
Cytotoxicity percentages of Cur, TQ, and DIM against HepG2 cells
Cytotoxicity percentages of Fa 95, 0.75 (Fa 95), 0.50 (Fa 95), and 0.25 (Fa 95) of Cur, TQ, DIM, and their double and triple combinations against HepG2 cells are shown in Figures 6A–D. Compared with control, treated HepG2 cells with these drugs and combinations exhibited significant increases in cytotoxicity percentages.
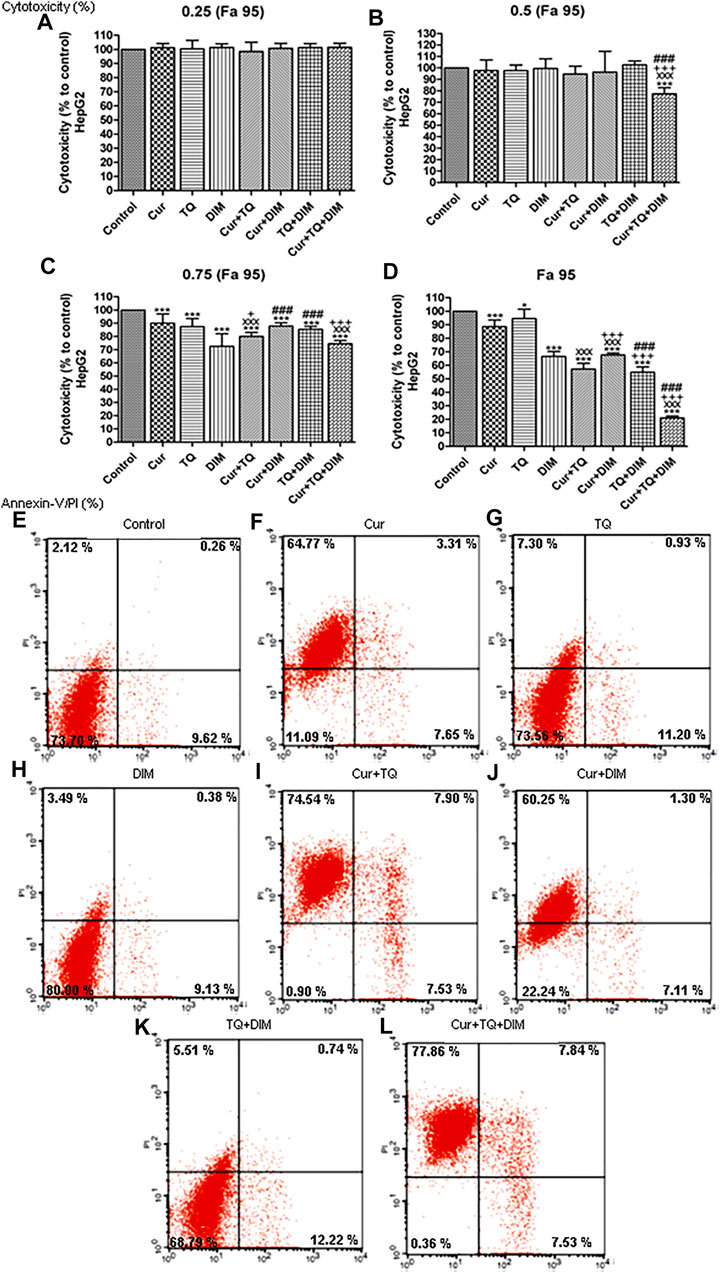
FIGURE 6. Cytotoxicity and annexin-V positive cell percentages of HepG2. (A) Cytotoxicity percentages of 0.25 (Fa 95) (B) 0.50 (Fa 95) (C) 0.75 (Fa 95), and (D) Fa 95 of curcumin (Cur), thymoquinone (TQ), and 3,3′-diindolylmethane (DIM) against HepG2. (E) Annexin-V positive cell percentages of control HepG2 cells. (F) Cur-treated cells with 0.75 (Fa 95) = 15.83 µM. (G) TQ-treated cells with 0.75 (Fa 95) = 18.71 µM. (H) DIM-treated cells with 0.75 (Fa 95) = 42.27 µM. (I) Cur + TQ treated cells with 0.75 (Fa 95) of Cur and TQ. (J) Cur + DIM treated cells with 0.75 (Fa 95) of Cur and DIM. (K) TQ + DIM treated cells with 0.75 (Fa 95) of TQ and DIM. (L) Cur + TQ + DIM treated cells with 0.75 (Fa 95) of Cur, TQ, and DIM. The data were analyzed with one-way ANOVA followed by Tukey’s multiple comparison test. Error bars represent mean ± SD. *p < 0.05 and ***p < 0.001 vs. control. xxxP < 0.001 vs. Cur. +p < 0.05 and +++p < 0.001 vs. TQ. ###p < 0.001 vs. DIM.
Annexin-V positive cell percentages of HepG2 cells treated with Cur, TQ, DIM, and their combinations
Results shown in Figures 6E–L treated HepG2 cells with Cur, TQ, DIM, Cur + TQ, Cur + DIM, TQ + DIM, and Cur + TQ + DIM exhibited significant increases in annexin-V positive cells by percentages of 75.73, 19.43, 13.00, 89.97, 68.66, 18.47, and 93.23, respectively compared with 12.00 of control.
Cell cycle analyses and proliferation assay of HepG2 cells treated with Cur, TQ, DIM, and their combinations
Cell cycle analysis of HepG2 cells treated with Cur, TQ, DIM, Cur + TQ, Cur + DIM, TQ + DIM, and Cur + TQ + DIM by 0.75 (Fa 95) doses showed S phase inhibition (Figures 7A–H). Concentrations of these drugs significantly decreased proliferation percentages of HepG2 cells (Figure 7I).
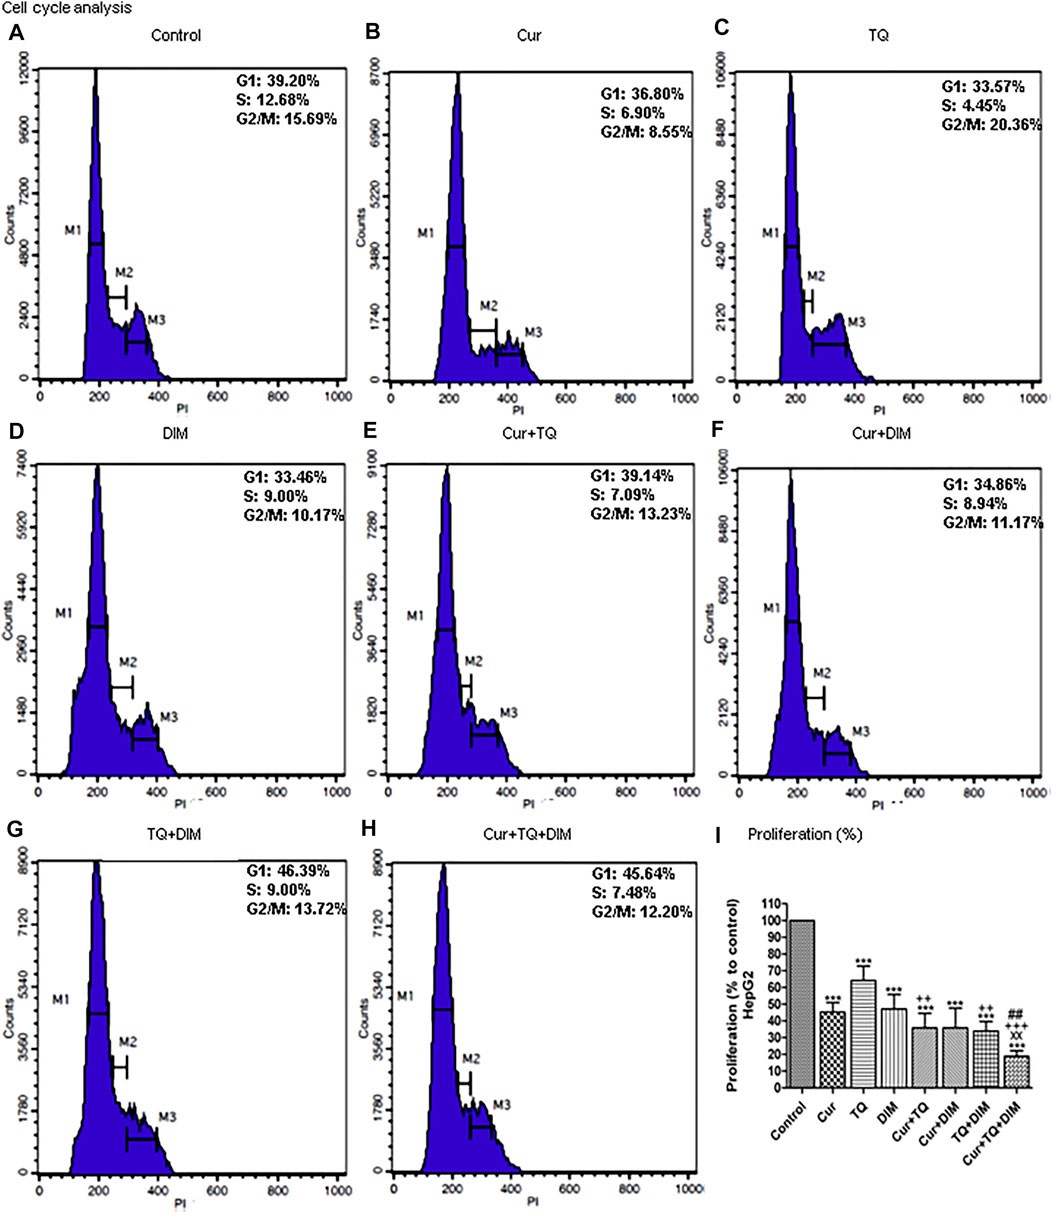
FIGURE 7. Cell cycle analysis and proliferation percentage of HepG2. (A) Cell cycle analysis of control HepG2. (B) Cell cycle analysis of Cur-treated cells with 0.75 (Fa 95) = 15.83 µM. (C) Cell cycle analysis of TQ-treated cells with 0.75 (Fa 95) = 18.71 µM. (D) Cell cycle analysis of DIM-treated cells with 0.75 (Fa 95) = 42.27 µM. (E) Cell cycle analysis of Cur + TQ treated cells with 0.75 (Fa 95) of Cur and TQ. (F) Cell cycle analysis of Cur + DIM treated cells with 0.75 (Fa 95) of Cur and DIM. (G) Cell cycle analysis of TQ + DIM treated cells with 0.75 (Fa 95) of TQ and DIM. (H) Cell cycle analysis of Cur + TQ + DIM treated cells with 0.75 (Fa 95) of Cur, TQ, and DIM. (I) Proliferation percentages of control and HepG2-treated cells with 0.75 (Fa 95) of Cur, TQ, DIM, Cur + TQ, Cur + DIM, TQ + DIM, and Cur + TQ + DIM. The data were analyzed with one-way ANOVA followed by Tukey’s multiple comparison test. Error bars represent mean ± SD. ***p < 0.001 vs. control. xxP < 0.01 vs. Cur. ++p < 0.01 and ++p < 0.01 vs. TQ. ##p < 0.01 vs. DIM.
Migration and colony formation assays of HepG2 cells treated with Cur, TQ, DIM, and their combinations
Cur-, TQ-, DIM-, Cur + TQ-, Cur + DIM-, TQ + DIM-, and Cur + TQ + DIM-treated HepG2 cells with concentrations of 0.75 (Fa 95) exhibited significant decreases in migration activity as presented in Figure 8A. By the same concentrations, colony formation activities of the Cur-, TQ-, DIM-, Cur + TQ-, Cur + DIM-, TQ + DIM-, and Cur + TQ + DIM-treated HepG2 cells with concentrations of 0.75 (Fa 95), Cur + TQ + DIM at concentrations of 0.50 (Fa 95), and 0.25 (Fa 95) were significantly decreased compared with control (Figure 8B).
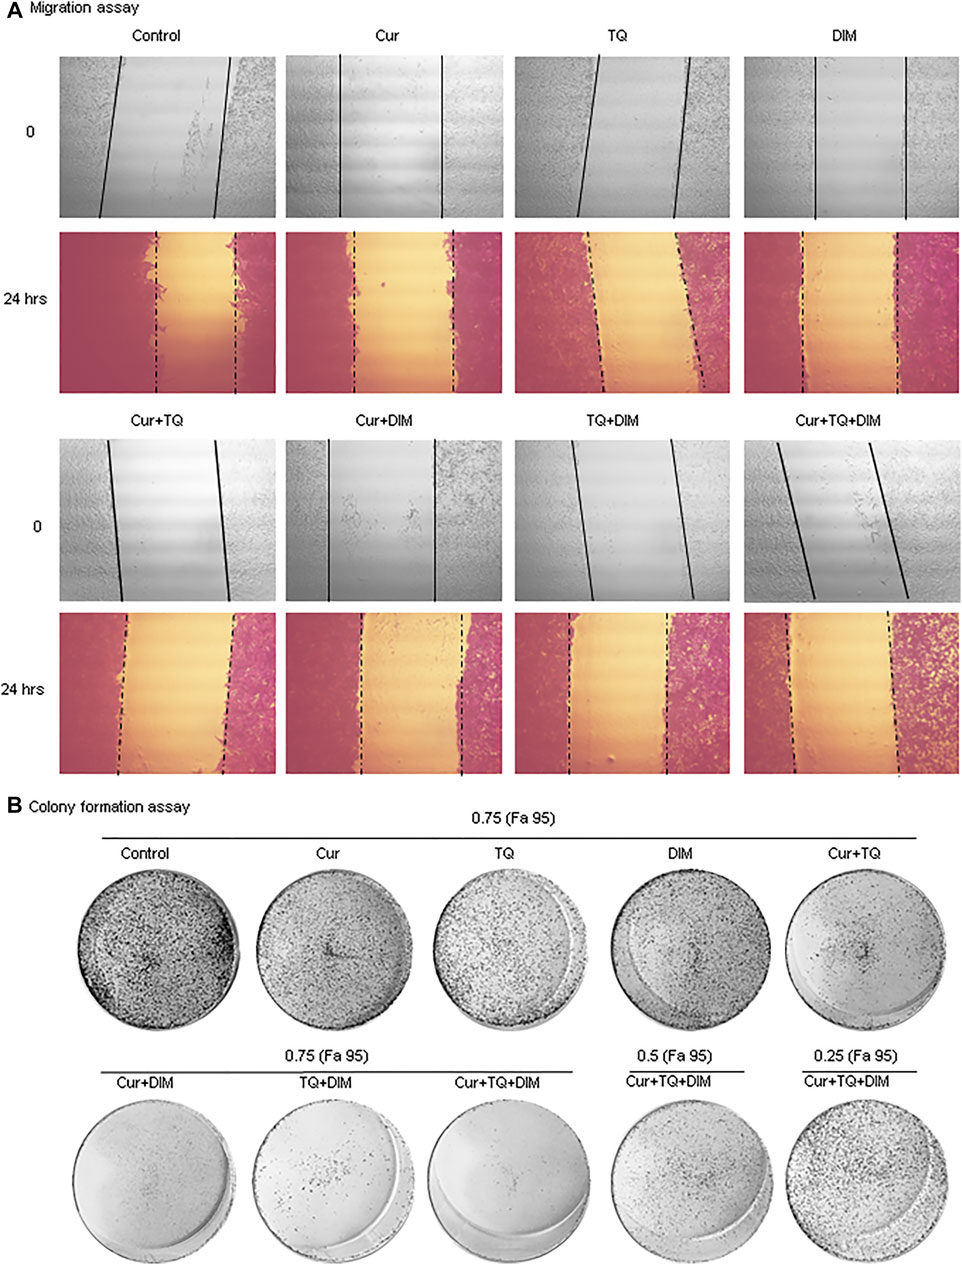
FIGURE 8. Migration and colony formation assays of HepG2. (A) Migration assay of control and HepG2-treated with 0.75 (Fa 95) of Cur, TQ, DIM, Cur + TQ, Cur + DIM, TQ + DIM, and Cur + TQ + DIM at 0 and 24 h (B) colony formation assay of control, HepG2-treated with 0.75 (Fa 95) of Cur, TQ, DIM, Cur + TQ, Cur + DIM, TQ + DIM, and Cur + TQ + DIM, HepG2-treated with 0.50 (Fa 95) of Cur + TQ + DIM, and HepG2-treated with 0.25 (Fa 95) of Cur + TQ + DIM.
Caspase-3, PI3K, and AKT protein levels in A549 and HepG2 cells treated with Cur, TQ, DIM, and their combinations
It can be seen from the data in Figure 9A that caspase-3 protein levels were significantly increased in Cur-, TQ-, DIM-, Cur + TQ-, Cur + DIM-, TQ + DIM-, and Cur + TQ + DIM-treated A549 cells with concentrations of 0.75 (Fa 95), Cur + TQ + DIM at concentrations of 0.50 (Fa 95), and 0.25 (Fa 95). A549 cells treated with the same concentrations exhibited significant decreases in the PI3K (Figure 9C) and AKT (Figure 9E) protein levels compared with control.
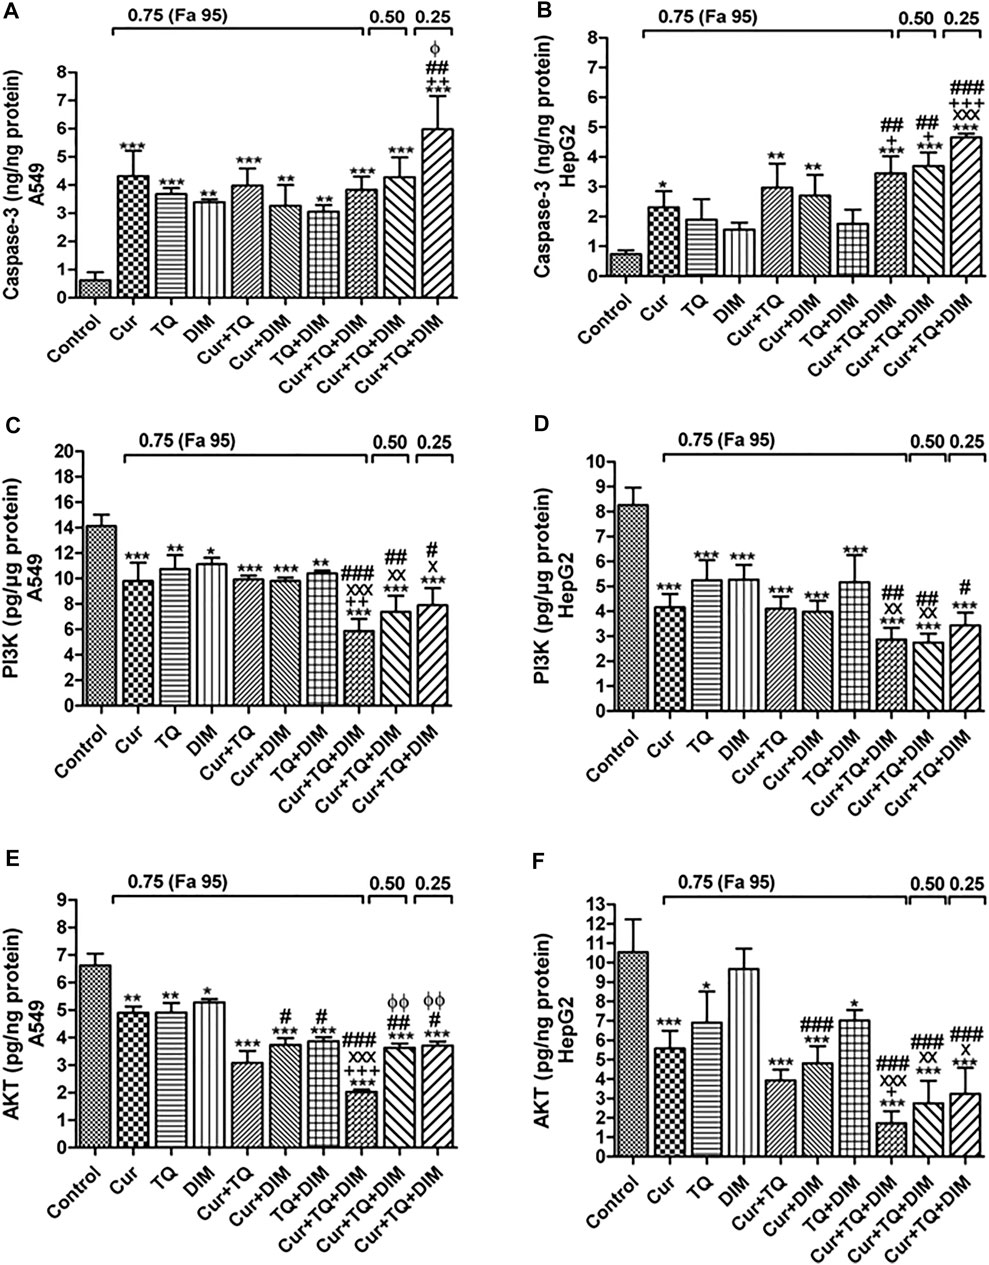
FIGURE 9. Enzyme-linked immunosorbent (ELISA) assay. (A) Caspase-3 (ng/ng protein) (C) phosphatidylinositol 3-kinase (PI3K, pg/µg protein), and (E) Protein kinase B (AKT, pg/ng protein) levels in control, A549-treated with 0.75 (Fa 95) of Cur, TQ, DIM, Cur + TQ, Cur + DIM, TQ + DIM, and Cur + TQ + DIM, A549-treated with 0.50 (Fa 95) of Cur + TQ + DIM, and A549-treated with 0.25 (Fa 95) of Cur + TQ + DIM. (B) Caspase-3 (ng/ng protein) (D) PI3K (pg/µg protein), and (F) AKT (pg/ng protein) levels in control, HepG2-treated with 0.75 (Fa 95) of Cur, TQ, DIM, Cur + TQ, Cur + DIM, TQ + DIM, and Cur + TQ + DIM, HepG2-treated with 0.50 (Fa 95) of Cur + TQ + DIM, and HepG2-treated with 0.25 (Fa 95) of Cur + TQ + DIM. The data were analyzed with one-way ANOVA followed by Tukey’s multiple comparison test. Error bars represent mean ± SD. *p < 0.05, **p < 0.01, and ***p < 0.001 vs. control. xP < 0.05, xxP < 0.01, and xxxP < 0.001 vs. Cur. +p < 0.05, ++p < 0.01, and +++p < 0.001 vs. TQ. #p < 0.05, ##p < 0.01, and ###p < 0.001 vs. DIM.
Caspase-3 protein levels were significantly increased in the Cur-, TQ-, DIM-, Cur + TQ-, Cur + DIM-, TQ + DIM-, and Cur + TQ + DIM-treated HepG2 cells with concentrations of 0.75 (Fa 95), Cur + TQ + DIM at a concentration of 0.50 (Fa 95), and Cur + TQ + DIM at a concentration of 0.25 (Fa 95) (Figure 9B). On the contrary, HepG2 cells treated with the same concentrations exhibited significantly decreased PI3K (Figure 9D) and AKT (Figure 9F) protein levels compared with control.
Tumor weight and hemoglobin concentrations of A549 and HepG2 implant in CAM
Tumor weights and Hb concentrations of A549 (Figures 10A,B, respectively) and HepG2 (Figures 10C,D, respectively) cells’ implants treated with Cur, TQ, DIM, and their combinations significantly decreased compared with the control group. The tumor weights of implanted A549 cells were significantly decreased Cur (0.0618 ± 0.0012 g), TQ (0.0570 ± 0.0023 g), DIM (0.0531 ± 0.0012 g), Cur + TQ (0.0353 ± 0.0045 g) Cur + DIM (0.0373 ± 0.0001 g), TQ + DIM (0.0301 ± 0.0023 g), and Cur + TQ + DIM (0.0210 ± 0.0001 g) than control (0.0810 ± 0.0012 g). Similary, HepG2 implants exhibited significant decreases in the Cur (0.0650 ± 0.0012 g), TQ (0.0600 ± 0.0023 g), DIM (0.0693 ± 0.0012 g), Cur + TQ (0.0443 ± 0.0045 g) Cur + DIM (0.0463 ± 0.0001 g), TQ + DIM (0.0401 ± 0.0023 g), and Cur + TQ + DIM (0.0190 ± 0.0001 g) tumor weight than control (0.0980 ± 0.0012 g).
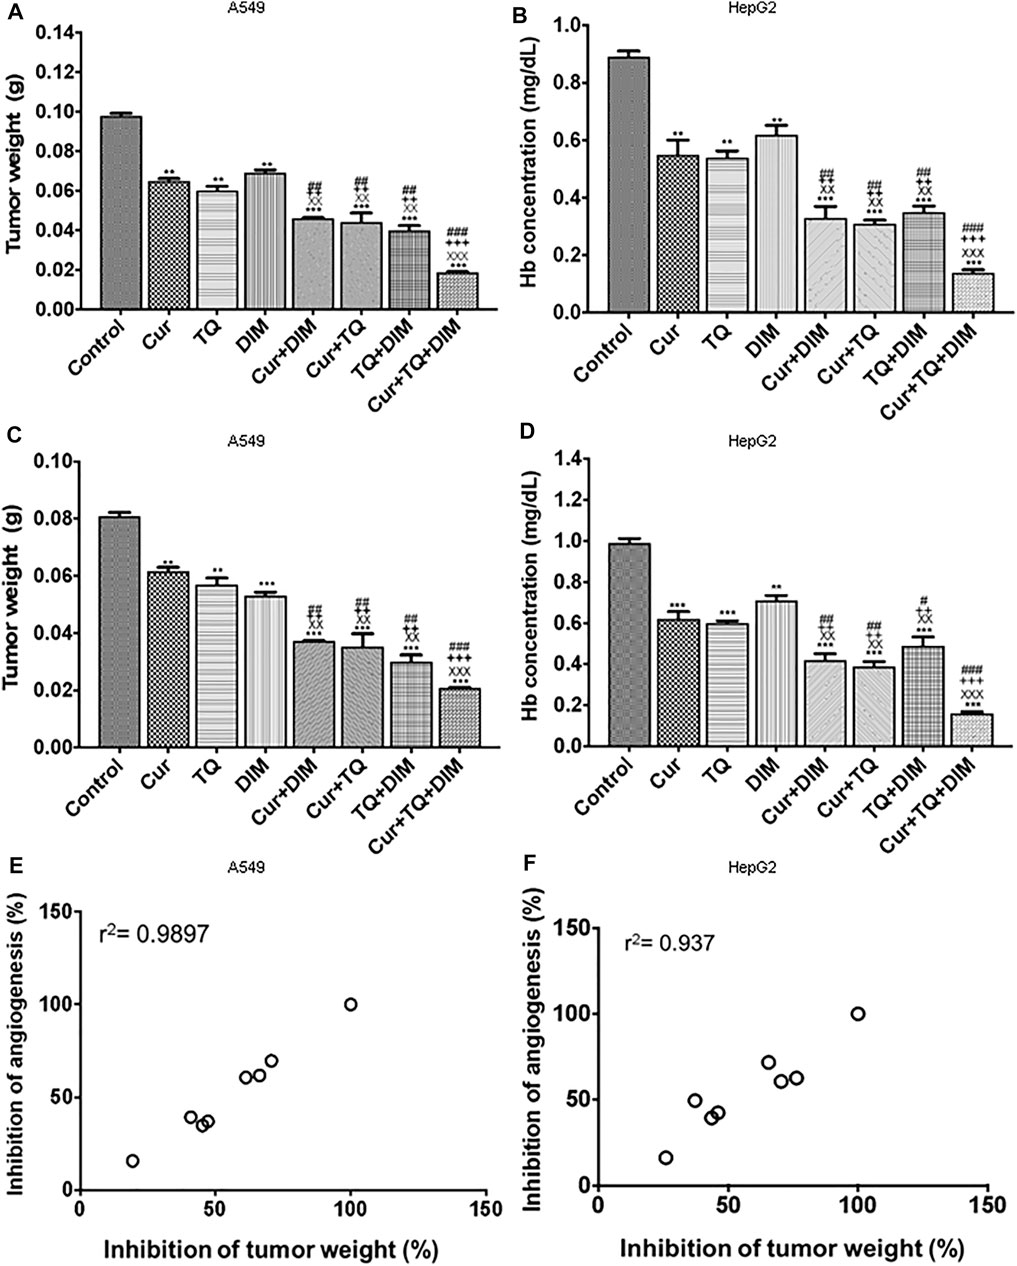
FIGURE 10. Chorioallantoic membrane (CAM) model. (A) Tumor weight per g for A549 implant (B) Hemoglobin concentration (mg/ml) for A549 implant (C) Tumor weight per g for HepG2 implant, and (D) Hemoglobin concentration (mg/ml) for HepG2 implant. (E) Correlation coefficient (r2) of percentages of inhibition of tumor weight and hemoglobin concentrations for A549 implant. (F) Correlation coefficient (r2) of percentages of inhibition of tumor weight and hemoglobin concentrations for HepG2 implant. The treatment groups were Matrigel with A549 or HepG2 cells (control), Matrigel/A549 or HepG2 with Cur (3.5 μg/CAM and 5.8 μg/CAM), TQ (6 μg/CAM and 3 μg/CAM), DIM (11.7 μg/CAM and 10.4 μg/CAM), and their combinations of Cur + DIM, Cur + TQ, TQ + DIM, and Cur + TQ + DIM. The data were analyzed with one-way ANOVA followed by Tukey’s multiple comparison test. Error bars represent mean ± SD. **p < 0.01 and ***p < 0.001 vs. control. xxP < 0.01 and xxxP < 0.001 vs. Cur. ++p < 0.01 and +++p < 0.001 vs. TQ. #p < 0.05, ##p < 0.01, and ###p < 0.001 vs. DIM.
The Cur + TQ + DIM, Cur + DIM, Cur + TQ, and TQ + DIM treated implants exhibited more significant reductions in tumor weights and Hb concentrations of A549 and HepG2 cells’ implants compared with single drugs, Cur, TQ, and DIM. Excellent correlation (r2 = 0.99) between tumor growth inhibition and tumor angiogenesis inhibition was demonstrated for the various natural bioactive compounds and their combinations, which suggest a key role for their anti-angiogenesis activities in suppressing tumor progression (Figures 10E,F).
Discussion
Nutraceuticals are derived from various natural sources such as medicinal plants, marine organisms, vegetables, and fruits (Kuppusamy et al., 2014). Many food components have been associated with chemopreventive properties, including Cur, TQ, DIM, lycopene, resveratrol, ellagic acid, and costunolide (El-Far AH. et al., 2018, 2020a, 2020b, El-Far et al., 2021 AH., 2021b; Mousa et al., 2020; Sudha et al., 2020).
By searching in the comparative toxicogenomics database (http://ctdbase.org/), we stated Cur, TQ, and DIM’s anticancer effect against numerous cancer types targeting numerous genes represented in Supplementary Tables S4–S6, respectively. To explain the combinatory effect of Cur, TQ, and DIM, we summarized the effect of them and their targets in Supplementary Table S7. Cur and TQ, Cur and DIM, and the three drugs have common targets that explain their combinatory anticancer, which increased in double and highly increased in the triple combination. On the contrary, no common targets were recognized for TQ and DIM, suggesting they did their effect by different mechanisms if used together.
In the present study, Cur, TQ, and DIM combinations significantly induced apoptosis and increased caspase-3 protein levels while significantly decreasing cell proliferation, migration, colony formation activities, and PI3K and AKT protein levels in A549 and HepG2 with S phase reduction in both cells. Also, caspase-3 levels were expressed at low levels in the patient’s samples, while PI3K and AKT were expressed at high levels (Supplementary Figure S1).
Lung cancer is one of the leading causes of cancer-related deaths in males and females worldwide. Approximately 85% of lung cancer cases are diagnosed as non-small-cell lung cancer (Molina et al., 2008). Numerous studies have investigated the anticancer effect of Cur against A549 cells through downregulation of urothelial cancer-associated 1 (Wang WH. et al., 2018). Also, Cur induced Bad dephosphorylation in an AKT-dependent fashion in A549 cells (Endo et al., 2020). In addition, Cur induced phosphorylation and activation of c-Jun N-terminal kinase, p38, and extracellular signal-regulated kinase (ERK) (Yao et al., 2015) and activation of autophagy (Liu et al., 2017) in A549. Fluorescent liposomes containing a combination of TQ and Cur decreased A549 lung cancer cell viability (Fahmy, 2019). Another nanoformulation of Cur-chrysin-loaded alginate-chitosan hydrogels significantly induced apoptosis and G2/M cell cycle arrest in both A549 and T47D cell lines (Abbasalizadeh et al., 2021). Also, the cell cycle has been arrested by the Cur and Cur/paclitaxel combination in A549 cells (Lee et al., 2020). In another study, Cur increased the sensitivity of A549 cells to gemcitabine therapy. It significantly decreased the migration and invasion of A549/gemcitabine cells in response to reduced expression of matrix metalloproteinase-9, vimentin, and N-cadherin (Dong et al., 2021). By another mechanism, Cur inhibited A549 cells migration and invasion through suppression of PI3K/AKT/mammalian target of rapamycin (mTOR) signaling pathway (Wang et al., 2020).
TQ promoted apoptosis in A549 cells by the activation of p53 and caspase cascade-dependent pathways (Samarghandian et al., 2019), and reactive oxygen species (ROS) generation (Alhakamy et al., 2020), and extracellular signal-regulated kinase 1/2 pathway (Yang et al., 2015). Furthermore, TQ significantly reduced the expression of B-cell lymphoma 2 (Bcl2), an anti-apoptotic protein, and induced Bcl2-associated X (Bax) protein, a proapoptotic, leading to apoptosis of A549 cells (Alam et al., 2022). In addition, the p-AKT, p-mTOR, caspase-3, p-53, and NF-κB expression levels were significantly reduced in TQ and TQ/indirubin-3-monoxime-treated A549 cells (Dera et al., 2020). Also, TQ induced the antimitotic mechanism of A549 cells by its direct binding to the tubulin-MT network (Acharya et al., 2014). Khan et al. (2022) treated A549 with polyethylene glycol (PEG)-coated DSPC/cholesterol comprising TQ liposomes (PEG-Lip-TQ) that induced several-fold decreases in the PEG-Lip-TQ’s IC50 and showed changes in cell cycle analysis in comparison with free TQ. In the same context, TQ nanoformulations induced cell cycle arrest of A549 (Alhakamy et al., 2020; Asfour et al., 2021). Also, transferrin-decorated thymoquinone-loaded PEG-PLGA nanoparticles restricted the A549 cells migration (Upadhyay et al., 2019). Furthermore, as confirmed by Western blot analysis, Yang et al. (2015) stated that TQ inhibited A549 cell proliferation, migration, and invasion through the ERK1/2 pathway.
Cur induced HepG2 cells’ death by increasing apoptosis and ROS generation process (Liang et al., 2021). This effect could be attributed to the activation of caspase-3 (Dai et al., 2013) and the downregulation of the PI3K/AKT signaling pathway (Chang et al., 2017; Han et al., 2020). In addition, Cur induced mitochondrial and mitochondrial DNA damage (Cao et al., 2007) besides fatty acid synthase inhibition (Fan et al., 2014) in HepG2. In addition, Cur significantly inhibited HepG2 cell migration, as stated by Duan et al. (2014), Zhao et al. (2016), and Wang L. et al (2018).
TQ induced G2/M phase cell cycle arrest and apoptosis in HepG2 cells with a significant increase in Bax/Bcl2 ratio (ElKhoely et al., 2015). HepG2 treated with TQ exhibited significant apoptosis explained in many studies. It could be due to increased miR-16 and miR-375 levels and caspase-3 and Bcl2 expressions (Bashir et al., 2020). Also, HepG2 treated with TQ exhibited significant increases in caspase-3 (Aslan et al., 2021) and decreased AKT (Attoub et al., 2013) levels. In addition, TQ enhanced the TRAIL-induced death of HepG2 cells and inhibited NF-κB (Ashour et al., 2014).
DIM inhibited HepG2 cell proliferation in a concentration- and time-dependent (Jiang et al., 2019). Also, DIM induced S-phase retardation and mitotic delay in HepG2 cells through topoisomerase II-α catalytic inhibition (Gong et al., 2006).
Angiogenesis is a multistep process triggered by various biological signals and has a physiological and pathological role (Park et al., 2020). Angiogenesis is regulated by balancing angiogenic growth and inhibitory factors in healthy tissues (Al-Ostoot et al., 2021). Neovascularization in tumor masses is caused by vascular endothelial growth factor (VEGF), angiopoietin families, and cytokines (Saaristo et al., 2000).
In the current study, the CAM system has been used to investigate Cur, TQ, and DIM’s anti-angiogenic effect and their combinations. Triple and double combinations significantly reduced tumor weight and Hb concentrations in tumor masses. The CAM system has been widely used to study human tumor growth (Klingenberg et al., 2014; Herrmann et al., 2016; Mousa et al., 2020). Also, the anti-angiogenic effect of Cur (Deng et al., 2016; Buzzá et al., 2019), TQ (Shanmugam et al., 2018; Ndreshkjana et al., 2019), and DIM (Mousa et al., 2020) were applied in CAM. Furthermore, many studies reported the anti-angiogenic effect of Cur and TQ against the A549 and HepG2 mouse xenograft model leading to reductions in tumor growth and vascularization targeting VEGF (Yoysungnoen et al., 2006, 2008; ElKhoely et al., 2015; Wang et al., 2015; Jiao et al., 2016; Li et al., 2018; Tian et al., 2021). Our data supported the key role of Cur, TQ, and DIM and their combinations on angiogenesis suppression and its highly correlated effects on tumor growth inhibition.
The current study stated that Cur, TQ, and DIM increased A549 and HepG2 apoptosis. Interestingly, double and triple combinations of Cur, TQ, and DIM induced more apoptosis of A549 and HepG2 with significant decreases in proliferation, migration, and colony formation activities. This action could be attributed to the enhanced effects of Cur, TQ, and DIM combinations.
Conclusion and prospective
The present study was designed to determine the combinatory effect of Cur, TQ, and DIM on A549 and HepG2 cells. The most obvious finding from this study is that triple (Cur + TQ + DIM) and double (Cur + TQ, Cur + DIM, and TQ + DIM) combinations increased apoptosis and decreased proliferation and migration colony formation activities with S phase reduction. In addition, triple and double combinations significantly reduced tumor weight and Hb concentrations in A549 and HepG2 cells’ implants in the CAM model. Therefore, Cur, TQ, and DIM combinations are promising agents for suppressing tumor growth and angiogenesis. Further preclinical and clinical studies are warranted trying to use their approved doses as stated in Supplementary Tables S1–S3.
Cur, TQ, and DIM have common targets as stated in Supplementary Table S7, except TQ and DIM have not shared targets. For future consideration, we determined the binding free energy, binding affinity (pKi), and the ligand efficiency of common targets with Cur, TQ, and DIM have been determined using InstaDock software (Hassan et al., 2017) and represented in Table 3. Generally, Cur has the highest binding affinities with target proteins, followed by DIM and then TQ. Furthermore, because Cur, TQ, and DIM have different and common targets, we suggest treating different cancer cells with these drugs with time intervals even for 1 h in between and determine the most effective combination for each cancer types, especially mitogen-activated protein kinase (MAPK), matrix metalloproteinases (MMPs), and AKT/PI3K/mTOR pathways, as stated in Table 3. In the same context, we encourage researchers to investigate Cur, TQ, and DIM combination with chemotherapeutic agents investigating the effect of natural products combined with commonly used chemotherapeutics for cancer therapy.
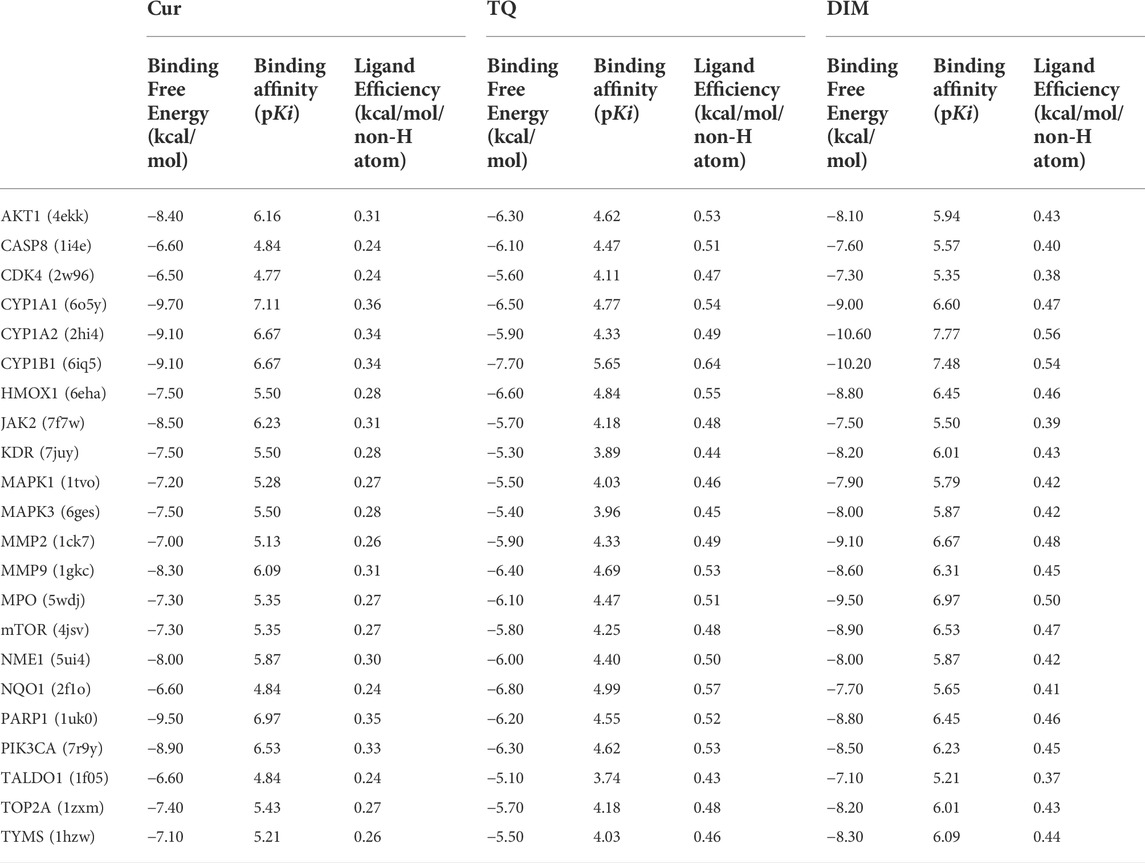
TABLE 3. Docking score of curcumin (Cur), thymoquinone (TQ), and 3, 3′-diindolylmethane (DIM) against some of their common targets.
Data availability statement
The original contributions presented in the study are included in the article/Supplementary Material, further inquiries can be directed to the corresponding author.
Author contributions
Conceptualization, AE-F, AS, SA, KG, OA, SM; formal analysis, AE-F, SM, KG, OA; investigation, AE-F, AS, SA, KG, OA; project administration, AE-F, AS, KG, OA, and SM; software, AE-F, SA, and SM; validation, AE-F, AAS, and SM; visualization, AE-F; writing—original draft, AE-F; writing—review and editing, AE-F, AS, SA, KG, OA, and SM. All authors have read and agreed to the published version of the manuscript.
Funding
The work was carried out with financial support from the Deputyship for Research and Innovation, Ministry of Education in Saudi Arabia, for funding this research work through the project number MoE-IF-G-20-02.
Conflict of interest
The authors declare that the research was conducted in the absence of any commercial or financial relationships that could be construed as a potential conflict of interest.
Publisher’s note
All claims expressed in this article are solely those of the authors and do not necessarily represent those of their affiliated organizations, or those of the publisher, the editors and the reviewers. Any product that may be evaluated in this article, or claim that may be made by its manufacturer, is not guaranteed or endorsed by the publisher.
Supplementary material
The Supplementary Material for this article can be found online at: https://www.frontiersin.org/articles/10.3389/fphar.2022.936996/full#supplementary-material
References
Abbasalizadeh, F., Alizadeh, E., Bagher Fazljou, S. M., Torbati, M., and Akbarzadeh, A. (2022). Anticancer effect of alginate-chitosan hydrogel loaded with Curcumin and Chrysin on lung and breast cancer cell lines. Cdd 19, 600–613. doi:10.2174/1567201818666210813142007
Acharya, B. R., Chatterjee, A., Ganguli, A., Bhattacharya, S., and Chakrabarti, G. (2014). Thymoquinone inhibits microtubule polymerization by tubulin binding and causes mitotic arrest following apoptosis in A549 cells. Biochimie 97, 78–91. doi:10.1016/j.biochi.2013.09.025
Al-Ostoot, F. H., Salah, S., Khamees, H. A., and Khanum, S. A. (2021). Tumor angiogenesis: Current challenges and therapeutic opportunities. Cancer Treat. Res. Commun. 28, 100422. doi:10.1016/j.ctarc.2021.100422
Alam, S., Mohammad, T., Padder, R. A., Hassan, M. I., and Husain, M. (2022). Thymoquinone and quercetin induce enhanced apoptosis in non-small cell lung cancer in combination through the Bax/Bcl2 cascade. J. Cell. Biochem. 123, 259–274. doi:10.1002/jcb.30162
Alhakamy, N. A., Badr-Eldin, S. M., A Fahmy, U. U., Alruwaili, N. K., Awan, Z. A., Caruso, G., et al. (2020). Thymoquinone-loaded soy-phospholipid-based phytosomes exhibit anticancer potential against human lung cancer cells. Pharmaceutics 12, 761. doi:10.3390/pharmaceutics12080761
Alhmied, F., Alammar, A., Alsultan, B., Alshehri, M., and Pottoo, F. H. (2021). Molecular mechanisms of thymoquinone as anticancer agent. Comb. Chem. High. Throughput Screen. 24, 1644–1653. doi:10.2174/1386207323999201027225305
Asfour, H. Z., Fahmy, U. A., Alharbi, W. S., Almehmady, A. M., Alamoudi, A. J., Tima, S., et al. (2021). Phyto-phospholipid conjugated scorpion venom nanovesicles as promising carrier that improves efficacy of thymoquinone against adenocarcinoma human alveolar basal epithelial cells. Pharmaceutics 13, 2144. doi:10.3390/pharmaceutics13122144
Ashour, A. E., Abd-Allah, A. R., Korashy, H. M., Attia, S. M., Alzahrani, A. Z., Saquib, Q., et al. (2014). Thymoquinone suppression of the human hepatocellular carcinoma cell growth involves inhibition of IL-8 expression, elevated levels of TRAIL receptors, oxidative stress and apoptosis. Mol. Cell. Biochem. 389, 85–98. doi:10.1007/s11010-013-1930-1
Aslan, M., Afşar, E., Kırımlıoglu, E., Çeker, T., and Yılmaz, Ç. (2021). Antiproliferative effects of thymoquinone in MCF-7 breast and HepG2 liver cancer cells: Possible role of ceramide and ER stress. Nutr. Cancer 73, 460–472. doi:10.1080/01635581.2020.1751216
Attoub, S., Sperandio, O., Raza, H., Arafat, K., Al-Salam, S., Al Sultan, M. A., et al. (2013). Thymoquinone as an anticancer agent: Evidence from inhibition of cancer cells viability and invasion in vitro and tumor growth in vivo. Fundam. Clin. Pharmacol. 27, 557–569. doi:10.1111/j.1472-8206.2012.01056.x
Bashir, A. O., El-Mesery, M. E., Anwer, R., and Eissa, L. A. (2020). Thymoquinone potentiates miR-16 and miR-375 expressions in hepatocellular carcinoma. Life Sci. 254, 117794. doi:10.1016/j.lfs.2020.117794
Bradford, M. M. (1976). A rapid and sensitive method for the quantitation of microgram quantities of protein utilizing the principle of protein-dye binding. Anal. Biochem. 72, 248–254. doi:10.1006/abio.1976.9999
Bray, F., Laversanne, M., Weiderpass, E., and Soerjomataram, I. (2021). The ever-increasing importance of cancer as a leading cause of premature death worldwide. Cancer 127, 3029–3030. doi:10.1002/cncr.33587
Buzzá, H. H., Fialho de Freitas, L. C., Moriyama, L. T., Teixeira Rosa, R. G., Bagnato, V. S., and Kurachi, C. (2019). Vascular effects of photodynamic therapy with curcumin in a chorioallantoic membrane model. Int. J. Mol. Sci. 20, 1084. doi:10.3390/ijms20051084
Cao, J., Liu, Y., Jia, L., Zhou, H. M., Kong, Y., Yang, G., et al. (2007). Curcumin induces apoptosis through mitochondrial hyperpolarization and mtDNA damage in human hepatoma G2 cells. Free Radic. Biol. Med. 43, 968–975. doi:10.1016/j.freeradbiomed.2007.06.006
Chang, M., Wu, M., and Li, H. (2017). Curcumin combined with glycyrrhetinic acid inhibits the development of hepatocellular carcinoma cells by down-regulating the PTEN/PI3K/AKT signalling pathway. Am. J. Transl. Res. 9, 5567–5575.
Chou, T. C. (2011). The mass-action law based algorithm for cost-effective approach for cancer drug discovery and development. Am. J. Cancer Res. 1, 925–954.
Dai, X. Z., Yin, H. T., Sun, L. F., Hu, X., Zhou, C., Zhou, Y., et al. (2013). Potential therapeutic efficacy of curcumin in liver cancer. Asian pac. J. Cancer Prev. 14, 3855–3859. doi:10.7314/apjcp.2013.14.6.3855
den Hollander, P., Savage, M. I., and Brown, P. H. (2013). Targeted therapy for breast cancer prevention. Front. Oncol. 3, 250. doi:10.3389/fonc.2013.00250
Deng, Y. I., Verron, E., and Rohanizadeh, R. (2016). Molecular mechanisms of anti-metastatic activity of curcumin. Anticancer Res. 36, 5639–5647. doi:10.21873/anticanres.11147
Dera, A. A., Rajagopalan, P., Al Fayi, M., Ahmed, I., and Chandramoorthy, H. C. (2020). Indirubin-3-monoxime and thymoquinone exhibit synergistic efficacy as therapeutic combination in in-vitro and in-vivo models of lung cancer. Arch. Pharm. Res. 43, 655–665. doi:10.1007/s12272-020-01241-2
Dong, Z., Feng, Q., Zhang, H., Liu, Q., and Gong, J. (2021). Curcumin enhances drug sensitivity of gemcitabine-resistant lung cancer cells and inhibits metastasis. Pharmazie 76, 538–543. doi:10.1691/PH.2021.0927
Duan, W., Chang, Y., Li, R., Xu, Q., Lei, J., Yin, C., et al. (2014). Curcumin inhibits hypoxia inducible factor‑1α‑induced epithelial‑mesenchymal transition in HepG2 hepatocellular carcinoma cells. Mol. Med. Rep. 10, 2505–2510. doi:10.3892/mmr.2014.2551
El-Far, A. H., Al Jaouni, S. K., Li, W., and Mousa, S. A. (2018b). Protective roles of thymoquinone nanoformulations: Potential nanonutraceuticals in human diseases. Nutrients 10, 1369. doi:10.3390/nu10101369
El-Far, A. H., Darwish, N. H. E., and Mousa, S. A. (2020a). Senescent colon and breast cancer cells induced by doxorubicin exhibit enhanced sensitivity to curcumin, caffeine, and thymoquinone. Integr. Cancer Ther. 19, 1534735419901160. doi:10.1177/1534735419901160
El-Far, A. H., Godugu, K., Noreldin, A. E., Saddiq, A. A., Almaghrabi, O. A., Al Jaouni, S. K., et al. (2021a). Thymoquinone and costunolide induce apoptosis of both proliferative and doxorubicin-induced-senescent colon and breast cancer cells. Integr. Cancer Ther. 20, 15347354211035450. doi:10.1177/15347354211035450
El-Far, A. H., Tantawy, M. A., Al Jaouni, S. K., and Mousa, S. A. (2020b). Thymoquinone-chemotherapeutic combinations: new regimen to combat cancer and cancer stem cells. Naunyn. Schmiedeb. Arch. Pharmacol. 393, 1581–1598. doi:10.1007/s00210-020-01898-y
El-Far, A. H. (2015). Thymoquinone anticancer discovery: possible mechanisms. Curr. Drug Discov. Technol. 12, 80–89. doi:10.2174/1570163812666150716111821
El-Far, A. H. A. M., Munesue, S., Harashima, A., Sato, A., Shindo, M., Nakajima, S., et al. (2018a). In vitro anticancer effects of a RAGE inhibitor discovered using a structure-based drug design system. Oncol. Lett. 15, 4627–4634. doi:10.3892/ol.2018.7902
El-Far, A. H., Salaheldin, T. A., Godugu, K., Darwish, N. H., and Mousa, S. A. (2021b). Thymoquinone and its nanoformulation attenuate colorectal and breast cancers and alleviate doxorubicin-induced cardiotoxicity. Nanomedicine 16, 1457–1469. doi:10.2217/nnm-2021-0103
ElKhoely, A., Hafez, H. F., Ashmawy, A. M., Badary, O., Abdelaziz, A., Mostafa, A., et al. (2015). Chemopreventive and therapeutic potentials of thymoquinone in HepG2 cells: mechanistic perspectives. J. Nat. Med. 69, 313–323. doi:10.1007/s11418-015-0895-7
Endo, H., Inoue, I., Masunaka, K., Tanaka, M., and Yano, M. (2020). Curcumin induces apoptosis in lung cancer cells by 14-3-3 protein-mediated activation of bad. Biosci. Biotechnol. Biochem. 84, 2440–2447. doi:10.1080/09168451.2020.1808443
Fahmy, H. M. (2019). In vitro study of the cytotoxicity of thymoquinone/curcumin fluorescent liposomes. Naunyn. Schmiedeb. Arch. Pharmacol. 392, 1465–1476. doi:10.1007/s00210-019-01688-1
Fan, H., Tian, W., and Ma, X. (2014). Curcumin induces apoptosis of HepG2 cells via inhibiting fatty acid synthase. Target. Oncol. 9, 279–286. doi:10.1007/s11523-013-0286-5
Glade, M. J. (1999). Food, nutrition, and the prevention of cancer: a global perspective. American institute for cancer research/world cancer research fund, american institute for cancer research, 1997. Nutrition 15, 523–526. doi:10.1016/s0899-9007(99)00021-0
Gong, Y., Firestone, G. L., and Bjeldanes, L. F. (2006). 3, 3'-diindolylmethane is a novel topoisomerase IIalpha catalytic inhibitor that induces S-phase retardation and mitotic delay in human hepatoma HepG2 cells. Mol. Pharmacol. 69, 1320–1327. doi:10.1124/mol.105.018978
Guzmán, C., Bagga, M., Kaur, A., Westermarck, J., and Abankwa, D. (2014). Colonyarea: an Imagej plugin to automatically quantify colony formation in clonogenic assays. PLoS One 9, e92444. doi:10.1371/JOURNAL.PONE.0092444
Han, L., Wang, Y., and Sun, S. (2020). Curcumin inhibits proliferation of hepatocellular carcinoma cells through down regulation of DJ-1. Cancer Biomark. 29, 1–8. doi:10.3233/CBM-190427
Hassan, N. M., Alhossary, A. A., Mu, Y., and Kwoh, C. K. (2017). Protein-ligand blind docking using quickvina-w with inter-process spatio-temporal integration. Sci. Rep. 7, 15451. doi:10.1038/s41598-017-15571-7
Herrmann, A., Moss, D., and Sée, V. (2016). The chorioallantoic membrane of the chick embryo to assess tumor formation and metastasis. Methods Mol. Biol. 1464, 97–105. doi:10.1007/978-1-4939-3999-2_9
Jiang, Y., Fang, Y., Ye, Y., Xu, X., Wang, B., Gu, J., et al. (2019). Anti-cancer effects of 3, 3'-diindolylmethane on human hepatocellular carcinoma cells is enhanced by calcium ionophore: the role of cytosolic ca2+ and p38 mapK. Front. Pharmacol. 10, 1167. doi:10.3389/fphar.2019.01167
Jiao, D., Wang, J., Lu, W., Tang, X., Chen, J., Mou, H., et al. (2016). Curcumin inhibited HGF-induced EMT and angiogenesis through regulating c-Met dependent PI3K/Akt/mTOR signaling pathways in lung cancer. Mol. Ther. oncolytics 3, 16018. doi:10.1038/mto.2016.18
Joshi, P., Joshi, S., Semwal, D., Bisht, A., Paliwal, S., Dwivedi, J., et al. (2021). Curcumin: an insight into molecular pathways involved in anticancer activity. Mini Rev. Med. Chem. 21, 2420–2457. doi:10.2174/1389557521666210122153823
Khan, A., Alsahli, M. A., Aljasir, M. A., Maswadeh, H., Mobark, M. A., Azam, F., et al. (2022). Safety, stability, and therapeutic efficacy of long-circulating tq-incorporated liposomes: implication in the treatment of lung cancer. Pharmaceutics 14, 153. doi:10.3390/pharmaceutics14010153
Klingenberg, M., Becker, J., Eberth, S., Kube, D., and Wilting, J. (2014). The chick chorioallantoic membrane as an in vivo xenograft model for Burkitt lymphoma. BMC Cancer 14, 339. doi:10.1186/1471-2407-14-339
Koehn, F. E., and Carter, G. T. (2005). The evolving role of natural products in drug discovery. Nat. Rev. Drug Discov. 4, 206–220. doi:10.1038/nrd1657
Kuppusamy, P., Yusoff, M. M., Maniam, G. P., Ichwan, S. J., Soundharrajan, I., and Govindan, N. (2014). Nutraceuticals as potential therapeutic agents for colon cancer: a review. Acta Pharm. Sin. B 4, 173–181. doi:10.1016/j.apsb.2014.04.002
Lee, W.-H., Loo, C.-Y., Traini, D., and Young, P. M. (2020). Development and evaluation of paclitaxel and curcumin dry powder for inhalation lung cancer treatment. Pharmaceutics 13, 9. doi:10.3390/pharmaceutics13010009
Li, X., Ma, S., Yang, P., Sun, B., Zhang, Y., Sun, Y., et al. (2018). Anticancer effects of curcumin on nude mice bearing lung cancer A549 cell subsets SP and NSP cells. Oncol. Lett. 16, 6756–6762. doi:10.3892/ol.2018.9488
Li, Y., Li, S., Meng, X., Gan, R. Y., Zhang, J. J., and Li, H. B. (2017). Dietary natural products for prevention and treatment of breast cancer. Nutrients 9, 728. doi:10.3390/nu9070728
Liang, W. F., Gong, Y. X., Li, H. F., Sun, F. L., Li, W. L., Chen, D. Q., et al. (2021). Curcumin activates ros signaling to promote pyroptosis in hepatocellular carcinoma HepG2 cells. Vivo 35, 249–257. doi:10.21873/invivo.12253
Lin, L., Yan, L., Liu, Y., Qu, C., Ni, J., and Li, H. (2020). The burden and trends of primary liver cancer caused by specific etiologies from 1990 to 2017 at the global, regional, national, age, and sex level results from the global burden of disease study 2017. Liver Cancer 9, 563–582. doi:10.1159/000508568
Liu, F., Gao, S., Yang, Y., Zhao, X., Fan, Y., Ma, W., et al. (2017). Curcumin induced autophagy anticancer effects on human lung adenocarcinoma cell line A549. Oncol. Lett. 14, 2775–2782. doi:10.3892/ol.2017.6565
Molina, J. R., Yang, P., Cassivi, S. D., Schild, S. E., and Adjei, A. A. (2008). Non-small cell lung cancer: epidemiology, risk factors, treatment, and survivorship. Mayo Clin. Proc. 83, 584–594. doi:10.4065/83.5.584
Mousa, D. S., El-Far, A. H., Saddiq, A. A., Sudha, T., and Mousa, S. A. (2020). Nanoformulated bioactive compounds derived from different natural products combat pancreatic cancer cell proliferation. Int. J. Nanomedicine 15, 2259–2268. doi:10.2147/IJN.S238256
Munakarmi, S., Shrestha, J., Shin, H. B., Lee, G. H., and Jeong, Y. J. (2021). 3,3'-diindolylmethane suppresses the growth of hepatocellular carcinoma by regulating its invasion, migration, and er stress-mediated mitochondrial apoptosis. Cells 10, 1178. doi:10.3390/cells10051178
Ndreshkjana, B., Çapci, A., Klein, V., Chanvorachote, P., Muenzner, J. K., Huebner, K., et al. (2019). Combination of 5-fluorouracil and thymoquinone targets stem cell gene signature in colorectal cancer cells. Cell Death Dis. 10, 379. doi:10.1038/s41419-019-1611-4
Park, S. Y., Matte, A., Jung, Y., Ryu, J., Anand, W. B., Han, E. Y., et al. (2020). Pathologic angiogenesis in the bone marrow of humanized sickle cell mice is reversed by blood transfusion. Blood 135, 2071–2084. doi:10.1182/blood.2019002227
Saaristo, A., Karpanen, T., and Alitalo, K. (2000). Mechanisms of angiogenesis and their use in the inhibition of tumor growth and metastasis. Oncogene 19, 6122–6129. doi:10.1038/sj.onc.1203969
Samarghandian, S., Azimi-Nezhad, M., and Farkhondeh, T. (2019). Thymoquinone-induced antitumor and apoptosis in human lung adenocarcinoma cells. J. Cell. Physiol. 234, 10421–10431. doi:10.1002/jcp.27710
Shah, D., Gandhi, M., Kumar, A., Cruz-Martins, N., Sharma, R., and Nair, S. (2021). Current insights into epigenetics, noncoding RNA interactome and clinical pharmacokinetics of dietary polyphenols in cancer chemoprevention. Crit. Rev. Food Sci. Nutr. 26, 1–37. doi:10.1080/10408398.2021.1968786
Shanmugam, M. K., Ahn, K. S., Hsu, A., Woo, C. C., Yuan, Y., Tan, K. H. B., et al. (2018). Thymoquinone inhibits bone metastasis of breast cancer cells through abrogation of the CXCR4 signaling axis. Front. Pharmacol. 9, 1294. doi:10.3389/fphar.2018.01294
Sharma, R., and Martins, N. (2020). Telomeres, DNA damage and ageing: potential leads from ayurvedic rasayana (anti-ageing) drugs. J. Clin. Med. 9, 2544. doi:10.3390/jcm9082544
Sudha, T., El-Far, A. H., Mousa, D. S., and Mousa, S. A. (2020). Resveratrol and its nanoformulation attenuate growth and the angiogenesis of xenograft and orthotopic colon cancer models. Molecules 25, 1412. doi:10.3390/molecules25061412
Sung, H., Ferlay, J., Siegel, R. L., Laversanne, M., Soerjomataram, I., Jemal, A., et al. (2021). Global cancer statistics 2020: GLOBOCAN estimates of incidence and mortality worldwide for 36 cancers in 185 countries. Ca. Cancer J. Clin. 71, 209–249. doi:10.3322/caac.21660
Thai, A. A., Solomon, B. J., Sequist, L. V., Gainor, J. F., and Heist, R. S. (2021). Lung cancer. Lancet 398, 535–554. doi:10.1016/S0140-6736(21)00312-3
Tian, S., Liao, L., Zhou, Q., Huang, X., Zheng, P., Guo, Y., et al. (2021). Curcumin inhibits the growth of liver cancer by impairing myeloid-derived suppressor cells in murine tumor tissues. Oncol. Lett. 21, 286. doi:10.3892/ol.2021.12547
Upadhyay, P., Sarker, S., Ghosh, A., Gupta, P., Das, S., Ahir, M., et al. (2019). Transferrin-decorated thymoquinone-loaded PEG-PLGA nanoparticles exhibit anticarcinogenic effect in non-small cell lung carcinoma via the modulation of miR-34a and miR-16. Biomater. Sci. 7, 4325–4344. doi:10.1039/c9bm00912d
USDA Plants Database (2022a). Curcuma longa L. common turmeric. Available at: https://plants.sc.egov.usda.gov/home/plantProfile?symbol=CULO (Accessed June 8, 2022).
USDA Plants Database (2022b). Nigella sativa L. black cumin. Available at: https://plants.sc.egov.usda.gov/home/plantProfile?symbol=NISA2 (Accessed June 8, 2022).
Wang, F., He, Z., Dai, W., Li, Q., Liu, X., Zhang, Z., et al. (2015). The role of the vascular endothelial growth factor/vascular endothelial growth factor receptors axis mediated angiogenesis in curcumin-loaded nanostructured lipid carriers induced human HepG2 cells apoptosis. J. Cancer Res. Ther. 11, 597–605. doi:10.4103/0973-1482.159086
Wang, L., Han, L., Tao, Z., Zhu, Z., Han, L., Yang, Z., et al. (2018a). The curcumin derivative WZ35 activates ROS-dependent JNK to suppress hepatocellular carcinoma metastasis. Food Funct. 9, 2970–2978. doi:10.1039/C8FO00314A
Wang, N., Feng, T., Liu, X., and Liu, Q. (2020). Curcumin inhibits migration and invasion of non-small cell lung cancer cells through up-regulation of miR-206 and suppression of PI3K/AKT/mTOR signaling pathway. Acta Pharm. 70, 399–409. doi:10.2478/acph-2020-0029
Wang, W. H., Chen, J., Zhang, B. R., Lu, S. J., Wang, F., Peng, L., et al. (2018b). Curcumin inhibits proliferation and enhances apoptosis in A549 cells by downregulating lncRNA UCA1. Pharmazie 73, 402–407. doi:10.1691/PH.2018.8402
Wong, S. C., Kamarudin, M. N. A., and Naidu, R. (2021). Anticancer mechanism of curcumin on human glioblastoma. Nutrients 13, 950. doi:10.3390/nu13030950
Yang, J., Kuang, X. R., Lv, P. T., and Yan, X. X. (2015). Thymoquinone inhibits proliferation and invasion of human nonsmall-cell lung cancer cells via ERK pathway. Tumour Biol. 36, 259–269. doi:10.1007/s13277-014-2628-z
Yao, Q., Lin, M., Wang, Y., Lai, Y., Hu, J., Fu, T., et al. (2015). Curcumin induces the apoptosis of A549 cells via oxidative stress and MAPK signaling pathways. Int. J. Mol. Med. 36, 1118–1126. doi:10.3892/ijmm.2015.2327
Yoysungnoen, P., Wirachwong, P., Bhattarakosol, P., Niimi, H., and Patumraj, S. (2006). Effects of curcumin on tumor angiogenesis and biomarkers, COX-2 and VEGF, in hepatocellular carcinoma cell-implanted nude mice. Clin. Hemorheol. Microcirc. 34, 109–115.
Yoysungnoen, P., Wirachwong, P., Changtam, C., Suksamrarn, A., and Patumraj, S. (2008). Anti-cancer and anti-angiogenic effects of curcumin and tetrahydrocurcumin on implanted hepatocellular carcinoma in nude mice. World J. Gastroenterol. 14, 2003–2009. doi:10.3748/WJG.14.2003
Zhang, W. W., Feng, Z., and Narod, S. A. (2014). Multiple therapeutic and preventive effects of 3, 3'-diindolylmethane on cancers including prostate cancer and high grade prostatic intraepithelial neoplasia. J. Biomed. Res. 28, 339–348. doi:10.7555/JBR.28.20140008
Keywords: curcumin, thymoquinone, 3,3′-diindolylmethane, combination, apoptosis, cell migration, tumor growth, tumor angiogenesis
Citation: Saddiq AA, El-Far AH, Mohamed Abdullah SA, Godugu K, Almaghrabi OA and Mousa SA (2022) Curcumin, thymoquinone, and 3, 3′-diindolylmethane combinations attenuate lung and liver cancers progression. Front. Pharmacol. 13:936996. doi: 10.3389/fphar.2022.936996
Received: 05 May 2022; Accepted: 14 June 2022;
Published: 29 June 2022.
Edited by:
Abhay Prakash Mishra, University of the Free State, South AfricaReviewed by:
Puranjan Mishra, Hong Kong Baptist University, Hong Kong SAR, ChinaDevinder Dhawan, Panjab University, India
Dietrich Busselberg, Weill Cornell Medicine- Qatar, Qatar
Rohit Sharma, Banaras Hindu University, India
Copyright © 2022 Saddiq, El-Far, Mohamed Abdullah, Godugu, Almaghrabi and Mousa. This is an open-access article distributed under the terms of the Creative Commons Attribution License (CC BY). The use, distribution or reproduction in other forums is permitted, provided the original author(s) and the copyright owner(s) are credited and that the original publication in this journal is cited, in accordance with accepted academic practice. No use, distribution or reproduction is permitted which does not comply with these terms.
*Correspondence: Ali H. El-Far, ali.elfar@damanhour.edu.eg
†These authors have contributed equally to this work