
Unveiling the Defect Structure of Lithium Niobate with Nuclear Methods


Centro de Ciências e Tecnologias Nucleares, Instituto Superior Técnico, Universidade de Lisboa, Estrada Nacional 10, km 139.7, P-2695-066 Bobadela, Portugal
*
Author to whom correspondence should be addressed.
Crystals 2021, 11(5), 501; https://doi.org/10.3390/cryst11050501
Submission received: 31 March 2021
/
Revised: 19 April 2021
/
Accepted: 21 April 2021
/
Published: 2 May 2021
(This article belongs to the Special Issue New Trends in Lithium Niobate: From Bulk to Nanocrystals)
Abstract
:X-ray and neutron diffraction studies succeeded in the 1960s to determine the principal structural properties of congruent lithium niobate. However, the nature of the intrinsic defects related to the non-stoichiometry of this material remained an object of controversial discussion. In addition, the incorporation mechanism for dopants in the crystal lattice, showing a solubility range from about 0.1 mol% for rare earths to 9 mol% for some elements (e.g., Ti and Mg), stayed unresolved. Various different models for the formation of these defect structures were developed and required experimental verification. In this paper, we review the outstanding role of nuclear physics based methods in the process of unveiling the kind of intrinsic defects formed in congruent lithium niobate and the rules governing the incorporation of dopants. Complementary results in the isostructural compound lithium tantalate are reviewed for the case of the ferroelectric-paraelectric phase transition. We focus especially on the use of ion beam analysis under channeling conditions for the direct determination of dopant lattice sites and intrinsic defects and on Perturbed Angular Correlation measurements probing the local environment of dopants in the host lattice yielding independent and complementary information.
1. Introduction
Present opto-electronic and future quantum-process based communication technologies rely strongly on optical materials with their inherent or artificially modified properties. Lithium niobate (LiNbO3, henceforth abbreviated LN) is one of the materials that has drawn most attention in this process. Its excellent linear and non-linear optical properties, facility to form waveguide using a variety of methods, ability to incorporate optically active dopants and the applications based on periodically poled crystals make it a favorite target for basic and applied research [1,2,3,4].
In order to achieve the modification of its properties with a certain goal in mind, the basic properties of LN have to be understood. Among them, the intrinsic defect structure of the congruent lithium-deficient crystals in comparison to stoichiometric ones, phenomena related with the phase ferroelectric-paraelectric phase transition, incorporation of dopants and their interaction with the lattice and lattice damage production and removal are topics for fundamental research fostering future application directed research.
Methods based on nuclear techniques played and will play an important role in materials research. Their application can clarify or—in combination with other methods—assist to clarify the topics mentioned in the preceding paragraph. While ion beam analysis methods are ideal for research on composition as well as lattice defect concentration and distribution, hyperfine interaction methods can yield complementary information on local environments in the lattice and dopant charge states. As will be demonstrated in the course of this review the combination of several of these techniques can unveil the nature of defects in LN. For illustration, Figure 1 shows a “periodic table of elements” for which nuclear techniques have been applied in the case of LN.
2. Short Overview on Nuclear Methods for Materials Research
The nuclear techniques addressed in this review are characterized shortly indicating some peculiarities with regard to their application in research on LN. References to general introductory books and reviews for further in depth study are supplied for each of the methods.
2.1. Ion Beam Analysis
Ion beam analysis is a group of nuclear methods that are based on the interaction of energetic ion beams (typically few keV to tens of MeV) with materials [5,6,7,8]. Its main applications are:
- Composition determination in bulk materials, surface layers and multilayer systems. Some of the methods attain a depth resolution down to sub-monolayer range;
- Detection and quantitation of lattice damage in monocrystalline materials with high depth resolution up to a few μm from the surface;
- Characterization of intrinsic and extrinsic defects in terms of lattice site location and defect type.
The basic ion beam analysis methods applied in LN are Rutherford Backscattering Spectrometry (RBS) and Resonant Elastic Scattering (RES) [9], Nuclear Reaction Analysis (NRA) [10], Particle Induced X-ray Emission (PIXE) [11], Channeling (C) [12,13], Secondary Ion Mass Spectroscopy (SIMS) [14], Elastic Recoil Detection (ERD) and Heavy Ion Elastic Recoil Detection (HIERD) [15,16].
RBS relies on elastic backscattering of the incoming ions by the target atoms. Its origins can be traced back to the 1909 experiments performed by Geiger and Marsden [17] which led to the first modern model of the atom. The energy spectra of backscattered light ions (protons, He+ and He++) in the MeV range provide information on the composition of the material and its depth dependence up to several μm into the bulk. Since the backscattering yield is proportional to the square of the target atomic number, this method works best for targets composed of heavy elements. Therefore, lighter elements in heavy matrices are often difficult or only indirectly determinable while the method excels in the detection of small quantities of heavy elements in light targets. Further, the difference in the maximum backscattering energy decreases rapidly with increasing target atom mass making it difficult to discern elements that are neighbors in the periodic table. In order to overcome the restrictions for light elements, resonant elastic scattering, i.e., deviations from the Rutherford cross section, are employed to improve the sensitivity for their detection. This technique is known as Resonant Elastics Scattering or Elastic Backscattering Spectrometry (EBS). Analysis of RBS and RES spectra is done with dedicated software, e.g., RUMP [18] and NDF [19]. As an example, Figure 2 shows a backscattering spectrum for congruent LN irradiated with 3.1 MeV He+ demonstrating Nb-RBS and O-RES while Li remains invisible.
Another possibility for the detection and quantification of light elements in heavy matrices is to look for the light charged nuclei produced by ion beam induced reactions in the target material, within the so called NRA technique. Long measuring times are frequently necessary, since the reaction cross sections are typically much smaller than for backscattering. The analysis of the spectra is analogous to that of RBS and EBS. As an example, Figure 3 depicts a spectrum for LN irradiated with 1.75 MeV protons. Contributions of backscattering by the target and by the alpha particles produced in the 7Li(p,α)4He reaction are clearly distinguishable due to the high Q-value (17.35 MeV) of the reaction employed.
The PIXE technique relies on the production of characteristic X-rays (mainly K- and L-lines) by interaction of the incoming ion (in most cases protons, for special purposes He+) with inner shell electrons of the target atoms. It is most useful for the detection of medium and heavy elements in compound materials. The quantitative analysis of the elemental concentrations is significantly more complicated than in the previous cases since the technique integrates over the whole ion path in the material. This lack of depth resolution can be partially overcome by measuring the sample at different angles of incidence. Figure 4 shows an example of an X-ray energy spectrum for LN irradiated with 3.1 MeV He+ ions.
Ions incident along major crystallographic directions (axes or planes) of monocrystalline materials show the channeling effect. Along a crystallographic axis or plane, the atoms of the crystal atoms appear perfectly aligned in strings or plates, respectively. These form, due to their repellent Coulomb potential, a “channel” in which the ions are guided and the ion fluence is concentrated in the center of the channel. Due to this guiding effect the probability for close encounters with lattice atoms are reduced diminishing the yield for ion scattering, nuclear reactions and X-ray emission.
In a typical channeling experiment the yield of backscattered ions, nuclear reactions products or characteristic X-rays is measured tilting the crystal stepwise from a major crystallographic direction to one of random ion beam incidence (in which the atomic arrangement appears disordered). These “scans” are essentially characterized by two parameters, depicted in Figure 5:
- The minimum yield, χmin, i.e., the ratio of the reaction yield at perfect alignment with a crystallographic direction to that at random incidence. The lower χmin the better is the crystalline quality of the sample.
- The half-width of the scan, ψ1/2, that is larger the less defective the material is.
Possible applications of the channeling effect are [20]:
- Determination of intrinsic lattice defect concentration (typically, genuine defects of the material or radiation induced defects) with high depth resolution. For the analysis, spectra are taken for the undamaged and the damaged sample aligned with a major crystallographic axis and for a random ion incidence angle. From their comparison a depth-resolved defect profile can be derived using appropriate calculation methods or programs, e.g., DICADA [21];
- Determination of intrinsic lattice defect type. Spectra are recorded in the same manner as in the item above but for different ion energies yielding a dependence of the minimum yield difference on Eκ, where E is the ion energy. Determining the constant κ allows to distinguish e.g., between point defects, dislocations, inclusions, etc.
- Lattice location of dopants in the crystal. While an angular scan for a dopant located on a regular lattice site of the crystal will follow that one of the host atoms, foreign atoms on interstitial sites will show scans with distinctly different shapes, depending on their relative position in the channel (e.g., a peak instead of a dip if located in the center). Measurements for different crystallographic directions allow to determine the lattice site by triangulation.
The channeling method was initially developed for the study of simple mono- or bi-elemental cubic crystals. Therefore, an extension to materials as complex as LN was not straightforward and it was only attempted in the 1980s. In contrast to simple materials, in most axial directions of LN the channels are highly asymmetric or split in several subchannels. In all cases they are dominated by the heaviest constituent (Nb). Figure 6 shows the projections of five important axial and a planar directions in LN indicating the regular and some interstitial lattice sites together with the respective calculated continuum potentials governing the channels.
The evaluation of the effect of a dopant on a non-Nb site—regular or interstitial—by simple reasoning can lead to serious errors. Therefore, the use of simulation software is mandatory for the lattice site determination of intrinsic and extrinsic defects in LN. Results presented and discussed in this review are based on two channeling simulation programs. FLUX [22,23] is a long-known code for RBS/C and NRA/C in cubic crystals that has been adapted to the trigonal LN lattice. CASSIS [24,25,26,27] is a multi-purpose code, i.e., it is applicable for all Bravais lattices and can also deal realistically with PIXE/C and high dopant concentrations. Figure 7 shows results of CASSIS for two-dimensional RBS/C calculations for the y-axis.
The SIMS method uses low energy heavy ions (mostly Ar+) to remove and ionize surface atoms by sputtering and analyzes these secondary ions using a mass spectrometer. This allows determining the composition of materials with very good depth resolution. The sensitivity of the method—ranging from ppm to ppb depending on the material—is its main advantage. However, this method is destructive, in contrast to those mentioned above.
ERD uses typically He-ions with MeV energies to remove hydrogen from a sample surface. An absorber foil in front of the detection stops the backscattered He-ions and allows pass only the protons for analysis. In contrast, HIERD uses heavy ions with specific energy of several MeV/amu in order to sputter even heavy atoms from the surface. Various methods exist for the detection and analysis of the secondary ions emitted.
For better readability, technical details on the ion beam analysis such as ion species, charge state, current, detector geometry, installation used and provenience of samples are mostly omitted in this review. However, the information can always be recovered from the cited works.
2.2. Hyperfine Interaction Methods
Hyperfine interaction methods such as Perturbed Angular Correlations (PAC), Mössbauer Effect (ME), Nuclear Magnetic Resonance (NMR) and Nuclear Quadrupole Resonance (NQR) are based on the interaction of a nucleus with an electric (or magnetic) field produced in a solid by the electrons and other nuclei near the nucleus. In several cases, techniques from the ion beam analysis and hyperfine interaction groups are used to study the same samples, obtaining complementary information and enlarging significantly the range of sensitivity for characterization of defects [28].
The PAC probe is an unstable nucleus decaying through a γ-γ cascade that has an intermediate state with suitable half-life and nuclear quadrupole moment (or dipole moment, in case one is interested in magnetic interactions). Conversion electrons from one of the transitions of the γ-γ cascade can also be used [29]. In the case of Hf-doped LN, the PAC probe is usually produced by the neutron capture reaction 180Hf(n,γ)181Hf on natural Hf introduced in the samples during growth as HfO2. A typical activity of ≈15 µCi is obtained after reactor irradiation. Although thermal neutrons are the most important in the reactor irradiation, the LN crystal is also irradiated with fast neutrons, at a fluence 1–2 orders of magnitude smaller than the thermal flux [30] and these higher energy neutrons produce defects distinct from the ones produced by the thermal neutrons. Annealing in air at 700 °C is enough to restore the lattice completely [31]. The 111In probe was implanted to a typical fluence of ≈1013 cm−2 from which more than 90% were due to an unavoidable stable Cd contamination, resulting in a typical activity of 50 µCi. The crystals were annealed at temperatures in the 700–900 °C range under flowing wet oxygen to remove the defects introduced by ion implantation. PAC measurements were made using standard spectrometers with four BaF2 detectors in a plane at 90° intervals for γ-γ PAC or two BaF2 detectors with two magnetic lenses in a plane at 90° intervals for e--γ PAC [29].
Equation (1) is used to calculate the time differential anisotropy R(t) from the coincidence spectra N(θ,t), where θ is the angle between detectors and t is the time delay between events.
G22(t) is the perturbation function which describes the modulation of the angular correlation and A22 is a parameter which depends on the nature of the radiations of the cascade [32]. For a cascade having an intermediate state with spin I = 5/2, such as the ones from the decay of 111In and 181Hf, three frequencies ωn = Cn(η)νQ are observed, corresponding to:
The quadrupole interaction frequency (QIF), νQ = eQVzz/h, and the asymmetry parameter η = (Vxx − Vyy)/Vzz, which can be deduced from the frequency factors Cn(η), contain information about the magnitude of the principal component Vzz and the asymmetry of the EFG, respectively. The exponential factor allows for a Lorentzian distribution of EFGs around a mean value. Such a distribution can be caused, e.g., by different lattice defects in the vicinity of the probe atoms. The S2n coefficients, which give the amplitudes for each frequency, can be calculated for polycrystalline as well as single crystalline samples. If fractions fi of the total number of radioactive probes are in different but unique sites experiencing different EFGs the observed spectra is described by a sum over several perturbation functions, , with the sum of the fi normalized to unity.
Figure 8 shows the PAC coincidence count rates N(θ,t) obtained with detectors at angles of θ = 90° and θ = 180° and the corresponding spectrum obtained in near-stoichiometric LN (doped with 4.6 wt % K2O) implanted with 111In. The coincidence count rates N(θ,t) show the half-life of the intermediate state of the γ-γ cascade from the decay of 111In (T1/2 = 80 ns) with the perturbation resulting from the interaction of the quadrupole moment of the intermediate state of the cascade and the EFG produced by the surrounding electric charges. The anisotropy ratio R(t) (usually designated “PAC spectrum”) calculated according to eq. 1 extracts the perturbation, exploiting the difference between minima and maxima in the experimental count rates at 90° and 180°.
Details on the other hyperfine interaction techniques can be found, e.g., in references [8,32]. In general one can extract information on the principal component Vzz and on the asymmetry of the EFG, although the observable frequencies are dependent on the particular nuclear method and on the nuclear properties of the probe nucleus. One must emphasize that the knowledge of the EFG is not yet enough for a direct assignment of the probe to a given lattice site. Although much progress has been made in the calculation of EFG [33] this is still time-consuming and far from generalized. Nevertheless, one can compare EFG values obtained with different probes in LN [34].
3. Investigation of Intrinsic Defects
3.1. Congruent Versus Stoichiometric Lithium Niobate
Already in the first growth studies it was noted that LN does not melt congruently with the first phase diagram published by Reisman and Holtzberg [35] in 1958. This non-stoichiometry implies and intrinsic defect structure and influences strongly many material properties which triggered intense research activities on the nature of the defects and the production of stoichiometric material.
Initial NMR measurements with 7Li and 93Nb in LN and lithium tantalate (LiTaO3, henceforth abbreviated LT) were reported in the late 1960s [36,37,38,39]. Measurements were performed with the then available magnetic fields below 1 T [40]. These measurements were characterized by wide resonance lines, whose width could be empirically related to the material’s departure from stoichiometry. Measurements with NQR [41,42] and ME [43] have also shown broader than expected interaction lines in LN. Later, Peterson et al. [44] found a second 93Nb NMR signal in congruent LN crystals, with a near zero QIF and an intensity of approximately 6% of the total Nb signal that was assigned to Nb in Li sites (5.9%) thus providing a strong support to the Nb vacancy model, even if the authors assumed later that the interpretation of their NMR spectra was not so straightforward [45]. More recent measurements by Blümel et al. [40] using a higher magnetic field of ≈7 T did not confirm a second 93Nb signal with such high intensity, thus favoring instead the Li vacancy model. A series of experimental studies complemented with simulations assuming O-, Li- or Nb-vacancies (but unfortunately omitting models based on ilmenite stacking faults) was published by Yatsenko et al. [46,47,48], favoring the formation of Li-vacancies in the vicinity of Nb located on regular Li sites.
Rebouta et al. [49] reported RBS/C and 181Hf PAC measurements in LN doped with 1 mol% HfO2 in the melt. The RBS/C measurements unambiguously determined that Hf replaced Li, but the obtained PAC spectra could only be fitted considering two QIF around 1200 MHz. Two frequencies of the same magnitude were also observed in 181Hf PAC measurements done in polycrystalline LN samples [50]. These QIF were later detailed as νQ1 = 1154(12) MHz and νQ2 = 1213(12) MHz, with asymmetry parameters in the 0.2–0.3 range, from new measurements in single-crystals [34]. NMR studies [51,52] confirm an asymmetry parameter of 0.2 for congruent material. The observed frequency doublet was unexpected, as Hf was found only replacing Li and a single QIF should suffice. Significant progress was made when higher precision PAC measurements were performed using the 111In probe, also replacing Li in congruent LN crystals [53]. Again, the new spectra could not be described by a single frequency even if considering an asymmetric EFG or a broad frequency distribution, both already indicative of crystal imperfections [54]. The frequency doublet now found was νQ1 = 192(2) MHz and νQ2 = 205(2) MHz, with asymmetry parameters in the 0.1–0.2 range. Since the frequencies were again very close, the simplest explanation is that the probes were in slightly different Li sites, one of them possibly linked to a defect located in the Li-octahedron. Since the fraction of PAC probe atoms located at this additional site is significant (about one third) it should be energetically favorable for the inclusion of atoms causing a charge excess relative to Li. It is therefore unlikely that this defect is identical to a Li-position distorted by a nearby excess Nb atom, since the occupation of such a site by a dopant with a higher charge state than Li would increase further the local charge imbalance. A far more reasonable assumption is to identify this defect with a site, shifted form the regular lithium site that actually incorporates the excess Nb (or dopants) in congruent material. The broadening of quadrupole interaction lines seen by other techniques is also compatible with the existence of two nearby frequencies that cannot be resolved.
Growth procedures developed in the 1990s [55,56,57,58] made available high-quality crystals with stoichiometric composition, allowing a direct comparison of the two compositions.
The possible impacts of the Li- and the Nb-vacancy models on axial and planar channeling can be easily estimated qualitatively from the channel projections presented above. Eventually existing vacancies on regular Nb-sites should have only small effects on the Nb-channeling since even in the case of 5.9 mol% vacancies the steering effect is hardly diminished. On the other hand, anti-site Nb-atoms located on regular Li-sites should lower the minimum yields for Li-NRA measurements for congruent material in axial directions clearly since the channeling effect on the Li-rows is enhanced by the Nb. For a 1.2% fraction the average atomic number of the row increases from 3 (stoichiometric) to 3.5 (Nb-vacancy model). For planar channeling in the (0001)-direction Li-NRA-scans should show clear peaks in the aligned direction; but for the congruent case, it should be lower and narrower than for the stoichiometric.
Measurements with congruent and near-stoichiometric LN, grown with 4.6 wt % K2O in the melt ([Li]/[Nb] = 0.979 [59]), reported by Kling et al. [60,61] showed contrary effects. NRA/C using the 7Li(p,α)4He nuclear reaction and RBS/C scans were performed simultaneously in order to study differences in Li- and Nb-sublattice between the two crystals. Several crystallographic axes and planes were investigated, as shown in Figure 9. The Li-NRA data corresponding to the (0001) plane, perpendicular to the c-axis, were particularly interesting. They showed a prominent flux peak that is considerably broadened in the congruent crystal in comparison to the near-stoichiometric one. The NRA-Li broadening suggests either a disordered Li sublattice or several well-defined defect sites for the Li ions. For the -axis, in which Li is located in the center of the channel, the minimum yield for Li-NRA/C drops drastically ruling out the possibility of simple NbLi antisites, i.e., the Li- and the Nb-vacancy model [60] Besides the stronger reduction of the 7Li(p,α)4He reaction yield at the surface the spectra for the stoichiometric extend also to higher depth indicating a reduced stopping power due to a diminished number of lattice defects in the channel compared to congruent material [61].
Further, a strong broadening of Nb-RBS/C in the -axis of the near-stoichiometric sample has been observed indicating an improvement of the Nb-sublattice structural ordering with regard to the congruent case [60]. These observations indicate that the excess Nb cannot be located in regular Li lattice sites, favoring the ilmenite stacking fault model but not ruling out the formation of small non-crystalline or Li-deficient (e.g., ilmenite-type LN or monoclinic lithium LiNb3O8) regions in the material and on the other extreme, point defects with inversed cation occupation.
This point can be clarified by studying the Nb sublattice measuring the energy dependence of axial dechanneling induced by defects along several crystallographic directions. The difference in the minimum yields between near-stoichiometric and congruent, ΔXmin, at a fixed depth interval yields information about the type and size of defects in a non-perfect crystal [62]. The observed values for κ range between 0.69 to 0.78 falls between the values for true point defects (κ = 1) and extended defect clusters (κ = 0.5) which indicates defects should have a size in the order of nanometers (as expected for local stacking fault sequences). However, a small admixture of true point defects cannot be excluded. In addition, the possibility that microcrystals of ilmenite-type or LiNb3O8 (κ = 0) or dislocations (κ= −0.5) exist can be rejected.
A comparison was also made with PAC. Figure 10 shows PAC spectra obtained with the 111In probe in the same near-stoichiometric crystal grown with 4.6 wt % K2O after implantation and annealing [63], compared with a spectrum previously obtained in a congruent crystal [53]. It is clear that the spectrum with the highest attenuation is the one obtained in the congruent crystal. The spectrum obtained in the near-stoichiometric crystal is described by a single QIF, νQ = 191(2) MHz, i.e., only one of the two QIF previously found, and with a zero asymmetry parameter. It can also be seen that the pattern from the congruent crystal is not in phase with the one from the near-stoichiometric crystal, with the maxima in the congruent crystal occurring progressively a few nanoseconds after the corresponding ones for the stoichiometric crystal, due to the modulation imposed by the frequency doublet, which is also responsible for a higher attenuation. As the QIF have almost identical values, the PAC measurements suggest the existence of two non-equivalent Li sites in congruent crystals and only one Li site in stoichiometric material. No conclusions can be drawn on the Nb sublattice from these measurements, as 111In replaces Li only [53].
The joint analysis of the NRA and PAC data thus suggest the existence of two distinct Li sites in a congruent crystal, while only one of them remains in a stoichiometric crystal. Natural candidates for such defects are stacking faults. Several models have been proposed for LN in the literature. Both the Li and the Nb vacancy models include Nb on Li sites and thus a sequence of three Nb consecutive atoms along the c-axis would be created. Nassau et al. [64] proposed different stacking sequences in order to avoid such improbable arrangements and Smyth [65,66] proposed short stacking sequences with the ilmenite structure, which were later found energetically plausible [67]. The stacking sequence along the c-axis of ilmenite-like LN would be Nb, Li, V, Li, Nb, …, where V denotes the intrinsic vacancy. Since these inverse stacking sequences accommodate no Nb excess themselves they have to accompanied by Li vacancies. The “inverted” Li site in the ilmenite sequence is generally assumed to be one of this vacancies leading to the “complex defect” model. This defect structure can be regarded as a Li-vacancy model in which the Nb is shifted from the regular Li-site and the inconvenient stacking of three consecutive Nb atoms along the c-axis is avoided. Further, it furnishes a straightforward explanation for the occurrence of the second electric field gradient in the Li-octahedron observed in hyperfine interaction measurements. Figure 11 compares the regular LN stacking with other sequences, including short ilmenite stacking sequences and the “complex defect”.
The channel projections of the lattice sites corresponding to the “inverted” Li and Nb-sites in ilmenite stacking faults are plotted in Figure 12. The Nb on inverted locations shows up close but shifted from the regular Li sites and therefore should induce dechanneling near the Li-rows instead of an enhancement of the channeling effect for regular Li-site occupation. This effect is expected to be most visible in the case of the -axis and the (0001)-plane where these sites are located close to center of the channel.
These results can be related to the lattice structure looking at the interaction potential in the (0001) plane seen by the incoming ions, shown in Figure 13, which was calculated using Molière’s approximation to the Thomas–Fermi potential under the assumption of a static lattice [68]. Two pronounced minima are visible, showing the existence of two channels for the incoming ions, separated by a potential barrier associated to O ions. One of those minima, designated as Li-I, corresponds to the regular Li position, whereas the other one, named as Li-II, lies close to a regular Nb location. It could be considered as a Li that substitutes for an Nb and then shifts towards the nearest oxygen plane up to a position symmetrical to that of Li. The existence of those defective Li sites is a key result that provides a confirmation of theoretical analyses [67] proposing the occurrence of inverted Li-Nb sequences as they appear in the related ilmenite structure.
Taking as a basis this local ilmenite structure, the broadened flux peak in the NRA/channeling spectra has been simulated using the CASSIS code. The peak shape and particularly the broadening of the Li-NRA signal is reasonably well explained. The best fit is obtained assuming 2% of dispersed ilmenite stacking faults, Li—Nb—Nb—Li. On the contrary, other models exclusively involving Nb antisites and cation vacancies cannot account for this key experimental feature, as shown in Figure 14.
The energy dependence of the axial dechanneling reported in [60] has also been simulated using CASSIS. Figure 15 shows a comparison of the experimentally observed energy dependence of the minimum yield Xmin in several axes for protons together with CASSIS simulations for (a) a defect free stoichiometric crystal; (b) congruent crystal containing 5.9 and 1.2% Nb antisites and (c) congruent cristal containing 2.0% ilmenite stacking inversions with and without 1.2% Nb antisites, from Kling at al. [26]. The best fit to the Nb data is obtained when the ilmenite stacking inversions with 1.2% Nb antisites, i.e., within the Li vacancy model.
The crystal structures of LiNbO3, perovskite and ilmenite are interrelated and some transitions between them are possible [69,70]. The ilmenite form of LN has been synthetized by ion-exchange from the ilmenite form of sodium niobate, NaNbO3 [71,72,73]. This LN form transforms back to the regular structure above 900 K. The estimated enthalpy difference between the two LN forms [73] is in good agreement with the calculated difference of 0.1 eV in their lattice energies [67].
The channeling studies on near-stoichiometric LN clearly indicate the absence of any intrinsic disorder—including the occurrence of ilmenite stacking faults—suggesting that in this case the small energy difference is sufficient to suppress their existence. However, LN has a strong tendency to grow non-stoichiometric with the congruent melt showing an excess of Nb. The resulting need for an intrinsic defect structure may locally outbalance the extra energy needed for the formation of ilmenite-type stacking to accommodate the excess Nb and the Li vacancies leaving the “stoichiometric” remainder of the crystal virtually defect-free. This arrangement may result in a global energy minimum for the congruent material.
The current knowledge on the properties of ilmenite-like LN is still limited. Wiegel et al. [74] have reported the UV optical absorption edge in ilmenite-like LN moved towards longer wavelengths when compared to a congruent crystal. For comparison purposes, the UV absorption edge of LN moves towards shorter wavelengths when approaching stoichiometric composition [75]. Baran et al. [76] have reported a very strong Raman scattering peak at about 735 cm−1 for ilmenite-like LN. Kong et al. [77] have reported a weak peak at 738 cm−1 in congruent LN that is absent in near-stoichiometric crystals, in congruent crystals doped with MgO above 2 mol%, and in congruent crystals doped with 2.5 mol% TiO2 and suggested that it comes from an ilmenite-like stacking defect in nonstoichiometric LN. Lengyel et al. [78] confirmed the initial decrease of the intensity of a band at around 740 cm−1 with MgO doping, but have seen this band reappear for heavily doped crystals.
3.2. Ferroelectric to Paraelectric Phase Transition
The high-temperature phase of LN, above TC ≈ 1470 K for material with the congruent composition [79], is paraelectric and belongs to space group . For LT, the transition temperature is significantly lower, TC ≈ 878 K [80]. In this phase, Nb (or Ta) a moves along the c-axis to the center of the octahedral oxygen cages, while for Li two models were proposed in the literature [81]. In the displacive model, Li moves into a triangularly coordinated site within the oxygen layer below the former Li site [82], while in the order-disorder model, the Li atoms are randomly distributed on both sides of the oxygen plane [83,84], as depicted in Figure 16.
There is no agreement among the theoretical calculations on the phase transition. The calculations of Inbar et al. [85] suggest order-disorder features for the oxygen atoms, while the Li atoms are passive players. More recent molecular dynamics calculations of Phillpot at al. [86] and Sanna et al. [87] suggest that the phase transition presents displacive features for Nb/Ta and order-disorder features for Li. In contrast, the theoretical calculations of Toyoura et al. [88] suggest order-disorder features for both Li and Nb/Ta.
There are few measurements of the temperature dependence of the nuclear quadrupole interaction at the Nb/Ta site in LN and LT. Schempp et al. [41] reported 181Ta NQR measurements in polycrystalline near-stoichiometric LN in a reduced temperature range from 21 to 515 K, where a continuous decrease of the EFG was observed. Moreover, the linewidths of the signal from near-stoichiometric samples were markedly narrower than the ones from Li-deficient material and became narrower with the increase in temperature. Figure 17 plots 181Ta NQR and 181Ta ME results in polycrystalline LT reported by Zhukov et al. [89] and by Löhnert et al. [90], respectively. The variation of the EFG derived from the NQR and ME measurements shows a continuous decrease with temperature in an extended temperature range which includes TC. This variation can be essentially reproduced using the point-charge model of De Wette et al. [91], taking into account thermal lattice expansion and atom displacement [90], using data from Abrahams et al. [83]. As thermal lattice expansion alone would make the EFG increase moderately with temperature, the main contribution to the EFG comes from the displacement of the atoms. More advanced ab initio cluster calculations of Shelyapina et al. [92] reproduced the essential features of the EFG temperature dependence up to TC.
The temperature dependence of the nuclear quadrupole interaction at the Li site was measured using NMR, MS and PAC methods in LN and LT. 7Li NMR measurements in single-crystalline LN were reported by Halstead [39] below TC, up to ≈950 K. A linear increase of the QIF was observed in this temperature range. The NMR signal had broad lines at low temperature, which became narrower with the increase in temperature, especially after ≈800 K. 7Li NMR measurements in polycrystalline LT were reported by Slotfeldt-Ellingsen et al. [93,94], below and above TC. A linear increase of the QIF was observed until close to TC and then a decrease. PAC measurements in polycrystalline LN and LT doped with 181Hf were reported by Catchen et al. [50,95]. They observed extensive line broadening at temperatures well below TC and significantly less line broadening above TC. The anisotropy coefficient was non-zero below TC and dropped to zero above TC. This result was not expected, because the axial symmetry at the Li site implies that η should vanish at temperatures both below and above TC. A second QIF was reported in the measurements above TC, with a value about an order of magnitude lower than the one of Hf probes in Li sites, which was tentatively attributed to Hf probes in Nb/Ta sites [95]. Moreover, in the case of a previous MS study in Fe doped LN, a second QIF was found at high temperature, but no more details were given [96]. Marques et al. [97] reported high precision PAC measurements in single-crystalline LT implanted with 111In. While at RT two nearby QIF were found, νQ1 = 230(2) MHz and νQ2 = 242(2) MHz, with nonzero asymmetry parameters, above TC only one QIF and η = 0 was found. The observation of two nearby QIF is consistent with the previous measurements of Hauer et al. [53] in congruent LN and with the extensive line broadening reported in other studies well below TC. Ohkubo et al. [98] reported PAC measurements in polycrystalline LT with the 111mCd and 117Cd probes. Figure 18 shows the temperature dependence of the QIF for the measurements in LT.
The temperature dependence of the QIF doublet reported by Marques et al. [97] is shown in Figure 19. The temperature dependence of νQ1 is close to the observed with 7Li in LT [93], as expected since the 111In probe atoms replace Li. The same is applicable for the 181Hf, 117Cd and 111mCd probes which also replace Li. In contrast, νQ2 that is associated to probes in Li-II sites, shows only a very weak temperature dependence. Close to and above TC, the derived νQ1 and νQ2 values are no longer distinguishable. This suggests that the differences between the Li-I and Li-II sites vanish in the high-temperature paraelectric phase.
Point-charge model EFG calculations reproduce the observed linear increase of νQ1 up to TC taking into account thermal lattice expansion only [97]. If the corresponding Li/O displacements of Abrahams et al. [83] are taken into account, then the EFG would be too large by a factor of two close to TC. The main contribution to the EFG at a Li site comes from the six surrounding O atoms, distributed in two planes, with Li–O distances of 2.08 Å and 2.29 Å at room temperature. At 940 K these distances are 2.05 Å and 2.51 Å [83], which results in a significantly increased EFG. To explain the observed decrease above TC it is necessary to decrease the difference between the two Li–O distances. Inbar and Cohen [85] proposed that the driving mechanism for the phase transition in LT is a displacement of the O atoms towards the Ta atoms. Since a displacement of the O only along the c-axis would result in too short Ta–O distances, they further proposed that the O atoms move also in the plane perpendicular to the c-axis, toward Li and lead to a coupled Li–O motion. EFG calculations using the above-mentioned point charge model show that such a Li–O coupled movement explains qualitatively the decrease of the EFG above TC [97].
3.3. Ion Implantation Induced Defects
Ion implantation matured to a standard technique for defect engineering and doping of all kinds of materials. In the case of LN the main applications that will be discussed in their respective section are the formation of optical waveguides (Section 5.3) as well as the introduction of optical active (Section 4.3) and insoluble dopants (Section 4.5). This section is dedicated solely to investigation of basic effects of ion implantation leading to the production of intrinsic defects and their removal by annealing.
The production of defects occurs in two ways: (i) by collisions of the incoming ion with a lattice atom that cause its displacement from the lattice site, eventually initiating a collision cascade (nuclear damage); (ii) by excitation of electrons in the material which, in the case of swift heavy ions, can cause the formation of amorphization tracks on the nanometer scale (electronic damage). Since the nuclear damage is mainly occurring at the end of the ion track, it is the dominating damage producer at low energy irradiation. On the other hand, the electronic damage dominates in swift ion irradiations on the major part of the trajectory. In both cases, increasing fluence causes the defects to accumulate until full amorphization of the material is achieved. Defects cause dechanneling similar to interstitials allowing to determine their concentration and depth distribution by ion channeling.
3.3.1. Nuclear Damage Dominated Cases
For irradiation, already the first systematic studies on ion implantation in LN by Jetschke et al. [99] and Götz and Karge [100,101] showed a clear anisotropy in the generation of lattice defects. For irradiation with 150 keV N+ ions at room temperature amorphization at the surface was reached with fluences of 5 × 1015 cm−2 and 2 × 1016 cm−2 for x- and y-cut material. In contrast, z-cut material sustained a heavily damaged but not amorphized surface layer even at a fluence of 4 × 1016 cm−2. Three different stages in the damage evolution were distinguished:
- (i)
- In the pre-damage stage (fluence < 1 × 1015 cm−2) mainly point defects were produced of which a significant fraction was attributed to Nb displaced from its regular lattice site to the free octahedron. This explains the lower dechanneling along the -axis in which these displaced Nb is still aligned with the guiding atomic rows, while for the -axis this lattice site appears in the center of the channel enhancing the dechanneling.
- (ii)
- The heavy damage stage (1 × 1015 cm−2 < fluence < 5 × 1015 cm−2) defect clusters form that cause - and -directions to be amorphous but still maintain some alignment with the -axis.
- (iii)
- In the final stage (fluence > 5 × 1015 cm−2) saturation of defect formation is observed along the - and -axis. A recent study [102] revisited the issue employing 350 keV Ar+ implantation into samples with x- and z-cut as well as a sample cut in a direction equally distanced from - and -axis by 45° which allowed to study both axial directions in a single sample. Plotting the mean maximum damage concentration versus the ion fluence yielded perfect overlaps for - and channeling measurements for the x-z cut sample with those of the respective standard cuts. The same work presents an additional confirmation of displaced Nb occupying the intrinsic vacant by angular-resolved RBS/C for a 1 MeV I+ implanted x-cut LN.
A study on ion irradiation at low temperature (15 K) was performed by Gischkat et al. [103] for various ions (50 keV H+, 160 keV Li+, 160 keV O+, 350 keV Ar+) at fluences ranging from 5 × 1011 cm−2 and 2 × 1017 cm−2. The analysis by RBS/C was done in situ at the same low temperature. Nevertheless, the analyzing He+-ion beam induced an annealing effect attributed to energy deposition by electronic processes. Taking into account this effect, the undisturbed damage concentrations were calculated indicating an enhanced defect formation with regard to room temperature.
Bianconi et al. [104] deduced, based on own experimental (C+, 0.5–5.0 MeV, O+, 0.44–8.0 MeV) and literature data, a universal curve for the Nb-defect fraction in the end-of-track region as function of the energy deposited by nuclear stopping. The relation holds for all ions with Z ≤ 14 independent of the fluence.
While the Nb-related damage is easily detected by RBS/C the other two constituents of LN are more difficult to access. In a work by Schmidt et al. [105] the 7Li(p,α)4He reaction was employed to study the Li-related damage in x- and z-cut material irradiated with 1 MeV I+ (fluences between 2 × 1013 cm−2 and 1 × 1014 cm−2). The evolution of the Li-damage concentration with the fluence rate was found to accompany closely that for Nb in the z-cut material. Due to the low contribution of Li to the channeling effect in LN other crystallographic directions than along the -axis are difficult to investigate in terms of defect formation.
Götz and Karge [100] also found an enhancement of the etching rate in diluted hydrofluoric acid for room temperature implantation fluences above 5 × 10¹⁴ N+ cm−2 that increased with increasing fluence. Schrempel et al. [106] investigated the etching rates for z-cut LN implanted at 15 K and room temperature with 40 keV He+ and 350 keV Ar+ with fluences ranging from 5 × 10¹² to 5 × 1016 cm−2. The larger amount of damage created by low temperature irradiation as well as the higher nuclear damage produced by the irradiation by heavier ions increase the etching rate strongly.
Jentschke and Hehl [107] studied the influence of annealing procedures in air on the implantation induced by in P+ (250 keV) and N+ (150 keV) implanted LN. For the case of a partial damaged (5 × 10¹⁴ N+ cm−2) x-cut sample, a virtually complete recovery of the lattice was achieved after annealing at 300 °C for 30 min. On the other hand, x- and z-cut samples with RBS channeling spectra indicating full amorphization show only a moderate reduction of the dechanneling even for annealing temperatures up to 1100 °C. This is related to the loss of Li by Li2O outdiffusion from the amorphous layer during the annealing process. Random RBS spectra of these samples show a surface region with a higher yield of Nb than for the virgin crystal due to the formation of the Li-deficient LiNb3O8 compound. The loss of Li during annealing at high temperature can be avoided by substituting air by flowing wet oxygen resulting in high-quality recrystallization of the material. This is demonstrated in Figure 20 for Cr-implanted LN after annealing in the two different atmospheres.
3.3.2. Electronic Damage Dominated Cases
For ions with specific energies above 0.1 MeV/amu, the electronic stopping power outweighs the nuclear along most of the path. For the formation of damage consisting of amorphous tracks the electronic stopping power of the ions has to exceed a material dependent threshold value.
The effect of electronic damage is seen most perfectly separated from nuclear damage for irradiation of materials with GeV ions. Canut et al. [108,109,110] performed a series of irradiation of LN using Sn-, Gd- and U-ions with energies in the GeV range and fluences ranging between 1 × 10¹¹ to 1 × 1012 cm−2. RBS/C investigations reveal even for the lowest fluences a significant damage in the observable depth range. The lattice disorder was found to increase with ion energy and fluence showing some saturation tendency for the latter at the maximum fluence. Plotting the damage fraction against the electronic stopping power for the different ions reveals a linear dependence.
Irradiations with lower ion energies, a few to tens of MeV, are of interest for optoelectronic applications and have therefore experienced an immense attention in the last two decades. In the following only a selective overview on the observed features can be given. Bentini et al. [111] investigated the implantation of 5 MeV O3+ ions with fluences of 1 × 1014 cm−2 and 6 × 1014 cm−2 into x-cut LN. RBS/C spectra of the as-implanted samples show for all fluences a damage peak at the end-of-range (2.7 μm) of the implantation, while a second peak appears at the surface region for fluences above 4 × 1014 cm−2 that has to be attributed to electronic damage. Samples annealed for 2 h at 235 °C in dry oxygen show a significant for the low fluence irradiation but a poor effect for higher fluences. The literature reports further similar RBS/C investigations on electronic damage for C [112], N [113], O [112,113,114,115], F [113,115,116], Si [117] and Mg [115].
Determination of the threshold electronic stopping power induced damage was the aim of several works. Rivera et al. [118] reported a value of about 6 keV/nm based on measurements for very low fluences (1 × 1011 cm−2 to 1 × 1012 cm−2) investigating a set of six different ion species. Ramos et al. [119] found a smaller value, 3.5 keV/nm, for irradiation with Cl- and Br-ions in the adjacent fluence range (1 × 1012 cm−2 to 1 × 1013 cm−2). An extensive study for the higher fluence range (1 × 1013 cm−2 to 1 × 1015 cm−2) using O- and Si-ions was recently presented by Wesch et al. [120]. A threshold value of 2.5 keV was extracted using the RBS/C data, in good agreement with the 2.2 keV reported in ref. [113] for 1 × 1014 cm−2 O implantation. These data evidence the reduction of the threshold value with increasing fluence. A plot of the threshold electronic stopping power versus the logarithm of the ion fluence can be fitted with a straight line as demonstrated by Agulló-Lopez et al. [121].
The theoretical modelling of the processes leading to amorphization experimentally observed in the electronic stopping power regime is a very active field, steadily generating new approaches. A detailed discussion is therefore out of the scope of this paper. In brief, the most used description is based on thermal spike model that assumes that local melting of the crystal structure occurs above the threshold value [122]. However, this cannot explain the damage production observed even below the threshold. Other effects as the exciton based mechanisms have been invoked as an explanation for this effect [123,124]. Finally, the cumulative character of defect generation has been invoked to explain the damage enhancement and amorphization in sub-threshold irradiation [120,125].
The defect formation by Si+ ion irradiation of LN along crystallographic directions has been investigated by Schrempel et al. [126,127]. For the case of low ion energies (<1 MeV for Si+) it was observed that the nuclear damage maxima were shifted to higher depth for aligned irradiation with respect to those of random incidence. This effect is related to the reduced stopping power in axial direction due to the channeling effect that keeps the ion in regions with lower electron density and consequently less energy loss. Additionally, the aligned irradiation creates significantly less defects for the same fluence. For higher energies the electronic stopping passes the threshold. Surface region defect formation is observed and the shift of the damage maxima for channeling irradiation decreases again.
3.4. Neutron Irradiation Induced Defects
The interest in the behavior of LN-based acoustical devices close to the core of a nuclear fission reactor started in the 1970s [128,129,130,131]. Materials close to a reactor core are exposed to neutrons from the fission of 235U and to gamma radiation [132]. While the neutrons directly released from fission have an average energy of ≈2 MeV (thus being considered fast neutrons), neutron moderation in most reactors extends the spectrum down to the meV energy range (thermal neutrons). Thus, most irradiations are done with neutrons with a wide energy range, unless specific filters are interposed [133]. Besides structural characterization performed with neutron scattering, LN crystals mostly with congruent composition were irradiated with fast and/or thermal neutrons with fluences up to 1020 cm−2 [31,49,134,135,136,137,138,139,140,141], although with scarce details on the actual neutron spectrum in many cases. An expansion along the c-axis and a shift towards longer wavelengths of the UV absorption edge were reported by Dowell et al. [128] for neutron fluences up to 4 × 1017 cm−2. Primak et al. [130] reported that irradiated LN becomes highly disordered and shows loss of piezoelectric response and optical birefringence at a fluence of 8 × 1019 cm−2. This process of destruction of LN was found to be significantly reduced when the LN sensors were kept at ≈800 K during the irradiation [131].
The basic physics of neutron damage production is well understood [142,143]. Fast neutrons with energy up to a few MeV produce displacement damage mostly through elastic collisions. In contrast, thermal neutrons produce displacement damage mostly through (n,γ) reactions, due to the recoil induced by the emission of the γ photons. In the case of LN one has to consider also the 6Li(n,α)3H nuclear reaction, with a high cross-section for thermal neutrons [144] and whose products, α and 3H, also produce displacement damage. Although in general fast neutrons are expected to create more damage than thermal neutrons, this is not always the case [145].
Figure 21 shows the number of collisions per neutron incident on a thin slab of LN (100 µm thick) as function of energy, covering a range from 0.1 meV to 20 MeV in 69 groups, calculated with the MCNPX Monte Carlo code [146]. Besides the total number of collisions, the contributions coming from collisions with Li, O and Nb are also shown. In the thermal neutron region, until about 1 eV, the number of collisions is essentially driven by reactions with Li (and within Li, with its less abundant isotope, 6Li). After this energy, the number of collisions per incident neutron is essentially constant until about 1 MeV, when it starts to decrease.
In order to evaluate the damage caused by the above collisions, it is necessary to know the threshold energy for displacement of the atoms in LN. Seitz estimated the threshold energy for displacement of an ion or atom in a tightly bound solid, Ed, to be 25 eV [147]. Calculations of Ed values have been done using molecular dynamics for several technologically-relevant materials (see, e.g., references [148,149,150,151]), but are scarce for LN. The displacement energy values calculated by Petersen [152] are Ed(Li) = 30 eV, Ed(Nb) = 34 eV and Ed(O) = 22 eV. The value of Ed for oxygen has been estimated from irradiations with electrons as 53 eV [153,154], which is well within the normal range for oxides [155], but significantly higher than obtained by calculation. An estimate for the value of Ed for Hf in Nb and Li sites can be obtained from the PAC measurements of Marques et al. [31]. The typical neutron fluence (all energies) for the preparation of the PAC measurements was less than 5 × 1016 cm−2, well below the fluence for which amorphization was observed [130]. Annealing in air at 573 K was enough to remove the coloration induced by the irradiation and annealing at 973 K was enough to remove all defects, as seen by RBS [31].
In a congruent LN crystal doped with 1 mol% HfO2 the spectra before and after thermal annealing show the same characteristic QIF around 1200 MHz, associated with Hf probes in Li sites. In contrast, in a near-stoichiometric crystal doped with 1 mol% HfO2 where Hf is distributed between Li (45%) and Nb (55%) sites, the spectrum after irradiation shows that the fraction of Hf probes in Nb sites is strongly reduced to 18%, with a full recovery only after annealing at 973 K. However, RBS data shows no change on the lattice site of Hf after irradiation [31]. Thus the change of lattice location after irradiation can only affect the radioactive 181Hf atoms produced via the (n,γ) reaction. Since these atoms are much less than 1 ppm of the total amount of Hf in the crystal, no effect can be detected by RBS. It thus seems reasonable to assume that the displacement is due to the recoil induced by emission of the γ photons from the 180Hf(n,γ)181Hf reaction, characterized by Alenius et al. [156]. As the maximum recoil that can be induced is 96 eV, corresponding to the emission of a 5.6 MeV γ photon, only one displacement per recoil is expected.
The transfer of Hf form Nb to Li sites upon irradiation can be qualitatively explained by the existence of Li vacancies in the congruent and near-stoichiometric crystals. In this way, a recoiled 181Hf from a Nb position finds easily a vacant Li site, leading to the observed change. In the case of a recoiled 181Hf from a Li site, which finds another Li site, no change is seen. If the energy necessary to displace Hf from Li and Nb lattice sites is approximately the same and x represents the fraction of 181Hf recoiled from Li and Nb sites, we can write:
where [HfNb] and [HfNb]′ are, respectively, the fraction of Hf probes in Nb sites before and after irradiation. Using the [HfNb] and [HfNb]′ values and respective uncertainties reported by Marques et al. [31], we obtain x = 0.37 ± 0.07. From the intensity of the discrete values of the γ photons emitted by the 180Hf(n,γ)181Hf reaction, a recoiled fraction of 37% would correspond to the emission of photons with energy of 3979 keV and above, imposing a minimum recoil energy of 47 eV to Hf. Thus, our estimate for the required energy to displace Hf in Nb and Li sites is 47 ± 8 eV, in reasonable agreement with the Ed value for Li and Nb sites calculated by Petersen [152].
Displacement of other dopants as a result of (n,γ) reactions is possible. Table 1 compiles data on the neutron capture cross section at 0.025 eV (1 b = 100 fm2) [157], main activation reactions(s), respective cross section [158], maximum γ energy released [159] and maximum recoil energy.
For the estimation of displacement damage, Dale et al. [160] have shown that is convenient to use a quantity named Non-Ionizing Energy-Loss (NIEL) to quantify the portion of energy lost by a particle that is used for displacement damage, with the remainder of the energy being dissipated as heat. It was shown that NIEL can be used to correlate displacement damage effects in materials induced by different types of radiation [160], even if some exceptions are known [161]. For a particle with energy E0 incident on a material with a single type of atom with atomic weight A, it is defined as:
where is NA is Avogadro’s number, dσ/dT is the total differential cross section (elastic and inelastic) for energy transfer to an atom of the material, Tmin and Tmax are the minimal and maximal energies that can be transferred to a lattice atom, and Q(T) is a partition function which gives the fraction of T that is lost to NIEL. Tmin is usually taken as Tmin = 2Ed, while Tmax = 4E0A/(A + A’)2, where A’ is the mass of the incident particle. The partition function Q(T) has a classical formulation given by Lindhard et al. [162] and fitted by Robinson et al. [143], as well as a more recent formulation by Akkerman et al. [163] with improved handling of low energy ions. Total NIEL for LN results from the application of Equation (4) to Li, Nb and O, taking stoichiometry in account, as:
The product of the NIEL and the particle fluence gives the displacement damage energy deposition per unit mass of material. NIEL plays the same role to the displacement damage energy deposition as the stopping power to the total ionizing dose. Figure 22 shows the values of NIEL for electrons, neutrons, protons and alphas incident in LN, with energy up to 100 MeV, calculated with the tools available at the SR-NIEL platform [164], using the Akkerman partition function. Displacement energy values of 30 eV, 35 eV and 25 eV were used for Li, Nb and O, as the nearest to the values calculated by Petersen [152], due to the constraints of the calculations for neutrons. NIEL for incident neutrons has a weak dependence of the value of Ed: a change from 20 to 50 eV in the Ed of the 3 species leads to a neutron NIEL average decrease of 3% in the range 10−4–10−2 MeV and less than 1% outside this range. Table 2 shows discrete values, for reference. The tabled values for neutrons were obtained by a simple linear interpolation between the two nearest values. It is worth noting that at 1 MeV protons are about 20 times more effective than neutrons in producing displacement damage in LN.
4. Extrinsic Point Defects
This section is dedicated to the determination of lattice sites occupied by foreign atoms in LN. The influence of dopant concentration, co-doping and stoichiometry of the material are addressed. The subsections are mainly organized according to the functionality of the dopant.
4.1. Dopants to Increase Photorefractive Damage Resistance
Although congruent LN exhibits excellent optical, electro-optical and non-linear optical properties, the relatively low optical damage resistance hampers its application in optical devices [165]. Besides the attempt to improve the optical damage resistance by growing stoichiometric LN, the introduction of divalent (Mg2+ [166,167], Zn2+ [168]), trivalent (Sc3+ [169], In3+ [170]) and tetravalent (Hf4+ [171], Zr4+ [172]) dopants has been proven to be successful. The observed minimum concentration for suppression of the optical damage (4.5 mol% for doping with MgO, 6 mol% for ZnO, 1.5 mol% for Sc2O3 and In2O3 and 4 mol% for HfO2 and 6 mol% for ZrO2) indicate that it is important to clarify the lattice location and interaction of these dopants with intrinsic defects of LN.
As the doping with Mg is by far the most technically most important way innumerous studies about the characteristics and application extensively studied and attempts were made. From the more fundamental viewpoint, the main interest is to understand the incorporation of this dopant in dependence on its concentration and to elucidate the underlying mechanisms.
Most of the theoretical approaches published so far depend largely on the model adopted to explain the non-stoichiometry of the congruent material. Zhang and Feng [173] proposed a series of overlapping concentration dependent mechanisms, based on the Nb-vacancy model. At low concentration (<2.7 mol%) Mg substitutes Nb on antisites until they are consumed; for higher concentration up to the threshold Mg is incorporated at the Li site and accompanied by a trapped electron for charge compensation; above the threshold the incorporation occurs on both Li and Mg sites. These ideas were readopted by Liu et al. [174] and more recently by Abdi et al. [175]. Based on the Li-vacancy model, Iyi et al. [176] propose that Mg at first replaces Nb at Li sites up to 3 mol% MgO at which the removal of NbLi is completed. In the range between 3 and 8 mol% MgO magnesium will only occupy regular Li sites while at higher concentration both cation sites are incorporating Mg. The studies by Donnerberg et al. [177,178] (further refined in [179,180]) are based on the occurrence of ilmenite-type stacking faults with Li vacancies but are formally treated as Nb antisites and Nb vacancies. In the following, we also adopt this procedure for simplicity. According to this model, Mg is replacing in the two concentration ranges < 1.5 mol% and 1.5 to 5.0 mol% simultaneously Nb on antisites and Li on regular sites employing different mechanisms. The preferential substitution of NbLi by Mg in the second range results in their complete removal at the threshold level. For even higher Mg concentrations both Li and Nb sites should be occupied.
Since a direct determination of the lattice site of magnesium in dependence of its concentration has to be regarded as essential to decide which of the proposed models is the most adequate, an extended channeling study on a set of Mg- doped crystals was performed employing He+ in order to improve the attainable minimum yield and minimize bremsstrahlung background [181]. As no adequate nuclear reaction for the study of magnesium is available, PIXE/C has been applied. Due to very low energy of the characteristic Mg-K X-rays a Si(Li)-detector with an extremely thin Be window was used to limit absorption. This set of crystals, containing one undoped and six doped (0.5, 1.0, 2.0, 4.0, 6.0 and 9.0 mol% MgO in melt), was grown at the Siemens Research Laboratory in Munich and thoroughly characterized regarding crystal composition, lattice constants, density, temperature, piezoelectricity and various optical properties [182,183,184,185,186,187].
Angular scans crossing through the -axis showed for all concentration dips with a width and minimum yield for the Mg-PIXE between those of Nb-RBS and Li-NRA. Computer simulations with CASSIS confirmed that this is consistent with the absence of non-axial lattice sites for Mg.
For MgO concentrations of 0.5 and 1.0 mol% the most striking observation is the strong peak in the Mg-PIXE yield for alignment with the -axis. This indicates that Mg is not occupying a regular cation lattice site but some interstitial site. The fact that the Mg- PIXE scans for the other axial directions show clear dips and a similar behavior to the Li-scans one can further exclude that Mg is located in the intrinsically vacant or in the Nb-octahedron. The computer simulation with the CASSIS code allows to identify the occupied position as the center of the Li-octahedron which yields for Mg an oxygen environment similar to that of magnesium oxide. The epitaxial growth of LN on MgO substrates it is known that the (111)-plane of MgO and (001)-plane of LN have the same oxygen framework [188] which might explain this behavior.
It is tempting to identify the observed behavior with a substitution of Nb in the stacking but this would require a substitution of the following type:
incorporating so much lithium that a near-stoichiometric crystal would be obtained. However, the measurements on the lithium fraction and Curie temperature for these samples exclude this scenario [182]. It is more likely that the Mg occupied sites associated to the ilmenite stacking faults (Li vacancies or Li sites in the vicinity) and the movement to the center of the Li-octahedron can be interpreted as a relaxation mechanism.
2 MgO + 3 Li2O + 3 VLi + 2 NbLi → 2 MgLi + 6 LiLi + Nb2O5,
The Mg-scans along the -axis for concentrations above 2.0 mol% MgO in melt differ clearly from those at low concentration. For all axial directions clear minima are observed with scan curve that resemble those of Li. However, computer simulations demonstrate that Mg solely occupying regular Li sites would result in minimum yields that are significantly lower than the observed ones. The best fit to the experimental data was obtained assuming 2/3 of the Mg to occupy regular Li sites and 1/3 sites in the center of the Nb oxygen cage (occupation of regular Nb sites yielded even lower minima). Interestingly this observation holds for the whole concentration range from 2.0 to 9.0 mol% MgO, without any change at the threshold concentration for photorefractive damage suppression. Indeed, there exists a substitution reaction for divalent dopants that would be compatible with these findings:
which on the other hand does not remove any antisites. A possible solution is that the reactions described by Equations (6) and (7) occur simultaneously until the threshold of 6 mol% Mg in the crystal is reached, causing a deviation in the MgLi/MgNb ratio that is too small to be detectable by the PIXE/C measurements.
3MgO + VLi + LiLi + NbNb → 2 MgLi + MgNb + LiNbO3,
A further study on this set of crystals focused on the influence of the Mg incorporation on the Li-NRA channeling minimum yield [189] providing further insight on the lattice modifications. The minimum yield for an atomic string in channeling directions depends strongly on repelling force of its continuum potential. The replacement of Li (Z = 3) by atoms with higher atomic number Nb (Z = 41) or Mg (Z = 12) increases the continuum potential of the Li-string and therefore reduces the minimum yield. Figure 23 shows the dependence of the Li-NRA minimum yield in various axial directions in dependence of the MgO-concentration. The main observation is that the minimum yield increases steeply for all but the -axis (in which all cations are aligned with each other) strongly for MgO melt concentrations up to 1 mol%. This indicates an increase in the disturbance of the lattice due to the interstitial location of magnesium rather than changes of the continuum potential due to removal of excess Nb. In the investigated axial directions ilmenite-like and regular Li site occupying Nb are located very close and do not produce distinguishable effects. For further increasing Mg concentrations the - and -axis no systematic alteration of the minimum yield is observed since the Li atomic strings are in close neighborhood to the—in terms of channeling—dominating Nb-rows. In addition, for both axial directions χmin does not decrease anymore to the value of the congruent case. On the other hand, Li is isolated in the -axis within the channel and the incorporation of the Mg reinforces the repelling force of the Li strings. This leads to a steady decrease of the Li-NRA minimum yields for this axial direction reaching at 9 mol% MgO a value below that of the congruent material.
In addition, one NMR study on 25Mg (nuclear spin 5/2+) has been reported by Feng et al. [190] for LN doped with MgO with concentration ranging from 1.0 to 6.0 mol%. The NMR spectra for 25Mg show clear differences for the various concentration but surprisingly no new line, that would indicate change in the lattice site, appears for concentrations above the threshold. Yatsenko et al. [191] used an indirect approach to obtain information on the incorporation of Mg using 7Li- and 93Nb-NMR in samples doped with 2 to 7 mol%. They conclude that the amount of vacancies is steadily increasing up to the threshold at which on the other hand no more Nb-antisites are present. Mg is supposed to occupy Li sites forming next-neighbor MgLi-VLi complexes.
Although less popular as dopant for photorefractive suppression in LN, Hf is highly interesting for studies on the basic incorporation mechanism of dopants since it can be accessed simultaneously by RBS/C and PAC. The advantage use of the combination of these two nuclear techniques in investigating has already been demonstrated in the case of intrinsic defects.
Hf-doped crystals LN were grown with 1.0 mol% [49,192] and 6.0 mol% [138] of HfO2 in congruent melt. For comparison, samples of near-stoichiometric material, to which 4.6 wt % K2O was added, were doped with 0.2 and 1.0 mol% [138,193] HfO2.
RBS enabled to determine the actual concentrations of the melt grown samples and derive the corresponding distribution coefficients (Table 3). Channeling measurements for various axial direction proved that in the 1.0 mol% congruent crystal Hf occupies exclusively the Li site [49,192]. For the samples doped with 6.0 mol% RBS measurements revealed that the Hf distribution in the samples is inhomogeneous (3.5–5.1 mol%) and the distribution coefficient lower than one [138]. Further, the higher minimum yield (10%) at -axis for Nb and Hf in comparison to the 1.0 mol% sample (2.5%) indicates an inferior crystal quality. Both findings indicate that the maximum solubility of Hf in LN has been exceeded in the sample. However, the quality of angular scans was still sufficient to obtain meaningful results for the incorporated Hf-fraction: the best fit was obtained assuming 55% of the Hf to occupy regular or slightly shifted (0.1 Å towards the octahedron center) Nb lattice sites and 45% to occupy regular Li sites. This ratio is not compatible with a charge compensation mechanism suggested in theoretical studies for which 25% of the Hf has to reside on Li sites and 75% on Nb sites.
Besides the already known frequencies for Hf in Li sites, the Fourier analyses of the PAC spectra obtained in the crystal doped with 6 mol% HfO2 and in the near-stoichiometric crystals has shown another peak at a frequency about 3.5 times smaller. The relative intensity agreed with the fraction for Hf in Nb sites determined by RBS and the EFG scaled with the 93Nb NMR measurements previously reported by Peterson et al. [44]. It can thus be safely assigned to Hf probes occupying Nb sites at room temperature. A frequency doublet for probes in Nb sites, νQ1 = 353 MHz and νQ2 = 494 MHz, was necessary for a good fit of the PAC spectra [193]. However, the best fits for the 6 mol% congruent and 0.2 mol% near stoichiometric crystals, for which the fraction of probes in Nb sites was close to 50%, were obtained without a fraction of probes in Li II sites. This suggests that the defect associated Li II site has disappeared or is of too small importance to make an effect.
The influence of stoichiometry on the incorporation of Hf into LN was studied by RBS/C on samples grown from stoichiometric melt [138,193]. The sample with higher Hf concentration (1.0 mol%) shows clearly a mixture of Li- and Nb-lattice sites occupied by Hf. Computer simulations with FLUX yield a best fit for 66% Nb sites and 34% Li sites, i.e., roughly a 2:1 ratio. This deviates from the 3:1 ratio expected in the case of charge compensation during the incorporation of Hf into LN. From angular scans of 0.2 mol% HfO2 sample, which can be regarded closer to a stoichiometric case, a fraction of more than 85% of Hf is located on the Li site. It can be concluded that Hf, despite being a tetravalent ion, shows a strong preference to incorporation on Li sites.
In order to demonstrate the influence of co-doping in LN on the incorporation mechanisms in LN, the case of Hf-Mg will be discussed in detail. A set of single crystals of congruent LN doped with 1 mol% of HfO2 in melt and MgO concentrations ranging between 2.0 and 4.0 mol% in steps of 0.5 mol% as well as one with 6.0 mol% have been studied by RBS/C and PAC [194,195,196,197]. The evaluation of the first set of co-doped samples showed that the fraction of Hf located on Li sites decreases constantly with increasing MgO concentration from about 90% at 2.0 mol% MgO to about 20% at 4.0 mol% and changes to full occupation of Nb sites at 6.0 mol%. This reveals that the tendency of Mg to occupy Li sites is stronger than that of Hf but falls short on being a charge compensation effect. Unfortunately, only for the case of 6 mol% MgO data on the lattice site occupation by Mg are available from an additional study [198]. In this case the mixed occupation of regular Li and Nb-octahedron sites as in the single Mg-doped case has been confirmed indicating that Mg may keep its incorporation mechanisms despite co-doping.
PAC measurements were performed in the same crystals after irradiation with neutrons and annealing. The spectrum obtained in the 6 mol% co-doped crystal could only be fitted considering a doublet νQ1 = 327(10) MHz and νQ2 = 398(10) MHz for probes in Nb sites. This frequency doublet is slightly different from the one observed for Hf probes in Nb sites of near-stoichiometric crystals, although no shift was observed for probes in Li sites, νQ1 = 1154(12) MHz and νQ2 = 1213(12) MHz. Figure 24 shows the dependence of the fractions of Hf on the different Li and Nb sites on the MgO concentration. The fraction of Hf occupying the Nb antisite (Li-II site) is constant up to 2.5 mol% MgO in the crystal. In this concentration range, Mg is exclusively located at the center of the Li octahedron. It therefore appears that Mg substitutes in LiLi or vacant Li sites, decreasing the number of Li sites available for Hf. Further, full suppression of Hf on the Li-II occurs between 4 and 6 mol%, the region in which the suppression of the photorefractive damage is completed.
For indium only one PIXE/C study for co-doping with 6 mol% MgO in melt is available [199]. The results indicate that In mainly substitutes Li in its regular lattice site but a fraction occupying regular Nb sites cannot be ruled completely.
4.2. Dopants to Enhance Photorefractive Damage
Despite the photorefractive effect being undesired for most optical applications it has an interesting application in the field of holographic recording of data [200]. Therefore also dopants that increase this effect have been the target of intense research. So far Fe has been identified as the single dopant with the most promising properties but other single dopants as Mn, Co, Cu, Ni, Cr, Mo, Ru, Rh, Ce and Tb [201,202,203] were investigated. Moreover, combinations of dopants, e.g., LiNbO3:Fe,Mn [204] or LiNbO3:Zr,Cu,Ce [205] were investigated intensively.
In contrast to the suppressing dopants the incorporation of photorefractive elements has gotten rather little attention by nuclear methods. Studies exist on the technically most important dopant, iron, on cobalt and on titanium. The latter enhances the photorefractive effect only very slightly but is of importance for optical waveguide applications.
It is generally presumed that the charge state of iron (Fe2+ or Fe3+) is of importance for the photorefractive efficiency. Various teams studied this topic applying Mössbauer Spectroscopy with 57Co as radiation source. The first study by Vayashko et al. [206] used lithium deficient LN heavily Fe-doped (2.4 to 5.1 mol%) crystals and detected both charge states in the material. They also reported that the fraction of Fe2+ increases with increasing Li-deficiency. Further studies with diffusion-doped [43] (0.5 to 1.0 mol% of Fe enriched to 86% in 57Fe) and melt-doped [207,208] (0.22 mol% Fe2O3 enriched to 90.7% in 57Fe) by and confirmed that a major fraction (90%) of the iron is present as Fe3+ in the virgin material. Annealing under reducing atmosphere (in Ar at 1000 °C for 140 h or under vacuum at 635 °C for 24 h), changes the charge state of the majority of the dopant to Fe2+. The measurements also indicate that the Fe dopant is located on an axial site [209].
Additional Mössbauer studies addressed the electron trapping in congruent, near-stoichiometric, Mg-doped and Fe-doped LN [210,211]. It was found that the electron trapping effect by Nb-antisite outweighs that attributed to Fe3+ despite the larger cross section of the latter. For crystals doped with Mg up to threshold concentration the trapping is strongly reduced. Due to Li-loss during 57Co diffusion at high temperature no quantitative results could be obtained for the near-stoichiometric material.
A first study on the lattice location of Fe was performed by Rebouta et al. [212] using samples of congruent LN doped in melt with 0.5 mol% Fe2O3. Due to the growth method, Fe was mainly incorporated as Fe2+ (as was confirmed by optical absorption spectrometry) rather than in the form of Fe3+ preferred in applications using the photorefractive effect However, previous studies suggest that the lattice location should not be affected by this [213]. PIXE/C with protons was used to determine the lattice location. Although the use of protons produces less pronounced dips and peaks in the angular scans the results definitely show that Fe is located in the Li site.
Zaltron et al. [214] presented a PIXE/C study on Fe-diffused samples. The material was produced by coating the LN substrate with a metallic Fe film and performing a diffusion treatment for 5 h at 1000 °C in oxygen atmosphere. Since the resulting samples contained Fe3+, an additional treatment under reducing atmosphere (96% Ar + 4% H2) for different times at 500 °C was performed in order to obtain up to 100% Fe2+. The depth profiles of Fe before and after reduction were measured by SIMS revealing a distribution extending up µm into the bulk with a maximum concentration of about 0.9 mol% Fe at the surface. The distribution remained unaltered after reduction. Angular scans measured for the as-diffused (1% Fe2+) and two reduced (20% and 100% Fe2+) samples show fully overlapping Fe-PIXE curves. Despite the poor crystalline quality of the samples (Nb-RBS minimum yield of ≈45% in the -axis) the data indicate that Fe is located on the Li site. This confirms also the assumption that the lattice site does not depend iron being incorporated in the divalent or trivalent state.
The lattice site of Co in LN was studied by Szilagy et al. [215] in melt-doped (0.2 mol% CoO) congruent material. In this case, a He+ ion beam was used to obtain PIXE/C scans for Co- and Nb-PIXE with pronounced dips for five major axial directions. The simultaneous recording of Nb-RBS axial scans allowed to demonstrate the high quality of the crystals grown (χmin ≈ 2%). Comparison of the experimental results with simulations using CASSIS demonstrated that Co is located exclusively on the regular Li site.
In contrast to its homologues Zr and Hf, Ti does not suppress the photorefractive effect. It is therefore of interest if its behavior is linked to some different incorporation mechanism. A first study was made by Buchal et al. [216] with a sample implanted with Ti at a fluence of 2.5 × 1017 cm−2 and 360 keV energy and subjected to a heat treatment at 1000 °C. This caused an almost complete recovery of the crystal structure and a diffusion of Ti in the bulk material. The maximum concentration of Ti in the samples was reported to 12 mol%. The PIXE/C measurements for Ti-K characteristic X-ray showed an almost perfect overlap with that of Nb leading to the conclusion that Ti occupies the Nb lattice site. Kollewe et al. [217] studied two different cases: melt-doped material with 3 mol% Ti and Ti-indiffused waveguides with a peak concentration of about 9 mol%. PIXE/C scans were recorded for various axial directions. For measurements along the -axis both samples evidence the absence of off-axis lattice sites while for the other axial directions clear differences are visible. While for the melt-doped crystal an almost complete overlap of the Ti-PIXE scan with those of the Li-NRA is found, the indiffused sample shows a behavior that resembles mainly the Nb-PIXE signal. Finally, Hauer et al. [218] reported a combined PIXE/C and PAC study for LN doped in melt with 1 mol% of Ti. The angular PIXE/C scans for various axial directions confirm clearly that Ti occupies only Li sites at this concentration level and that no off-axis sites are occupied. The PAC measurements show a single QIF, νQ = 15.4(2) MHz, which scales up very well with the results obtained with other probes occupying Li sites [34]. These findings led to the conclusion that Ti occupies solely Li-sites for lower concentrations while for higher concentrations a mixture of Li- and Nb-sites has to be assumed. Ti and Hf have obviously similar tendencies in the occupation of lattice sites although with opposite influence on the photorefractive index.
4.3. Optically Active Dopants
The excellent linear and non-linear properties turn LN into a highly desirable host material for optically active ions. Coherent stimulated emission from the rare earths Nd, Tm and Ho was observed in this material already in 1969 [219]. The interest on the laser applications of rare earths and Cr has led to innumerous studies on their optical properties in the last decades. Since these are strongly dependent on the dopant’s crystallographic environment the determination of its lattice site is of outmost interest. Although some pertinent information can be obtained by spectroscopic methods the direct determination of the lattice location by ion beam methods is indispensable. The study of rare earths in LN by RBS/C is fostered by their larger mass in comparison to Nb as the heaviest component of the host material while chromium has to be investigated using PIXE/C.
For optical communications applications Er3+ has attracted interest in a wide range of laser host materials due to its IR emission at about 1.5 µm coinciding with a minimum in the absorption in optical fibers. Erbium has been incorporated into LN by melt-doping, indiffusion and ion-implantation. RBS/C studies have been reported only for melt-doped LN. The first investigation used two crystals co-doped with 0.5 mol% Er2O3 and 5.8 and 8.0 mol% MgO in melt (0.79 mol% Er, 4.8 and 7.5 mol% Mg in crystal), respectively [220,221]. Angular scans for axial directions show an exclusive occupation of the regular Li lattice site. For a second study, a series of singly-doped crystals with concentrations of 0.5, 1, 2, 3, 4 and 5 mol% in a congruent melt was grown and investigated [222]. The comparison of the experimental angular scans with simulations using the modified FLUX program confirmed that the main fraction Er is located in the Li-octahedron but appears to be shifted form the regular site by 0.2 Å towards the closest oxygen layer. The Er concentration of these sites increases at first with increasing total Er concentration but reaches a saturation value at about 2.5 mol%. The high minimum yields for Er in axial directions point out that an additional fraction of Er occupies non-axial sites but cannot be identified with the known tetrahedral site in LN. The authors claim that these sites off the c-axis cannot be seen as a new crystalline structure but are rather amorphous precipitates or defect clusters.
Another important rare earth in optical communication application is praseodymium. Crystals doped with 0.2 and 0.5 mol% Pr3+ in melt were studied by RBS/C [223,224,225]. The comparison of experimental scans and simulations with the FLUX code shows that as in the case of erbium Pr is located in the Li oxygen-cage but with a larger shift (0.45 Å) towards the closest oxygen layer. On the other hand, site selective spectroscopy performed on the same samples suggests that more than one site for Pr3+ exists. This discrepancy can be easily understood taking into account the defect structure of the congruent material that causes (due to vacancies and stacking faults) different local surroundings for the Pr3+ ion.
Also the lattice site of the probably most popular laser active ion, Nd, has been investigated using RBS/C. The history of the investigation of this impurity highlights the importance of computer simulations for the interpretation of lattice location measurements in complex non-cubic crystal structures like LN. The first studies of the Nd3+ lattice sites for a 1 mol% Nd3+ in melt (0.33 mol% in the crystal) where first interpreted based on assumptions adopted from the study of simpler crystal lattice and pointed out a mixed occupation of Li- and Nb-sites [192]. Another study even claimed the occupation of three different axial lattice sites within the Li-octahedron [226,227]. A new interpretation of the experimental results using the FLUX code revealed that Nd3+ is actually located in the Li-octahedron displaced by 0.4 Å towards the closest oxygen layer [23].
In order to complete the overview on the lanthanides it has to be mentioned that three other rare earths were also found to occupy positions shifted from the Li site towards the closest oxygen plane: Eu (0.4 Å) [23,192,228], Ho (0.38 Å) [223,224] and Yb (0.3 Å) [223,224]. Plotting the five known displacement values against the ionic radius as suggested by Lorenzo et al. [223,224], shows an apparent linear dependence, depicted in Figure 25. The measured position of the main fraction of Er [222] (0.2 Å) has been added to the Lorenzo’s data.
For Nd, Gd, Er, Tm, and Lu (1 mol% in melt) RBS/C studies on samples co-doped with Mg (6 mol%) have been performed [199,221]. For Nd, Gd and Tm the angular scans show only a partial occupation of the Li octahedron. In contrast to the singly-doped crystals, remarkably large fractions of randomly incorporated ions (almost complete for Nd, 70% for Gd, 20% for Tm) are observed. Rare earths with low or no random fractions are Er and Lu. Interestingly, also the distribution coefficient of Nd in the MgO co-doped crystal, k = 0.03, is an order of magnitude lower than in the singly-doped material [192]. This indicates that the incorporation of lanthanides with large ionic radius into the LN lattice is strongly hampered by Mg. The lattice location study for Mg on the LiNbO3:Lu,Mg sample by Kling et al. [198] demonstrates that, in contrast to Hf-co-doping, the distribution of Mg in the lattice is identical to the singly 6 mol% MgO-doped crystal. In the competition for the occupation of sites in the Li-octahedron the divalent Mg may be favored with regard to the trivalent lanthanides since it requires less charge compensation by formation of additional Li vacancies.
Trivalent chromium has been already used in the very first laser as optically active ion. The potential application as a compact tunable laser initiated an intense research on the properties of Cr-doped LN. The introduction of chromium in LN with chromium can be achieved by melt doping [229,230], ion implantation [231] and diffusion [232]. Since chromium as a transition metal shows the tendency to increase the photorefractive effect the co-doping with Mg at high concentration is desired. However, the co-doping alters the absorption (Cr-doped LN is green, Cr-Mg-co-doped pink) and luminescence properties. Optical [233], ESR [234] and EXAFS [235] studies suggest that these effects are related to changes in the lattice site occupied by the Cr—only Li-sites for singly-doped material, Li- and Nb-sites for Mg-co-doped.
The lattice location of Cr was studied by PIXE/C in a congruent sample doped with 0.1 mol% Cr and one with 6 mol% Mg and 0.1 mol% Cr in melt [236]. The very low Cr dopant concentration turned to out to be extremely challenging for the experiment and a copper monolayer had to be deposited on the samples to suppress low energy X-ray emission due to charging effects by the ion beam. Nevertheless, it was possible to determine the lattice location by comparing the angular scans obtained with computer simulations using CASSIS. Surprisingly, it was found that already the singly doped crystal contains about 40% of the Cr on niobium sites and 60% on Li sites. This implies that chromium, in contrast to all other trivalent dopants studied so far, shows a tendency for charge compensation replacing Li1+–Nb5+). The results align well with those of the ESR study by Jaque et al. [234] suggesting that in singly-doped material mainly occur with some Cr3+ on Li-sites. For the case of the co-doped material the fraction of Cr located on Li sites is reduced to about 20% while 80% occupy the Nb octahedron although shifted about 0.1 Å towards the center of the octahedron.
Waveguide lasers require only a thin near-surface with the optically active ion, instead of bulk-doping. Ion implantation is an advantageous tool to dope a material with a controllable concentration and depth distribution. In order to verify the applicability of this method y-cut LN samples were implanted with 100 keV Cr to fluences of 1 × 10¹⁶ and 5 × 1016 cm−2, respectively [115]. This resulted in a peak concentration of 2.2 mol% Cr for the latter fluence with a projected range of about 55 nm. In order to remove the implantation induced lattice damage annealing was performed under wet oxygen atmosphere for various temperatures and times. The success of the annealing process was verified by RBS/C showing that for 1000 °C and 4 h the almost completely amorphized surface layer was reconstructed and the RBS/C spectra hardly distinguishable from those for virgin material. In order to verify the incorporation of chromium in the crystal lattice angular scans were taken with PIXE/C. An almost perfect overlap with the results for the melt-doped case demonstrate the successful incorporation of Cr into the LN crystal.
4.4. Pentavalent and Hexavalent Dopants
Dopants in the pentavalent state are of interest since they can replace Nb without need of charge compensation. However, none of the elements in the pnictogen group incorporates into the LN lattice. An alternative are the homologues of Nb, V and Ta. The latter is known to be able to form mixed crystals covering the full stoichiometry range [237].
Since Ta has about double the atomic mass of Nb it was easy to study this impurity by RBS/C. The results of congruent crystal doped with 1 mol% of Ta showed that the angular scans for Nb and Ta fully overlap for all investigated axial and planar direction evidencing that Ta fully replaces Nb on its lattice site [228].
Similar to the case of pnictogens, also no doping of LN with chalcogenides could be achieved. Nevertheless, three elements that readily form hexavalent oxides—Mo [238], W [239,240,241] and U [242] have been successfully incorporated into LN. The lattice location of latter two was subject to studies by RBS/C.
Tungsten doping was performed in three different ways: ion implantation, doping in melt and diffusion. In the first case a fluence of 1 × 1014 cm−2 of 186W was implanted into x-cut congruent LN resulting in maximum W concentration of 1.25 mol% peaking at about 50 nm depth [239]. In order to remove the implantation induced damage the sample was subjected to a two-step annealing process (600 °C for 1 h, 800 °C for 4 h) in a wet flowing oxygen atmosphere. The angular scans of the recrystallized material showed a complete overlap of the Nb- and W signals for all crystallographic directions proving the complete incorporation of tungsten on the niobium site. In a second study, LN crystals were grown from melt doped with 1 and 2.5 mol% WO3 [240]. The concentration in the grown samples were determined by RBS to be 0.2 and 0.5 mol%, respectively, fixing the distribution coefficient of tungsten to 0.2. The RBS/C measurements confirmed the results of the ion implantation work on W replacing solely Nb. In the third approach a y-cut LN crystal was placed on a bed of metallic tungsten and kept at 1000 °C for 2.5 h under vacuum which yielded an extremely W-rich (about 35 mol%) layer at the surface [241]. A subsequent annealing treatment at 1000 °C for 2 h reduced the W concentration to 0.75 mol% and improved the crystal quality sufficiently to perform RBS/C scans. As in the previous two cases, the exclusive occupation of Nb sites by W was observed.
For the investigation of the lattice site of uranium a crystal grown from a congruent melt doped with uranylacetate-dihydrate (0.5 at.% U equivalent to roughly 2.5 mol%) was used, in which uranium should be incorporated in the hexavalent state. The samples obtained contained about 0.18 mol% U (distribution coefficient ≈ 0.07) as determined by RBS. Optical absorption spectroscopy confirmed that uranium had been incorporated as U6+ [242]. As in the case of W the angular scans for U-RBS and W-RBS overlapped fully confirming also for uranium the occupation of the Nb lattice site [240]. Calvo et al. [242] observed that a heat treatment under vacuum, i.e., reducing conditions for LN, turns the U-doped crystals from orange to red. Optical absorption studies revealed the existence of trivalent (and eventually tetravalent) uranium after this treatment. In order to check if this alteration of the valence state has any influence on the lattice site of uranium RBS/C with a sample reduced for 16 h at 1000 °C under high vacuum were performed. The angular scans, shown in Figure 26 for various crystallographic directions, show that part of the U has been pushed out of the Nb site but is still on an axial position [243]. Employing simulations using CASSIS suggest that about 20% of the U is now on Li sites while the remainder still occupies the Nb site. These findings corroborate the assumption that the cation lattice site occupied by ad dopant is mainly governed by its valence state.
4.5. Noble Metals
The introduction of noble metals into glass in order to change its color is a method applied since Roman times [244]. The coloration is due the formation of noble metal nanoparticles for which the existence of surface plasmon resonances causes strong optical absorption peaks. The associated non-linear optical properties raised the interest on formation of such nanoparticles in modern optical materials. LN can incorporate noble metals as Cu and Au only at very low concentrations in melt-doped crystals causing the absence of surface plasmon related effects. Since the first successful formation of Cu-nanoparticles and the observation of their typical optical absorption behavior by Saito et al. [245] in 1987, this method has been applied for the production of Cu [246], Ag [247], Au [248] and mixed [249] nanoparticles. The influence of ion energy (20 keV–3 MeV), fluence (4 × 10¹³–2 × 1017 cm−2), implantation temperature (room temperature—700 K), post-implantation treatment (annealing at various temperatures and atmospheres) on the optical properties has been studied in detail [178,179,180,181]. RBS and RBS/C was employed in several studies to investigate the distribution of the implanted species, the implantation-induced damage and its removal by annealing as well as some structural characteristics of the implanted elements.
The best investigated case is that of Au. Due its high mass it can be easily detected by RBS and the implantation-related peak in the spectrum is well separated from niobium. Shi et al. [250] demonstrated that an implantation at 1 MeV with a fluence of 4 × 10¹³ Au+ cm−2 only partially damages the implanted layer while for 5 × 10¹⁴ Au+ cm−2 already full amorphization is achieved. Taking RBS/C spectra they were able to calculate damage depth profiles with nanometric resolution. A comparison with the popular TRIM code [251] for damage profile computation revealed that the experimentally determined damage reaches far deeper into the crystal than computed slowing down recovery of the crystal lattice during annealing. The study by Takahira et al. [252] was the first one to investigate the recrystallization of an Au-implanted (550 keV, 1 × 10¹⁶ to 1 × 1017 cm−2) LN crystals in detail. They showed that annealing at 600 °C for 1 h in air efficiently removes a large part of the damage for the sample implanted with 3.7 × 10¹⁶ Au+ cm−2—corresponding to a peak concentration of 7 at.%. It is noteworthy that the Au implantation profile is not affected by the heat treatment.
Dev et al. [253] performed RBS/C measurements for the -axis of LN implanted with 1 × 1015 cm−2 Au (1.43 MeV) and annealed at 450 °C in flowing oxygen atmosphere for 40 min. The curves for the Nb- and Au-RBS overlap mostly but show a distinct kink at about 0.5° from the axial direction, ruling out a formation of nanoclusters due to a low Au concentration (0.5 mol%). This indicates that a major part of the Au is in axial lattice site but in contrast to the claims of the authors, not necessarily the Nb-site. Due to its high atomic mass the Au-RBS scan would also overlap for Li-, free octahedron or other aligned sites. The kink-related fraction is definitely related to a fraction on a non-axial site, possibly the tetrahedral site (although this would have to be verified by additional studies).
For a higher fluence (1 × 10¹⁶ Au+ cm−2, 800 keV, implanted at room temperature) Kling et al. [254] investigated the recrystallization of the sample after subsequent annealing at 600 °C (2 h) and 800 °C (1 h) in flowing wet oxygen. RBS/C measurements showed that even at 800 °C only a partial recovery of the crystal lattice was achieved. Further, it was found that the yield for Au-RBS is reduced for the -axial direction. Since optical absorption demonstrated the formation of Au-nanoparticles in the sample an incorporation into the LN lattice was ruled out leaving only the hypothesis that the Au-cluster are aligned the with the LN lattice. Complementary studies by TEM of this sample revealed that gold did not form spherical nanoparticles as deduced from various optical investigations but thin flakes parallel to the surface with lateral dimension of up to 200 nm. An electron diffraction measurement confirmed that these flakes are highly coherent with the LN lattice.
In another study by the same authors, the interaction between Au- and He-implants was in the focus of the interest [255]. All samples were implanted with 20 keV He+ to a fluence of 1 × 1016 cm−2. Au+-implantations with 50 keV (5 × 1015 cm−2) were used to obtain two well-separated profiles while others using 800 keV Au+ (1 × 1016 cm−2) achieved an overlap with the profile of He. In RBS/C spectra for the samples with separate profiles the two damage-related peaks for He and Au appear separately even after annealing at 270 °C. Annealing at 600 °C causes the Au to migrate towards the bulk and broadens the profile while at 800 °C a movement of the gold towards the surface is observed. This mobility of Au contrast clearly with the static Au profiles observed for single implantation at the same temperature discussed above. Most likely the diffusion of Au at 600 °C is facilitated by the presence of He in the material but not showing a real gettering effect as in Si [256]. As in the previous case, diffusion towards the surface and an alignment of the Au-nanoparticles was found for the samples with overlapping profiles. TEM observations revealed again the existence of Au-flakes but with drastically reduced lateral sizes (<100 nm) compared to singly-implanted LN opening a path for the control of nanoparticle properties by co-implantation of noble gases.
For the case of Ag-implantation, Milz et al. [257] studied the influence of implantation and annealing temperatures on the damage production and removal. X-cut LN was implanted with 380 keV Ag+ to a high fluence (1 × 1017 cm−2) at liquid nitrogen (−196 °C) temperature, room temperature and 700 K (423 °C). RBS/C spectra show that in the first two cases the implanted surface layer was completely amorphized while in the high-temperature case the layer was heavily damaged and thinner retaining some crystallinity. Rapid thermal annealing at temperatures ranging from 300–900 °C was employed for recrystallization. In the sample implanted at room temperature an increasing reduction of the amorphized layer with increasing temperature was observed but only at 900 °C a partial recovery of the crystal lattice at the surface was observed.
The interaction of Ag and O implants was the topic of a study by Williams et al. [258]. Z-cut samples were implanted with Ag and O at energies of 160 and 35 keV and fluences of 4 × 1016 cm−2 and 8 × 1016 cm−2, respectively at RT and 500 °C. Both implantation sequences were used and additionally a singly Ag+ implanted samples (1.5 MeV, 2 × 1016 cm−2 and 1.7 × 1017 cm−2, same temperatures) were produced. The implanted material was annealed for 1 h at 500 °C in air. From RBS/C spectra recorded for the Ag-implanted sample it was concluded that in case of high-temperature implantation is located closer to the surface than in that for room temperature. On the other hand, during the annealing the Ag moves towards the bulk in the high-temperature sample while it approaches the surface in the RT-sample. Co-implanted material shows some difference between the two implantation sequences when the high-temperature procedure is applied. For Ag- then O-implantation the Ag-profile stays practically unaltered with most of the Ag remaining at the surface. For the opposite sequence, a significant Ag-diffusion towards the bulk was observed that seems to stabilize the Ag-nanoparticles formed.
The incorporation of Pt into LN was achieved by 50 keV Pt+ ion implantation at room temperature at a fluence of 5 × 1015 cm−2 [259]. A maximum concentration of about 1.5 mol% of Pt was attained. The samples were annealed under flowing wet oxygen atmosphere at 600 °C and 800 °C for 1–6 h in steps of one hour or at 1000 °C for 60, 90 and 120 min. Further, an incremental annealing was done at 300 °C, 400 °C, 450 °C, 500 °C, 600 °C and 700 °C for 30 min followed by one at 1000 °C for up to 5 h. Studying the Pt-RBS yield in the surface region (0–10 nm) showed no effect for 600 °C, a slight diffusion towards the bulk after 6 h at 800 °C and a very rapid one at 1000 °C leaving the surface region virtually without Pt. RBS/C spectra showed no alignment effect for Pt except for the sample that underwent incremental annealing. A minimum yield of 53% is observed for alignment with -axis while for all other crystallographic directions random behavior is found. It can be concluded that Pt forms precipitates that are preferentially aligned with the -axis of LN as in the case of Au.
Iridium implanted into LN (130 keV, 5 × 1016 cm−2) with a high peak concentration has been studied by Kling et al. [260] The samples were annealed under flowing wet oxygen at 500 °C, 800 °C and 1000 °C for 30 min. In contrast to Pt, significant diffusion towards the bulk was found by RBS already at 500 °C. After heat treatment at 1000 °C a practically uniform concentration of 0.015 mol%, i.e., about two orders of magnitude lower than in the as-implanted material, is reached. RBS/C scans show an alignment effect with the LN for all investigated axial directions with a width comparable to that of Nb-RBS. However, the high minimum yields (40–80%) do not allow attributing positively an occupation of the Nb-site by Ir.
5. Optical Waveguides
Photonic applications using optical materials like LN receive a constantly increasing interest. A key part in any photonic device is an optical waveguide. It consists of a thin surface layer (in the order of the wavelength of the light guided) with a refractive index larger than the underlying substrate. Total reflection at the interfaces with the bulk and the air confines the light propagation to the waveguide. Many different approaches for the fabrication of waveguides in LN and other optical materials have been developed in last decades. For a comprehensive review see Bazzan and Sada [261].
5.1. Indiffusion
The formation of LN waveguides by in-diffusion of Ti from a thin metallic layer deposited on the surface was reported for the first time by Kaminow and Carruthers [262] in 1973 and became with time the most common method. It combines a good guiding behavior with the preservation of the electro-optic properties. The downside is that Ti, in contrast to its homologues Zr and Hf, it does not suppress the photo-refractive effect.
For applications, it is of important to determine the depth profile of the in-diffused Ti that controls the refractive index profile of the optical waveguide. The method of choice is in this case the SIMS. The first Ti-profile measurement was performed in 1979 by Burns et al. [263]. The samples were prepared from x-cut LN coated with 17.5 nm of Ti and diffusing at 900–1100 °C for 6h in Ar atmosphere. SIMS concentration profiles for Ti and Li ions for a sample treated at 1000 °C show pronounced peaks with half-width of 200–300 nm near the sample surface. A clear correlation between decreasing Ti- and increasing Li-concentration with depth is observed. These results suggest that the diffusion treatment time was too short for a sufficient redistribution of the Ti. Arizmendi et al. [264,265] investigated in detail this first phase of the diffusion process combining ion beam analysis, X-ray diffraction and electron microscopy techniques for samples in-diffused in Ar and O2 atmospheres between 500 and 950 °C. RBS/C measurements for samples annealed at 500 °C showed the formation of an amorphous TiO2-layer on the substrate and a lack of oxygen in the LN surface. For the technically more important case of 950 °C (30 min, dry oxygen) a TixNb1-xO2 compound with x = 0.65 in the surface region is inferred from the RBS results in accordance with x-ray diffraction. Angular scans for several axial directions revealed that this new compound is aligned along the c-axis of the LN substrate but not with other axial directions. The authors argue that the compound formed in this step constitutes the actual source for the further in-diffusion of Ti.
Based on these observations for technical applications the diffusion treatment at high temperature and for extended time periods (up to 16 h) has been adopted. Several groups reported SIMS studies on the Ti-diffusion process. Bremer et al. [266] reported a Gaussian profile peaking at the surface for Ti after indiffusion for 16 h under wet Ar atmosphere. A vast investigation of the main determining factors that govern Ti-diffusion (Ti-film thickness, diffusion temperature) has been presented by Caccavale et al. [267,268]. With the help of SIMS measurements on samples annealed at 900–1000 °C they could confirm that only for the highest temperature a complete indiffusion of Ti takes place while for lower temperatures an enhanced Ti-concentration near the surface is found. Further, they were able to detect a significant anisotropy in the diffusion process leading to a diffusion coefficient twice as high for z-cut material than for x-cut. Caccavale et al. [269] have given an impressive example of the lateral resolution of the SIMS technique by studying the lateral diffusion of Ti in waveguides. It was possible to determine the lateral Ti-profiles of two waveguides separated only by a few µm. For near-stoichiometric LN produced by the vapor transport equilibration Zhang et al. [270] observed a diffusion profile that can rather be described by an error-function than by a Gaussian as in the congruent material.
To overcome the photorefractive effect in Ti-diffused waveguides diffusion into Mg-doped material or Mg co-diffusion can be applied. The first SIMS study by Bremer et al. [271] used already Ti-diffused waveguides as described above [266]. MgO was deposited as Mg-source on the waveguide and indiffused at 950 °C in order to avoid further Ti-diffusion and taking into account the more rapid diffusion of Mg. A single Mg-diffusion treatment leads to a Gaussian distribution of the Mg peaking at the surface with some reduction of the Li content at the waveguide surface. Repetition of the Mg-indiffusion causes a drastic (20%) loss of Li in the surface region accompanied by high Mg-peak in this region. The authors interpreted this as hint to the substitution of Li by Mg during doping. Caccavale et al. [272] concluded that the Ti-profile suffers only minor additional diffusion by Mg co-diffusion but that on the other hand Mg-diffusion is clearly enhanced in comparison to an undoped crystal [273].
A comparative study on the Ti diffusion in undoped and Mg-melt-doped congruent and near-stoichiometric LN was presented by Kumar et al. [274]. Samples were indiffused at 1080 °C for 23 h in dry air atmosphere. The values of the Ti-diffusion constant determined using SIMS profiles show that Ti-diffusion is slowed down in MgO-doped material for near-stoichiometric (1 mol% MgO) and congruent material (5 mol% MgO) with respect to their undoped counterparts.
An important alternative is the indiffusion of Zn from vapor phase into LN, reported for the first time by Herreros and Lifante [275]. Nevado et al. [276,277] produced samples indiffused at 550 °C and 700 °C with a diffusion times of 2 h and 8 h, respectively. The samples were subsequently annealed for 4 h at the 700 °C or 800 °C, respectively, to form the actual waveguide. As-diffused and annealed samples were investigated by SIMS and RBS. In both cases the as-diffused samples showed Zn-rich surface layers followed by a zone with decreasing Zn concentration. After the annealing Zn diffused from the Zn-rich superficial layer several µm deep into the bulk forming the actual waveguide. A further quantitative analysis was performed using HIERD [278]. This high depth-resolution quantitative technique allowed to confirm that in the as-diffused case the top layer consists of LN and ZnNb2O6 phases, i.e., a partial substitution of Li by Zn occurs. On the other hand, in the annealed sample a homogenous mixture of ZnO and LN was found on top and a Zn-diffusion profile for the remainder of the waveguide.
For completeness, it should be mentioned, that also other elements, Sc [279] and Zr [280], which are candidates for waveguide formation were studied with regard to their diffusion properties using SIMS. Further, several studies focused on the co-diffusion of two elements: Zn/Ni [281], Zr/Ti [282,283], Sc/Ti [283] as well as for waveguide laser applications, the important Er/Ti [283,284].
5.2. Proton-Exchange
A simple alternative to metal-diffusion based waveguide production is the proton-exchange (PE) technique reported in 1981 by Jackel and Rice [285], trailed by the production of the first optical waveguide in the following year [286]. Proton exchange is achieved by placing the LN crystal in a liquid source (most commonly melted benzoic acid) that acts as hydrogen source at elevated temperature. For a review see Cabrera et al. [287]. Unfortunately, the as-exchanged layer suffers from lattice stress and damage, as found in early RBS/C studies [288,289], which degrades the optical properties. Therefore, a subsequent annealing procedure at about 300 °C in air is employed in order to obtain a high-quality waveguide. Figure 27 shows the effect for LN proton-exchanged using benzoic acid.
Studies of the as-exchanged layer thickness are performed by analyzing the damage profile in axially aligned directions by RBS. Changing process temperatures and times as well as the cut of the substrate allowed to determine their influence on the exchange-depth and the hydrogen diffusion coefficient. Results were reported for benzoic acid in the low (110–220 °C) [290] and high temperature range (200–300 °C) [291,292]. In accordance with the expectations, the exchange depth was found to be proportional to the square root of the exchange time while the diffusion constant follows an Arrhenius law [290] Analogue findings were reported for samples treated with sulfuric [293] and pyrophosphoric acid [294]. The comparison of channeling spectra taken before and after annealing shows a strong but incomplete recovery of the LN crystal structure [291,292,294,295].
Nb-disorder profiles extracted from the RBS/C spectra show differences between x- and z-cut LN [292]. The as-exchanged z-cut material shows a low damage (up to 25% of the Nb-atoms displaced) increasing from surface to bulk with an abrupt end. On the other hand, for x-cut material the damage was found to be constant at a high level (80%). After annealing the damage profiles extended for both cases deeper into the bulk and interestingly, showed a smaller degree of recovery for the z-cut substrate. Olivares et al. [291] measured RBS/C spectra and angular scans for Nb-RBS along several axes in as-exchanged waveguides demonstrating high-temperature treatment leads to a superior crystal quality. Moreover, virtually no differences between samples prepared under slightly different conditions (addition of lithium benzoate, annealing atmosphere) were observed. The authors also performed ERD angular scans for the lattice location of hydrogen at several planar directions [291,296]—due to the need of large ion beam incidence angles (θ > 70°) for this technique no appropriate axial directions were available. A comparison of the experimental results with computer simulations based on a theoretical model proposed by Kóvacs et al. [297] (shift of H in c-direction by 0.1 Å, in y-direction ≈ 1Å) revealed a good agreement. Although somewhat ambiguous, these results support clearly support the formation of O-H suggested by theory.
As in the case of Ti-diffusion the actual elemental profiles within the waveguide are of outmost interest for establishing a correspondence with refractive index profile. Suitable nuclear depth profiling techniques employed in proton-exchanged LN for hydrogen are ERD, NRA and SIMS, for lithium NRA and SIMS and for oxygen SIMS.
Canali et al. [289] measured the H and Li depth profiles of as-exchanged layers using nuclear reactions. In the case of hydrogen profiling was done with the 15N(p,αγ)12C reaction that allows due to its resonant character a very high depth resolution; Li-profiles were taking using the non-resonant 7Li(p,α)4He reaction that allows only moderate depth resolution. The hydrogen profiles overlap with the damage depth observed in the RBS/C. The Li-NRA spectra reveal a 70% reduction of lithium in the treated layer corroborating that indeed an exchange reaction between Li and H takes place. Additional SIMS studies by the authors confirmed these results. Hsu et al. [295] verified the depletion in as-exchanged layers and demonstrated that after annealing a partial recovery of the Li concentrations occurs although a thin surface layer stays poor in lithium. Resonant NRA depth profiling by Ito and Kawamoto [298] revealed a reduction of the H-concentration in the surface after annealing and further diffusion into the bulk out of the depth region accessible by this method.
Rottschalk et al. [299] employed ERD for the H depth profiling of PE waveguides (benzoic acid, 180 °C, 5 h or 250 °C, 1 min) in as exchanged state and after annealing at various temperatures. Despite the extremely short treatment time, it was clearly visible that higher temperature yielded a higher hydrogen surface concentration. As expected, the hydrogen diffuses more rapidly with increasing annealing temperature reducing its concentration at the surface. The work of Hagner and Bachmann [300] investigated the H-concentration in the as-exchanged waveguide in dependence of the amount of lithium benzoate admixture to the benzoic acid used in the process. The ERD spectra showed a reduction of the hydrogen incorporation into the layer with otherwise identical conditions.
Hydrogen profiles in PE-LN layers (benzoic acid, 185 °C, 70 min) annealed at 400 °C for 6–180 min were obtained by Casey et al. [301] and Zavada et al. [302] using SIMS. The measured H concentration profiles had to be fit using two Gaussian diffusion profiles which suggest the existence of two different types of hydrogen diffusion with distinct diffusion coefficients. The authors suggest that the fast component is related to interstitial diffusion while the slower represents substitution of lithium by hydrogen. De Souza et al. [303,304] confirmed and quantified the fractions of these two different species of hydrogen with NMR measurements for several exchange conditions. In a second study [305] the authors succeeded to separate the signal origination from the “static” hydrogen and compared the results with calculations for four defect models. The best agreement was found for H occupying a position within an oxygen plane along a side of an oxygen triangle equidistant from two oxygen atoms.
5.3. Ion Implantation
Among the waveguide fabrication techniques ion implantation is the one that can be applied to largest variety of materials. For comprehensive reviews see Chen et al. [308] and Peña-Rodriguez et al. [309]. As discussed in Section 3.3 defects are produced by electronic and nuclear interactions. In many cases, these defects cause an alteration of the refractive index forming an optical waveguide. The first successful waveguide formation using ion implantation was reported by Destefanis et al. [310]. For waveguides based on nuclear damage induced defects the quality of the waveguides is improved by an annealing procedure to remove electronic damage in the light guiding layer but leaving the buried damage layer intact. In the meantime, waveguide formation based on electronic damage production gained importance with many ions reported to be useful: B, C, N, O, F, Si, P, Ti, Cu, Ni, and Ag.
Barfoot et al. [311] studied the damage built-up during implantation with 1 MeV He+ (2.0 × 10¹⁵ and 2.4 × 1016 cm−2) and annealing induced recovery by in-situ RBS/C. Varying the implantation temperature between 40 and 140 °C resulted in a decrease of the Nb-lattice disorder with increasing temperature. In all cases a saturation of the damage was observed at about 1 × 10¹⁶ He+ cm−2 coinciding with the value found for optimal waveguide performance. Further, the best annealing temperature was determined to be about 180 °C. Williams et al. [312] investigated similar waveguides (implanted with 1.7 MeV He+, 1.5 × 10¹⁵ and 2.0 × 1016 cm−2, RT; annealed at 175 °C and 400 °C) by NRA using the 7Li(p,α)4He reaction. A comparison indicated among the NRA/C spectra indicated a lithium movement towards the nuclear damage region during annealing. The authors suggest that this effect is responsible for the increase in the extraordinary index in the surface region.
Low-energy He+-implantation (50 keV, 2.0 × 10¹⁵ and 2.4 × 1016 cm−2) performed at temperatures of −80 °C, −30 °C, 25 °C and 80 °C has been studied by Al-Chalabi et al. [313] employing RBS/C and HIERD. The damage in the sample implanted at −80 °C appeared strongly enhanced while no difference between those implanted at −30 °C and 80 °C was detected. Li- and H-profiles obtained from the HIERD data indicate a loss of lithium in the implanted layer that is compensated by the incorporation of hydrogen. The lithium concentration reduction was found to increase with increasing fluence and implantation temperature.
Kling et al. [314] studied the annealing temperature dependence of the lattice damage in y-cut LN using RBS/C. Samples were implanted at room temperature with 20 keV He+ to a fluence of 1 × 1016 cm−2 or with 25 keV Li+ (1 × 1016 cm−2)—that yield the same damage profile—in order to check for the chemical influence of the implant. Annealing was performed under wet oxygen atmosphere for 10 min at five different temperatures (150–350 °C). At first, an increase of the damage during the heat treatment was observed with increasing temperature reaching a maximum at 270 °C with an apparent activation energy of 0.14 eV, as depicted in Figure 28. For Li-implanted samples an almost complete recovery of the lattice has been observed at this temperature indicating that He-implantation induces fundamentally different damage structures. A further increase of temperature induced a decrease in the number of defects with a much larger activation energy of 1.3 eV. This two-phase behavior resembles closely that observed for He-implantation in silicon [315]. An additional TEM study on the same samples annealed at 270 °C revealed the existence of platelet voids in the depth region at which the He ions were stopped. This region forms naturally a layer of low refractive index.
The annealing behavior of LN implanted with 800 keV He+ ions at very low temperature (−173 °C) to fluences of 5 × 10¹⁵ and 1 × 1016 cm−2 was the topic of a study of Gischkat et al. [316]. RBS/C measurements were performed at implantation temperature, at room temperature and after heat treatments at 250 °C and 300 °C in air. An apparently higher defect concentration observed in x-cut samples with respect to z-cut material was observed. As discussed in the Section 3.3 this anisotropy is due to the dislocation of Nb to the free octahedron site during implantation leading to different defect geometries in terms of channeling for the two directions. The dechanneling effect due to defects was observed to decrease with heat treatment for the low-fluence case and to increase for the high-fluence case. In the latter case, the enhancement was attributed to the formation of dislocation loops.
Besides helium, the implantation of nitrogen has already been explored in 1980s with view to its applications in optical waveguides [99,100]. Damage profiles for samples implanted with 200 keV N+ with fluences between 5 × 10¹⁴ and 2 × 1016 cm−2 were determined by RBS/C and correlated with the refractive index of the material. The formation of optically isotropic waveguide by amorphization due to electronic damage formation of a surface layer by implantation of high-energy (5 MeV and 7.5 MeV) Si+ ions has been studied by Olivares et al. [117,317]. From RBS/C spectra for samples implanted with fluences ranging from 5 × 10¹³ to 1 × 1015 cm−2 the authors determined threshold values for the amorphization and the associated electronic stopping power. Similar studies have also been performed for H [318], O [111,319,320,321] and F [116].
Optical waveguides can also be formed by high-fluence implantation of Ti with subsequent annealing/diffusion treatment. Bremer et al. [322] implanted y-cut LN with 200 keV Ti to fluences of 2.5 × 1017 cm−2 and 4 × 1017 cm−2 at liquid nitrogen temperature, room temperature and 350 °C. The samples underwent subsequent heat treatment at 1000 °C under wet oxygen atmosphere for 2 to 8 h. RBS/C studies demonstrated a good crystal lattice recovery was achieved in all cases for long annealing times but that a higher implantation temperature favors the recrystallization process. Optical waveguide properties were observed for all samples.
A technique related to implantation is ion beam mixing. A LN sample plated with a 40 nm metallic Ti layer has been irradiated with 3 MeV Ti+ ions at a fluence of 1 × 1016 cm−2 by Bremer et al. [266]. After removal of excess Ti from the surface the sample was annealed at 1000 °C under wet oxygen atmosphere to achieve recrystallization. The SIMS profile measurement showed a Ti profile with a steady slope reaching deep into the bulk material which differs strongly from the Gaussian profiles found in indiffused waveguides.
5.4. Combination of Techniques
The combination of the proton-exchange and the implantation technique produces interesting results. For samples subjected first to a He+ implantation (200 keV, 3 × 1016 cm−2) and then undergoing a proton exchange treatment the hydrogen indiffusion is strongly enhanced [323]. It appears that the damage introduced by ion implantation process facilitates the incorporation of the hydrogen. For the inverse treatment sequence, it was observed that a proton-exchanged sample subsequently implanted with 6 MeV O+ at a fluence of 6 × 1014 cm−2 is fully amorphized while PE-only and implantation-only samples show only minor damage [324]. Obviously, the proton-exchange process leads to a more fragile lattice increasing the susceptibility to lattice disorder.
5.5. Interaction with Optical Active Dopants
For optical waveguide lasers the absence of interferences between the waveguide formation process and the optically active dopants is mandatory. Therefore lattice site location and crystal structure studies for several rare earths in bulk and processed waveguide materials have been performed. Herreros et al. [325,326] compared the lattice sites for LiNbO3:Tm,Mg and LiNbO3:Er,Mg in as-grown and ion-implanted (2.6 and 2.0 MeV He+, respectively, 2 × 1016 cm−2; annealing: 250 °C, 30 min, air) samples. Angular scans for an axial direction demonstrated that the lattice sites of Tm and Er stay unaltered after waveguide fabrication. The same authors also studied the structural differences in waveguides fabricated by proton-exchange (benzoic acid, 300 °C, 20 h) and by He+ implantation (2 MeV, 2 × 1016 cm−2) in LiNbO3:Nd,Mg using RBS/C. Again, the results show that ion-implanted waveguides essentially maintain their properties while proton-exchanged present a larger deterioration [327]. Cajzl et al. [328] reported on the influence of the three waveguide fabrication methods (Ti-diffusion, proton-exchange and ion implantation) on the lattice site of erbium. Angular RBS scans confirm that none of the methods has any measurable influence on the position of the Er. These results indicate that rare-earth ions are successfully incorporated of into LN waveguides.
6. Conclusions
The relevance of nuclear techniques in the investigation of defect structures in modern materials has been demonstrated for the case of LN, presently one of the most important optoelectronic materials. It has been shown that the techniques originally developed for a simple crystal system can be successfully transferred to complex cases.
In the case of the intrinsic defect structure of congruent LN the combination of Ion Beam Analysis and Perturbed Angular Correlation studies delivered evidence for an additional lattice site in the Li-octahedron. The features of this site observed by nuclear techniques support the interpretation that the excess Nb is incorporated through ilmenite-type stacking faults dispersed in the crystal lattice.
Channeling measurements are found to be the method of choice for the characterization of ion implantation induced damage and its recovery laying the basis for the theoretical interpretation of damage formation in oxides.
The determination of lattice sites for a large number of elements, including the role of co-doping furnishes pertinent information for future engineering of LN by introduction of foreign atoms. It was demonstrated that the main factor determining the occupation of a Li- or a Nb-octahedron by a dopant is the valence state. Divalent, trivalent and tetravalent ions occupy—with the single exception of Cr, the Li-octahedron, pentavalent and hexavalent the Nb.
Depth profiling and defect characterization in optical waveguides by ion beam methods is essential for the development of opto-electronic devices.
Author Contributions
Conceptualization, writing, review and editing: A.K., J.G.M. All authors have read and agreed to the published version of the manuscript.
Funding
This research was partially funded by Fundação para a Ciência e Tecnologia, Portugal, through project UIDB/04349/2020 of Centro de Ciências e Tecnologias Nucleares.
Institutional Review Board Statement
Not applicable.
Informed Consent Statement
Not applicable.
Data Availability Statement
Not applicable.
Acknowledgments
The authors gratefully acknowledge José Carvalho Soares (University of Lisbon, Portugal) and Fernando Agulló-López (Universidad Autónoma de Madrid, Spain) for their guidance and support. Juan Antonio Sanz-García, Maria Dolores Serrano and Ernesto Diéguez (Universidad Autónoma de Madrid, Spain) and Barbara Christa Grabmaier (Siemens AG, Germany), Ágnes Péter and Katalin Polgár (Hungarian Academy of Sciences, Hungary) are gratefully acknowledged for the many high-quality lithium niobate crystals supplied over the years. Reiner Vianden (Helmholtz-Institut für Strahlen- und Kernphysik, University of Bonn, Germany) is gratefully acknowledged for the local support to perform PAC measurements. Pier Giorgio Rancoita (Istituto Nazionale di Fisica Nucleare, Milano-Bicocca, Italy) is gratefully acknowledged for granting access to the SR-NIEL web platform.
Conflicts of Interest
The authors declare no conflict of interest.
References
- Kong, Y.; Bo, F.; Wang, W.; Zheng, D.; Liu, H.; Zhang, G.; Rupp, R.; Xu, J. Recent progress in lithium niobate: Optical damage, defect simulation, and on-chip devices. Adv. Mater. 2020, 32, 1806452. [Google Scholar] [CrossRef]
- Volk, T.; Wöhlecke, M. Lithium Niobate: Defects, Photorefraction and Ferroelectric Switching; Springer: Berlin, Germany, 2008. [Google Scholar]
- Shur, V.Y.; Akhmatkhanov, A.R.; Baturin, I.S. Micro- and nano-domain engineering in lithium niobate. Appl. Phys. Rev. 2015, 2, 040604. [Google Scholar] [CrossRef]
- Arizmendi, L. Photonic applications of lithium niobate crystals. Phys. Stat. Sol. 2004, 201, 253–283. [Google Scholar] [CrossRef]
- Alford, T.L.; Feldman, L.C.; Mayer, J.W. Fundamentals of Nanoscale Film Analysis; Springer Science and Business Media Inc.: Berlin/Heidelberg, Germany, 2007; ISBN 978-0-387-29260-1. [Google Scholar]
- Nastasi, M.; Mayer, J.W.; Wang, Y. (Eds.) Ion Beam Analysis—Fundamentals and Applications; CRC Press: Boca Raton, FL, USA; Taylor & Francis Group: Boca Raton, FL, USA, 2014; ISBN 978-1-4398-4639-1. [Google Scholar]
- Nastasi, M.; Wang, Y. (Eds.) Handbook of Modern Ion Beam Materials Analysis, 2nd ed.; Cambridge University Press: Cambridge, UK, 2010; Volume 2, ISBN 9781605112176. [Google Scholar]
- Verma, H.R. Atomic and Nuclear Analytical Methods; Springer: Berlin, Germany, 2007; ISBN 3-540-30277-8. [Google Scholar]
- Chu, W.-K.; Mayer, J.W.; Nicolet, M.A. Backscattering Spectrometry; Elsevier Inc.: Amsterdam, The Netherlands, 1978; ISBN 978-0-12-173850-1. [Google Scholar]
- Amsel, G.; Lanford, W.A. Nuclear Reaction Techniques in Materials Analysis. Ann. Rev. Nucl. Part. Sci. 1984, 34, 435–460. [Google Scholar] [CrossRef]
- Johansson, S.A.E.; Campbell, J.L. (Eds.) Particle-Induced X-Ray Emission Spectrometry (PIXE); Wiley & Sons: Hoboken, NJ, USA, 1995; ISBN 978-0-471-58944-0. [Google Scholar]
- Gemmell, D.S. Channeling and Related Effects in the Motion of Charged Particles through Crystals. Rev. Mod. Phys. 1974, 46, 129–235. [Google Scholar] [CrossRef]
- Morgan, D.V. Channeling: Theory, Observation and Applications; Wiley & Sons: Hoboken, NJ, USA, 1973; ISBN 978-0471615101. [Google Scholar]
- Van der Heide, P. Secondary Ion Mass Spectrometry: An Introduction to Principles and Practices; Wiley & Sons: Hoboken, NJ, USA, 2014; ISBN 978-1-118-48048-9. [Google Scholar]
- Lanford, W.A. Analysis for Hydrogen by Nuclear Reaction and Energy Recoil Detection. Nucl. Instr. Meth. B 1992, 66, 65–82. [Google Scholar] [CrossRef]
- Bik, W.M.A.; Habraken, F.H.P.M. Elastic Recoil Detection. Rep. Prog. Phys. 1983, 56, 859–902. [Google Scholar] [CrossRef]
- Geiger, H.; Marsden, E. On a diffuse reflection of the α-particles. Proc. R. Soc. Lond. A 1909, 82, 495–500. [Google Scholar] [CrossRef]
- Doolittle, L. Algorithms for the rapid simulation of Rutherford backscattering spectra. Nucl. Instr. Meth. B 1985, 9, 344–351. [Google Scholar] [CrossRef]
- Barradas, N.P.; Jeynes, C.; Webb, R.P. Simulated annealing analysis of Rutherford backscattering data. Appl. Phys. Lett. 1997, 71, 291–293. [Google Scholar] [CrossRef] [Green Version]
- Swanson, M. The Study of Lattice Defects by Channeling. Rep. Prog. Phys. 1982, 45, 47–93. [Google Scholar] [CrossRef]
- Gärtner, K. Modified master equation approach of axial dechanneling in perfect compound crystals. Nucl. Instr. Meth. B 2005, 227, 522–530. [Google Scholar] [CrossRef]
- Smulders, P.J.M.; Boerma, D.O. Computer Simulation of Channeling in Single Crystals. Nucl. Instr. Meth. B 1987, 29, 471–489. [Google Scholar] [CrossRef]
- Rebouta, L.; Smulders, P.J.M.; Boerma, D.O.; Agulló-López, F.; da Silva, M.F.; Soares, J.C. Ion-Beam Channeling Yields of Host and Impurity Atoms in LiNbO3: Computer Simulation. Phys. Rev. B 1993, 48, 3600–3610. [Google Scholar] [CrossRef]
- Kling, A. CASSIS—A New Monte-Carlo Computer Program for Channeling Simulation of RBS, NRA and PIXE. Nucl. Instr. Meth. B 1995, 102, 141–144. [Google Scholar] [CrossRef]
- Kling, A.; Soares, J.C.; da Silva, M.F. Computer Simulation of Channeling Spectra with the CASSIS Program. Rad. Eff. Def. Solids 1997, 141, 53–61. [Google Scholar] [CrossRef]
- Kling, A.; Soares, J.C.; da Silva, M.F. Simulation of Channeling in Crystals with Defects Using the CASSIS Code. Nucl. Instr. Meth. B 1999, 153, 457–460. [Google Scholar] [CrossRef]
- Kling, A. The refurbished CASSIS code for channeling simulations. Nucl. Instr. Meth. B 2012, 273, 88–90. [Google Scholar] [CrossRef]
- Soares, J.C. Microscopic characterization of materials by ion beam and hyperfine interaction analysis. Nucl. Instr. Meth. B 1992, 64, 215–220. [Google Scholar] [CrossRef]
- Marques, J.G.; Correia, J.G.; Melo, A.A.; da Silva, M.F.; Soares, J.C. A four-detector spectrometer for e--γ PAC on-line with the ISOLDE-CERN isotope separator. Nucl. Instr. Meth. B 1995, 99, 645–648. [Google Scholar] [CrossRef]
- Fernandes, A.C.; Santos, J.P.; Marques, J.G.; Kling, A.; Ramos, A.R.; Barradas, N.P. Validation of the Monte Carlo model supporting core conversion of the Portuguese Research Reactor (RPI) for neutron fluence rate determinations. Ann. Nucl. Ener. 2010, 37, 1139–1145. [Google Scholar] [CrossRef]
- Marques, J.G.; Kling, A.; de Jesus, C.M.; Soares, J.C.; da Silva, M.F.; Diéguez, E.; Agulló-López, F. Annealing recovery of neutron irradiated LiNbO3:Hf single crystals. Nucl. Instr. Meth. B 1998, 141, 326–331. [Google Scholar] [CrossRef]
- Schatz, G.; Weidinger, A. Nuclear Condensed Matter Physics; John Wiley and Sons: Chichester, UK, 1996; ISBN 0471954799. [Google Scholar]
- Schwarz, K.; Blaha, P. Electronic structure of solids and surfaces with WIEN2k. In Practical Aspects of Computational Chemistry I; Leszczynski, J., Shukla, M., Eds.; Springer: Berlin, Germany, 2012; pp. 191–207. [Google Scholar]
- Marques, J.G.; Lorenz, K. Lattice location of Hf and its interaction with other impurities in LiNbO3: A review. Opt. Eng. 2014, 53, 060901. [Google Scholar] [CrossRef]
- Reisman, A.; Holtzberg, F. Heterogeneous Equilibria in the Systems Li2O-, Ag2O-Nb2O5 and Oxide-Models. J. Am. Chem. Soc. 1958, 80, 6503–6507. [Google Scholar] [CrossRef]
- Peterson, G.E.; Bridenbaugh, P.M.; Green, P. NMR study of ferroelectric LiNbO3 and LiTaO3 I. J. Chem. Phys. 1967, 46, 4009–4014. [Google Scholar] [CrossRef]
- Peterson, G.E.; Bridenbaugh, P.M. NMR study of ferroelectric LiNbO3 and LiTaO3 II. J. Chem. Phys. 1968, 48, 3402–3406. [Google Scholar] [CrossRef]
- Peterson, G.E.; Carruthers, J.R. 93Nb NMR as a sensitive and accurate probe of stoichiometry in LiNbO3 crystals. J. Sol. State Chem. 1969, 1, 98–99. [Google Scholar] [CrossRef]
- Halstead, T.K. Temperature dependence of the Li NMR spectrum and atomic motion in LiNbO3. J. Chem. Phys. 1970, 53, 3427–3435. [Google Scholar] [CrossRef]
- Blümel, J.; Born, E.; Metzger, T. Solid state NMR study supporting the lithium vacancy defect model in congruent lithium niobate. J. Phys. Chem. Sol. 1994, 55, 589–593. [Google Scholar] [CrossRef]
- Burns, G. Nuclear quadrupole resonance of Li in ferroelectric compounds. Phys. Rev. 1962, 127, 1193–1197. [Google Scholar] [CrossRef]
- Schempp, E.; Peterson, G.E.; Carruthers, J.R. 93Nb nuclear quadrupole resonance investigation of LiNbO3. J. Chem. Phys. 1970, 53, 306–311. [Google Scholar] [CrossRef]
- Keune, W.; Date, S.K.; Dézsi, I.; Gonser, U. Mössbauer-effect study of Co57 and Fe57 impurities in ferroelectric LiNbO3. J. Appl. Phys. 1975, 46, 3914–3924. [Google Scholar] [CrossRef]
- Peterson, G.E.; Carnevale, A. 93Nb NMR linewidths in nonstoichiometric lithium niobate. J. Chem. Phys. 1972, 56, 4848–4851. [Google Scholar] [CrossRef]
- Douglass, D.C.; Peterson, G.E.; McBrierty, V.J. Reexamination of the local electric field gradients in LiNbO3. Phys. Rev. B 1989, 40, 10694–10703. [Google Scholar] [CrossRef] [PubMed]
- Yatsenko, A.Y.; Ivanova, E.N.; Sergeev, N.A. NMR Study of Defects in Congruent LiNbO3. 1. “Unoverlapping” Defects. Phys. B 1997, 240, 254–262. [Google Scholar] [CrossRef]
- Yatsenko, A.Y.; Ivanova-Maksimova, H.M.; Sergeev, N.A. NMR Study of Intrinsic Defects in Congruent LiNbO3. 2. “Overlapping” Defects. Physica B 1998, 254, 256–259. [Google Scholar] [CrossRef]
- Yatsenko, A.; Maksimova, H.; Sergeev, N.A. NMR Study of Intrinsic Defects in Congruent Lithium Niobate. Cryst. Res. Technol. 1999, 34, 709–713. [Google Scholar] [CrossRef]
- Rebouta, L.; Da Silva, M.F.; Soares, J.C.; Sanz-Garcia, J.A.; Diéguez, E.; Agulló-López, F. Combined RBS/Channeling and PAC studies of hafnium doped LiNbO3. Nucl. Instr. Meth. B 1990, 45, 495–498. [Google Scholar] [CrossRef]
- Catchen, G.L.; Spaar, D.M. Order-disorder effects in the phase transitions of LiNbO3 and LiTaO3 measured by perturbed-angular-correlation spectroscopy. Phys. Rev. B 1991, 44, 12137–12145. [Google Scholar] [CrossRef] [PubMed]
- Davis, J.; Tinet, D.; Fripiat, J.J.; Amarilla, J.M.; Casal, B.; Ruis-Hitzky, E. 51V and 93Nb high resolution NMR study of NbVO5. J. Mat. Res. 1991, 6, 393–400. [Google Scholar] [CrossRef]
- Lapina, O.B.; Khabibulin, D.F.; Romanenko, K.V.; Gan, Z.; Zue, M.G.; Krasil’nikov, V.N.; Federov, V.E. 93Nb NMR chemical shift scale for niobia systems. Sol. State Nucl. Magn. Resonance 2005, 28, 204–224. [Google Scholar] [CrossRef]
- Hauer, B.; Vianden, R.; Marques, J.G.; Barradas, N.P.; Correia, J.G.; Melo, A.A.; Soares, J.C.; Agulló-López, F.; Diéguez, E. Electric-field gradients at the 111In and 111mCd in undoped and Mg-doped LiNbO3. Phys. Rev. B 1995, 51, 6208–6214. [Google Scholar] [CrossRef] [Green Version]
- Forker, M. The problematic of the derivation of the electric field gradient asymmetry parameter from TDPAC measurements or Mössbauer spectroscopy in imperfect crystal lattices. Nucl. Instr. Meth. 1973, 106, 121–126. [Google Scholar] [CrossRef]
- Kitamura, K.; Yamamoto, J.K.; Iyi, N.; Kimura, S.; Hayashi, T. Stoichiometric LiNbO3 single crystal growth by double crucible Czochralski method using automatic powder supply system. J. Cryst. Growth 1992, 116, 327–332. [Google Scholar] [CrossRef]
- Bordui, P.F.; Norwood, R.G.; Jundt, D.H.; Fejer, M.M. Preparation and characterization of off-congruent lithium niobate crystals. J. Appl. Phys. 1992, 71, 875–879. [Google Scholar] [CrossRef] [Green Version]
- Polgár, K.; Péter, Á.; Kovács, L.; Corradi, G.; Szaller, Z. Growth of stoichiometric LiNbO3 single crystals by top seeded solution growth method. J. Cryst. Growth 1997, 177, 211–216. [Google Scholar] [CrossRef]
- Serrano, M.D.; Bermúdez, V.; Arizmendi, L.; Diéguez, E. Determination of the Li/Nb ratio in LiNbO3 crystals grown by Czochralski method with K2O added to the melt. J. Cryst. Growth 2000, 210, 670–676. [Google Scholar] [CrossRef]
- Földvári, I.; Polgár, K.; Voszka, R.; Balasanyan, R.N. A simple method to determine the real composition of LiNbO3 crystals. Cryst. Res. Tech. 1984, 19, 1659–1661. [Google Scholar] [CrossRef]
- Kling, A.; Marques, J.G.; Correia, J.G.; Da Silva, M.F.; Diéguez, E.; Agulló-López, F.; Soares, J.C. Study of structural differences between stoichiometric and congruent lithium niobate. Nucl. Instr. Meth. B 1996, 113, 293–295. [Google Scholar] [CrossRef] [Green Version]
- Kling, A.; Rebouta, L.; Marques, J.G.; Correia, J.G.; Da Silva, M.F.; Diéguez, E.; Agulló-López, F.; Soares, J.C. Ion beam channeling and hyperfine interaction analysis for the characterization of stoichiometry and anti-site population in LiNbO3. Nucl. Instr. Meth. B 1996, 118, 622–625. [Google Scholar] [CrossRef] [Green Version]
- Gärtner, K.; Hehl, K.; Schlotzhauer, G. Axial dechanneling: II. Point defects. Nucl. Instr. Meth. B 1984, 4, 55–62. [Google Scholar] [CrossRef]
- Marques, J.G.; Kling, A.; Soares, J.C.; Da Silva, M.F.; Vianden, R.; Polgár, K.; Diéguez, E.; Agulló-López, F. Structural defects in congruent and near-stoichiometric LiNbO3. Rad. Eff. Def. Solids 1999, 150, 233–236. [Google Scholar] [CrossRef]
- Nassau, K.; Lines, M.E. Stacking-fault model for stoichiometry deviations in LiNbO3 and LiTaO3 and the effect on the Curie temperature. J. Appl. Phys. 1970, 41, 533–537. [Google Scholar] [CrossRef]
- Smyth, D.M. Defects and transport in LiNbO3. Ferroelectrics 1983, 50, 93–102. [Google Scholar] [CrossRef]
- Smyth, D.M. Defect Chemistry of LiNbO3. In Proceedings of the Sixth IEEE International Symposium on Applications of Ferroelectrics, Bethlehem, PA, USA, 8–11 June 1986; Wood, V.E., Ed.; IEEE: Piscataway, NJ, USA, 1986; pp. 115–117. [Google Scholar] [CrossRef]
- Donnerberg, H.; Tomlinson, S.M.; Catlow, C.R.A.; Schirmer, O.F. Computer simulation studies of intrinsic defects in LiNbO3 crystals. Phys. Rev. B 1989, 40, 11909–11916. [Google Scholar] [CrossRef]
- Molière, G. Theorie der Streuung schneller geladener Teilchen I. Einzelstreuung am abgeschirmten Coulomb-Feld. Z. Natur. A 1947, 2, 133–145. [Google Scholar] [CrossRef]
- Navrotsky, A. Energetics and crystal chemical systematics among ilmenite, lithium niobate, and perovskite structures. Chem. Mat. 1998, 10, 2787–2793. [Google Scholar] [CrossRef]
- Yusa, H.; Akaogi, M.; Sata, N.; Kojitani, H.; Yamamoto, R.; Ohishi, Y. High-pressure transformations of ilmenite to perovskite, and lithium niobate to perovskite in zinc germanate. Phys. Chem. Min. 2006, 33, 217–226. [Google Scholar] [CrossRef]
- Kumada, N.; Ozawa, N.; Muto, F. LiNbO3 with ilmenite-type structure prepared via ion-exchange reaction. J. Sol. St. Chem. 1985, 57, 267–268. [Google Scholar] [CrossRef]
- Kumada, N.; Kinomura, N.; Muto, F. Crystal-structures of ilmenite type LiNbO3 and NaNbO3. J. Ceram. Soc. Japan 1990, 98, 384–388. [Google Scholar] [CrossRef] [Green Version]
- Mehta, A.; Navrotsky, A.; Kumada, N.; Kinomura, N. Structural transitions in LiNbO3 and NaNbO3. J. Solid State Chem. 1993, 102, 213–225. [Google Scholar] [CrossRef]
- Wiegel, M.; Blasse, G.; Navrotsky, A.; Mehta, A.; Kumada, N.; Kinomura, N. Luminescence of the ilmenite phase of LiNbO3. J. Sol. St. Chem. 1994, 109, 413–415. [Google Scholar] [CrossRef]
- Corradi, G.; Kovács, L.; Zaritskii, I.M. Optical absorption edge and some shallow donor levels in LiNbO3 systems. Rad. Eff. Def. Sol. 1999, 150, 211–219. [Google Scholar] [CrossRef]
- Baran, E.J.; Botto, I.L.; Muto, F.; Kumada, N.; Kinomura, N. Vibrational spectra of the ilmenite modifications of LiNbO3 and NaNbO3. J. Mat. Sci. Lett. 1986, 5, 671–672. [Google Scholar] [CrossRef]
- Kong, Y.; Xu, J.; Chen, X.; Zhang, C.; Zhang, W.; Zhang, G. Ilmenite-like stacking defect in nonstoichiometric lithium niobate crystals investigated by Raman scattering spectra. J. Appl. Phys. 2000, 87, 4410–4414. [Google Scholar] [CrossRef]
- Lengyel, K.; Kovács, L.; Péter, Á.; Polgár, K.; Corradi, G. The effect of stoichiometry and Mg doping on the Raman spectra of LiNbO3:Mg crystals. Appl. Phys. B 2007, 87, 317–322. [Google Scholar] [CrossRef]
- Abrahams, S.C.; Marsh, P. Defect structure dependence on composition in lithium niobate. Acta Crystal. 1986, 42, 61–68. [Google Scholar] [CrossRef]
- Glass, A.M. Dielectric, thermal, and pyroelectric properties of ferroelectric LiTaO3. Phys. Rev. 1968, 172, 564–571. [Google Scholar] [CrossRef]
- Birnie, D.P. Model for the ferroelectric transition in nonstoichiometric lithium niobate and lithium tantalate. J. Amer. Ceram. Soc. 1991, 74, 988–993. [Google Scholar] [CrossRef]
- Johnston, W.D.; Kaminow, I.P. Temperature dependence of Raman and Rayleigh scattering in LiNbO3 and LiTaO3. Phys. Rev. 1968, 168, 1045–1054. [Google Scholar] [CrossRef]
- Abrahams, S.C.; Buehler, E.; Hamilton, W.C.; Laplaca, S.J. Ferroelectric lithium tantalate-III. Temperature dependence of the structure in the ferroelectric phase and the paraelectric phase at 940 K. J. Phys. Chem. Sol. 1973, 34, 521–532. [Google Scholar] [CrossRef]
- Boysen, H.; Altdorfer, F. A neutron powder investigation of the high-temperature structure and phase transition in LiNbO3. Acta Crystal. B 1994, 50, 405–414. [Google Scholar] [CrossRef]
- Inbar, I.; Cohen, R.E. Comparison of the electronic structures and energetics of ferroelectric LiNbO3 and LiTaO3. Phys. Rev. B 1996, 53, 1193–1204. [Google Scholar] [CrossRef] [Green Version]
- Phillpot, S.R.; Gopalan, V. Coupled displacive and order-disorder dynamics in LiNbO3 by molecular-dynamics simulation. Appl. Phys. Lett. 2004, 84, 1916–1918. [Google Scholar] [CrossRef] [Green Version]
- Sanna, S.; Schmidt, W.G. Ferroelectric phase transition in LiNbO3: Insights from molecular dynamics. IEEE Trans. Ultrason. Ferroel. Freq. Control 2012, 59, 1925–1928. [Google Scholar] [CrossRef]
- Toyoura, K.; Ohta, M.; Nakamura, A.; Matsunaga, K. First-principles study on phase transition and ferroelectricity in lithium niobate and tantalate. J. Appl. Phys. 2015, 118, 064103. [Google Scholar] [CrossRef]
- Zhukov, A.P.; Soboleva, L.V.; Belyaev, L.M.; Volkov, A.F. Niobium-93, Lanthanum-139, and Tantalum-181 pure NQR in rare earth orthoniobates and lithium tantalate. Ferroelectrics 1978, 21, 601–604. [Google Scholar] [CrossRef]
- Löhnert, M.; Kaindl, G.; Wortmann, G.; Salomon, D. Temperature-induced changes of the electronic structure of ferroelectric LiTaO3. Phys. Rev. Lett. 1981, 47, 194–197. [Google Scholar] [CrossRef]
- De Wette, F.W.; Schacher, G.E. Electric field gradients in point-ion and uniform-background lattices II. Physical Review 1965, 137, A92–A94. [Google Scholar] [CrossRef]
- Shelyapina, M.G.; Kasperovich, V.S.; Shchegolev, B.F.; Charnaya, E.V. Cluster calculations of electric-field-gradients at the Ta Site for the ferroelectric LiTaO3 crystal. Ferroelectrics 2003, 282, 1–7. [Google Scholar] [CrossRef]
- Slotfeldt-Ellingsen, D. NMR study of the temperature dependence of the 7Li quadrupole coupling constant above and below the Curie temperature in ferroelectric LiTaO3. In Proceedings of the 17th Congress Ampere; Hovi, V., Ed.; North Holland Publishing Company: Amsterdam, The Netherlands, 1972; pp. 350–352. [Google Scholar]
- Slotfeldt-Ellingsen, D.; Pedersen, B. The structural phase transition in LiTaO3 studied by pulsed 7Li-NMR. Phys. Stat. Sol. 1974, 24, 191–195. [Google Scholar] [CrossRef]
- Catchen, G.L.; Adams, J.M.; Rearick, T.M. High-temperature partitioning of 181Hf-probe impurities between Li and group-V sites in LiNbO3 and LiTaO3. Phys. Rev. B 1992, 46, 2743–2749. [Google Scholar] [CrossRef]
- Tomov, T.; Engelmann, H.; Dézsi, I.; Gonser, U. Investigation of the ferroelectric phase transition in LiNbO3:Fe by Mössbauer spectroscopy. Solid State Commun. 1989, 69, 41–44. [Google Scholar] [CrossRef]
- Marques, J.G.; Kling, A.; De Jesus, C.M.; Soares, J.C.; Friedsam, P.; Freitag, K.; Vianden, R. Electric field gradients in the ferroelectric and paraelectric phases of LiTaO3. Hyperfine Interact. 1999, 120–121, 485–489. [Google Scholar] [CrossRef]
- Ohkubo, Y.; Murakami, Y.; Saito, T.; Yokohama, A.; Uerhara, S.; Kawase, Y. Mechanism of the ferroelectric phase transitions in LiNbO3 and LiTaO3. Phys. Rev. B 2002, 65, 052107. [Google Scholar] [CrossRef] [Green Version]
- Jetschke, S.; Karge, H.; Hehl, K. Anisotropic Effects in N+-Implanted LiNbO3. Phys. Stat. Sol. 1983, 77, 207–214. [Google Scholar] [CrossRef]
- Götz, G.; Karge, H. Ion Implantation into LiNbO3. Nucl. Instr. Meth. 1983, 209/210, 1079–1088. [Google Scholar] [CrossRef]
- Götz, G. Radiation Effects in Optoelectronic Materials. Rad. Eff. 1986, 98, 189–209. [Google Scholar] [CrossRef]
- Wendler, E.; Becker, G.; Rensberg, J.; Schmidt, E.; Wolf, S.; Wesch, W. Direction-Dependent RBS Channelling Studies in Ion Implanted LiNbO3. Nucl. Instr. Meth. B 2016, 379, 195–199. [Google Scholar] [CrossRef]
- Gischkat, T.; Schrempel, F.; Wesch, W. Ion-beam induced effects at 15 K in LiNbO3. Nucl. Instr. Meth. B 2008, 266, 2906–2909. [Google Scholar] [CrossRef]
- Bianconi, M.; Argiolas, N.; Bazzan, M.; Bentini, G.G.; Cerutti, A. Quantification of Nuclear Damage in High Energy Ion Implanted Lithium Niobate. Nucl. Instr. Meth. B 2007, 257, 597–600. [Google Scholar] [CrossRef]
- Schmidt, E.; Ritter, K.; Gärtner, K.; Wendler, E. Investigation of Li/Nb-Sublattices in Ion Implanted LiNbO3 by RBS and NRA in Channelling Configuration. Nucl. Instr. Meth. B 2017, 409, 126–132. [Google Scholar] [CrossRef]
- Schrempel, F.; Gischkat, T.; Hartung, H.; Kley, E.-B.; Wesch, W. Ion Beam Enhanced Etching of LiNbO3. Nucl. Instr. Meth. B 2006, 250, 164–168. [Google Scholar] [CrossRef]
- Jetschke, S.; Hehl, K. Diffusion and Recrystallization Processes during Annealing of N+- and P+-Implanted LiNbO3. Phys. Stat. Sol. 1985, 88, 193–205. [Google Scholar] [CrossRef]
- Canut, B.; Brenier, R.; Meftah, A.; Moretti, P.; Ould Salem, S.; Ramos, S.M.M.; Thevenard, P.; Toulemonde, M. Damage Induced in LiNbO3 Single Crystals by GeV Gadolinium Ions. Nucl. Instr. Meth. B 1994, 91, 312–316. [Google Scholar] [CrossRef]
- Canut, B.; Brenier, R.; Meftah, A.; Moretti, P.; Salem, S.O.; Pitaval, M.; Ramos, S.M.M.; Thevenard, P.; Toulemonde, M. Latent track formation in LiNbO3 single crystals irradiated by GeV uranium ions. Rad. Eff. Def. Sol. 1995, 136, 307–310. [Google Scholar] [CrossRef]
- Canut, B.; Ramos, S.M.M.; Brenier, R.; Thevenard, P.; Loubet, J.L.; Toulemonde, M. Surface Modifications of LiNbO3 Single Crystals Induced by Swift Heavy Ions. Nucl. Instr. Meth. B 1996, 107, 194–198. [Google Scholar] [CrossRef]
- Bentini, G.G.; Bianconi, M.; Chiarini, M.; Correra, L.; Sada, C.; Mazzoldi, P.; Argiolas, N.; Bazzan, M.; Guzzi, R. Effect of Low Dose High Energy O3+ Implantation on Refractive Index and Linear Electro-Optic Properties in X-Cut LiNbO3: Planar Optical Waveguide Formation and Characterization. J. Appl. Phys. 2002, 92, 6477–6483. [Google Scholar] [CrossRef]
- Bentini, G.G.; Bianconi, M.; Cerutti, A.; Chiarini, M.; Pennestrì, G.; Sada, C.; Argiolas, N.; Bazzan, M.; Mazzoldi, P.; Guzzi, R. Structural and Compositional Characterization of X-Cut LiNbO3 Crystals Implanted with High Energy Oxygen and Carbon Ions. Nucl. Instr. Meth. B 2005, 240, 174–177. [Google Scholar] [CrossRef]
- Bentini, G.G.; Bianconi, M.; Correra, L.; Chiarini, M.; Mazzoldi, P.; Sada, C.; Argiolas, N.; Bazzan, M.; Guzzi, R. Damage Effects Produced in the Nearsurface Region of X-cut LiNbO3 by Low Dose, High Energy Implantation of Nitrogen, Oxygen, and Fluorine Ions. J. Appl. Phys. 2004, 96, 242–247. [Google Scholar] [CrossRef]
- Bianconi, M.; Argiolas, N.; Bazzan, M.; Bentini, G.G.; Chiarini, M.; Cerutti, A.; Mazzoldi, P.; Pennestrì, G.; Sada, C. On the Dynamics of the Damage Growth in 5 MeV Oxygen-Implanted Lithium Niobate. Appl. Phys. Lett. 2005, 87, 072901. [Google Scholar] [CrossRef]
- Olivares, J.; García-Navarro, A.; García, G.; Agulló-López, F.; Agulló-Rueda, F.; García-Cabañes, A.; Carrascosa, M. Buried Amorphous Layers by Electronic Excitation in Ion-Beam Irradiated Lithium Niobate: Structure and Kinetics. J. Appl. Phys. 2007, 101, 033512. [Google Scholar] [CrossRef] [Green Version]
- Olivares, J.; García, G.; García-Navarro, A.; Agulló-López, F.; Caballero, O.; García-Cabanes, A. Generation of High-Confinement Step-Like Optical Waveguides in LiNbO3 by Swift Heavy Ion-Beam Irradiation. Appl. Phys. Lett. 2005, 86, 183501. [Google Scholar] [CrossRef] [Green Version]
- Olivares, J.; García, G.; Agulló-López, F.; Agulló-Rueda, F.; Kling, A.; Soares, J.C. Generation of Amorphous Surface Layers in LiNbO3 by Ion Beam-Irradiation: Thresholding and Boundary Propagation. Appl. Phys. A 2005, 81, 1465–1469. [Google Scholar] [CrossRef] [Green Version]
- Rivera, A.; Olivares, J.; Crespillo, M.L.; García, G.; Bianconi, M.; Agulló-López, F. Assessment of Swift-Ion Damage by RBS/C: Determination of the Amorphization Threshold. Nucl. Instr. Meth. B 2009, 267, 1460–1463. [Google Scholar] [CrossRef]
- Ramos, S.M.M.; Canut, B.; Ambri, M.; Bonardi, N.; Pitaval, M.; Bernas, H.; Chaumont, J. Defect creation in LiNbO3 irradiated by medium masses ions in the electronic stopping power regime. Rad. Eff. Def. Sol. 1998, 143, 299–309. [Google Scholar] [CrossRef]
- Wesch, W.; Rensberg, J.; Schmidt, M.; Wendler, E. Damage evolution in LiNbO3 due to Electronic Energy Deposition below the Threshold for Direct Amorphous Track Formation. J. Appl. Phys. 2019, 126, 125105. [Google Scholar] [CrossRef]
- Agulló-López, F.; García, G.; Olivares, J. Lattice Preamorphization by Ion Irradiation: Fluence Dependence of the Electronic Stopping Power Threshold for Amorphization. J. Appl. Phys. 2005, 97, 093514. [Google Scholar] [CrossRef] [Green Version]
- Toulemonde, M.; Dufour, C.; Meftah, A.; Paumier, E. Transient thermal processes in heavy ion irradiation of crystalline inorganic insulators. Nucl. Instr. Meth. B 2000, 166–167, 903–912. [Google Scholar] [CrossRef]
- Agulló-López, F.; Climent-Font, A.; Muñoz-Martín, A.; Olivares, J.; Zucchiatti, A. Ion beam modification of dielectric materials in the electronic excitation regime: Cumulative and exciton models. Progr. Mat. Sci. 2016, 76, 1–58. [Google Scholar] [CrossRef]
- Agulló-López, F.; Mendez, A.; García, G.; Olivares, J.; Cabrera, J.M. Synergy between thermal spike and exciton decay mechanisms for ion damage and amorphization by electronic excitation. Phys. Rev. B 2006, 74, 174109. [Google Scholar] [CrossRef] [Green Version]
- García, G.; Rivera, A.; Crespillo, M.L.; Gordillo, N.; Olivares, J.; Agulló-López, F. Amorphization Kinetics under Swift Heavy Ion Irradiation: A Cumulative Overlapping-Track Approach. Nucl. Instr. Meth. B 2011, 269, 492–497. [Google Scholar] [CrossRef]
- Schrempel, F.; Steinbach, T.; Gischkat, T.; Wesch, W. Channeling irradiation of LiNbO3. Nucl. Instr. Meth. B 2008, 266, 2958–2961. [Google Scholar] [CrossRef]
- Steinbach, T.; Schrempel, F.; Gischkat, T.; Wesch, W. Influence of ion energy and ion species on ion channeling in LiNbO3. Phys. Rev. B 2008, 78, 184106. [Google Scholar] [CrossRef]
- Dowell, M.B.; Lefkowitz, I.; Taylor, G.W. Radiation damage in lithium niobate. Proc. 2nd Int. Meeting on Ferroelectricity, Kyoto, 1969. J. Phys. Soc. Japan 1970, 28, 442–444. [Google Scholar]
- Berg, N.; Speulstra, J. The operation of acoustic surface wave delay lines in a nuclear environment. IEEE Trans. Nucl. Sci. 1973, 20, 137–143. [Google Scholar] [CrossRef]
- Primak, W.; Anderson, T.T. Metamictization of lithium niobate by thermal neutrons. Nucl. Technol. 1976, 28, 235–248. [Google Scholar] [CrossRef]
- Primak, W.; Gavin, A.P.; Anderson, T.T.; Monahan, E. Stability of lithium niobate on irradiation at elevated reactors temperature. Nucl. Technol. 1977, 36, 79–84. [Google Scholar] [CrossRef]
- Marques, J.G. Evolution of nuclear fission reactors: Third generation and beyond. Energy Convers. Manag. 2010, 51, 1774–1780. [Google Scholar] [CrossRef]
- Giuliani, F.; Oliveira, C.; Collar, J.I.; Girard, T.A.; Morlat, T.; Limagne, D.; Marques, J.G.; Ramos, A.R.; Waysand, G. Response of SIMPLE SDDs to monochromatic neutron irradiations. Nucl. Instr. Meth. A 2004, 526, 348–358. [Google Scholar] [CrossRef]
- González, R.; Chen, Y.; Abraham, M.M. Transmutation-induced tritium in LiNbO3 single crystals. Phys. Rev. B 1988, 37, 6433–6435. [Google Scholar] [CrossRef]
- González, R.; Ballesteros, C.; Chen, Y.; Abraham, M.M. Diffusion of tritons, deuterons, and protons in LiNbO3 crystals. Phys. Rev. B 1989, 39, 11085–11092. [Google Scholar] [CrossRef] [PubMed]
- Verma, R.; Arunachalam, J.; Gangadharan, S.; Vyas, J.C.; Kothiyal, G.P.; Gupta, M.K. Trace characterisation of lithium niobate by neutron activation analysis. Fresenius J. Anal. Chem. 1992, 344, 261–264. [Google Scholar] [CrossRef]
- Brannon, P.J. Transient radiation-induced absorption at 1061 nm in LiNbO3 and MgO:LiNbO3. IEEE Trans. Nucl. Sci. 1994, 41, 642–647. [Google Scholar] [CrossRef]
- Marques, J.G.; Kling, A.; Soares, J.C.; Rebouta, L.; Da Silva, M.F.; Diéguez, E.; Agulló-López, F. Lattice site location of Hf in LiNbO3: Influence of dopant concentration and crystal stoichiometry. Nucl. Instr. Meth. B 1998, 136–138, 431–435. [Google Scholar] [CrossRef]
- Orlova, A.N.; Ped’ko, B.B.; Filinova, A.V.; Franko, N.Y.; Prokhorova, A.Y. Influence of gamma and gamma–neutron irradiation on the optical properties of LiNbO3 single crystals. Phys. Sol. State 2006, 48, 544–547. [Google Scholar] [CrossRef]
- Mandula, G.; Rupp, R.A.; Balaskó, M. Erasure of elementary holograms in LiNbO3:Fe by neutron irradiation. In Proceedings of the Holography 2005: International Conference on Holography, Optical Recording and Processing of Information; SPIE-International Society for Optics and Photonics: Bellingham, WA, USA, 2006; Volume 6252, p. 62520N. [Google Scholar] [CrossRef] [Green Version]
- Sha, G.; Harlow, C.; Chernatynskiy, A.; Daw, J.; Khafizov, M. In-situ measurement of irradiation behavior in LiNbO3. Nucl. Instr. Meth. B 2020, 472, 46–52. [Google Scholar] [CrossRef]
- Coltman, R.R.; Klabunde, C.E.; McDonald, D.L.; Redman, J.K. Reactor damage in pure metals. J. Appl. Phys. 1962, 33, 3509–3522. [Google Scholar] [CrossRef]
- Robinson, M.T. Basic physics of radiation damage production. J. Nucl. Mat. 1994, 216, 1–28. [Google Scholar] [CrossRef]
- Pritychenko, B.; Mughabghab, S.F. Neutron thermal cross sections, Westcott factors, resonance integrals, Maxwellian averaged cross sections and astrophysical reaction rates calculated from the ENDF/B-VII.1, JEFF-3.1.2, JENDL-4.0, ROSFOND-2010, CENDL-3.1 and EAF-2010 evaluated data libraries. Nucl. Data Sheets 2012, 113, 3120–3144. [Google Scholar] [CrossRef] [Green Version]
- Lorenz, K.; Marques, J.G.; Franco, N.; Alves, E.; Peres, M.; Correia, M.R.; Monteiro, T. Defect studies on fast and thermal neutron irradiated GaN. Nucl. Instr. Meth. B 2008, 266, 2780–2783. [Google Scholar] [CrossRef]
- Pelowitz, D.B. MCNPX User’s Manual Version 2.7, LA-CP-11-00438; Los Alamos National Laboratory: Los Alamos, NM, USA, 2011.
- Seitz, F. On the disordering of solids by action of fast massive particles. Discuss. Faraday Soc. 1949, 5, 271–282. [Google Scholar] [CrossRef]
- Nord, J.; Nordlund, K.; Keinonen, J. Molecular dynamics study of damage accumulation in GaN during ion beam irradiation. Phys. Rev. B 2003, 68, 184104. [Google Scholar] [CrossRef] [Green Version]
- Tsuchihira, H.; Oda, T.; Tanaka, S. Molecular-dynamics simulation of threshold displacement energies in lithium aluminate. Nucl. Instr. Meth. B 2011, 269, 1707–1711. [Google Scholar] [CrossRef]
- Lucas, G.; Pizzagalli, L. Ab initio molecular dynamics calculations of threshold displacement energies in silicon carbide. Phys. Rev. B 2005, 72, 161202. [Google Scholar] [CrossRef] [Green Version]
- Liu, B.; Xiao, H.Y.; Zhang, Y.; Aidhy, D.S.; Weber, W.J. Ab initio molecular dynamics simulations of threshold displacement energies in SrTiO3. J. Phys. Cond. Matt. 2013, 25, 485003. [Google Scholar] [CrossRef]
- Petersen, B.A. Low Energy Recoil Simulations in MgO, LiNbO3, and LiTaO3 Using Ab Initio Molecular Dynamics. PhD Thesis, University of Tennessee, Knoxville, TN, USA, 2017. [Google Scholar]
- Hogdson, E.R.; Agulló-López, F. Oxygen vacancy centres induced by electron irradiation in LiNbO3. Solid State Commun. 1987, 64, 965–968. [Google Scholar] [CrossRef]
- Hogdson, E.R.; Agulló-López, F. Displacement damage in LiNbO3. Nucl. Instr. Meth. B 1988, 32, 42–44. [Google Scholar] [CrossRef]
- Popov, A.I.; Kotomin, E.A.; Maier, J. Basic properties of the F-type centers in halides, oxides and perovskites. Nucl. Instr. Meth. B 2010, 268, 3084–3089. [Google Scholar] [CrossRef]
- Alenius, G.; Arnell, S.E.; Schale, C.; Wallander, E. Low spin states in 181Hf from the thermal neutron capture reaction. Phys. Scrip. 1971, 3, 105–110. [Google Scholar] [CrossRef]
- Sears, V.F. Neutron scattering lengths and cross sections. Neutron News 1992, 3, 26–37. [Google Scholar] [CrossRef]
- Nakagawa, T.; Shibata, K.; Kawasaki, H. Curves and Tables of Neutron Cross Sections in JENDL-3.3. JAERI-Data/Code 2002-020; Japan Atomic Energy Research Institute: Tokaimura, Japan, 2002. [Google Scholar]
- Molnar, G. (Ed.) Handbook of Prompt Gamma Activation Analysis; Springer: Berlin, Germany, 2003; ISBN 978-1402013041. [Google Scholar]
- Dale, C.J.; Marshall, P.W.; Summers, G.P.; Wolicki, E.A.; Burke, E.A. Displacement damage equivalent to dose in silicon devices. Appl. Phys. Lett. 1989, 54, 451–453. [Google Scholar] [CrossRef]
- Angelescu, T.; Vasilescu, A. Comparative radiation hardness results obtained from various neutron sources and the NIEL problem. Nucl. Instr. Meth. A 1996, 374, 85–90. [Google Scholar] [CrossRef]
- Lindhard, J.; Nielsen, V.; Scharff, M.; Thonsen, P.V. Integral equations governing radiation effects (Notes on atomic collisions III). Matematisk-Fysiske Meddelelser 1963, 33, 1–42. [Google Scholar]
- Akkerman, A.; Barak, J. New partition factor calculations for evaluating the damage of low energy ions in silicon. IEEE Trans. Nucl. Sci. 2006, 53, 3667–3674. [Google Scholar] [CrossRef]
- Boschini, M.J.; Rancoita, P.G.; Tacconi, M. SR-NIEL Calculator: Screened Relativistic (SR) Treatment for Calculating the Displacement Damage and Nuclear Stopping Powers for Electrons, Protons, Light- and Heavy- Ions in Materials (version 6.9.0); INFN sez Bicocca: Milan, Italy, 2020; Volume 10, Available online: http://www.sr-niel.org/ (accessed on 31 March 2021).
- Ashkin, A.; Boyd, G.D.; Dziedzic, J.M.; Smith, R.G.; Ballman, A.A.; Levinstein, J.J.; Nassau, K. Optically-Induced Refractive Index Inhomogenities in LiNbO3 and LiTaO3. Appl. Phys. Lett. 1966, 9, 72–74. [Google Scholar] [CrossRef]
- Zhong, G.G.; Jian, J.; Wu, Z.-K. Proceedings of the 11th International Quantum Electronics Conference; Cat. No. 80 CH 1561-0; IEEE: New York, NY, USA, 1980; p. 631. [Google Scholar]
- Bryan, D.A.; Gerson, R.; Tomaschke, H.E. Increased Optical Damage Resistance in Lithium Niobate. Appl. Phys. Lett. 1984, 44, 847–849. [Google Scholar] [CrossRef]
- Volk, T.R.; Pryalkin, V.I.; Rubinina, N.M. Optical-Damage-Resistant LiNbO3:Zn Crystal. Opt. Lett. 1990, 15, 996–998. [Google Scholar] [CrossRef]
- Yamamoto, J.K.; Kitamura, K.; Iyi, N.; Kimura, S.; Furukawa, Y.; Sato, M. Increased Optical Damage Resistance in Sc2O3-Doped LiNbO3. Appl. Phys. Lett. 1992, 61, 2156–2158. [Google Scholar] [CrossRef]
- Volk, T.R.; Rubinina, N.M. A New Optical Damage Resistant Impurity in Lithium Niobate Crystals: Indium. Ferroelectrics Lett. 1992, 14, 37–43. [Google Scholar] [CrossRef]
- Kokanyan, E.P.; Razzari, L.; Cristiani, I.; Degiorgio, V.; Gruber, J.B. Reduced Photorefraction in Hafnium-Doped Single-Domain and Periodically Poled Lithium Niobate Crystals. Appl. Phys. Lett. 2004, 84, 1880–1882. [Google Scholar] [CrossRef]
- Sun, L.; Guo, F.; Lv, Q.; Yu, H.; Li, H.; Cai, W.; Xu, Y.; Zhao, L. Increased Optical Damage Resistance of Zr:LiNbO3 Crystals. Cryst. Res. Technol. 2007, 42, 1117–1122. [Google Scholar] [CrossRef]
- Zhang, Q.; Feng, X. Defect Structures and Densities of Mg-Doped Lithium Niobate. Phys. Stat. Sol. 1990, 121, 429–435. [Google Scholar] [CrossRef]
- Liu, J.; Zhang, W.; Zhang, G. Defect Chemistry Analysis of the Defect Structure in Mg-Doped LiNbO3 Crystals. Phys. Stat. Sol. 1996, 156, 285–291. [Google Scholar] [CrossRef]
- Abdi, F.; Aillerie, M.; Bourson, P.; Fontana, M.D. Defect structure in Mg-doped LiNbO3: Revisited study. J. Appl. Phys. 2009, 106, 033519. [Google Scholar] [CrossRef]
- Iyi, N.; Kitamura, K.; Yajima, Y.; Kimura, S.; Furukawa, Y.; Sato, M. Defect Structure Model of MgO-Doped LiNbO3. J. Solid State Chem. 1995, 118, 148–152. [Google Scholar] [CrossRef]
- Donnerberg, H.J.; Tomlinson, S.M.; Catlow, C.R.A. Defects in LiNbO3, II. Computer Simulation. J. Phys. Chem. Solids 1991, 52, 201–210. [Google Scholar] [CrossRef]
- Donnerberg, H.J.; Tomlinson, S.M.; Catlow, C.R.A.; Schirmer, O.F. Computer-Simulation Studies of Extrinsic Defects in LiNbO3 Crystals. Phys. Rev. B 1991, 44, 4877–4883. [Google Scholar] [CrossRef]
- Donnerberg, H. Comments on the Defect Chemistry of Magnesium-Doped Lithium Niobate (LiNbO3). J. Solid State Chem. 1996, 123, 208–214. [Google Scholar] [CrossRef]
- Wöhlecke, M.; Volk, T.; Donnerberg, H. On the Role of Intrinsic Clusters in Damage-Resistant LiNbO3. Ferroelectr. Lett. Sect. 1997, 22, 53–58. [Google Scholar] [CrossRef]
- Kling, A.; Kollewe, D.; Grabmaier, B.C. Lattice site Investigations for Mg in LiNbO3 by Combined RBS-PIXE-NRA-Channeling Experiments. Nucl. Instr. Meth. B 1992, 64, 232–236. [Google Scholar] [CrossRef]
- Grabmaier, B.C.; Otto, F. Growth and Investigation of MgO-doped LiNbO3. J. Cryst. Growth 1986, 79, 682–688. [Google Scholar] [CrossRef]
- Grabmaier, B.C.; Otto, F. Growth of LiNbO3 Single Crystals for Optical Applications. Proc. SPIE 1986, 651, 2–6. [Google Scholar] [CrossRef]
- Sommerfeldt, R.; Holtmann, L.; Krätzig, E.; Grabmaier, B.C. Influence of Mg Doping and Composition on the Light-Induced Charge Transport in LiNbO3. Phys. Stat. Sol. 1988, 106, 89–98. [Google Scholar] [CrossRef]
- Koppitz, J.; Schirmer, O.F.; Wöhlecke, M.; Kuznetsov, A.I.; Grabmaier, B.C. Threshold Effects in LiNbO3:Mg Caused by Change of Electron-Lattice Coupling. Ferroelectrics 1989, 92, 233–241. [Google Scholar] [CrossRef]
- Grabmaier, B.C.; Wersing, W.; Koestler, W. Properties of Undoped and MgO-Doped LiNbO3; Correlation to the Defect Structure. J. Cryst. Growth 1991, 110, 339–347. [Google Scholar] [CrossRef]
- Schmidt, N.; Betzler, K.; Grabmaier, B.C. Composition dependence of the second harmonic phase-matching temperature in LiNbO3. Appl. Phys. Lett. 1991, 58, 34–35. [Google Scholar] [CrossRef]
- Nunomura, K.; Ishitani, A.; Matsubara, T.; Hayashi, I. Second Harmonic Generation in a Sputtered LiNbO3 Film on MgO. J. Crystal Growth 1978, 45, 355–360. [Google Scholar] [CrossRef]
- Kling, A.; Kollewe, D.; Grabmaier, B.C. Dependence of the 7Li(p,α)4He Minimum Yield on the Mg Concentration for Proton Channeling. Nucl. Instr. Meth. B 1994, 85, 490–493. [Google Scholar] [CrossRef]
- Feng, X.; Wang, D.; Zhang, J. NMR Spectra of Mg Nuclei in Mg-Doped LiNbO3 Crystals. Phys. Stat. Sol. 1990, 157, K127–K130. [Google Scholar] [CrossRef]
- Yatsenko, A.V.; Yevdokimov, S.V.; Sugak, D.Y.; Solskii, I.M. NMR Analysis of Mg Ion Localization in LiNbO3 Crystal. Acta Phys. Pol. A 2010, 117, 166–169. [Google Scholar] [CrossRef]
- Rebouta, L.; Soares, J.C.; da Silva, M.F.; Sanz-Garcia, J.A.; Diéguez, E.; Agulló-López, F. Lattice Sites for Eu, Hf and Nd in LiNbO3 by RBS/Channeling Experiments. Nucl. Instr. Meth. B 1990, 50, 428–430. [Google Scholar] [CrossRef]
- Marques, J.G.; Kling, A.; Rebouta, L.; da Silva, M.F.; Melo, A.A.; Soares, J.C.; Serrano, M.D.; Diéguez, E.; Agulló-López, F. Lattice Location of Hf in Near-stoichiometric LiNbO3: RBS/Channeling and PAC Studies. Mat. Sci. Forum 1997, 248/249, 395–398. [Google Scholar] [CrossRef]
- Rebouta, L.; da Silva, M.F.; Soares, J.C.; Santos, M.T.; Diéguez, E.; Agulló-López, F. Ion-Beam/Channeling Characterization of LiNbO3: Interaction between Impurity Sites. Rad. Eff. Def. Sol. 1995, 136, 137–139. [Google Scholar] [CrossRef]
- Rebouta, L.; da Silva, M.F.; Soares, J.C.; Santos, M.T.; Diéguez, E.; Agulló-López, F. Ion-Beam/Channeling Characterization of LiNbO3: Interaction between Impurity Sites. Opt. Mat. 1995, 4, 174–178. [Google Scholar] [CrossRef]
- Marques, J.G.; de Jesus, C.M.; Melo, A.A.; Soares, J.C.; Diéguez, E.; Agulló-López, F. PAC Study of the Interaction between Impurity Sites in LiNbO3 Doped with Hf and Mg. Hyperfine Interact. 1996, 1, 348–351. [Google Scholar]
- Dias, S.A.; Marques, J.G.; Correia, J.G.; Sanz, J.A.; Soares, J.C. The 181Hf/181Ta Probe in the Li and Nb Sites of Congruent LiNbO3 Co-Doped with Mg and Cr Ions Studied by PAC. Hyperfine Interact. 2004, 158, 323–328. [Google Scholar] [CrossRef]
- Kling, A.; Soares, J.C.; da Silva, M.F.; Rebouta, L.; Kollewe, D.; Krause, H.; Flagmeyer, R.-H.; Vogt, J. Determination of Impurity Lattice Sites in Single Crystals Using PIXE/channeling. X-Ray Spectrom. 1999, 28, 105–109. [Google Scholar] [CrossRef]
- Kovács, L.; Rebouta, L.; Soares, J.C.; da Silva, M.F.; Hage-Ali, M.; Stoquert, J.P.; Siffert, P.; Zaldo, C.; Szaller, Z.; Polgár, K. Lattice Site of Trivalent Impurities in Mg-Doped Lithium Niobate Crystals. Mat. Sci. Eng. B 1991, 9, 505–508. [Google Scholar] [CrossRef]
- Hesselink, L.; Orlov, S.S.; Bashaw, M.C. Holographic Data Storage Systems. Proc. IEEE 2004, 92, 1231–1280. [Google Scholar] [CrossRef] [Green Version]
- McMillen, D.K.; Hudson, T.D.; Wagner, J.; Singleton, J. Holographic Recording in Specially Doped Lithium Niobate Crystals. Opt. Express 1998, 2, 491–502. [Google Scholar] [CrossRef]
- Yue, X.; Adibi, A.; Hudson, T.; Buse, K.; Psaltis, D. Role of Cerium in Lithium Niobate for Holographic Recording. J. Appl. Phys. 2000, 87, 4051–4055. [Google Scholar] [CrossRef] [Green Version]
- Kong, Y.; Liu, S.; Xu, J. Recent Advances in the Photorefraction of Doped Lithium Niobate Crystals. Materials 2012, 5, 1954–1971. [Google Scholar] [CrossRef] [Green Version]
- Buse, K.; Adibi, A.; Psaltis, D. Non-Volatile Holographic Storage in Doubly Doped Lithium Niobate Crystals. Nature 1998, 393, 665–668. [Google Scholar] [CrossRef] [Green Version]
- Liu, F.; Kong, Y.; Ge, X.; Liu, H.; Liu, S.; Chen, S.; Rupp, R.; Xu, J. Improved Sensitivity of Nonvolatile Holographic Storage in Triply Doped LiNbO3:Zr,Cu,Ce. Opt. Express 2010, 18, 6333–6339. [Google Scholar] [CrossRef] [PubMed]
- Valyashko, E.G.; Varina, T.M.; Kuz’min, R.N.; Rubinina, N.M.; Smirnov, V.A.; Shagdarov, V.M. Spectroscopic properties of single crystals of lithium metaniobate containing iron and neodymium ions as impurity. J. Appl. Spectrosc. 1974, 21, 877–880. [Google Scholar] [CrossRef]
- Keune, W.; Date, S.K.; Gonser, U.; Bunzel, H. Mössbauer Effect Study of Fe57 Doped LiNbO3 and LiTaO3. Ferroelectrics 1976, 13, 443–445. [Google Scholar] [CrossRef]
- Kurz, H.; Krätzig, E.; Keune, W.; Engelmann, H.; Gonser, U.; Dischler, B.; Räuber, A. Photorefractive Centres in LiNbO3 Studied by Optical-, Mössbauer- and EPR-Methods. Appl. Phys. 1977, 12, 355–368. [Google Scholar] [CrossRef]
- Gonser, U.; Sakai, H.; Keune, W. Mössbauer Spectroscopy of 57Fe2+ Impurities in LiNbO3. J. Electrochem. Soc. 1976, 123, 1915–1917. [Google Scholar] [CrossRef]
- Becze-Deák, T.; Bottyán, L.; Corradi, G.; Korecz, L.; Nagy, D.L.; Polgár, K.; Sayed, S.; Spiering, H. Electron Trapping Centres and Cross Sections in LiNbO3 Studied by 57Co Mössbauer Emission Spectroscopy. J. Phys. Condens. Matt. 1999, 11, 6239–6250. [Google Scholar] [CrossRef]
- Becze-Deák, T.; Bottyán, L.; Corradi, G.; Korecz, L.; Nagy, D.L.; Polgár, K.; Sayed, S.; Spiering, H. 57Co Mössbauer Emission Study of LiNbO3, Fe:LiNbO3 and Mg:LiNbO3 in Various Thermochemical Reduction States. J. Radioanalyt. Nucl. Chem. 2000, 246, 33–37. [Google Scholar] [CrossRef]
- Rebouta, L.; da Silva, M.F.; Soares, J.C.; Hage-Ali, M.; Stoquert, J.P.; Siffert, P.; Sanz-García, J.A.; Diéguez, E.; Agulló-López, F. Lattice Site of Iron in LiNbO3(Fe3+) by the PIXE/Channeling Technique. Europhys. Lett. 1991, 14, 557–561. [Google Scholar] [CrossRef]
- Malovichko, G.I.; Grachev, V.G. Determination of Iron Group Impurity Positions in Ferroelectric LiNbO3 using nuclear-quadrupole splitting. Sov. Phys. Sol. State 1985, 27, 1678–1679. [Google Scholar]
- Zaltron, A.; Argiolas, N.; De Salvador, D.; Bazzan, M.; Ciampolillo, M.V.; Bacci, L.; Sada, C. Iron Site Location in Fe-Diffused Lithium Niobate Crystals by Combined RBS-PIXE-NRA Analysis. Nucl. Instr. Meth. B 2012, 275, 11–15. [Google Scholar] [CrossRef]
- Szilágy, E.; Becze-Deák, T.; Bottyán, L.; Kocsonya, A.; Kótai, E.; Nagy, D.L.; Kling, A.; Battistig, G.; Khan, N.Q.; Polgár, K. Lattice Site Determination of Co in Low Doped Congruent LiNbO3 Single Crystal Using PIXE/Channeling. Sol. State Commun. 2000, 115, 535–538. [Google Scholar] [CrossRef]
- Buchal, C.; Mantl, S.; Thomas, D.K. Channeling Investigation of the Lattice Location of Ti in Ti-Implanted Optical Waveguides in LiNbO3. Mat. Res. Soc. Symp. Proc. 1987, 100, 317–324. [Google Scholar] [CrossRef]
- Kollewe, D.; Kling, A.; Grabmaier, B.C.; Bremer, T.; Heiland, W.; Zimmermann, W. Lattice Site Location of Ti Diffused and Doped in LiNbO3. Phys. Lett. A 1992, 169, 177–180. [Google Scholar] [CrossRef]
- Hauer, B.; Vianden, R.; da Silva, M.F.; Rebouta, L.; Soares, J.C.; Diéguez, E.; Agulló-López, F. The Lattice Site of Ti in LiNbO3. J. Phys. Condens. Matter 1994, 6, 267–274. [Google Scholar] [CrossRef]
- Johnson, L.F.; Ballman, A.A. Coherent Emission from Rare Earth Ions in Electro-Optic Crystals. J. Appl. Phys. 1969, 40, 297–302. [Google Scholar] [CrossRef]
- Kovács, L.; Rebouta, L.; Soares, J.C.; da Silva, M.F. Lattice Site of Er in LiNbO3:Mg,Er Crystals. Rad. Eff. Def. Sol. 1991, 119–121, 445–450. [Google Scholar] [CrossRef]
- Kovács, L.; Rebouta, L.; Soares, J.C.; da Silva, M.F.; Hage-Ali, M.; Stoquert, J.P.; Siffert, P.; Sanz-García, J.A.; Corradi, G.; Szaller, Z.; et al. On the Lattice Site of Trivalent Dopants and the Structure of Mg2+--OH--M3+ Defects in LiNbO3:Mg Crystals. J. Phys.: Condens. Matter 1993, 5, 781–794. [Google Scholar] [CrossRef]
- Rebouta, L.; Soares, J.C.; da Silva, M.F.; Serrano, D.; Díeguez, E.; Agulló-López, F.; Tornero, J. Nonaxial Sites for Er in LiNbO3. Appl. Phys. Lett. 1997, 70, 1070–1072. [Google Scholar] [CrossRef]
- Lorenzo, A.; Jaffrezic, H.; Roux, B.; Boulon, G.; Bausá, L.E.; García Solé, J. Lattice Location of Pr3+ Ions in LiNbO3. Phys. Rev. B 1995, 52, 6278–6284. [Google Scholar] [CrossRef] [PubMed]
- Lorenzo, A.; Jaffrezic, H.; Roux, B.; Boulon, G.; García Solé, J. Lattice Location of Rare-Earth Ions in LiNbO3. Appl. Phys. Lett. 1995, 67, 3735–3737. [Google Scholar] [CrossRef]
- Lorenzo, A.; Loro, H.; Muñoz Santiuste, J.E.; Terrile, M.C.; Boulon, G.; Bausá, L.E.; García Solé, J. RBS/Channeling to Locate Active Ions in Laser Materials: Application to Rare Earth Activated LiNbO3. Opt. Mat. 1997, 8, 55–63. [Google Scholar] [CrossRef]
- García Solé, J.; Petit, T.; Jaffrezic, H.; Boulon, G. Lattice Location of the Non-Equivalent Nd3+ Ions in LiNbO3:Nd and LiNbO3:MgO:Nd. Europhys. Lett. 1993, 24, 719–724. [Google Scholar] [CrossRef]
- García-Solé, J.; Lorenzo, A.; Petit, T.; Boulon, G.; Roux, B.; Jaffrezic, H. Site Selective Spectroscopy and RBS/Channeling in Optically Active Ion Doped LiNbO3 crystals. J. Phys. IV 1994, 4, C4-293–C4-296. [Google Scholar]
- Rebouta, L.; Soares, J.C.; da Silva, M.F.; Sanz-García, J.A.; Diéguez, E.; Agulló-López, F. Lattice Site for Transition and Rare-Earth Impurities in LiNbO3 by Ion-Beam Methods. J. Mater. Res. 1992, 7, 130–135. [Google Scholar] [CrossRef]
- Camarillo, E.; Tocho, J.; Vergara, I.; Díeguez, E.; García-Solé, J.; Jaque, F. Optical Bands of Cr3+ induced by Mg2+ Ions in LiNbO3:Cr,Mg. Phys. Rev. B 1992, 45, 4600–4604. [Google Scholar] [CrossRef] [PubMed]
- Díaz-Caro, J.; García-Solé, J.; Bravo, D.; Sanz-García, A.; Lopez, F.J.; Jaque, F. MgO Codoping-Induced Change in the Site Distribution of Cr3+ Ions in LiNbO3. Phys. Rev. B 1996, 54, 13042–13046. [Google Scholar] [CrossRef] [PubMed]
- Kling, A.; Soares, J.C.; da Silva, M.F. Optical and Structural Properties of Chromium Implanted Lithium Niobate—Cluster Formation and Substitutional Incorporation. Nucl. Instr. Meth. B 1999, 148, 1044–1048. [Google Scholar] [CrossRef]
- Almeida, J.M.; Boyle, G.; Leite, A.P.; De La Rue, R.M.; Ironside, C.N.; Caccavale, F.; Chakraborty, P.; Mansour, I. Chromium Diffusion in Lithium Niobate for Active Optical Waveguides. J. Appl. Phys. 1995, 78, 2193–2197. [Google Scholar] [CrossRef]
- Macfarlane, P.I.; Holliday, K.; Nicholls, J.F.H.; Henderson, B. Characterization of Cr3+ Centres in LiNbO3 Using Fluorescence Line Narrowing. J. Phys. Condens. Matter 1995, 7, 9643–9656. [Google Scholar] [CrossRef]
- Jaque, F.; García-Solé, J.; Camarillo, E.; López, F.J.; Murrieta, S.H.; Hernández, A.J. Detection of Cr3+ sites in LiNbO3:MgO,Cr3+ and LiNbO3:Cr3+. Phys. Rev. B 1993, 47, 5432–5434. [Google Scholar] [CrossRef]
- Corradi, G.; Chadwick, A.V.; West, A.R.; Cruickshank, K.; Paul, M. On the substitution site of Cr and Fe in LiNbO3: An EXAFS study. Rad. Eff. Def. Solids 1995, 134, 219–222. [Google Scholar] [CrossRef]
- Kling, A.; Soares, J.C.; da Silva, M.F.; Sanz-García, J.A.; Diéguez, E.; Agulló-López, F. Lattice Site Determination of Cr in Low Doped Lithium Niobate Single Crystals Using PIXE/channeling. Nucl. Instr. Meth. B 1998, 136-138, 426–430. [Google Scholar] [CrossRef]
- Fernández-Ruiz, R.; Bermúdez, V. Determination of the Ta and Nb ratio in LiNb1−xTaxO3 by total reflection X-ray fluorescence spectrometry. Spectrochim. Acta Part B At. Spectrosc. 2005, 60, 231–235. [Google Scholar] [CrossRef]
- Tian, T.; Kong, Y.F.; Liu, S.G.; Li, W.; Wu, L.; Chen, S.L.; Xu, J.J. Photorefraction of molybdenum-doped lithium niobate crystals. Opt. Lett. 2012, 37, 2679–2681. [Google Scholar] [CrossRef] [PubMed]
- Kling, A.; Marques, J.G.; Soares, J.C.; da Silva, M.F.; Diéguez, E.; Agulló-López, F. Valence Effect on the Incorporation of Tungsten Implanted into Lithium Niobate. Nucl. Instr. Meth. B 1997, 127/128, 520–523. [Google Scholar] [CrossRef]
- Kling, A.; Marques, J.G.; da Silva, M.F.; Serrano, M.D.; Diéguez, E.; Sanz-García, J.A.; García-Solé, J.; Agulló-López, F.; Soares, J.C. Incorporation of Hexavalent Impurities into LiNbO3. Rad. Eff. Def. Solids 1999, 150, 249–253. [Google Scholar] [CrossRef]
- Kling, A.; Valdrez, C.; Marques, J.G.; da Silva, M.F.; Soares, J.C. Incorporation of Tungsten in Lithium Niobate by Diffusion. Nucl. Instr. Meth. B 2002, 190, 524–527. [Google Scholar] [CrossRef]
- Calvo, J.A.; Bausá, L.E.; Sanz, J.A.; Voda, M.; García-Solé, J. Spectroscopy of Uranium Ions in LiNbO3. Ferroelectrics 1996, 185, 41–44. [Google Scholar] [CrossRef]
- Kling, A.; da Silva, M.F.; Soares, J.C.; Sanz-García, J.A.; García-Solé, J. Change of Uranium Lattice Site in LiNbO3 Induced by Thermal Reduction Treatment. Rad. Eff. Def. Solids 2001, 155, 229–233. [Google Scholar] [CrossRef]
- Freestone, I.; Meeks, N.; Sax, M.; Higgitt, C. The Lycurgus Cup—A Roman Nanotechnology. Gold Bull. 2007, 40, 270–277. [Google Scholar] [CrossRef] [Green Version]
- Saito, Y.; Suganomata, S. Coloration of LiNbO3 by Metal Ion Implantation. Jpn. J. Appl. Phys. 1987, 26, 1941–1942. [Google Scholar] [CrossRef]
- Saito, Y.; Shang, D.Y.; Kitsutaka, R.; Kitahara, A. Optical Properties of Cu-Implanted LiNbO3. J. Appl. Phys. 1997, 81, 3621–3626. [Google Scholar] [CrossRef]
- Shang, D.Y.; Saito, Y.; Kittaka, R.; Taniguchi, S.; Kitahara, A. Optical Properties of LiNbO3 Implanted with Ag Ions. J. Appl. Phys. 1996, 80, 6651–6654. [Google Scholar] [CrossRef]
- Williams, E.K.; Ila, D.; Sarkisov, S.; Curley, M.; Cochrane, J.C.; Poker, D.B.; Hensley, D.K.; Borel, C. Study of the Effects of MeV Ag and Au Implantation on the Optical Properties of LiNbO3. Nucl. Instr. Meth. B 1998, 141, 268–273. [Google Scholar] [CrossRef]
- Saito, Y.; Kitahara, A. Absorption in the Visible Region of LiNbO3 Sequentially Implanted with Ag and Cu Ions. J. Appl. Phys. 2000, 87, 1276–1279. [Google Scholar] [CrossRef]
- Shi, B.-R.; Lu, F.; Meng, M.-Q.; Wang, F.-X.; Li, W.; Liu, X.-D.; Wang, K.-M.; Wang, Z.-L. Damage Behaviours in LiNbO3 Crystals Induced by MeV Au+ Irradiation. Nucl. Instr. Meth. B 1998, 135, 275–279. [Google Scholar] [CrossRef]
- Ziegler, J.F.; Ziegler, M.D.; Biersack, J.P. SRIM—The stopping and range of ions in matter. Nucl. Instr. Meth. B 2010, 268, 1818–1823. [Google Scholar] [CrossRef] [Green Version]
- Takahiro, K.; Kunimatsu, A.; Nagata, S.; Yamaguchi, S.; Yamamoto, S.; Aoki, Y.; Naramoto, H. Crystal Structure and Optical Absorption of Au Implanted MgO, SrTiO3 and LiNbO3. Nucl. Instr. Meth. B 1999, 152, 314–318. [Google Scholar] [CrossRef]
- Dev, B.N.; Kuri, G.; Satyam, P.V.; Sundaravel, B.; Gog, T.; Materlik, G. X-ray Standing Wave and Ion Scattering Studies on Au-Implanted LiNbO3 (001) Single Crystals. Appl. Surf. Sci. 1998, 125, 163–172. [Google Scholar] [CrossRef]
- Kling, A.; da Silva, M.F.; Soares, J.C.; Fichtner, P.F.P.; Amaral, L.; Zawislak, F.C. Formation of Coherent Gold Nanoclusters in Lithium Niobate. Nucl. Instr. Meth. B 2002, 191, 478–481. [Google Scholar] [CrossRef]
- Kling, A.; da Silva, M.F.; Soares, J.C.; Fichtner, P.F.P.; Amaral, L.; Zawislak, F.C. Influence of Helium Co-Implantation on the Formation of Gold Nanoclusters in Lithium Niobate. Mod. Phys. Lett. B 2001, 15, 1348–1354. [Google Scholar] [CrossRef]
- Wong-Leung, J.; Williams, J.S.; Eliman, R.G.; Nygren, E.; Eaglesham, D.J.; Jacobson, D.C.; Poate, J.M. Proximity Gettering of Au to Ion Beam Induced Defects in Silicon. Nucl. Instr. Meth. B 1995, 96, 253–256. [Google Scholar] [CrossRef]
- Milz, S.; Rensberg, J.; Ronning, C.; Wesch, W. Correlation between damage evolution, cluster formation and optical properties of silver implanted lithium niobate. Nucl. Instr. Meth. B 2012, 286, 67–71. [Google Scholar] [CrossRef]
- Williams, E.K.; Ila, D.; Darwish, A.; Poker, D.B.; Sarkisov, S.S.; Curley, M.J.; Wang, J.-C.; Svetchnikov, V.L.; Zandbergen, H.W. Characterization of Silver Colloids Formed in LiNbO3 by Ag and O Implantation at Room and Elevated Temperatures. Nucl. Instr. Meth. B 1999, 148, 1074–1078. [Google Scholar] [CrossRef]
- Kling, A.; Soares, J.C.; da Silva, M.F. Platinum Implanted Lithium Niobate—Annealing Behavior and Dopant Redistribution. Nucl. Instr. Meth. B 1998, 141, 436–440. [Google Scholar] [CrossRef]
- Kling, A.; Soares, J.C.; da Silva, M.F. Redistribution and Incorporation of Iridium Implanted into Lithium Niobate. Nucl. Instr. Meth. B 2000, 166–167, 280–283. [Google Scholar] [CrossRef]
- Bazzan, M.; Sada, C. Optical Waveguides in Lithium Niobate: Recent Developments and Applications. Appl. Phys. Rev. 2015, 2, 040603. [Google Scholar] [CrossRef]
- Kaminow, I.P.; Carruthers, J.R. Optical waveguiding layers in LiNbO3 and LiTaO3. Appl. Phys. Lett. 1973, 22, 326–328. [Google Scholar] [CrossRef]
- Burns, W.K.; Klein, P.H.; West, E.J.; Plew, L.E. Ti diffusion in Ti:LiNbO3 planar and channel optical waveguides. J. Appl. Phys. 1979, 50, 6175–6182. [Google Scholar] [CrossRef]
- Armenise, M.N.; Canali, C.; De Sario, M.; Carnera, A.; Mazzoldi, P.; Celotti, G. Evaluation of the Ti diffusion process during fabrication of Ti:LiNbO3 optical waveguides. J. Non-Cryst. Sol. 1982, 47, 255–257. [Google Scholar] [CrossRef]
- Armenise, M.N.; Canali, C.; De Sario, M.; Carnera, A.; Mazzoldi, P.; Celotti, G. Characterization of (Ti0.65Nb0.35)O2 Compound as a Source for Ti Diffusion During Ti:LiNbO3 Optical Waveguides Fabrication. J. Appl. Phys. 1983, 54, 62–70. [Google Scholar] [CrossRef]
- Bremer, T.; Kollewe, D.; Koschmieder, H.; Heiland, W. SIMS Investigations of Titanium Profiles in LiNbO3 Produced by Ion Beam Mixing and Diffusion. Fresenius Z. Anal. Chem. 1989, 333, 485–487. [Google Scholar] [CrossRef]
- Caccavale, F.; Chakraborty, P.; Quaranta, A.; Mansour, I.; Gianello, G.; Bosso, S.; Corsini, R.; Mussi, G. Secondary-Ion-Mass Spectrometry and Near-Field Studies of Ti:LiNbO3 Optical Waveguides. J. Appl. Phys. 1995, 78, 5345–5350. [Google Scholar] [CrossRef]
- Caccavale, F.; Gonella, F.; Quaranta, A.; Mansour, I. Analysis of Ti:LiNbO3 Waveguides Using Secondary Ion Mass Spectrometry and Near Field Method. Elect. Lett. 1995, 31, 1054–1056. [Google Scholar] [CrossRef]
- Caccavale, F.; Sada, C.; Segato, F.; Cavuoti, F. Secondary Ion Mass Spectrometry and Optical Characterization of Ti:LiNbO3 Optical Waveguides. Appl. Surf. Sci. 1999, 150, 195–201. [Google Scholar] [CrossRef]
- Zhang, D.-L.; Yang, Z.; Wong, W.H.; Pun, E.Y.B. Secondary-ion-mass spectrometry study on nearstoichiometric LiNbO3 strip waveguide fabricated by vapour transport equilibration and Ti codiffusion. Philos. Mag. 2007, 87, 63–75. [Google Scholar] [CrossRef]
- Bremer, T.; Hertel, P.; Oelschig, S.; Sommerfeldt, R.; Heiland, W. Depth Profiling of Magnesium and Titanium-Doped LiNbO3 Waveguides. Thin Sol. Films 1989, 175, 235–239. [Google Scholar] [CrossRef]
- Caccavale, F.; Chakraborty, P.; Capobianco, A.; Gianello, G.; Mansour, I. Characterization and Optimization of Ti-Diffused LiNbO3 Optical Waveguides by Second Diffusion of Magnesium. J. Appl. Phys. 1995, 78, 187–193. [Google Scholar] [CrossRef]
- Caccavale, F.; Chakraborty, P.; Mansour, I.; Gianello, G.; Mazzoleni, M.; Elena, M. A Secondary-Ion-Mass Spectrometry Study of Magnesium Diffusion in Lithium Niobate. J. Appl. Phys. 1994, 76, 7552–7558. [Google Scholar] [CrossRef]
- Mohan Kumar, R.; Yamamoto, F.; Ichikawa, J.; Ryoken, H.; Sakaguchi, I.; Liu, X.; Nakamura, M.; Terabe, K.; Takekawa, S.; Haneda, H.; et al. SIMS-depth profile and microstructure studies of Ti-diffused Mg-doped near-stoichiometric lithium niobate waveguide. J. Cryst. Growth 2006, 287, 472–477. [Google Scholar] [CrossRef]
- Herreros, B.; Lifante, G. LiNbO3 optical waveguides by Zn diffusion from vapor phase. Appl. Phys. Lett. 1995, 66, 1449–1451. [Google Scholar] [CrossRef]
- Nevado, R.; Cussó, F.; Lifante, G.; Caccavale, F.; Sada, C.; Segato, F. Correlation between compositional and refractive index profiles in diffused optical waveguides. J. Appl. Phys. 2000, 88, 6183–6186. [Google Scholar] [CrossRef]
- Nevado, R.; Cantelar, E.; Segato, F.; Caccavale, F.; Kling, A.; Soares, J.C. Compositional Characterization of Zn-Diffused Lithium Niobate Waveguides. Appl. Phys. B 2001, 73, 555–558. [Google Scholar] [CrossRef]
- Espeso-Gil, O.; García, G.; Agulló-López, F.; Climent-Font, A.; Sajavaara, T.; Domenech, M.; Cantelar, E.; Lifante, G. Characterization of surface layers in Zn-diffused LiNbO3 waveguides by heavy ion elastic recoil detection. Appl. Phys. Lett. 2002, 81, 1981–1983. [Google Scholar] [CrossRef] [Green Version]
- Zhang, D.-L.; Qiu, C.-X.; Wong, W.-H.; Pun, E.Y.-B. Diffusion Properties of Scandium in Lithium Niobate Crystal. J. Am. Ceram. Soc. 2014, 97, 2903–2908. [Google Scholar] [CrossRef]
- Zhang, D.-L.; Qiu, C.-X.; Zhang, W.-Z.; Hua, P.-R.; Yu, D.-Y.; Pun, E.Y.-B. Diffusion Characteristics of Zr4+ in LiNbO3 Single-Crystal. J. Am. Ceram. Soc. 2013, 96, 2722–2724. [Google Scholar] [CrossRef]
- Tsai, W.-S.; Chiang, T.-Y.; Liu, L.-Y.; Chang, P.-C.; Su, Y.-K. Time and Temperature Dependent Study of Zn and Ni Codiffused LiNbO3 Waveguides. J. Light. Technol. 2015, 33, 4850–4859. [Google Scholar] [CrossRef]
- Zhang, D.-L.; Qiu, C.-X.; Wong, W.-H.; Du, W.-J.; Pun, E.Y.-B. Zr4+/Ti4+ Codiffusion Characteristics in Lithium Niobate. J. Am. Ceram. Soc. 2015, 98, 567–573. [Google Scholar] [CrossRef]
- Zhang, D.-L.; Zhang, Q.; Qiu, C.-X.; Wong, W.-H.; Dao, Y.-Y.; Pun, E.Y.-B. Diffusion control of an ion by another in LiNbO3 and LiTaO3 crystals. Sci. Rep. 2015, 5, 10018. [Google Scholar] [CrossRef] [PubMed] [Green Version]
- De Almeida, J.M.M.M.; Marinho, F.; Alexandre, D.; Sada, C. Secondary Ion Mass Spectrometry Study of Erbium Titanium Codiffusion in Lithium Niobate. IEEE Phot. Lett. Tech. 2014, 26, 1307–1309. [Google Scholar] [CrossRef] [Green Version]
- Jackel, J.J.; Rice, C.E. Topotactic LiNbO3 to Cubic Perovskite Structural Transformation in LiNbO3 and LiTaO3. Ferroelectrics 1982, 38, 801–8040. [Google Scholar] [CrossRef]
- Jackel, J.J.; Rice, C.E.; Veselka, J.J. Proton exchange for high-index waveguides in LiNbO3. Appl. Phys. Lett. 1982, 41, 607–608. [Google Scholar] [CrossRef]
- Cabrera, J.M.; Olivares, J.; Carrascosa, M.; Rams, J.; Müller, R.; Diéguez, E. Hydrogen in Lithium Niobate. Adv. Phys. 1996, 45, 349–392. [Google Scholar] [CrossRef]
- Campari, A.; Ferrari, C.; Mazzi, G.; Summonte, C.; Al-Shukri, S.M.; Dawar, A.; De La Rue, R.M.; Nutt, A.C.G. Strain and Surface Damage Induced by Proton Exchange in Y-cut LiNbO3. J. Appl. Phys. 1985, 58, 4521–4524. [Google Scholar] [CrossRef]
- De Micheli, M.; Ostrowsky, D.B.; Barety, J.P.; Mazzi, G.; Papuchon, M. Crystalline and Optical Quality of Proton Exchanged Waveguides. J. Light. Tech. 1986, LT-4, 743–745. [Google Scholar] [CrossRef]
- Canali, C.; Carnera, A.; Della Mea, G.; Mazzoldi, P.; Al Shukri, S.M.; Nutt, A.C.G.; De La Rue, R.M. Structural Characterization of Proton Exchanged LiNbO3 Optical Waveguides. J. Appl. Phys. 1986, 59, 2643–2649. [Google Scholar] [CrossRef]
- Olivares, J.; Cabrera, J.M.; Agulló-López, F.; Rebouta, L.; da Silva, M.F.; Soares, J.C. Structural Characterization of LiNbO3 Proton-Exchanged Waveguides by Ion-Beam Methods. Ferroelectrics 1995, 174, 93–99. [Google Scholar] [CrossRef]
- Hu, H.; Lu, F.; Chen, F.; Wang, F.-X.; Zhang, J.-H.; Liu, X.-D.; Wang, K.-M. Channeling Study of Proton-Exchanged LiNbO3 Optical Waveguides. Phys. Stat. Sol. 2000, 181, 509–513. [Google Scholar] [CrossRef]
- Cargo, J.T.; Filo, A.J.; Hughes, M.C.; Kannan, V.C.; Stevie, F.A.; Taylor, J.A.; Holmes, R.J. Characterization of Sulfuric Acid Proton-Exchanged Lithium Niobate. J. Appl. Phys. 1990, 67, 627–633. [Google Scholar] [CrossRef]
- Paz-Pujalt, G.R.; Tuschel, D.D.; Braunstein, G.; Blanton, T.; Tong Lee, S.; Salter, L.M. Characterization of Proton Exchange Lithium Niobate Waveguides. J. Appl. Phys. 1994, 76, 3981–3987. [Google Scholar] [CrossRef] [Green Version]
- Hsu, W.-Y.; Braunstein, G.; Gopalan, V.; Willand, C.S.; Gupta, M.C. Correlation between Structural and Optical Properties in Proton-Exchanged LiNbO3. Appl. Phys. Lett. 1992, 61, 3083–3085. [Google Scholar] [CrossRef]
- Olivares, J.; Cabrera, J.M.; Agulló-López, F.; Rebouta, L.; da Silva, M.F.; Soares, J.C. Ion-Beam Channeling Characterization of Proton-Exchanged LiNbO3. In Proceedings of the 6th European Conference on Integrated Optics and Technical Exhibit: ECIO 93, Neuchâtel, Switzerland, 18–22 April 1993; Roth, P., Parriaux, O.M., Eds.; ECIO: Neuchâtel, Switzerland, 1993; pp. 9-14–9-15. [Google Scholar]
- Kovács, L.; Wöhlecke, M.; Jovanović, A.; Polgár, K.; Kapphan, S. Infrared absorption study of the OH vibrational band in LiNbO3 crystals. J. Phys. Chem. Solids 1991, 52, 707–803. [Google Scholar] [CrossRef]
- Ito, K.; Kawamoto, K. Dependence of Lattice Constant Deviation and Refractive Index on Proton Concentration in Proton-Exchanged Optical Waveguides on a Single Crystal of LiNbO3. Jpn. J. Appl. Phys. 1992, 31, 3882–3887. [Google Scholar] [CrossRef]
- Rottschalk, M.; Bachmann, T.; Witzmann, A. Investigations of Proton Exchanged Optical Waveguides in LiNbO3 Using Elastic Recoil Detection. Nucl. Instr. Meth. B 1991, 61, 91–93. [Google Scholar] [CrossRef]
- Hagner, G.; Bachmann, T. Refractive Index Profiles and Exchange Ratios of Proton-Exchanged Waveguides in Congruent and MgO-Doped LiNbO3. Phys. Stat. Sol. 1998, 165, 205–212. [Google Scholar] [CrossRef]
- Casey, H.C., Jr.; Chen, C.-H.; Zavada, J.M.; Novak, S.W. Analysis of Hydrogen Diffusion from Proton-Exchanged Layers in LiNbO3. Appl. Phys. Lett. 1993, 63, 718–720. [Google Scholar] [CrossRef]
- Zavada, J.M.; Casey, H.C., Jr.; States, R.J.; Novak, S.W.; Loni, A. Correlation of Substitutional Hydrogen to Refractive Index Profiles in Annealed Proton-Exchanged Z- and X-Cut LiNbO3. J. Appl. Phys. 1995, 77, 2697–2708. [Google Scholar] [CrossRef] [Green Version]
- Engelsberg, M.; do Nascimento, G.C.; Pacobahyba, L.H. 1H Atomic Motion in Proton-Exchanged LiNbO3. J. Appl. Phys. 1993, 74, 6427–6429. [Google Scholar] [CrossRef]
- De Souza, R.E.; Engelsberg, M.; Pacobahyba, L.H.; do Nascimento, G.C. Nuclear Magnetic Resonance Study of Proton Exchanged LiNbO3. J. Appl. Phys. 1995, 77, 408–410. [Google Scholar] [CrossRef]
- Engelsberg, M.; de Souza, R.E.; Pacobahyba, L.H.; do Nascimento, G.C. Structural Determination of Hydrogen Site Occupation in Proton-Exchanged LiNbO3 by Nuclear Magnetic Resonance. Appl. Phys. Lett. 1995, 67, 359–361. [Google Scholar] [CrossRef]
- Yamamoto, K.; Taniuchi, T. Characteristics of Pyrophosphoric Acid Proton-Exchanged Waveguides in LiNbO3. J. Appl. Phys. 1991, 70, 6663–6668. [Google Scholar] [CrossRef]
- Cheng, C.-C.; Horng, R.-C.; Chen, Y.-C. Formation and Properties of Proton-Exchanged and Annealed LiNbO3 Waveguides for Surface Acoustic Wave. IEEE Trans. Ultras. Ferroel. Freq. Control. 2001, 48, 387–391. [Google Scholar] [CrossRef]
- Chen, F.; Wang, X.-L.; Wang, K.-M. Development of Ion-Implanted Optical Waveguides in Optical Materials: A Review. Opt. Mat. 2007, 29, 1523–1542. [Google Scholar] [CrossRef]
- Peña-Rodríguez, O.; Olivares, J.; Carrascosa, M.; García-Cabañes, A.; Rivera, A.; Agulló-López, F. Optical Waveguides Fabricated by Ion Implantation/Irradiation: A Review. In Ion Implantation; Goorsky, M., Ed.; InTech: Rijeka, Croatia, 2012; pp. 267–314. ISBN 978-953-51-0634-0. [Google Scholar]
- Destefanis, G.L.; Townsend, P.D.; Gailliard, J.P. Optical Waveguides in LiNbO3 Formed by Ion Implantation of Helium. Appl. Phys. Lett. 1978, 32, 293–294. [Google Scholar] [CrossRef]
- Barfoot, K.M.; Laursen, T.; Whitton, J.L.; Weiss, B.L.; Webb, R.P. In Situ Channeling Analysis During Thermal Annealing of 4He+-Implanted LiNbO3. Nucl. Instr. Meth. B 1989, 44, 141–145. [Google Scholar] [CrossRef]
- Williams, E.K.; Ila, D.; Sarkisov, S.; Venkateswarlu, P.; Poker, D.B. Application of NRA/Channeling to Study He+ Implanted Waveguides. Nucl. Instr. Meth. B 1986, 118, 57–61. [Google Scholar] [CrossRef]
- Al-Chalabi, S.A.M.; Weiss, B.L.; Barfoot, K.M.; Arnold, G.W. Analysis of He-implanted LiNbO3 by Elastic Recoil Detection. J. Appl. Phys. 1988, 63, 1032–1036. [Google Scholar] [CrossRef]
- Kling, A.; da Silva, M.F.; Soares, J.C.; Fichtner, P.F.P.; Amaral, L.; Zawislak, F. Defect Evolution and Characterization in He-Implanted LiNbO3. Nucl. Instr. Meth. B 2001, 175–177, 394–397. [Google Scholar] [CrossRef]
- Fichtner, P.F.P.; Kaschny, J.R.; Kling, A.; Trinkaus, H.; Yankov, R.A.; Mücklich, A.; Skorupa, W.; Zawislak, F.C.; Amaral, L.; da Silva, M.F.; et al. Nucleation and Growth of Platelet Bubble Structures in He+ Implanted Silicon. Nucl. Instr. Meth. B 1998, 136–138, 460–464. [Google Scholar] [CrossRef]
- Gischkat, T.; Schrempel, F.; Höche, T.; Wesch, W. Annealing Behavior of Lithium Niobate Irradiated with He-Ions at 100 K. Nucl. Instr. Meth. B 2009, 267, 1492–1495. [Google Scholar] [CrossRef]
- Olivares, J.; García, G.; Agulló-López, F.; Agulló-Rueda, F.; Soares, J.C.; Kling, A. Optical Investigations of the Propagation of the Amorphous-Crystalline Boundary in Ion-beam Irradiated LiNbO3. Nucl. Instr. Meth. B 2006, 242, 534–537. [Google Scholar] [CrossRef]
- Hu, H.; Lu, F.; Chen, F.; Wang, F.-X.; Zhang, J.-H.; Liu, X.-D.; Wang, K.-M.; Shi, B.-R. Optical waveguide formation by MeV H+ implanted into LiNbO3 crystal. Opt. Comm. 2000, 177, 189–193. [Google Scholar] [CrossRef]
- Zhao, J.-H.; Huang, Q.; Wang, L.; Fu, G.; Qin, X.F.; Liu, P.; Guo, S.-S.; Liu, T.; Wang, X.-L. The Properties of Ion-Implanted LiNbO3 Waveguides Measured by the RBS and Ion Beam Etching Stripping Methods. Opt. Mat. 2011, 33, 1357–1361. [Google Scholar] [CrossRef]
- Wang, L.; Xiang, B.-X. Planar waveguides in magnesium doped stoichiometric LiNbO3 crystals formed by MeV oxygen ion implantations. Nucl. Instr. Meth. B 2012, 272, 121–124. [Google Scholar] [CrossRef]
- Song, Q.; Lu, F.; Ma, X.; Liu, H.; Liu, X.; Zhang, R.; Wang, X. MgO:LiNbO3 Planar Waveguide Formed by MeV O2+ Implantation and Its Annealing Characteristics. Laser Phys. 2008, 18, 815–818. [Google Scholar] [CrossRef]
- Bremer, T.; Heiland, W.; Buchal, C.; Irmscher, R.; Stritzker, B. Recrystallization and Refractive Index Profiles of Titanium-Implanted Optical Waveguides in LiNbO3. J. Appl. Phys. 1990, 67, 1183–1187. [Google Scholar] [CrossRef]
- Zhang, S.-M.; Peng, Y.-D.; Wang, P.; Liu, Q.-X. Influences on Proton Exchange by He Ion Implantation in LiNbO3. Opt. Mat. Expr. 2015, 5, 1526–1531. [Google Scholar] [CrossRef]
- Huang, Q.; Liu, P.; Liu, T.; Guo, S.-S.; Zhang, L.; Wang, X.-L. Lattice damage and waveguide properties of a proton-exchanged LiNbO3 crystal after oxygen-ion implantation. Nucl. Instr. Meth. B 2012, 286, 318–321. [Google Scholar] [CrossRef]
- Herreros, B.; Lifante, G.; Cussó, F.; Kling, A.; Soares, J.C.; da Silva, M.F.; Townsend, P.D.; Chandler, P.J. Structural and Optical Properties of Rare-earth Doped Lithium Niobate Waveguides Formed by MeV Helium Implantation. Mat. Res. Soc. Symp. Proc. 1996, 396, 355–360. [Google Scholar] [CrossRef]
- Herreros, B.; Lifante, G.; Cussó, F.; Sanz, J.A.; Kling, A.; Soares, J.C.; da Silva, M.F.; Townsend, P.D.; Chandler, P.J. Photoluminescence and Rutherford Backscattering Spectrometry Study of Ion-implanted Er3+-doped LiNbO3 Planar Waveguides. J. Phys. Condens. Matter 1998, 10, 3275–3283. [Google Scholar] [CrossRef]
- Herreros, B.; Lifante, G.; Kling, A.; Soares, J.C.; da Silva, M.F.; Townsend, P.D.; Chandler, P.J.; Olivares, J.; Cabrera, J.M. RBS/channeling Study of Ion-implanted and Proton-exchanged LiNbO3:Nd3+:MgO Planar Waveguides. Opt. Mat. 1996, 6, 281–286. [Google Scholar] [CrossRef]
- Cajzl, J.; Nekvindová, P.; Macková, A.; Malinský, P.; Oswald, J.; Staněk, S.; Vytykáčová, S.; Špirková, J. Optical waveguides in Er:LiNbO3 fabricated by different techniques—A Comparison. Opt. Mat. 2016, 53, 160–168. [Google Scholar] [CrossRef]
Figure 1.
“Periodic table of elements” in LN for which one or several nuclear techniques have been applied in the investigation of their properties. IBA—Ion Beam Analysis, PAC—Perturbed Angular Correlation, NMR—Nuclear Magnetic Resonance, NQR—Nuclear Quadrupole Resonance, ME—Mössbauer Effect.
Figure 1.
“Periodic table of elements” in LN for which one or several nuclear techniques have been applied in the investigation of their properties. IBA—Ion Beam Analysis, PAC—Perturbed Angular Correlation, NMR—Nuclear Magnetic Resonance, NQR—Nuclear Quadrupole Resonance, ME—Mössbauer Effect.

Figure 2.
Backscattering spectrum (3.25 MeV He+) for congruent LN with Rutherford Backscattering for niobium and Resonant Elastic Backscattering for oxygen using the 16O(α,α)16O resonance (about 30 times higher than Rutherford scattering) at 3.045 MeV.
Figure 2.
Backscattering spectrum (3.25 MeV He+) for congruent LN with Rutherford Backscattering for niobium and Resonant Elastic Backscattering for oxygen using the 16O(α,α)16O resonance (about 30 times higher than Rutherford scattering) at 3.045 MeV.

Figure 3.
Backscattering spectrum for 1.75 MeV protons on LN and the spectrum of the alpha particles produced in the 7Li(p,α)4He reaction.
Figure 3.
Backscattering spectrum for 1.75 MeV protons on LN and the spectrum of the alpha particles produced in the 7Li(p,α)4He reaction.

Figure 4.
Characteristic X-ray spectrum induced by irradiation of LN by 3.1 MeV He+ ions.

Figure 5.
Typical shape and characteristic parameters of a channeling scan.

Figure 6.
Channel projections with regular and some interstitial sites for important crystallographic directions and the corresponding calculated continuum potentials. The two-dimensional potentials for axial directions are plotted in logarithmic scale; the channeling occurs in the blue regions. The projection of the (0001)-plane and the corresponding one-dimensional continuum potential can be seen on the right side down.

Figure 7.
RBS/C calculations with CASSIS. Upper row: Two-dimensional scans for the -axis, ψ1 corresponds to a rotation around the c-axis and ψ2 around the a-axis of LN. The calculated yields for Li, Nb and O are shown. Li and O exhibit a yield enhancement for the (0001)- or the -plane respectively. Lower row: One-dimensional scans through close to , in which Li shows the typical asymmetric yield curve, and through the (0001)-plane, in which Li acts similar to a host atom located in the center of the planar channel.

Figure 8.
PAC coincidence count rates N(θ,t) obtained with detectors at angles of θ = 90° and θ = 180° (top) and corresponding spectrum obtained in near-stoichiometric LN (4.6 wt% K2O) implanted with 111In (bottom).
Figure 8.
PAC coincidence count rates N(θ,t) obtained with detectors at angles of θ = 90° and θ = 180° (top) and corresponding spectrum obtained in near-stoichiometric LN (4.6 wt% K2O) implanted with 111In (bottom).

Figure 9.
RBS/C dips obtained for the (0001) plane in (a) congruent and (b) near-stoichiometric LiNbO3, as well as for the axis in (c) congruent and (d) near-stoichiometric LiNbO3. The Li data are plotted as red circles and were obtained using NRA via the 7Li(p,α)4He reaction and the Nb data are plotted as blue circles and were obtained using Rutherford Backscattering. The uncertainty bars for Nb-RBS are smaller than symbols. Adapted from Kling et al. [59,61].

Figure 10.
Perturbed Angular Correlation spectra obtained (a) in a congruent LN crystal, and (b) a near-stoichiometric LN crystal grown with 4.6 wt % K2O in the melt. Drawn using data from references [53,63].

Figure 11.
Stacking models for LiNbO3: (a) regular stacking, (b) Nb-antisites (extra Nb indicated by arrows), (c) ilmenite stacking faults (boxed area) and (d) like (c) but with Li vacancy (“complex defect”). Nb is represented by green, Li by blue and free octahedral positions by white symbols and the oxygen layers are depicted as red lines.

Figure 12.
Channel projections with regular and ilmenite type lattice site for Li and Nb for important crystallographic direction.
Figure 12.
Channel projections with regular and ilmenite type lattice site for Li and Nb for important crystallographic direction.

Figure 13.
Interaction potential in the (0001) plane of LiNbO3 seen by the incoming protons, calculated using a Molière’s approximation to the Thomas–Fermi potential. The positions of Li and Nb in the regular lattice as Li-I and Nb-I as well as in the ilmenite stacking fault as Li-II and Nb-II are marked.

Figure 14.
Comparison of experimental results and Monte Carlo simulations for the (0001) Li-NRA angular scan assuming different defect models for congruent lithium niobate: (a) 5.9% niobium antisites, (b) 1.2% niobium antisites, and (c) 2% ilmenite type stacking faults. The Li data are plotted as red circles and were obtained using NRA via the 7Li(p,α)4He reaction and the Nb data are plotted as blue circles and were obtained using Rutherford Backscattering. The uncertainty bars for Nb-RBS are smaller than symbols. Redrawn from Kling et al. [61].

Figure 15.
Comparison of the experimentally observed energy dependence of Xmin for protons (full symbols) with CASSIS simulations (open symbols) for (a) a defect free stoichiometric crystal; (b) congruent crystal containing 5.9 and 1.2% Nb antisites and (c) congruent cristal containing 2.0% ilmenite stacking inversions with and without 1.2% Nb antisites. Redrawn from Kling et al. [26].

Figure 16.
Projection of the LiNbO3 structure, showing two models for the phase transition: (a) Li and Nb locations in the ferroelectric phase below TC; (b) Li and Nb locations in the paraelectric phase above TC for a displacive model; and (c) Li and Nb locations in the paraelectric phase for a disordering model, where half-circles indicate a split occupancy with a probability of 50%. Nb is represented in green, Li in blue and the oxygen layers by red lines.

Figure 17.
Temperature dependence of the nuclear quadrupole interaction at the Ta site in lithium tantalate measured with 181Ta NQR and ME. Drawn using data from references [89,90]. The dashed line was drawn to guide the eye.

Figure 18.
Temperature dependence of the nuclear quadrupole interaction at the Li site measured with the 181Hf, 117Cd, 111mCd and 7Li probes in lithium tantalate. Drawn using data from references [50,93,95,98].

Figure 19.
Temperature dependence of the quadrupole interaction frequencies measured with the 111In probe at the Li site in lithium tantalate. Redrawn from ref. [97].
Figure 19.
Temperature dependence of the quadrupole interaction frequencies measured with the 111In probe at the Li site in lithium tantalate. Redrawn from ref. [97].

Figure 20.
RBS spectra in random and channeling conditions for Cr-implanted LN in the as-implanted state and after annealing in air and wet oxygen. For the sample annealed in air the recrystallization is incomplete and shows the formation of LiNb3O8 at the surface.
Figure 20.
RBS spectra in random and channeling conditions for Cr-implanted LN in the as-implanted state and after annealing in air and wet oxygen. For the sample annealed in air the recrystallization is incomplete and shows the formation of LiNb3O8 at the surface.

Figure 21.
Number of collisions per neutron incident on a thin slab of LN (100 µm thick) as function of energy from 0.1 meV to 20 MeV calculated with the MCNPX Monte Carlo code.
Figure 21.
Number of collisions per neutron incident on a thin slab of LN (100 µm thick) as function of energy from 0.1 meV to 20 MeV calculated with the MCNPX Monte Carlo code.

Figure 22.
Non-Ionizing Energy-Loss (NIEL) for electrons, neutrons, protons and alphas incident in lithium niobate, with energy up to 100 MeV, calculated with the tools available at the SR-NIEL website (www.sr-niel.org; acessed on 31 March 2021).
Figure 22.
Non-Ionizing Energy-Loss (NIEL) for electrons, neutrons, protons and alphas incident in lithium niobate, with energy up to 100 MeV, calculated with the tools available at the SR-NIEL website (www.sr-niel.org; acessed on 31 March 2021).

Figure 23.
The dependence of the Li-NRA minimum yield on the MgO doping concentration for various axial directions. Redrawn from Kling et al. [189].
Figure 23.
The dependence of the Li-NRA minimum yield on the MgO doping concentration for various axial directions. Redrawn from Kling et al. [189].

Figure 24.
Dependence of the fractions of Hf on the different Li and Nb sites on the MgO concentration as determined by PAC.
Figure 24.
Dependence of the fractions of Hf on the different Li and Nb sites on the MgO concentration as determined by PAC.

Figure 25.
Dependence of the shift of the rare earth lattice sites with respect to the regular Li-site on the ionic radius.
Figure 25.
Dependence of the shift of the rare earth lattice sites with respect to the regular Li-site on the ionic radius.

Figure 26.
Angular RBS/C scans for the -axis for Nb and U in the as-grown and reduced sample. In the reduced case the narrowing of the uranium-dip near the axial direction is due to the partial occupancy of Li-sites by U.
Figure 26.
Angular RBS/C scans for the -axis for Nb and U in the as-grown and reduced sample. In the reduced case the narrowing of the uranium-dip near the axial direction is due to the partial occupancy of Li-sites by U.

Figure 27.
RBS spectra for the virgin LN (random and -axis) and after proton-exchange in benzoic acid ( -axis, as-exchanged and annealed). The clearly visible surface damage layer has a thickness of 270 nm.
Figure 27.
RBS spectra for the virgin LN (random and -axis) and after proton-exchange in benzoic acid ( -axis, as-exchanged and annealed). The clearly visible surface damage layer has a thickness of 270 nm.

Figure 28.
(a) Channeling spectra of virgin, He-implanted and annealed LN in the defect area. (b) Arrhenius plot for the determination of the apparent activation energies.
Figure 28.
(a) Channeling spectra of virgin, He-implanted and annealed LN in the defect area. (b) Arrhenius plot for the determination of the apparent activation energies.


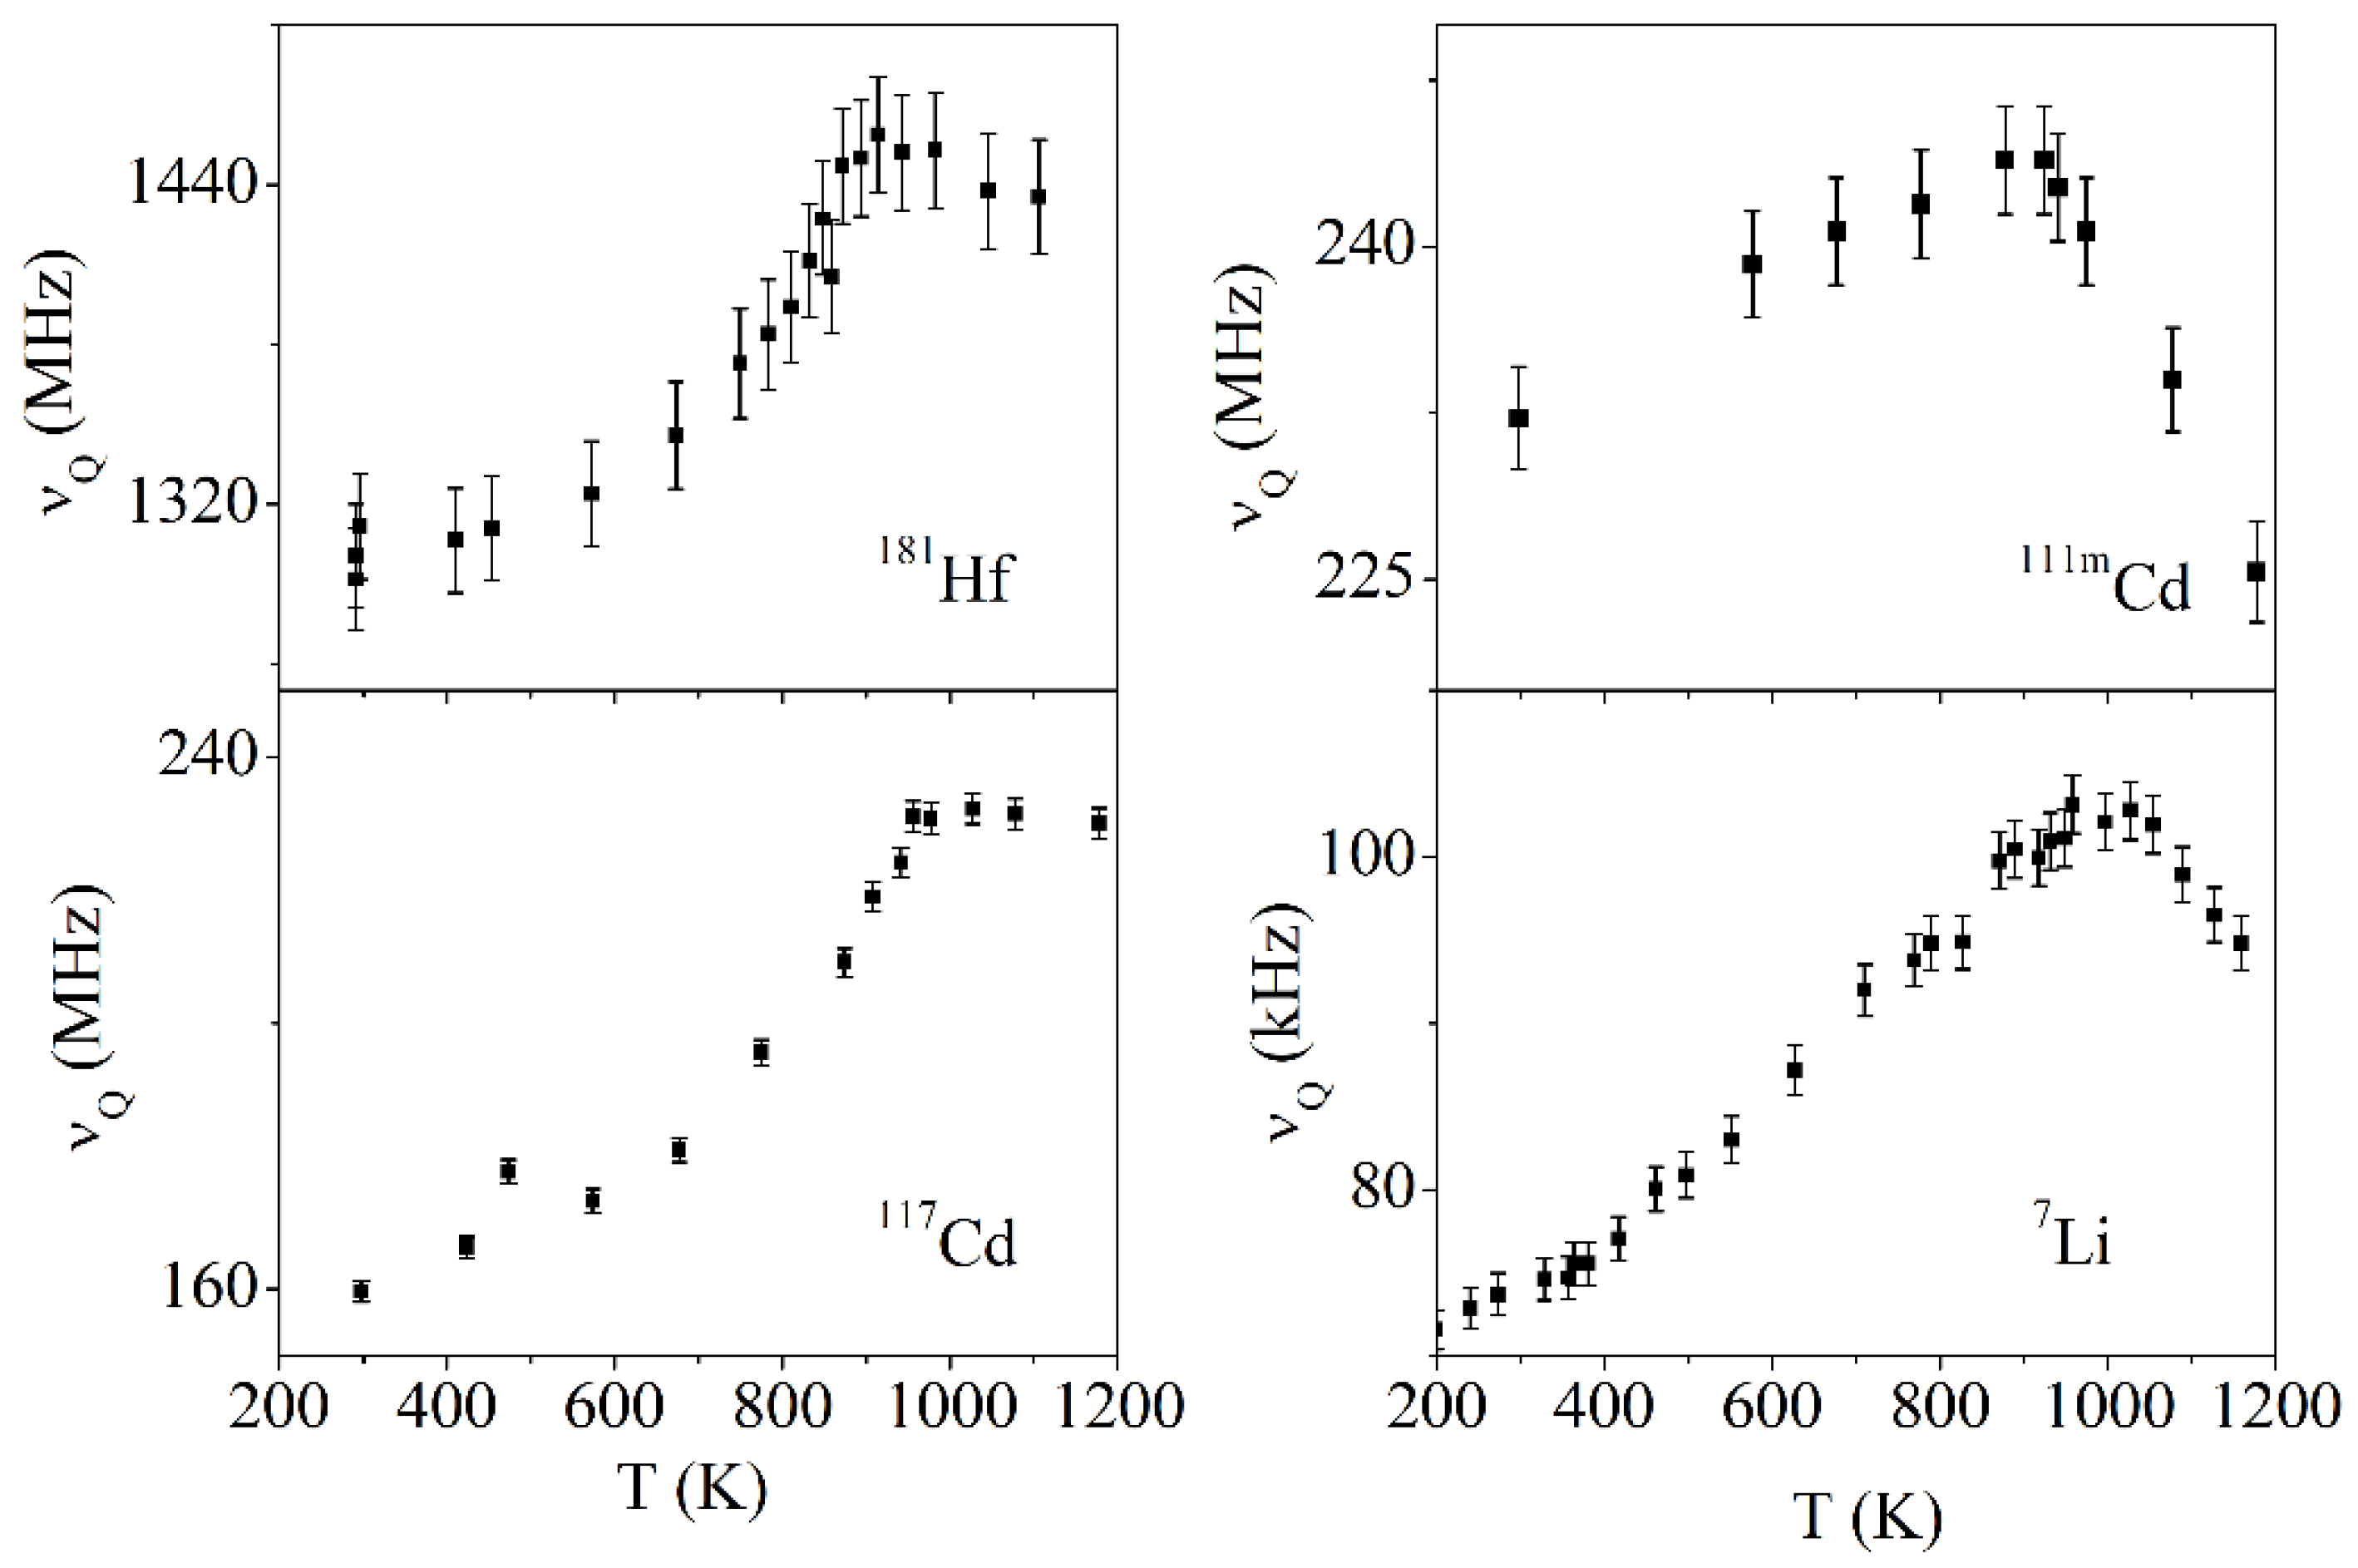
Table 1.
Recoil resulting from neutron activation of several dopants in LN.
| Dopant | Main Activation Reaction(s) | Relative Weight [%] | Max γ Energy [MeV] | Max Induced Recoil [eV] | Importance | ||
|---|---|---|---|---|---|---|---|
| Er | 159.4 | 167Er(n,γ)168Er | 642.3 | 92 | 7.691 | 188 | High |
| Fe | 2.56 | 56Fe(n,γ)57Fe | 2.59 | 93 | 7.646 | 551 | Moderate |
| Hf | 104.1 | 177Hf(n,γ)178Hf | 375.5 | 67 | 6.451 | 126 | High |
| In | 193.8 | 115In(n,γ)116In | 201.0 | 99 | 6.561 | 199 | High |
| Mg | 0.063 | 24Mg(n,γ)25Mg | 0.05 | 63 | 7.329 | 1153 | Low |
| Nd | 50.5 | 143Nd(n,γ)144Nd | 325.0 | 78 | 6.502 | 158 | High |
| Sc | 27.14 | 45Sc(n,γ)46Sc | 27.14 | 100 | 8.760 | 896 | High |
| Ti | 6.09 | 48Ti(n,γ)49Ti | 7.84 | 95 | 6.760 | 501 | Moderate |
| Yb | 34.8 | 174Yb(n,γ)175Yb | 69.4 | 63 | 5.308 | 86 | Moderate |
| Zn | 1.11 | 64Zn(n,γ)65Zn | 0.93 | 41 | 7.864 | 511 | Moderate |
| 67Zn(n,γ)68Zn | 6.8 | 28 | 9.120 | 657 | Moderate |
Table 2.
Non-Ionizing Energy-Loss (NIEL) values for electrons, neutrons, protons and alphas incident in lithium niobate, calculated with the tools available at the SR-NIEL website (www.sr-niel.org; acessed on 31 March 2021).
Table 2.
Non-Ionizing Energy-Loss (NIEL) values for electrons, neutrons, protons and alphas incident in lithium niobate, calculated with the tools available at the SR-NIEL website (www.sr-niel.org; acessed on 31 March 2021).
| Energy | NIEL e− | NIEL n | NIEL p | NIEL α |
|---|---|---|---|---|
| [MeV] | [MeV·cm2/g] | [MeV·cm2/g] | [MeV·cm2/g] | [MeV·cm2/g] |
| 0.001 | 1.886 × 10⁻⁵ | 4.255 | 4.285 × 10+1 | |
| 0.01 | 5.984 × 10⁻⁵ | 1.914 | 2.450 × 10+1 | |
| 0.1 | 2.346 × 10⁻⁷ | 4.229 × 10⁻⁴ | 3.932 × 10⁻¹ | 6.528 |
| 1 | 1.506 × 10⁻⁵ | 2.568 × 10⁻³ | 5.537 × 10⁻² | 9.452 × 10⁻¹ |
| 10 | 8.037 × 10⁻⁵ | 1.962 × 10⁻³ | 7.368 × 10⁻³ | 1.090 × 10⁻¹ |
Table 3.
Incorporation of Hf into crystals grown from congruent and stoichiometric melts.
| Melt Type | Concentration in Melt (mol%) | Concentration in Crystal (mol%) | Distribution Coefficient |
|---|---|---|---|
| congruent | 1.0 | 1.3 | 1.3 |
| congruent | 6.0 | 3.5–5.1 | 0.58–0.85 |
| stoichiometric | 0.2 | 0.6 | 3.0 |
| stoichiometric | 1.0 | 1.7 | 1.7 |
Publisher’s Note: MDPI stays neutral with regard to jurisdictional claims in published maps and institutional affiliations. |
© 2021 by the authors. Licensee MDPI, Basel, Switzerland. This article is an open access article distributed under the terms and conditions of the Creative Commons Attribution (CC BY) license (https://creativecommons.org/licenses/by/4.0/).
Share and Cite
MDPI and ACS Style
Kling, A.; Marques, J.G. Unveiling the Defect Structure of Lithium Niobate with Nuclear Methods. Crystals 2021, 11, 501. https://doi.org/10.3390/cryst11050501
AMA Style
Kling A, Marques JG. Unveiling the Defect Structure of Lithium Niobate with Nuclear Methods. Crystals. 2021; 11(5):501. https://doi.org/10.3390/cryst11050501
Chicago/Turabian StyleKling, Andreas, and José G. Marques. 2021. "Unveiling the Defect Structure of Lithium Niobate with Nuclear Methods" Crystals 11, no. 5: 501. https://doi.org/10.3390/cryst11050501
Note that from the first issue of 2016, this journal uses article numbers instead of page numbers. See further details here.