
Spur Dike Applications for the Sustainability of Channels in Incised Steep Bend Streams
by
 ,
,
Kazuaki Ohtsuki
1,* ,
,
Takanori Kono
2,
Takashi Arikawa
3,
Hisashi Taniwaki
4 and
Rei Itsukushima
5 1
Faculty of Engineering, Graduate Faculty of Interdisciplinary Research, University of Yamanashi, 4-3-11 Takeda, Kofu-shi, Yamanashi 400-8511, Japan
2
Faculty of Engineering, Tottori University, 4-101 Koyamacho-minami, Tottori-shi, Tottori 680-8555, Japan
3
Kin-Shizen-Kasen-Kenkyusho, 901-8 Shimoi, Noichi-cho, Konan-shi, Kochi 781-5235, Japan
4
Crisis Management Department, Kochi Prefectural Office, 1-2-20 Marunouchi, Kochi-shi, Kochi 780-8570, Japan
5
Department of Civil Engineering and Architecture, Faculty of Engineering, Kyushu Institute of Technology, 1-1 Sensui-cho, Tobata-ku, Kitakyushu-shi, Fukuoka 804-8550, Japan
*
Author to whom correspondence should be addressed.
Water 2024, 16(4), 575; https://doi.org/10.3390/w16040575
Submission received: 2 January 2024
/
Revised: 8 February 2024
/
Accepted: 8 February 2024
/
Published: 15 February 2024
(This article belongs to the Special Issue Challenges to Interdisciplinary Application of Hydrodynamic Models)
Abstract
:Japan’s rivers are shaped by distinctive topography and abundant rainfall, and they face flooding and sediment supply escalation concerns under climate change. Small- and medium-sized rivers tend to catch unprecedented forces that exceed planned levels, leading to substantial widening and excavation. Thus, there is a demand for a method that is capable of managing significant flood flows over an extended period. The spur dike can maintain channel clearance by promoting erosion as well as providing bank protection. However, the effectiveness of this spur dike function has not been well studied in small- and medium-sized rivers and curved reaches. In this study, we evaluate the function of spur dikes in improving channel sustainability based on examples of small- and medium-sized rivers that have maintained their channel for more than ten years after spur dike installation. First, the applicability of the empirical rule was evaluated by comparing it with actual cases of erosion depths in curved sections in Japan. Next, one-dimensional simulations were performed to evaluate the sustainability of the section over a long period. Finally, a depth-averaged morphodynamic simulation, including the secondary flow effect, was applied to evaluate the location of the flow core and elevation changes due to the spur dike. The results showed that a slight difference in the ratio of river curvature radius to river width (r/B) caused the river channel to be erosive and sedimentary. The reasons for the difference were the cross-sectional expansion caused by the excavation of the bend and the difference in the plane flow regime caused by the shift of the flow core to the inside of the bend. Although it is structurally challenging to reproduce localized scour around a spur dike in a depth-averaged simulation, it is essential for designing to apply the simulation model and combine empirical knowledge.
1. Introduction
Floods are one of the most common disasters [1,2]. Intense and frequent heavy rains due to climate change will bring a need to change how disaster management has been carried out in the past. Japan addressed this in the climate change policy titled “River Basin Disaster Resilience and Sustainability by All” [3]. In river channels, various trials are being conducted to achieve long-term sustainability for planned floods. This study focuses on installing spur dike operations for sustainable river channel formation in the meandering sections of small- and medium-sized (SMS) rivers in the rainy mountainous regions of Shikoku Island, Japan. This system was installed with channel excavation for flood control measures (Figure 1). Even though there are concerns with respect to sedimentation, spur dikes can operate within the channel’s space to control flood flow. The sediment deposition was suppressed approximately ten years after construction, and the river channel condition remained suitable from both flood control and environmental perspectives. However, there are differences in applicability. Sedimentation created a relatively shallow channel in another section where a spur dike was installed.
This study examined the effectiveness of spur dike groups in controlling sediment depositions in small- and medium-sized river bends by comparing the two different reaches. Specifically, we compared sedimentation conditions based on field investigations and morphodynamic simulations. The simulations included a long-term evaluation based on one-dimensional calculations and a local evaluation based on two-dimensional fluvial fluctuation calculations. Based on these results, we discuss the key to the implementation of spur dikes in order to attain channel sustainability.
1.1. Characteristics of Rivers in Japan
Japan is located in one of the world’s most uplifted zones, where relatively new strata with low consolidation slopes are observed [4]. This generates various rivers with steep slopes compared with other countries [5,6]. The uplift of land also formed meandering rivers due to the rejuvenation of land. Because of its topography, various countermeasures are required for flood protection, resulting in a unique flood protection philosophy and technique in Japan’s history [7]. In mountainous rivers, the substantial longitudinal variability of a channel’s geometry is common with respect to longitudinal variations in rock resistance, glacial history, and hillslope stability [8]. It is also affected by the geological type and structure of the riverbed [9,10], tectonic and glacial history [11,12], large woody debris supply [13], and sediment supply due to local collapse [14].
Japan is a part of the monsoon area of Asia and receives an average annual rainfall of approximately 1600 mm. The southern part of Japan, which faces the Pacific Ocean, receives an annual rainfall of 4000 mm, and some areas experience daily rainfall of up to 1000 mm in severe situations. This region has been historically prone to catastrophic typhoons, leading to severe disasters [15,16]. Recently, linear rain bands have frequently caused severe floods, resulting in intense rainfall of over 100 mm/h [17]. The national government reported a 1.1-time increase in rainfall and a two-time increase in the frequency of rainfall events over 50 mm/h under the RCP8.5 scenario [18]. Tachikawa et al. [19] found that under the RCP8.5 scenario, the 200-year probable annual maximum 24 h rainfall and flood discharge for the Arakawa, Shonai and Yodogawa Rivers flowing through Tokyo, Nagoya, and Osaka are 1.3–1.5 times and 1.5–1.7 times, respectively. There are also concerns about excessive sediment supply to rivers, with studies estimating an increase in sediment supply in the RCP8.5 scenario of 3.2–6.7 times [20,21].
1.2. River Improvement in Mountainside SMS Rivers
Flood control measures in the upstream reach are divided into erosion control and river improvement, and they are managed separately in Japan [22]. Among river improvement measures in the upstream reach, structural measures include the prevention of riverbank collapse and riverbed scour by installing revetments, drop structures, and bed protection works. Erosion control measures include check dams, concrete channels, girdles, and driftwood traps. Continuous implementation has been carried out to improve slope stability. However, implementing these measures has resulted in decreased sediment supply to riparian environments. To address this issue, permeable check dams have been introduced, which allow fine sediments to pass through [23]. In the river channel, measures such as bank revetments and riverbed girdles are standard. In the mountainous Kuma River Basin, approximately 20% of the riverbank has been installed revetment [24]. The sediment is deposited in the mild slope bed, which requires continuous excavation. The management of mountainous SMS rivers is generally handled by prefectural (local) governments. These rivers are mostly located in the countryside and have steep terrain. The total length managed by the local government is approximately 113,000 km [25], which accounts for 91% of the total. These rivers were altered for flood protection during the high-growth period [26]. Due to the need to deal with many rivers within a short period of time, they were designed using uniform standards, resulting in a straighter and deeper shape, losing their environmental aspect [5].
The flood safety level of SMS rivers is generally lower than that of large rivers, such as Class A rivers, in Japan. The planning level of SMS rivers usually ranges from 1/10 to 1/50, whereas that of Class A rivers ranges from 1/100 to 1/200. When disasters occur in SMS rivers, they often face an unprecedented force that significantly exceeds that anticipated at the planning level. For an extreme example, during the heavy rain in 2019 in the Akatani River in Northern Kyushu, which has a catchment area of 20.1 km2 and a planning level of 1/30, the rainfall return period was estimated to be 1/300 [17]. Japan’s disaster recovery principle comprises the prevention of reoccurrence. Therefore, once a river experiences a catastrophe, it often widens by several times its original width, which increases flood capacity in the short term, but this leads to channel degradation as sediment deposition and vegetation growth are enhanced for a medium to long period of time.
In response to the severe 2018 disaster in western Japan, the Japanese government created a “Three-Year Emergency Response Plan for Disaster Prevention, Disaster Mitigation and Building National Resilience”. Additionally, a five-year project starting in 2020 was developed [27], which included a large budget for river channel excavation across the country, even in SMS rivers that had not been excavated in a long time [28]. On the other hand, this accelerated alteration was criticized for causing damage to the riverine environment [28] and potentially compromising the long-term resilience of flood protection measures. In general, channel excavation is an environmentally burdensome method that results in the destruction of habitat structure. Currently, there is a need to find a method of riverbed excavation that includes the conservation and restoration of habitats. This puts flood control in Japan in a difficult position, balancing short-term and long-term effects while contending with changing conditions due to climate change.
1.3. Spur Dike Applications
Riverbank protection is an important method of preventing inundation due to levee breaches [29]. Conventionally, this approach maintains channel form and imposes a pre-determined channel morphology fixed by structures designed to limit bank and bed erosion [30]. Typical examples of works for riverbank protection are revetments, dikes, and gabions [31,32]. The use of spur dikes has been studied as a solution for balancing flood control and environmental improvement [33]. Spur dikes are structures that are built perpendicular or diagonally to the river channel, mainly in the middle and lower reaches of rivers, to prevent riverbank erosion [34]. They were first introduced in Japan by Dutch engineers in the 1800s (Meiji era) and were used for the channelization of large rivers in low-lying areas, like the Kiso River [5,35]. They were later introduced to steep rivers on alluvial fans, like the Kurobe River [36]. Traditionally, wooden triangular pyramidal structures called “Seigyu” have been used for riverbank protection [37]. The spur dike can be divided into permeable and impermeable, and the impermeable can be further divided into overflow and non-overflow spur dike. The type of spur dike is often selected based on the gradient of the riverbed. Impermeable spur dikes such as concrete blocks, heavy square weight, or triangular pyramid blocks are used for steeper rivers. Permissive spur dikes, such as wooden sunken beds or piles, are often used for mild rivers.
The use of spur dikes can reduce the negative environmental impacts of revetment blocks, like the increase in riverbank velocities [38]. They also can create diverse flow regimes near and around them, which can contribute to suitable habitat formation [39]. For example, Fukudome et al. [40] studied practical methods for creating pool habitats using drystone-made spur dikes in straight low-flow channels. In North America, upward submerged spur dikes called stream barbs were implemented for environmental restoration in channelized rivers [41,42].
Another function of spur dikes is to shift the thalweg. Relative to this, attempts at sediment control in channels have been carried out. Case studies were carried out to prevent blockage weir intake [43]; prevent low- and high-flow channel separation using notch-installed spur dikes [44]; and maintain common flow channels with spur dikes on both channel sides [45]. However, only some studies for channel sedimentation prevention with spur dikes have been conducted in SMS rivers. A previous survey showed that 95% of spur dike implementation for disaster recovery was carried out in rivers wider than 25 m [46].
Regarding technical regulations in Japan, the guideline [47] states that the typical geometry of a spur dike to shift the flow core should be about the depth of the planned flood conditions, and the spacing of the spur dike should be 1/2–1/3 of the length of the sandbar. The cross-section of the spur dike is usually perpendicular with a slope of 1:1 to 1:1.5. Standards in the U.S. recommend that the spacing is about 1.5–3.3 times the length and the angle is up to 15 degrees upward. In terms of the length of the spur dike, it should be up to 20% of the river’s width [48], whereas 10% is recommended in Japan [49]. Such short lengths often introduce limited effects, except for the prevention of sedimentation at the bank. This is a result of economic efficiency with respect to the bank protection effect; however, contributions that are provided by preventing channel sedimentation should also be considered. Also, sedimentation often occurs in the curved section due to point bar formation. However, past field implementations mainly focused on straight reaches, except for experimental studies.
Many experimental and theoretical studies have been conducted on the functions of flow control systems, focusing on riverbed variation, including local scouring, and the effects of reducing flow velocity [33,50,51,52]. However, these studies were conducted on low-gradient channels and rivers, and there are very few theoretical studies and monitoring of introductions on steep-gradient rivers. In particular, the need for research on the installation of spur dikes with bed gradients of 1/200 or more has long been pointed out, but until now, there has been no technical systematization regarding the introduction of spur dikes for rivers with steep gradients [52]. Therefore, when designing the structure of the spur dike, it is necessary to consider the characteristics of the river channel and the sediment transport at the installation sites on a case-by-case basis.
The goal of this study is to establish techniques for sustaining channel space using spur dikes in mountainous SMS rivers and to clarify the effectiveness of spur dikes installed in bends of steep gradient rivers in maintaining river channels through field surveys and numerical simulations. Until now, knowledge of spur dikes at river channel bends in steep gradient rivers has been extremely limited, and no case has been found in which the installation of such works in a real river has been monitored. The results of this study provide important knowledge for river channel maintenance in the monsoon Asian region, where sediment production is active and flooding is currently on the increase.
2. Site Description and River Work Concept
2.1. Study Site
The study’s site is the Hiromi River (32.85115° N, 132.72594° E, Basin area: 10.29 km2) in the southwestern part of Kochi Prefecture, Shikoku Island, Japan, as shown in Figure 2a. The river is a typical countryside SMS river located on a well-developed incised meandering section (Figure 2b). The annual rainfall is approximately 2093 mm at Sukumo JMA station, 8.3 km from the site, and its gradient is on average 1/200. The representative grain size is approximately 37 mm.
The channel geometries of the target sections are shown in Table 1. Representative flood depth H is calculated from the estimated flow rate for 1/2 of the rainfall probability scale, corresponding to the average annual maximum flow rate. There are two curved sections, named curves A and B, and they are located next to straights A and B (Figure 2c). As shown here, r/B (curvature radius–river width ratio) is smaller, and B/H is larger in curve B, indicating that curve B has a sharper bend and is wider than curve A. In these sections, stone spur dikes (red lines in Figure 2c) are installed on the outer banks for channel management against sedimentation and vegetation after river channel excavations. They were installed in 2011 in straight A and curve A and 2017 in curve B, except for the N7 dike, which was completed in 2018. The excavation in straight B was completed before 2011.
2.2. Concept of Target Work with Spur Dikes
As shown in Figure 2a, low flow widths before excavation were narrowed by the sand bar’s expansion and vegetation, which mainly comprises Phragmites japonica Steud vine reeds. Therefore, simple excavations would lead to the same problem. Also, we had to simultaneously maintain a suitable riverine habitat while retaining clearance for flood flow.
The first step in planning was to identify and preserve the essential pools. In the design stage, we assumed the location of the thalweg and the distribution of riffles and pools based on the channel platform and varied the riverbed’s height and low-flow channel’s width. To keep the flow pathway, spur dikes were installed in curved sections to prevent sediment deposition in the inner bank, and the low flow width was widened by local scouring at the tip of spur dikes.
Table 2 lists the specifications of the installed spur dikes. Fourteen dry stone, semi-permeable, submerged spur dike units were used, and groups of five or four units were set on the outer banks of curves A and B. The effective length lg ranged from 1.5 to 12.9 m, and the mean height above the riverbed (hg) ranged from 0.15 to 1.0 m. The ratio of the spur dike’s length to the river’s width, lg/B, is 0.09 to 0.44, which is longer than the standard value of 0.1 in Japan. At the site, higher and shorter spur dikes are set upstream, and lower and longer spur dikes are set downstream to prevent the inflow of large grains and stones; these structures also help low-flow channel management via flow accelerations downstream.
3. Methods
3.1. Topographic Survey
The morphological changes in the target section were examined during field surveys and simulations. Field topographies were obtained by carrying out in situ surveys using optical instruments (S910, Leica geosystems, Heerbrugg, Switzland) and photogrammetry with an RTK-GPS-mounted UAV (Phantom 4 RTK, DJI, Shenzhen, China), taking aerial photos in November and December 2021. Past conditions before and just after the construction were obtained from plainer and lateral design drawings. The vertical accuracy of RTK-GPS-equipped UAV photogrammetry is about 6 cm [53]. These topographic data were used for the initial conditions of simulations. The grain size was examined via imaginary analyses using riverbed photos taken in the reaches of the river and BASEGRAIN software ver.2p3 [54].
3.2. Applicability of the Empirical Rule
Using topographic data, the ratio of the maximum water depth in the curved section to the maximum water depth in the straight section was obtained (Hmax/Hmaxs). To discuss channel curvature and erosion depth, we compare the relationship between r/B and Hmax/Hmaxs of the targeted A and B sections, including data from previous studies [55] in the countryside SMS rivers in Japan, and the dashed line represents the empirical relationship [56].
3.3. Morphodinamic Simulation
3.3.1. Outline
One-dimensional (1D) and two-dimensional (2D) morphodynamic simulations were conducted. One-dimensional simulations were used to evaluate the long-term characteristics of the riverbed’s evolution. Although 1D simulations cannot accurately represent flow characteristics in curved sections, they offer superior long-term computational stability. Here, we used the model to evaluate the mid- to long-term effects of cross-sectional modifications via channel excavation.
Two-dimensional simulations were used to evaluate local sedimentation and scouring phenomena caused by curvatures and spur dikes. The model incorporated installed or uninstalled spur dike conditions. To evaluate the effect of near-bottom velocity acceleration due to the secondary curvature, additional schemes were used in the hydraulic model. Note that, even with such a model, representing the local secondary flow around the spur dikes is difficult [57,58]. It is also known that in curved rectangular open channel flows, the main flow’s velocity shifts toward the inner bank in steep bends with a small curvature radius to river width ratio (r/B) and toward the outer bank in slow bends with a large r/B. It is pointed out that more is needed in addition to the corrected 2D plane calculation in order to reproduce the flow around steep bends. On the other hand, as the riverbed becomes less flat due to progressive bed fluctuations, the flow analysis results using the 2D planar model and 3D analysis are similar [59]. In this study, we are mainly interested in the behavior of fixed sandbars near the spur dikes rather than the local scour around the water control system; thus, we decided to apply the 2D model.
Regarding the calculation conditions, we used the same conditions for the initial bed level, sediment size, and Manning roughness coefficient. However, the input discharge from the upstream end differed between the 1D and 2D simulations. The discharge as a boundary condition was based on hourly rainfall data at the Sukumo station and rational equations. The initial bed level was set on the basis of the designed shape of the river corridor, assuming it to be in a form after construction. Manning’s roughness coefficient n is set to 0.03 (m−1/3 s), determined based on the observed median grain size and field situation. For sediment transport simulations, we applied a uniform particle model to this site and a bedload transport model under an equilibrium assumption in both the 1D and 2D simulations in all domains, even at the boundary. The sediment size in the simulations was set to 37 mm based on field data.
3.3.2. One-Dimensional Model
A 1D morphodynamic simulation model called Nays1D+ included in iRIC Software ver.4.0 [60] was applied. The model was structured to divide the cross-section into several blocks, and the 1D unsteady flow analysis method was applied to each block [61].
In this research study, the cross-section was divided into 20 blocks, and computational nodes were set at 20 m longitudinal intervals. The initial bed level comprised data obtained just after the 2011 excavation obtained from drawings. The input discharge comprises data estimations from 2012 to the end of 2021. The downstream water level is given by the uniform flow depth. Sediment was treated as comprising uniform particles of 37 mm based on observations. Suspended sediment was not considered.
The basic coordinate equations in streamwise direction are shown in Equations (1)–(3) as follows:
(1D Unsteady Continuity Equation)
(1D Momentum Equation)
where is the cross-sectional flow area; is time; is flow discharge; is the averaged velocity; is the gravitational acceleration; is the water level; is the Manning roughness coefficient; and is the hydraulic radius.
In this model, the calculation is performed by dividing the model into j sections in the cross-sectional direction. The final equations of motion organized by introducing the relaxation coefficient are shown in Equations (3) and (4) as follows:
where denotes relaxation coefficients; is the number of blocks that divide the cross-section; is the block’s width; and denotes the suffix of blocks.
Bed load transport was considered in the bed load transport model using Ashida and Michiue’s model [62], as shown in Equation (5).
(Ashida–Michiue’s bed load flux formula)
where denotes the bedload flux (m3/s); s is the specific submerged gravity of grain (=1.65); is the grain diameter (m); is the Shields number (=); is the effective Shields number (=); and is the critical Shields number (=). because the significant formation of riverbed dunes was not observed.
The bed height’s change is calculated using the one-dimensional Exner equation (Equation (6)) as follows:
(1D Exter formula)
where denotes bed height and denotes porosity.
The critical traction force for sand particles of each size can be calculated using Iwagaki’s formula [63], as shown in Equation (7).
(Iwagaki’s critical tractive force formula)
3.3.3. Two-Dimensional Model
The 2D simulations were carried out via a morphodynamic simulation model called Nays2DH, which is included in iRIC Software [64]. It performs 2D depth-averaged morphodynamic simulations on the general curvilinear coordinate system grid to allow for the direct consideration of boundaries, and orthogonal coordinate system data are converted to the coordinate system in the software. The model also has been applied in many cases for gravel bed river evolution [65,66,67].
In this study, the computational grid was set at a size of approximately < 0.5 m to resolve the spur dikes, as shown in Figure 3. The cells with respect to spur dikes and riverbank revetments are fixed bed cells. For the boundary flow condition, we focused on floods that occurred on 10 July 2014 (Qmax = 138 m3/s) because the photographs showed that the riverbed in curve A became stable after 2014. Past photos showed that outer bank scouring was observed in 2015 at bend A, and the situation was almost the same as that in the present condition. The flood in 2014 was the third largest during the period from construction to 2021, and scouring was likely caused by this flood. In the simulation, we input three hydrographs of the 2014 flood to the simulation model to examine sustainability relative to sedimentation in the target sections. As described in Section 3.3.1, simulation conditions other than the flow rate, including the initial bed level, sediment diameter, and Manning’s n, were the same as those used in the 1D model analysis.
The basic equations in an orthogonal coordinate system (,) are shown in Equations (8)–(10) [65].
(Continuity Equation)
(Momentum Equations in the and directions)
where is the water depth; is the time; and are depth-averaged velocities in the and directions, respectively; is the gravitational acceleration; and is the total water depth. In the model, the bottom friction was set using Manning’s roughness parameter . The basic equations of two-dimensional plane flow at orthogonal coordinates are transformed into general coordinates (, ).
The diffusion terms in the and directions are described as Equations (11) and (12), respectively. Here, is the eddy viscosity coefficient given by a turbulence model called the zero-equation model, as described in Equation (13) as follows:
where denotes the Kàrmàn coefficient (=0.4) and denotes bottom friction velocity (m/s).
In riverbed transportation calculations, we used the Ashida and Michiue model [63] for bed load transport estimations, as described in Equation (14).
The effective Shields number is given by .
The total bedload transport is divided into the contravariant form of bedload fluxes in and directions () by considering the effect of secondary flows relative to the velocity field near the riverbed and the local bed slope effect relative to the sediment’s transport direction. For the calculation of bedload fluxes in and directions, we used the Watanabe model [68], as described in Equation (16) as follows:
where and are flow velocities near the riverbed in and directions, respectively, is the composite velocity near the riverbed, and is the angle formed by the and axes. is a correction coefficient for the local bed slope effect, which is given by Hasegawa [69].
In the calculation of near-bed velocity under the effect of the 1st kind of secondary flow, we used the Engelund model [70]. The model applied simple relation with depth-averaged velocity V for near-bed velocity along streamline, and that of transverse direction was calculated from the velocity.
where is the near-bed velocity along the streamline of the depth-averaged flow, is the near-bed velocity in the transverse direction; is the curvature radius of the streamline; and is a constant (=7; [70]).
The bed’s height change is calculated via the two-dimensional Exner equation, including only the bed road transport, which is described in the general coordinate system as follows:
(2D Exter formula)
where is time, z is the riverbed elevation, and are bedload fluxes in the and directions, and is porosity.
4. Results and Discussions
4.1. Changes in Morphology
Figure 3 shows a comparison of representative cross-sections before alterations, planned cross-sections (generally after excavation), and the results of the 2021 survey. In curve A, where the low flow width narrowed, as shown in Figure 3b, sediment deposition was observed on the inner bank side as of 2021, but the riverbed’s height was lower than that before construction. The low flow width was 7 m compared to 1 m before. The thalweg previously located at the center of the cross-section shifted outward due to the erosion that occurred along the outer bank. This also contributed to forming a pool habitat. Thus, we found that the spur dikes succeeded in controlling the inner bank’s point bar and maintaining a low flow width; however, they did not control the bed erosion along the outer bank in this section. In curve B, no significant bed erosion was observed. Sediment deposition was found particularly at the inner side of the bend’s entrance. This indicates that the spur dike worked differently in this section. The flood in 2018 exhibited the largest magnitude since 2011. However, past photographs show that sedimentation was not significant in 2019 and that it was higher in 2021 (Figure 4c).
4.2. Applicability of the Empirical Rule
To discuss channel curvature and erosion depth, we compare the relationship between r/B and Hmax/Hmaxs of the targeted A and B sections in Figure 5. A bend with r/B < 10 is considered steep, indicating extra erosion (Hmax/Hmaxs > 1) caused by the bend. The two targeted curves, A and B, have r/B values of 2.5 and 1.4, indicating steep bends. However, significant erosion occurred in curve A and not in curve B, resulting in significant differences in Hmax/Hmaxs values. Curve A aligns with previous measurements, while curve B is an outlier.
As mentioned later in Section 4.5.3, in sharply curved flows on the rectangular cross-section, the maximum velocity occurs along the inner bank’s side for smaller r/B values and shifts to the outer bank side for larger r/B values because of a secondary flow of the first kind [71]. r/B was initially small in curve B and in practice. However, the excavation could increase the width and create near-rectangular cross-section shapes, reducing erosion on the outer bank side and preventing the formation of deep-water areas. Thus, the empirical rule is valid to some extent for the erosion depth at the curvature, but it should be noted that slight differences in r/B can lead to very different results.
4.3. Hydrologic Condition
Figure 6 shows the estimated discharge from 2012 to the end of 2021 as blue dots. The graph also shows the magnitude of rainfalls that have 1/2, 1/10, 1/50, and 1/100 return periods. As shown in the result, relatively large flows were estimated to occur in 2014 (return period: RP ≓ 1/20), 2018 (RP ≓ 1/100), and 2021 (RP ≓ 1/20), which were over the 1/10 level but below the 190 m3/s planning level. Using this hydrograph condition and bed load transport equation (Equation (5)), the average annual bed load inflow was estimated to be 1200 m3 (maximum 3700 m3).
4.4. One-Dimensional Simulation
Figure 6 also shows the estimated bed level change at the center of the channel for the representative cross-sections of curves A and B from 1D morphodynamic simulations. Note that the boundary condition of the simulation was the flood flow from 2012, but since bend B was almost completed in 2018, the estimation in this range is the hypothetical result. The results showed that significant sedimentation was simulated during the initial flooding and that sediment continued to accumulate consistently thereafter. After several floods, curve A reached a stable condition, with a smaller increase in the riverbed and no sedimentation, even during large floods. The photographic history shows that in curve A, the river was in a state in 2015 that was not significantly different from that in 2021, which is consistent with the calculation results.
However, in curve B, the riverbed continued to rise with each flood, and the final bed level reached a higher level than curve A’s bed level. This difference can be attributed to the larger width of curve B. The photographic history shows that sediment deposition was not significant in 2019 but was more pronounced when the site was checked in the winter of 2021. This is not consistent with the results of the analysis.
4.5. Two-Dimensional Simulation
4.5.1. Model Validation
Figure 7 shows the results of elevation change after the first flood flow obtained using two-dimensional morphodynamic simulations that compare cases in which spur dikes were installed. Figure 8 also depicts the estimated cross-sectional #42 and #27 shapes in curves A and B, respectively.
First, we validate a reproduction of the model by checking Figure 7a and Figure 8a. In terms of elevation change, the model provided reasonable output, representing scouring at the tip of upstream spur dikes M4 and K1 and the erosion of the outer bank near downstream spur dikes N6, M2, and N12 (Figure 6a); the inner sand bar along #42 was estimated well (deep blue line in Figure 7a).
On the other hand, in detail, the calculated results underestimated the scouring depth near the bank in curve A, as approximately 1 m of souring depth was observed in the field survey (Figure 8a, red line). In many cases of overflow/impermeable spur dikes, scour holes occur at the end and upstream face due to the vertical downward flow. However, a 2D planar model cannot consider such local 3D flows, although additional schemes are applied for the secondary flow effect. In addition, we also found that the sediment downstream of the spur dike was finer than that on the bar during the field survey. This may be a factor in the underestimation. The finer sediments may indicate that the upstream dikes prevented the large-sized sediment from entering the section as we planned.
4.5.2. Spur Dike Effect on Morphology
Next, the effect of spur dikes on the riverbed’s morphology is discussed by comparing cases with and without spur dikes installed. In the case of installed spur dikes, they control the accumulation of sandbars on the inner bank. Compared to the case without spur dikes, the inner bank bar extends about 5 m to the right bank. The thalweg is narrower along the riverbank. The results after three floods (light blue line in Figure 8) are similar to those after the first flood, indicating that the spur dike’s control is sustainable for a long period of time against large floods, such as the one that occurred in 2014 (approximately 1/20 of a year).
Figure 7b and Figure 8c,d show the results for curve B’s section. Since the river’s improvement was completed in 2018, this simulation using the 2014 flood does not reproduce current conditions, but it helps assess the sustainability of the river channel. The results for the spur dike case show that the significant erosion observed on the outer banks of the bend was not estimated (Figure 7b), which corresponds to the results of field observations (Figure 8c). Although the sediment deposition did not progress after one flood in curve A, that of curve B progressed until the second flood. The continuous accumulation of sediment corresponds to the results of 1D calculations (Figure 6). Compared to the condition without spur dikes, there is little difference in the deposition of the inner bank bar, although the erosion in the vicinity of the spur dike is different. Therefore, the influence of the spur dike was limited in this section.
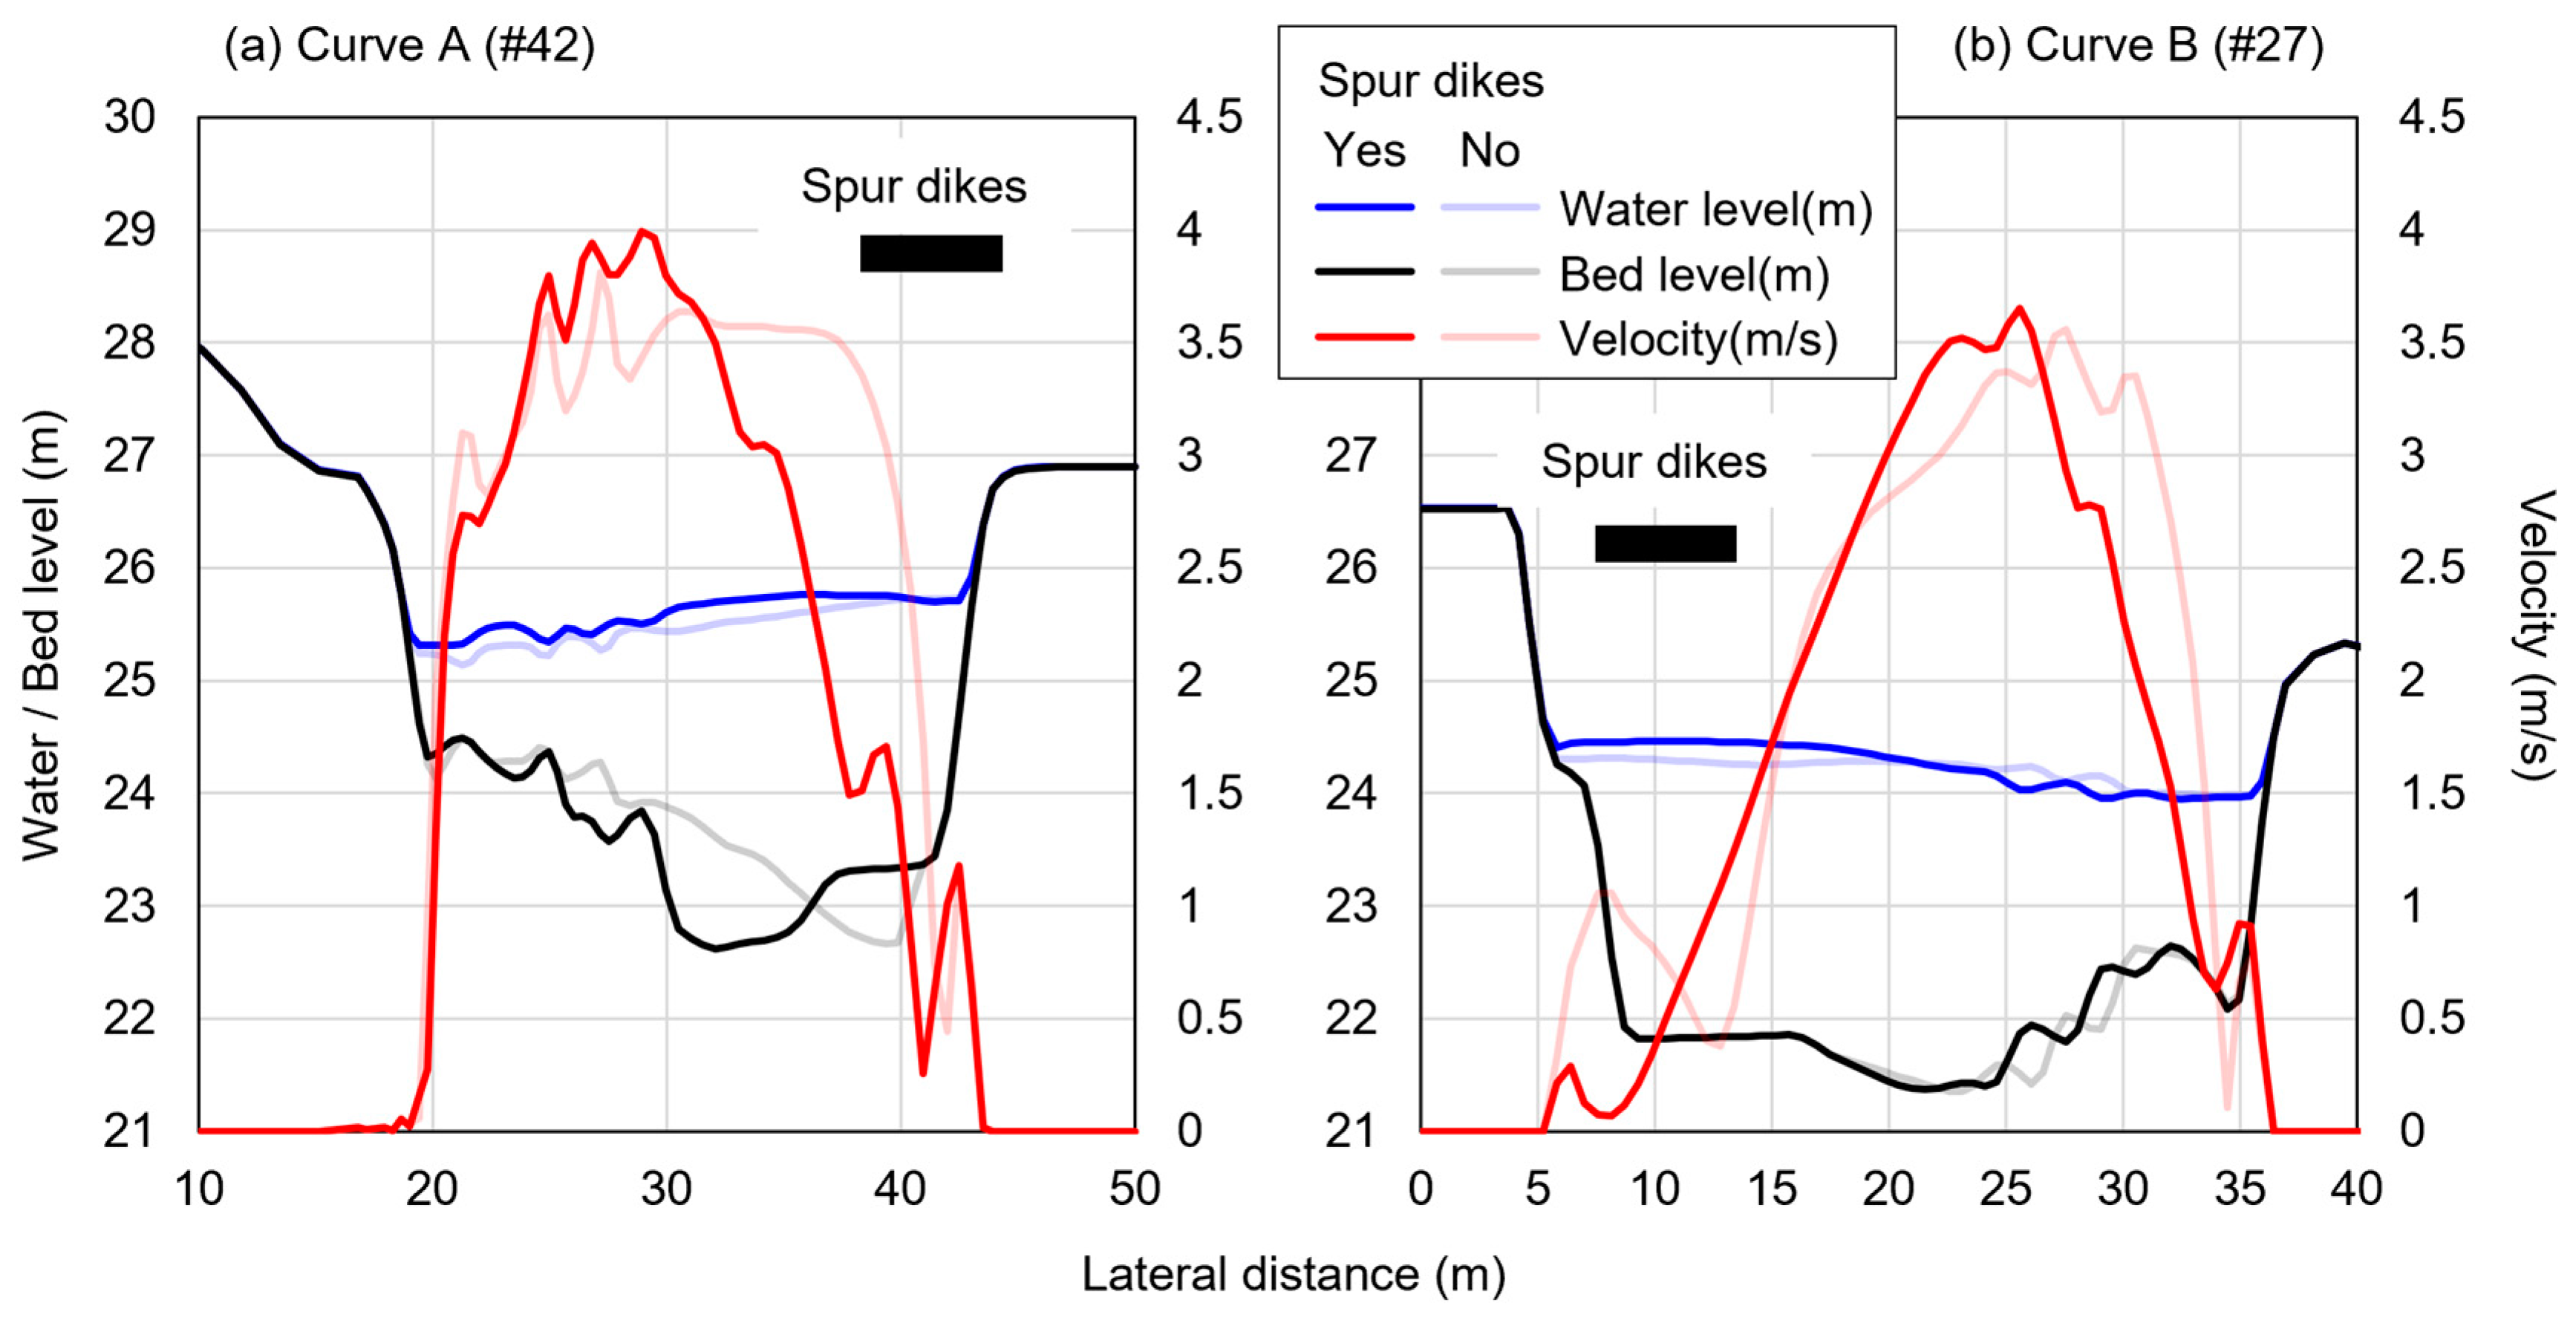
4.5.3. Shifting of Flow Core
Figure 9 shows the results of the estimated velocity distribution at the first flood peak. Figure 10 shows the calculated lateral distributions of the riverbed, water level, and velocity along cross-sections #42 and #27. The deep solid lines indicate conditions with spur dikes and the light solid lines indicate conditions without spur dikes. The range of spur dikes upstream is also depicted.
According to the results, spur dikes reduce flow velocity in the high-velocity zone on the right bank of curve A (Figure 9a and Figure 10a). The width of deceleration is longer than the length of spur dikes, which is about 10 m from the riverbank. The flow’s shift to the left bank increased the maximum velocity by 0.18 m/s, and the water level increased by a maximum of 0.07 m. The water level mainly increases near the flow’s core; thus, it has no significant impact near the riverbank.
In curve B, on the other hand, the spur dike does not provide a flow velocity mitigation zone near the riverbank. The horizontal flow velocity distribution shown in Figure 9b indicated that the core flow velocity passes through the inner bank (right bank), and no strong flow acts on the spur dikes. Compared to the case without spur dikes, the flow’s center is slightly shifted to the inner bank where spur dikes are not installed (Figure 10b), which can be attributed to the effect of the upstream spur dikes. The flow passing through curve A is concentrated on the right bank without spur dikes, resulting in concentrated flows into curve B (Figure 9). This is why the high-velocity area is found in the opposite direction of the spur dike. The spur dikes downstream of curve A also contributed to shifting the flow’s core to the left bank.
4.5.4. Low Flow Conditions
Figure 11 depicts the distribution of water depths for low flow (0.2 m3/s, observation-based) conditions after a flood-induced morphodynamic bed level change, and the results were compared with respect to whether spur dikes were installed. In the calculation results with a spur dike at curve A, scouring was observed near the tip of the dike. Bed erosion along the riverbank was also observed in the back half of the bend. However, the calculation underestimated the extent of observed erosion, which was more extensive. The calculation with the spur dike did not reproduce the broad and deep thalweg that formed due to extensive erosion along the revetment. The flow at cross-section #42 had a surface width of more than 7 m and a depth of 1 m, suggesting that the erosion that occurs at the tip of the spur dike—which is reflected in calculation results—together with secondary flow caused by the bend and local scouring around the spur dike has multiple effects. It forms a broad thalweg at the reach, which can be expected to provide essential habitats for organisms due to its conditions as a pool.
In curve B, no significant erosion was predicted along the outer bank, which corresponds to the field result. As mentioned before, this is because the main flow of the steep curve was toward the inner bank, and the effect of the spur dike was small. However, the calculated scour depth at the tip of the spur dike is deeper than the actual depth.
4.5.5. Limitation of the Simulation
The flow and riverbed morphology around a spur dike have a structure with three-dimensional solid characteristics. However, in practice, three-dimensional simulation can be applied only to a localized area around the structure. For this reason, methods for determining the velocity profile near the bottom based on the results of 2D planar analysis, such as the one used in this study, or quasi-3D analysis, which assumes a hydrostatic pressure distribution and performs approximate calculations, have been investigated. However, as long as the hydrostatic pressure approximation is applied, flows caused by non-equilibrium pressure, such as downward flows in front of a structure due to impinging flows, cannot be solved. In this study, the erosion in front of the spur dike is underestimated because the incremental soil shear force is estimated using the stream curvature based on a flat two-dimensional analysis.
Uchida and Fukuoka [58] developed a semi-direct method to solve the bottom flow around submerged spur dike groups using the surface velocity and depth-integral vorticity equations. The results of the analysis can explain the characteristics of the longitudinal bottom profile and sediment volume variation with time for the whole channel with submerged spur dikes, the characteristics of the local bottom profile around the submerged spur dike, and the distribution characteristics of the maximum scour depth longitudinally around the submerged spur dike. The results show that the local characteristics of the riverbed shape around the submerged channel and the longitudinal distribution of the maximum scour depth of the submerged channel can be explained. Analytical attempts to reproduce the vertical velocity distribution within the framework of the plane two-dimensional analysis method are continuously carried out. Concrete block revetments are the most popular method for bank protection because of their well-established hydraulic functional evaluation methods. It is essential to disseminate such an efficient and accurate analysis technique for the broader use of block levees.
5. Conclusions
This study focuses on the effectiveness of installed spur dikes in the excavated bends of SMS rivers with respect to the sustainability of a river channel. Their effectiveness was investigated by conducting field surveys and numerical simulations. In conclusion, the applicability of spur dikes to SMS rivers’ widening bends is discussed.
- Japan’s rivers are unique due to their topography and geological factors, which make them susceptible to high rainfall, increased flood risk, and sediment supply. During disasters, these rivers are subjected to unprecedented forces beyond planned levels, which leads to significant widening and excavation. Methods that can maintain their shape for extended periods are required for high flood flows. The application of spur dikes has long been sought in order to strike a balance between flood control and environmental improvement. While some studies have addressed sediment management in large rivers, there is a need for more understanding of the effectiveness of spur dike implementation in SMS rivers, especially in curved sections where sedimentation is likely to occur.
- Although the site in this study experienced many flood events, including near-planning-level floods, the spur dike contributed to the suppression of sediment deposition, environmental habitat creation, and vegetation growth prevention. However, it should be noted that the effects of spur dikes vary significantly in the steep bend section. The factors were found to cause slowdowns due to excavations and the bias of the flow core as a result of the steepness of curvature. As shown in this study, the position of the flow core differs significantly in exceptionally sharp bends. Empirical erosion estimates are valid to some extent but are invalid when r/B is very small.
- Spur dikes in steeply curved reaches can be effective in maintaining channel flow capacity. However, the spur dike used in this case study is larger than the size indicated in the guidelines. Therefore, it is important to perform calculations to prove its safety and effectiveness in maintaining its function. However, even with today’s state-of-the-art computational techniques, efficient depth-averaged models are not always sufficient to reproduce localized scour around spur dikes. Therefore, it is still important to make a technical judgment based on a combination of calculations and empirical rules.
Author Contributions
Conceptualization, K.O., T.A. and H.T.; methodology, K.O.; software, K.O. and T.K.; validation, K.O. and T.K.; investigation, K.O., T.K. and T.A.; data curation, K.O.; writing—original draft preparation, K.O.; writing—review and editing, K.O. and R.I.; visualization, K.O.; project administration, K.O.; funding acquisition, K.O. All authors have read and agreed to the published version of the manuscript.
Funding
This work was supported by the River Fund of the River Foundation, Japan (No. 2020-5211-006). The sponsor had no role in the study’s design; in the collection, analysis, and interpretation of the data; in the writing of the report; or in the decision to submit the article for publication.
Data Availability Statement
The raw data supporting the conclusions of this article will be made available by the authors on request.
Conflicts of Interest
The authors declare no conflicts of interest.
References
- Sanyal, J.; Lu, X. Application of Remote Sensing in Flood Management with Special Reference to Monsoon Asia: A Review. Nat. Hazards 2004, 33, 283–301. [Google Scholar] [CrossRef]
- Kundzewicz, Z.; Lugeri, N.; Dankers, R.; Hirabayashi, Y.; Döll, P.; Pińskwar, I.; Dysarz, T.; Hochrainer, S.; Matczak, P. Assessing river flood risk and adaptation in Europe—Review of projections for the future. Mitig. Adapt. Strateg. Glob. Change 2010, 15, 641–656. [Google Scholar] [CrossRef]
- MLIT (Ministry of Land Infrastructure, Transport and Tourism). River Basin Disaster Resilience and Sustainability by All: Japan’s New Policy on Water-Related Disaster Risk Reduction. 2020. Available online: https://www.mlit.go.jp/river/kokusai/pdf/pdf21.pdf (accessed on 22 November 2023).
- Nakazato, H.; Kuroda, S.; Okuyama, T.; Ito, G.; Sasaki, Y. Applicability of helicopter electromagnetic survey for landslide hazard assessment. Tech. Rep. Natl. Inst. Rural. Eng. 2004, 202, 197–204. [Google Scholar]
- Yoshimura, C.; Omura, T.; Furumai, H.; Tockner, K. Present state of rivers and streams in Japan. River Res. Appl. 2005, 21, 93–112. [Google Scholar] [CrossRef]
- Oguchi, T.; Saito, K.; Kadomura, H.; Grossman, M. Fluvial geomorphology and paleohydrology in Japan. Geomorphology 2001, 39, 3–19. [Google Scholar] [CrossRef]
- Itsukushima, R.; Ohtsuki, K.; Sato, T. Learning from the past: Common sense, traditional wisdom, and technology for flood risk reduction developed in Japan. Reg. Environ. Change 2021, 21, 89. [Google Scholar] [CrossRef]
- Wohl, E. Mountain rivers revisited American Geophysical Union. Water Resour. Monogr. Book. 2010, 19. [Google Scholar]
- Duckson, D.W.; Duckson, L.J. Morphology of bedrock step pool systems. J. Am. Water Resour. Assoc. 1995, 31, 43–51. [Google Scholar] [CrossRef]
- Tashiro, T.; Tsujimoto, T. Relationships between riverbed textures and benthic macroinvertebrates in mountainous streams with particular references to basin geologic heterogeneities: Field investigation in the Kushida River basin, central Japan. Ecol. Civ. Eng. 2015, 18, 35–45. [Google Scholar] [CrossRef]
- Brardinoni, F.; Hassan, M.A. Glacial erosion, evolution of river long profiles, and the organization of process domains in mountain drainage basins of coastal British Columbia. J. Geophys. Res. 2006, 111, 1–12. [Google Scholar] [CrossRef]
- Livers, B.; Wohl, E.E. An evaluation of stream characteristics in glacial versus fluvial process domains in the Colorado Front Range. Geomorphology 2015, 231, 72–82. [Google Scholar] [CrossRef]
- Jones, T.A.; Daniels, L.D.; Powell, S. Abundance and function of large woody debris in small, headwater streams in the Rocky Mountain foothills of Alberta, Canada. River Res. Appl. 2011, 27, 297–311. [Google Scholar] [CrossRef]
- Cenderelli, D.A.; Kite, J.S. Geomorphic effects of large debris flows on channel morphology at North Fork Mountain, eastern West Virginia, USA. Earth Surf. Process. Landf. 1998, 23, 1–19. [Google Scholar] [CrossRef]
- Enomoto, T.; Horikoshi, K.; Ishikawa, K.; Mori, H.; Takahashi, A.; Unno, T.; Watanabe, K. Levee damage and bridge scour by 2019 typhoon Hagibis in Kanto Region, Japan. Soils Found. 2021, 61, 566–585. [Google Scholar] [CrossRef]
- Ohtsuki, K.; Nihei, Y. Evaluation of fast flood diffusion through a drainage channel: A flood disaster case study of Japan’s Kinugawa River, 10 September 2015. J. Water Resour. Prot. 2017, 9, 1063. [Google Scholar] [CrossRef]
- Sato, T.; Shuin, Y. Estimation of Extreme Daily Rainfall Probabilities: A Case Study in Kyushu Region, Japan. Forests 2023, 14, 147. [Google Scholar] [CrossRef]
- Technical Committee of Flood Management Plan Considering Climate Change. Planning Approach of Flood Management Considering Climate Change 2019. Available online: http://www.mlit.go.jp/river/shinngikai_blog/chisui_kentoukai/pdf/04_teigenhonbun.pdf (accessed on 22 November 2023). (In Japanese).
- Tachikawa, Y.; Miyawaki, K.; Tanaka, T.; Yorozu, K.; Kato, M.; Ichikawa, Y.; Kim, S. Future change analysis of extreme floods using large ensemble climate simulation data. J. Jpn. Soc. Civ. Eng. Ser. B1 (Hydraul. Eng.) 2017, 73, 77–90, (In Japanese with English Abstract). [Google Scholar]
- Okabe, K.; Kyuka, T.; Yamaguchi, S.; Shimizu, Y.; Shinjo, K.; Hasegawa, K. Study on Meandering Shift Considering the Future Flooding Scale in Steep-Gradient Rivers. J. Jpn. Soc. Civ. Eng. Ser. B1 (Hydraul. Eng.) 2019, 75, I_1423–I_1428, (In Japanese with English Abstract). [Google Scholar] [CrossRef]
- Takahashi, D.; Ishikawa, T.; Michioku, K. Construction of a Numerical Model Reproducing Dam Sedimentation and Estimating of the Sedimentation Rate Increase with Climate Change in the Midorikawa Dam Reservoir, Kumamoto Prefecture. J. Jpn. Soc. Dam Eng. 2022, 32, 141–152, (In Japanese with English Abstract). [Google Scholar]
- Takeuchi, K. Flood management in Japan—From rivers to basins. Water Int. 2002, 27, 20–26. [Google Scholar] [CrossRef]
- Kang, J.H.; Kazama, S. An ecological assessment of a dammed pool formed by a slit check dam. Int. J. River Basin Manag. 2012, 10, 331–340. [Google Scholar] [CrossRef]
- Ichiyanagi, H.; Yoshino, M.; Ikegami, R.; Minagawa, T. Current Status of Concrete Revetment in the Upper River Basin of Central and Northern Kyushu, Japan, and Related Factors. J. Jpn. Soc. Civ. Eng. Ser. B1 (Hydraul. Eng.) 2019, 75, I_367–I_372, (In Japanese with English Abstract). [Google Scholar] [CrossRef]
- Ishikawa, T.; Akoh, R. Application of Running Water-Type Retarding Basin to Old Kinu River Floodplain, Japan. Hydrology 2023, 10, 94. [Google Scholar] [CrossRef]
- Harada, M.; Fujita, Y. Considerations on Changes in Designs of Cross-Section and Roughness in Improvement Works of Small and Medium-Sized Rivers. J. Jpn. Soc. Civ. Eng. Ser. B1 (Hydraul. Eng.) 2012, 68, I_1291–I_1296, (In Japanese with English Abstract). [Google Scholar]
- Cabinet Office of Japan. White Paper: Disaster Management in Japan 2021. 2021. Available online: https://www.bousai.go.jp/en/documentation/white_paper/pdf/2021/R3_hakusho_english.pdf (accessed on 16 October 2023).
- Harada, M.; Kayaba, Y. Consideration on The Marginal State of River Channel. Adv. River Eng. 2022, 28, 451–456, (In Japanese with English Abstract). [Google Scholar]
- Shampa; Hasegawa, Y.; Nakagawa, H.; Takebayashi, H.; Kawaike, K. Three-Dimensional Flow Characteristics in Slit-Type Permeable Spur Dike Fields: Efficacy in Riverbank Protection. Water 2020, 12, 964. [Google Scholar] [CrossRef]
- Thompson, D.M.; Puklin, L.; Marshall, A.E. The long-term impact of channel stabilization using gabion structures on Zealand River, New Hampshire. Ecol. Eng. 2016, 95, 779–792. [Google Scholar] [CrossRef]
- Petersen, M.S. River Engineering; Prentice-Hall: Eaglewood Cliffs, NJ, USA, 1986; p. 580. [Google Scholar]
- Lavagnino, S. Gabions guard river banks against 50,000 cfs flow. Civil. Eng. 1974, 44, 88–89. [Google Scholar]
- Kyuka, T.; Takebayashi, H.; Fujita, M.; Kimura, I.; Shimizu, Y. Flow, sediment transport and bed deformation around spur dikes on erodible and on inerodible bed fields. Ecol. Civ. Eng. 2016, 119, 181–201, (In Japanese with English Abstract). [Google Scholar]
- Talaat, A.; Attia, K.; Elsaeed, G.; Ibraheem, M. Implementation of Spur Dikes to Reduce Bank Erosion of Temporary Diversion Channels During Barrages Construction. Aust. J. Basic. Appl. Sci. 2009, 3, 3190–3205. [Google Scholar]
- Takeuchi, Y.; Takezawa, M.; Gotoh, H. History of flood fighting in the Kisosansen River Basin. WIT Trans. Ecol. Environ. 2008, 118, 123–132. [Google Scholar]
- Tabayashi, A. Regional development owing to the commodification of rural spaces in Japan. Geogr. Rev. Jpn. Ser. B 2010, 82, 103–125. [Google Scholar]
- Xu, T.; Ishii, N. Investigation and Analysis on the Function of Space Formation of Spur Dike for Around Shingen Bank Japan. IOP Conf. Ser. Earth Environ. Sci. 2021, 638, 012058. [Google Scholar] [CrossRef]
- Gregory KJ, The human role in changing river channels. Geomorphology 2006, 79, 172–191. [CrossRef]
- Tripathi, R.P.; Pandey, K.K. Scour around spur dike in curved channel: A review. Acta Geophys. 2022, 70, 2469–2485. [Google Scholar] [CrossRef]
- Fukudome, S.; Fujita, S.F. Design of low-water groin to recover environment of pool and the evaluation of environmental function. Annu. J. Hydraul. Eng. 2010, 54, 1267–1272, (In Japanese with English Abstract). [Google Scholar]
- Jamieson, E.C.; Rennie, C.D.; Townsend, R.D. Stream barb performance in a semi-alluvial meandering channel. WIT Trans. Ecol. Environ. 2011, 146, 227–238. [Google Scholar]
- Sakai, M.; Hashimoto, Y.; Matsushita, E. Riverbed Fluctuation Analysis of Small Rivers Equipped with Stream Barb Groins. In Advances in Sustainable Construction and Resource Management. Lecture Notes in Civil Engineering; Hazarika, H., Madabhushi, G.S.P., Yasuhara, K., Bergado, D.T., Eds.; Springer: Singapore, 2021; Volume 144. [Google Scholar] [CrossRef]
- Sumi, T.; Takebayashi, H.; Sakuma, M.; Hasegawa, M.; Ito, K.; Yamamoto, S.; Shibata, G. Installation and adaptive management of T-shaped and L-shaped spur dikes to control bed deformation and diversify physical environment in rivers. J. Hydro-Environ. Res. 2021, 37, 13–31, (In Japanese with English Abstract). [Google Scholar] [CrossRef]
- Nakamura, H.; Takebayashi, H. Reduction of Compound Channelization of River Cross-Secton Shape Using Hydrobarrier Spur Dike. J. Jpn. Soc. Civ. Eng. Ser. B1 (Hydraul. Eng.) 2020, 76, I_1219–I_1224, (In Japanese with English Abstract). [Google Scholar] [CrossRef] [PubMed]
- Umeki, K.; Yasuda, H.; Ono, I.; Hosaka, H.; Shimizu, K.; Kuroishi, K. Verification of Both Function of Flood Control and Environmental Protection of Artificial Variable Width Channel in The Hayade River. Adv. River Eng. 2021, 27, 141–146, (In Japanese with English Abstract). [Google Scholar]
- Masubuchi, K.; Morikawa, I.; Shiina, S.; Kawai, M. Use case with spur dike in disaster restoration: Report of Japan Riverfront Research Center. 2002, 13, 68–75. Available online: https://www.rfc.or.jp/rp/files/13-08.pdf (accessed on 29 November 2023). (In Japanese with English Abstract).
- Ministry of Land, Infrastructure, Transport and Tourism, Central Bureau of Local Improvement, River Department, Design Guidelines for River Structures 2022. Available online: https://www.cbr.mlit.go.jp/kawatomizu/kouzou/ (accessed on 29 January 2024).
- Lagasse, P.F.; Schall, J.D.; Johnson, F.; Richardson, E.V.; Chang, F. Stream Stability at Highway Structures (No. FHWA-IP-90-014; HEC-20); Federal Highway Administration, Office of Technology Applications: Washington, DC, USA, 1995. [Google Scholar]
- Suetsugi, T. Design and Management Policy of River Structures for Flood Disaster Mitigation. Water Sci. 2018, 60, 83–93. [Google Scholar] [CrossRef]
- Mizutani, H.; Nakagawa, H.; Kawaike, K.; Baba, Y.; Zhang, H. Local scour and sediment sorting around a spur dike. Annuals of Disas. Prev. Res. Inst., Kyoto Univ. 2011, 54B, 525–538, (In Japanese with English Abstract). [Google Scholar]
- Li, Z.; Michioku, K.; Maeno, S.; Ushita, T.; Fujii, A. Hydraulic characteristics of a group of permeable groins constructed in an open channel flow. J. Appl. Mech. 2005, 8, 773–782. [Google Scholar] [CrossRef]
- Onitsuka, K.; Akiyama, J.; Suzuki, T. Effect of aspect ratio on bed topography and hydraulic characteristics around spur dikes. Proc. Hydraul. Eng. JSCE 2005, 49, 769–774. [Google Scholar] [CrossRef]
- Nakaji, M.; Itsukushima, R.; Shimatani, Y. Hydraulic Model Expeliments on River Bank Protection Using Masonry Groin ㏌ Urban High Gradient River with Narrow Section. J. Jpn. Soc. Civ. Eng. Ser. B1 (Hydraul. Eng.) 2018, 74, I_1141–I_1146, (In Japanese with English Abstract). [Google Scholar] [CrossRef] [PubMed]
- Forlani, G.; Dall’Asta, E.; Diotri, F.; Cella, U.M.d.; Roncella, R.; Santise, M. Quality Assessment of DSMs Produced from UAV Flights Georeferenced with On-Board RTK Positioning. Remote Sens. 2018, 10, 311. [Google Scholar] [CrossRef]
- Detert, M.; Weitbrecht, V. User guide to gravelometric image analysis by BASEGRAIN. In Advances in Science and Research; Fukuoka, S., Nakagawa, N., Sumi, T., Zhang, H., Eds.; Taylor & Francis Group: London, UK, 2013; pp. 1789–1795. ISBN 978-1-138-00062-9. [Google Scholar]
- Ohtsuki, K.; Mori, T.; Nakamura, K.; Kayaba, Y. Influences of river channel planar shapes on characteristics of fish habitat in small-middle sized streams. In Proceedings of the 22nd IAHR APD Congress, Sapporo, Japan, 2020; Available online: https://www.iahr.org/library/info?pid=7530 (accessed on 22 November 2023).
- Yamamoto, K. Chuseki Kasen-Kouzou To Doutai—(Alluvial Rivers -Structures and Dynamics-); Gihodo Shuppan: Tokyo, Japan, 2010; p. 266. [Google Scholar]
- Fukuoka, S.; Nishimura, T.; Takahashi, A.; Kawaguchi, A.; Okanobu, M. Design Method of Submerged Groins. J. Jpn. Sci. Civil. Eng. 1998, 593, 51–68. [Google Scholar] [CrossRef] [PubMed]
- Uchida, T.; Fukuoka, S. A Bottom Velocity Computation Method for Estimating Bed Variation in a Channel with Submerged Groins. J. Jpn. Soc. Civ. Eng. Ser. B1 (Hydraul. Eng.) 2011, 67, 16–29, (In Japanese with English Abstract). [Google Scholar] [CrossRef]
- Suzuki, R.; Kimura, I.; Shimizu, Y. Comparisons of 2D and 3D Numerical Results on Flows at Open channel bends. J. Jpn. Soc. Civ. Eng. Ser. B1 (Hydraul. Eng.) 2015, 71, I_1291–I_1296. (In Japanese) [Google Scholar] [CrossRef]
- Shimizu, Y.; Nelson, J.; Arnez Ferrel, K.; Asahi, K.; Giri, S.; Inoue, T.; Iwasaki, T.; Jang, C.-L.; Kang, T.; Yamaguchi, S. Advances in computational morphodynamics using the International River Interface Cooperative (iRIC) software. Earth Surf. Processes Landf. 2020, 45, 11–37. [Google Scholar] [CrossRef]
- Kimura, I.; Asahi, K. Nays1D+ Solver Manual; International River Interface Cooperative (iRIC): 2016. Available online: https://i-ric.org/en/solvers/nays1dplus/ (accessed on 29 November 2023).
- Ashida, K.; Michiue, M. Hydraulic Resistance of Flow in an Alluvia Bed and Bed Load Transport Rate. Proc. Jpn. Soc. Civ. Eng. 1972, 206, 59–69. (In Japanese) [Google Scholar] [CrossRef] [PubMed]
- Iwagaki, Y. Hydrodynamical Study on Critical Tractive Force. Trans. J. Jpn. Soc. Civ. Eng. 1956, 41, 1–21. [Google Scholar] [CrossRef] [PubMed]
- Shimizu, Y.; Inoue, T.; Hamaki, M.; Iwasaki, T. iRIC Software: Nays2DH Solver Manual; Nays2DH Development Team. 2014. Available online: https://i-ric.org/download-file/?dlkey=38ad0609e8688e1d9fedd33471ecea7a (accessed on 22 November 2023).
- Inoue, T.; Mishra, J.; Kato, K.; Sumner, T.; Shimizu, Y. Supplied Sediment Tracking for Bridge Collapse with Large-Scale Channel Migration. Water 2020, 12, 1881. [Google Scholar] [CrossRef]
- Haque, M. Simulation of Flow and Sediment Transport in an Open Channel with Obstacle Using IRIC NAYS2DH. Ph.D. Thesis, Khulna University of Engineering & Technology (KUET), Khulna, Bangladesh, 2018. [Google Scholar]
- Watanabe, A.; Fukuoka, S.; Yasutake, Y.; Kawaguchi, H. Groin arrangements made of natural willows for reducing bed deformation in a curved channel. Adv. River Eng. 2001, 7, 285–290. (In Japanese) [Google Scholar]
- Hasegawa, K. Hydraulic Research on Planimetric Forms, Bed Topographies and Flow in Alluvial Rivers. Ph.D. Thesis, Hokkaido University, Sapporo, Japan, 1985. [Google Scholar]
- Engelund, F. Flow and bed topography in channel bends. J. Hydr. Div. 1974, 100, 1631–1648. [Google Scholar] [CrossRef]
- Takimoto, S.; Kimura, I.; Shimizu, Y.; Hosoda, T. Numerical simulations of 3D turbulence structures in open channel with a shape bend. J. Appl. Mech. 2009, 12, 749–758, (In Japanese with English Abstract). [Google Scholar]
Figure 1.
Photographs of the river channel’s installed drystone spur dikes in the reaches of curve A (a)–(d) and curve B (e)–(g) from 2011 to 2021.
Figure 1.
Photographs of the river channel’s installed drystone spur dikes in the reaches of curve A (a)–(d) and curve B (e)–(g) from 2011 to 2021.

Figure 2.
Maps of study sites. (a),(b) Location of Hiromi River Basin and (c) target reach. Both side arrows indicate the range of target reaches; the circle end line indicates the positions of the representative cross-section and red lines represent spur dikes in (c).
Figure 2.
Maps of study sites. (a),(b) Location of Hiromi River Basin and (c) target reach. Both side arrows indicate the range of target reaches; the circle end line indicates the positions of the representative cross-section and red lines represent spur dikes in (c).

Figure 3.
Computational grids and their initial height of elevation.

Figure 4.
Changes in the cross-sectional shape in a representative section of the target section: (a) straight A (#50), (b) curve A (#42), (c) curve B (#27), and (d) straight B (#25).
Figure 4.
Changes in the cross-sectional shape in a representative section of the target section: (a) straight A (#50), (b) curve A (#42), (c) curve B (#27), and (d) straight B (#25).

Figure 5.
Relationship between the curvature radius–river width ratio (r/B) and the maximum water depth in the curved section—the maximum water depth in the straight section ratio (Hmax/Hmaxs). The plots include data from previous studies [55] in the countryside SMS rivers in Japan, and the dashed line represents the empirical relationship. Reprinted/adapted with permission from Ref. [56]; 2010, Gihodo Shuppan, Tokyo, Japan.

Figure 6.
Discharge and bed level change at bend A (cross-section #42) and bend B (cross-section #27) based on 1D morphodynamic simulations.
Figure 6.
Discharge and bed level change at bend A (cross-section #42) and bend B (cross-section #27) based on 1D morphodynamic simulations.

Figure 7.
Results of elevation change after the targeted first flood estimated by two-dimensional morphodynamic simulations for (a) installed or (b) uninstalled spur dikes.
Figure 7.
Results of elevation change after the targeted first flood estimated by two-dimensional morphodynamic simulations for (a) installed or (b) uninstalled spur dikes.

Figure 8.
Estimated cross-sectional shape in a representative section obtained via 2D simulation with and without spur dikes: (a) curve A with spur dikes (#42), (b) curve A without spur dikes, (c) curve B with spur dikes (#27), and (d) curve B without spur dikes.
Figure 8.
Estimated cross-sectional shape in a representative section obtained via 2D simulation with and without spur dikes: (a) curve A with spur dikes (#42), (b) curve A without spur dikes, (c) curve B with spur dikes (#27), and (d) curve B without spur dikes.

Figure 9.
Flow velocity results at high flow estimated by two-dimensional morphodynamic simulations for (a) installed or (b) uninstalled spur dikes.
Figure 9.
Flow velocity results at high flow estimated by two-dimensional morphodynamic simulations for (a) installed or (b) uninstalled spur dikes.

Figure 10.
Lateral distributions of water level, bed level, and velocity at the first high flow in 2D simulations: (a) curve A (#42) and (b) curve B (#27).
Figure 10.
Lateral distributions of water level, bed level, and velocity at the first high flow in 2D simulations: (a) curve A (#42) and (b) curve B (#27).

Figure 11.
Flow depth results at low flow conditions estimated by two-dimensional morphodynamic simulations for (a) installed or (b) uninstalled spur dikes.
Figure 11.
Flow depth results at low flow conditions estimated by two-dimensional morphodynamic simulations for (a) installed or (b) uninstalled spur dikes.


Table 1.
Characteristics of the subject section of the Hiromi River.
| Section | Bed Gradient: I | Channel Width: B (m) | Representative Flood Depth: H (m) | B/H | BI0.2/H | Curvature Radius: r (m) | r/B | Curvature Angle: q (deg) |
|---|---|---|---|---|---|---|---|---|
| Straight A | 1/200 | 15.7 | 1.75 | 9.0 | 3.1 | - | - | - |
| Curve A | 24.1 | 1.37 | 17.6 | 6.1 | 61.0 | 2.5 | 133.0 | |
| Curve B | 29.4 | 1.21 | 24.3 | 8.4 | 41.0 | 1.4 | 112.0 | |
| Straight B | 24.1 | 1.32 | 18.2 | 6.3 | - | - | - |
Note: Representative flood depth H is calculated from the estimated flow rate for 1/2 the rainfall probability scale, corresponding to the average annual maximum flow rate.
Table 2.
Spur dike specifications in the district of Hiromi River.
| Spur Dike Name | Type of Structure | Ground Level of Crest (m) | Effective Length: lg (m) | Height: hg (m) | lg/B | hg/H | |
|---|---|---|---|---|---|---|---|
| Curve A | M4 | Type I | 24.34 | 2.50 | 1.00 | 0.10 | 0.57 |
| K1 | Type L | 23.79 | 6.00 | 0.50 | 0.25 | 0.29 | |
| N6 | Upward Type I | 23.51 | 6.80 | 0.15 | 0.28 | 0.09 | |
| M2 | Type I | 24.04 | 1.50 | 1.00 | 0.06 | 0.57 | |
| N12 | Type I | 23.51 | 1.50 | 0.50 | 0.06 | 0.29 | |
| Curve B | M1 | Type I | 22.94 | 1.50 | 1.00 | 0.05 | 0.83 |
| N15 | Upward Type I | 22.55 | 7.00 | 0.50 | 0.24 | 0.41 | |
| K2 | Type L | 22.45 | 12.90 | 0.50 | 0.44 | 0.41 | |
| N7 | Upward Type I | 22.13 | 10.25 | 0.15 | 0.35 | 0.12 |
Disclaimer/Publisher’s Note: The statements, opinions and data contained in all publications are solely those of the individual author(s) and contributor(s) and not of MDPI and/or the editor(s). MDPI and/or the editor(s) disclaim responsibility for any injury to people or property resulting from any ideas, methods, instructions or products referred to in the content. |
© 2024 by the authors. Licensee MDPI, Basel, Switzerland. This article is an open access article distributed under the terms and conditions of the Creative Commons Attribution (CC BY) license (https://creativecommons.org/licenses/by/4.0/).
Share and Cite
MDPI and ACS Style
Ohtsuki, K.; Kono, T.; Arikawa, T.; Taniwaki, H.; Itsukushima, R. Spur Dike Applications for the Sustainability of Channels in Incised Steep Bend Streams. Water 2024, 16, 575. https://doi.org/10.3390/w16040575
AMA Style
Ohtsuki K, Kono T, Arikawa T, Taniwaki H, Itsukushima R. Spur Dike Applications for the Sustainability of Channels in Incised Steep Bend Streams. Water. 2024; 16(4):575. https://doi.org/10.3390/w16040575
Chicago/Turabian StyleOhtsuki, Kazuaki, Takanori Kono, Takashi Arikawa, Hisashi Taniwaki, and Rei Itsukushima. 2024. "Spur Dike Applications for the Sustainability of Channels in Incised Steep Bend Streams" Water 16, no. 4: 575. https://doi.org/10.3390/w16040575
Note that from the first issue of 2016, this journal uses article numbers instead of page numbers. See further details here.