PRESENTATION OF THE GORENJE GROUP
PRESENTATION OF THE GORENJE GROUP
PRESENTATION OF THE GORENJE GROUP

You also want an ePaper? Increase the reach of your titles
YUMPU automatically turns print PDFs into web optimized ePapers that Google loves.
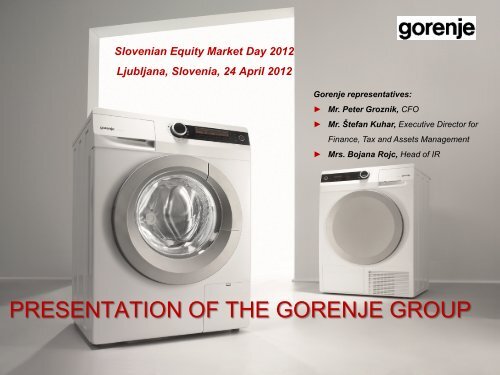
Slovenian Equity Market Day 2012<br />
Ljubljana, Slovenia, 24 April 2012<br />
Gorenje representatives:<br />
► Mr. Peter Groznik, CFO<br />
► Mr. Štefan Kuhar, Executive Director for<br />
Finance, Tax and Assets Management<br />
► Mrs. Bojana Rojc, Head of IR<br />
1<br />
<strong>PRESENTATION</strong> <strong>OF</strong> <strong>THE</strong> <strong>GORENJE</strong> <strong>GROUP</strong>
One of the leading European manufacturers of products for home<br />
Core business<br />
• Products and services for Home (MDA, SDA, HVAC, kitchen<br />
furniture)<br />
Gorenje Group<br />
• Main company Gorenje, d.d., and 102 Companies (79<br />
International)<br />
Number of employees<br />
• 10.932 / 2011<br />
Consolidated revenue<br />
• 1.4 bn EUR / 2011<br />
2<br />
Global presence<br />
• 70 Countries Worldwide, mostly in Europe, USA, Australia,<br />
Near and Far East<br />
Own production<br />
• Slovenia, Sweden, Czech Rep., Serbia, Finland<br />
Export<br />
• 95% of sales<br />
Legend:<br />
MDA (major domestic appliances)<br />
SDA (small domestic appliances)<br />
HVAC (heating, ventilation, air conditioning)
Only the very best from Gorenje … already 62 years!<br />
1950-1960<br />
1961-1970<br />
1971-1980<br />
► 1950 founded in the village of Gorenje<br />
► 1958 manufacturing stoves<br />
► Production of washing machines and refrigerators<br />
► 1961 first exports to Germany<br />
► Acquisition of companies with synergy to the core business<br />
► Setting-up own distribution network in Western Europe<br />
1981-1990 ► Major Focus on core business - household appliances<br />
1991-1996<br />
1997-2005<br />
2006-2007<br />
2008 - 2009<br />
2010<br />
2011<br />
► Restructuring and ownership transformation<br />
► Strong expansion into foreign markets<br />
► Gorenje, d.d., becomes a Public Company<br />
► Investing into new products and technology<br />
► Strategicaly Gorenje has infused new life into its business doctrine familiarly known as: "Everything for Home“<br />
► Acquisition of Mora Moravia, the cooking appliance manufacturer from the Czech Republic<br />
► Opening of the new refrigerator & freezer Plant in Valjevo, Serbia<br />
► New design of product lines Gorenje Pininfarina II; Gorenje Swarovski; Gorenje Ora-Ïto<br />
► Acquisition of Gorenje Surovina, d.d., Maribor, Slovenia<br />
► 15% capital increase and additional shares were listed on a prime market of Ljubljana Stock Exchange<br />
► New design of product lines Gorenje Pininfarina Black and Gorenje Ora-Ïto White<br />
► Acquisition of the company ATAG<br />
► New generation of cooking appliances;Innovative fridge freezer “Gorenje for iPod“<br />
► Gorenje designed by Karim Rashid; Gorenje Retro Collection; Gorenje Simplicity<br />
► Acquisition of the company ASKO<br />
► Entering IFC, member of the World Bank into the ownership structure<br />
► Launching of the new brand name Gorenje+<br />
► Start-up of the factory in Zaječar, Srbia<br />
► Confirmation of the new strategy 2015<br />
3
Public limited company since 1998<br />
Ten major shareholders No. of shares %<br />
KAPITALSKA DRUŽBA, D.D. 3,534,615 22.2207%<br />
Employees<br />
and former<br />
employees<br />
5.18%<br />
Private<br />
Individuals<br />
17.22%<br />
Treasury<br />
Stock<br />
0.76%<br />
Pension<br />
Fund<br />
22.91%<br />
IFC 1,876,876 11.7991%<br />
HOME PRODUCTS EUROPE B.V. 1,070,000 6.7267%<br />
NFD 1, delniški podsklad 820,045 5.1553%<br />
INGOR, d.o.o., & co. k.d. 794,473 4.9945%<br />
EECF AG 411,727 2.5884%<br />
RAIFFEISEN BANK AUSTRIA D.D. 375,889 2.3631%<br />
TRIGLAV VZAJEMNI SKLADI 297,090 1.8677%<br />
PROBANKA, d.d. 297,061 1.8675%<br />
4<br />
Financial<br />
Investors<br />
53.93%<br />
ERSTE <strong>GROUP</strong> BANK AG 222,204 1.3969%<br />
Top 10 Shareholders 9,699,980 60.9798%<br />
Other Shareholders 6,206,896 39.0202%<br />
Total* 15,906,876 100%<br />
<br />
<br />
<br />
Two-tier Corporate Governance System<br />
Supervisory Board: 6 Representatives of capital and 4 Representatives of employees<br />
Management Board: 6 Members<br />
121,311 Own Shares (0.7626%)<br />
<br />
Slovenian Corporate Governance Code<br />
*Ownership structure on 31 December 2011
With the new strategy changes to the Group organization<br />
Previous Gorenje Group organization: three divisions:<br />
HOME APPLIANCES<br />
HOME INTERIOR<br />
ECOLOGY, ENERGY,<br />
AND SERVICES<br />
1 - REFRIGERATION APPLIANCES (COLD APP.)<br />
2 - COOKING APPLIANCES (HOT APP.)<br />
3 - WASHING MACHINES, DRYERS, DISHWASHERS<br />
(WET APP.)<br />
COMPLEMENTARY PRODUCTS<br />
SUPPLEMENTARY PRODUCTS<br />
Water heaters, radiators, and air conditioners<br />
Kitchens<br />
Other furniture<br />
Ceramics<br />
Bathrooms<br />
Ecology<br />
Energy<br />
Tools and industrial<br />
equipment<br />
Trade<br />
Engineering<br />
Brokerage<br />
Tourism<br />
5<br />
Change in the new organization:<br />
Changes in the new<br />
organization:<br />
Changes in the new<br />
organization:<br />
A wide product range – major domestic appliances, small<br />
domesticappliances, HVAC, services<br />
.<br />
Gorenje's core activity is manufacturing HOME products; in 2015, it<br />
will represent approximately 90% of total operations.<br />
• Focus on kitchen<br />
furniture<br />
• Preparing a new<br />
business model<br />
• field of ENERGY divested<br />
• further development of the<br />
field of ECOLOGY<br />
• SERVICES seen as portfolio<br />
investments.
Greater focus on core activities until 2015<br />
► The main activity amounted to 77% of revenues in 2011.<br />
► The growth of core activities to 90% of revenues by 2015.<br />
CORE ACTIVITY SUPPLEMENTARY PORTFOLIO INVESTMENTS<br />
HOME<br />
Products and services for the home<br />
ECOLOGY<br />
Ecology-related services<br />
O<strong>THE</strong>R<br />
6<br />
MDA (major domestic appliances)<br />
SDA (small domestic appliances)<br />
HVAC (heating, ventilation, air conditioning)<br />
SERVICES related to the home<br />
KITCHEN<br />
FURNITURE<br />
Comprehensive<br />
waste management<br />
Tool-making<br />
Engineering<br />
Hotels and hospitality<br />
services<br />
Trade<br />
Design services<br />
KEY ORIENTATION<br />
SUPPORT<br />
role
New strategy, new vision<br />
VISION<br />
TO BECOME WORLD BEST<br />
DESIGN DRIVEN INNOVATOR<br />
<strong>OF</strong> HOME PRODUCTS<br />
MISSION<br />
TO CREATE INNOVATIVE, DESIGN-DRIVEN PRODUCTS AND<br />
SERVICES THAT BRING SIMPLICITY TO OUR USERS.<br />
7<br />
AMBITION CREATIVITY RESPONSIBILITY HONESTY SIMPLICITY<br />
FUNDAMENTAL VALUES
Strategic goals - Home<br />
► Price index 29 European Countries increase for 2 p.p. per year till 2015 – MDA 8;<br />
► Target structure by markets in 2015 WE / EE /GLOBAL: 45 / 45 / 10; in 2010* (46 / 47 / 7)<br />
►<br />
Strengthening of position on new markets active presence (sales office) in 15 megacities<br />
► Share of concepts in Gorenje brand 25% (volume) till 2015<br />
► Product complexity reduction for 30% till 2013<br />
► Growth of SDA for 2 p.p. in structure till 2015<br />
► Growth of HVAC for 1.5 p.p. in structure till 2015<br />
8<br />
►<br />
New businesses up to 1% 2015 in HOME structure<br />
► Growth of Kitchen furniture from 11.5 MEUR 2010 to 23.5 MEUR 2015<br />
►<br />
Use of Gorenje Group Synergies<br />
WE…Western Europe<br />
EE…Eastern Europe<br />
GLOBAL…outside Europe
Why to focus to built in<br />
Freestanding business will be more and more<br />
competitive and less and less profitable –<br />
especially for Gorenje since we can not have<br />
same economy of scale and real LCC<br />
production<br />
Build-in business still driven by local habits<br />
and still less competitive<br />
HIGH DEBT means LOWER POWER to<br />
INVEST means NEED to FOCUS<br />
9<br />
BI in Gorenje Group has strong BI platforms<br />
innovative BI OVENS and HOBS, strong BI cooling<br />
platform, strong hoods platforms<br />
Currently BI categories in GorenjeGroup (hobs,<br />
hoods, ovens) – most profitable categories
Product portfolio strategies - MAKE or BUY<br />
Premium: existing / new premium platforms or buy<br />
Assure efficient<br />
make or buy<br />
process in order to<br />
assure<br />
competitiveness of<br />
the product range<br />
for all brands<br />
(in order to assure long-term competitiveness in premium<br />
segment we need to have own unique solutions/platforms)<br />
Mid+: existing platforms with added innovative features<br />
Mid: existing platforms or buy (with co-development)<br />
Budget: old generations or buy (off the shelve)<br />
CONCEPT: mid and mid+ platforms (make or buy)<br />
All MAKE or BUY decisions will be evaluated based on<br />
following criteria:<br />
1. Target cost needed<br />
2. Platform differentiation between budget, mid, premium<br />
segment<br />
3. Production utilization<br />
10
Multi-brand strategy to cover all price segments<br />
BUILT-IN<br />
PREMIUM<br />
SPECIALIST<br />
BUILT-IN<br />
SPECIALIST<br />
PREMIUM<br />
MID+<br />
WET PREMIUM<br />
SPECIALIST<br />
BUILT-IN<br />
LOCAL<br />
SPECIALIST<br />
CONCEPTS<br />
MID<br />
11<br />
MAINSTREAM<br />
LOWER<br />
(BUDGET)<br />
SEGMENT<br />
BUDGET<br />
FREE<br />
STANDING<br />
LOCAL<br />
BUILT-IN (FREE<br />
STANDING) LOCAL<br />
LOWER<br />
(BUDGET)<br />
SEGMENT<br />
FOR BENELUX
Strategy by brands – Brand profiles<br />
Gorenje Group will serve all (price) segments of the market with multi-brand strategy<br />
Full range of premium BI selective expansion to<br />
WE, 2014 EE, high-end KRT<br />
NEW focus: premium WET, other products<br />
supportive role , selective expansion EE, global<br />
Full range of mid+ BI products, introduced<br />
D,A,CZ,SLO,UA,RU;SCAN, new markets 2013<br />
KRT specialist,<br />
12<br />
Main pan-European brand in portfolio, strong<br />
focus to Concepts, focus growth in mainstream<br />
(focus to BI segment, reducing cost in FS,<br />
implementing selective design driven<br />
innovations, reduction of complexity), develop<br />
sales of accessories<br />
Budget platforms, protective brand for SEE<br />
Adjusted product portfolio, brands will be<br />
developed&supported only if they can perform<br />
long-term sustainable profit
Europe domestic market, strengthening global presence till 2015<br />
11% market share in Finland<br />
10% market share in Denmark<br />
9% market share in Norway<br />
6% market share in Sweden<br />
Top 1 foreign brand in Germany<br />
7 % market share in Russia<br />
4% of the Group<br />
revenue comes<br />
from USA &<br />
Australia<br />
Leading brand<br />
in Slovenia & on<br />
the Balkan<br />
In Hong Kong luxury<br />
residential towers<br />
furnished with designer<br />
appliances<br />
13<br />
5% market share in the<br />
segment of dishwashers<br />
in Australia<br />
► Sales in 70 markets around the world: Europe = traditional domestic market, the USA,<br />
Australia, China, Middle East
Strategy markets<br />
RU<br />
NORDIC<br />
USA<br />
AUS<br />
ASKO<br />
P<br />
SLO<br />
CZ<br />
BIH<br />
UA<br />
RS<br />
GLOBAL<br />
MEGA<br />
CITIES<br />
<strong>GORENJE</strong><br />
UA<br />
ASIA<br />
14<br />
RU<br />
I<br />
BENELUX<br />
ATAG<br />
F<br />
UK<br />
STRONG RESOURCES MID RESOURCES LOW RESOURCES<br />
Focus resources to markets with strong position (&profitability) or to markets that<br />
represent strategic priorities
The difference is built on design and innovation<br />
15
Awards for design, innovations and brand recognition<br />
Design:<br />
• BIO Design Award, 1979, 1996, 2002, 2006, 2008<br />
• DIDA - Delo Industrial Design Award, 1997<br />
• Plus X Award TM , 2004 - 2011<br />
• Red Dot Design Award, 2005, 2010, 2011<br />
• The Design Awards, 2006, 2010<br />
• Timeless Slovenian design 2011 for Simple&Logical<br />
• Design 2011 (The Month of Design)<br />
• Good Industrial Design Award 2010, 2011<br />
• Golden Link Award, 2006, 2008<br />
• Observeur Design 08 Award, 2007<br />
• Wallpaper nomination, 2008<br />
Innovation:<br />
• SCC Innovation Award, 2003 - 2009, 2010, 2011<br />
• Formatool Award, 2005, 2007, 2011<br />
• Hevreka!06 Award, 2006<br />
• Get Connected Product of the Year Award, 2006, 2010, 2011<br />
• Le Grand Prix de l'Innovation nomination, 2007<br />
• Podium de l'Innovation inomination, 2008<br />
• Grüner Stecker prize, 2010<br />
16<br />
Brand name:<br />
• Trend Award, 2005<br />
• Success Story Award, 2005<br />
• Superbrands, 2006, 2007<br />
• Trusted Brand, 2007, 2008, 2009, 2010, 2011<br />
• Eurobrand, 2007, 2008, 2009<br />
• SiBrand 2011<br />
• China Home Style Award, 2008
Awards for product excellence<br />
Oven with the innovative electronic control module - the world revolution in the management of<br />
household appliances<br />
17
Awards for product excellence<br />
Hob designer line Magna – Atag brand<br />
18<br />
3 Classic Line Dishwasher - Asko brand
Awards for product excellence<br />
Washing machine from Gorenje RedSet line<br />
19
Awards for product excellence<br />
Gorenje SensoCARE washing machine and Gorenje IQcook cooking hob<br />
20
Sales Structure of Major Domestic Appliances in Europe 2011 – MDA ( 9 Product Groups)<br />
EUROPE (Market)<br />
~63.7 m units<br />
-1.3%<br />
WEST EUROPE (Market)<br />
~87% (share of total market sales)<br />
-3.2%<br />
Belgium; 2%<br />
3% Austria ;<br />
Netherlan<br />
2%<br />
ds; 3%<br />
Poland;<br />
5%<br />
Skandinav<br />
ia*; 6%<br />
2% Others,<br />
7%<br />
2%<br />
Germany;<br />
19%<br />
France;<br />
15%<br />
Ohranjanje tržnih<br />
deležev Gorenja<br />
EAST EUROPE (Market)<br />
~22% (share of total market sales)<br />
+5.7%<br />
21<br />
<strong>GORENJE</strong> (West Europe)*<br />
~ 43%<br />
-3.0%<br />
Spain;<br />
6%<br />
Russia ;<br />
10%<br />
UK;<br />
10%<br />
Italy;<br />
11%<br />
<strong>GORENJE</strong> (East Europe)<br />
~ 57%<br />
-8.2%<br />
<br />
CECED Figures do not include sales of groups Atag & Asko<br />
MDA9 (Refrigerators, Freezers, Dishwashers, Washing Machines, Dryers, Freestanding Cookers, Built-in Ovens, Hobs, Hoods)<br />
wo. Microwave Ovens<br />
Members: BSH, Candy, Electrolux, Fagor -Brandt, Gorenje, Indesit, Liebherr, Whirlpool, Miele, Smeg<br />
Source: CECED
Benchmarking<br />
Competition in the home appliances industry worsened results compared to 2010<br />
Electrolux<br />
Whirlpool<br />
Indesit<br />
Arcelik<br />
Gorenje<br />
Sales: -4.4%<br />
(to 11,263 M €)<br />
EBIT: -44.4%<br />
(to 335 M €)<br />
Negative FCF<br />
(to -721 M €)<br />
Sales: +1.6%<br />
(to 13,417 M €)<br />
EBIT: -21.4%<br />
(to 569 M €)<br />
Negative FCF<br />
(to -40 M €)<br />
Sales: -1.8%<br />
(to 2,825 M €)<br />
EBIT: -18.2%<br />
(to 150 M €)<br />
Negative FCF<br />
(to -39 M €)<br />
Sales: +21.6%<br />
(to 3,624 M €)<br />
EBIT: +1.3%<br />
(to 278 M €)<br />
Negative FCF<br />
(to -60 M €)<br />
Sales: +2.9%<br />
(to 1,422 M €)<br />
EBIT: -15.3%<br />
(to 37 M €)<br />
Positive FCF<br />
(to +36 M €)<br />
Strong drop of<br />
EBIT and PDT,<br />
acquisition of<br />
Olympic Group<br />
and CTI,<br />
Adaptation of<br />
production<br />
capacity,<br />
Reduction of<br />
overhead costs.<br />
Strong drop of<br />
FCF, Aggressive<br />
actions taken to<br />
reduce fixed cost<br />
structure<br />
(N.America<br />
achieves 2X EBIT<br />
improvement,<br />
Significantly lower<br />
inventory levels).<br />
The negative<br />
effects of material<br />
costs and lower<br />
volume of<br />
demand on<br />
profitability, a<br />
negative FCF.<br />
Strong growth in<br />
sales, negative<br />
FCF, takeover<br />
Defy Appliances.<br />
Lower reduction<br />
in profitability<br />
regard to<br />
competition and<br />
positive FCF.<br />
22<br />
▼ Significant deterioration in the results compared with 2010, negative trend continued in Q4 2011<br />
▼<br />
▼<br />
All analyzed companies, except of Gorenje, have a negative FCF<br />
Adjustment of structural (fix) costs to the scale and structure of business activities.
Business performance 2011: Highlights<br />
in EUR million 2011 2010 2009 2008<br />
comparable<br />
2011 2010<br />
Change<br />
(%)<br />
Consolidated revenue 1,422.2 1,382.2 1,185.9 1,330.8 1,288.1 1,221.8 5.4%<br />
EBITDA 86.7 108.7 68.2 94.0 85.4 91.4 -6.6%<br />
EBITDA Margin, % 6.1% 7.9% 5.8% 7.1% 6.6% 7.5% /<br />
EBIT 36.5 56.4 12.1 36.9 41.1 41.9 -1.9%<br />
EBIT Margin, % 2.6% 4.1% 1.0% 2.8% 3.2% 3.4% /<br />
Profit before tax 11.1 22.5 -9.3 15.5 15.1 8.0 88.8%<br />
Net income 9.1 20.0 -12.2 10.2 11.3 4.9 130.6%<br />
ROS, % 0.6% 1.4% -1.0% 0.8% 0.9% 0.4% /<br />
Free cash flow (narrow)* 35.8 17.8 33.0 -45.1 18.4 7.2 154.7%<br />
Net financial debt** 382.5 401.2 425.1 463.7 388.5 377.6 2.9%<br />
Net financial debt / EBITDA 4.4 3.7 6.2 4.9 4.5 4.1 10.1%<br />
Earnings per share (in EUR) 0.57 1.34 -0.83 0.66 0.71 0.32 119.5%<br />
23<br />
* Profit after tax + depreciation and amortization expense – CAPEX + divestment –+ change in inventories –+ allowances for trade receivables –+ change in trade payables<br />
** Long-term financial liabilities + short-term financial liabilities – cash and cash equivalents
BUSINESS PERFORMANCE 2011: Events that affect the comparability of data<br />
Effect of the elimination of the Asko Group and disposal of Istrabenz Gorenje on the profitability of the Gorenje Group<br />
in MEUR 2011 2010<br />
comparable<br />
Q4 Q4<br />
Q4 Q4<br />
2011 2010 2011 2010<br />
2011 2010<br />
Revenue 1,422.2 1,382.2 362.1 416.4 1,288.1 1,221.8 331.9 323.2<br />
= Contribution margin (CM1) / gross<br />
margin<br />
534,2 525.4 133.3 144.0 464.7 491.1 118.2 122.9<br />
CM 1 37.6% 38.0% 36.8% 34.6% 36.1% 40.2% 35.6% 38.0%<br />
= Added value / AV 352.6 353.1 92.8 94.4 309.8 316.8 85.9 80.3<br />
AV in revenue 24.8% 25.5% 25.6% 22.7% 24.1% 25.9% 25.9% 24.8%<br />
= EBITDA 86.7 108.7 24.6 25.3 85.4 91.4 28.1 22.5<br />
EBITDA margin 6.1% 7.9% 6.8% 6.1% 6.6% 7.5% 8.5% 7.0%<br />
= EBIT 36.5 56.4 13.1 12,0 41.1 41.9 18.0 10.9<br />
EBIT margin 2.6% 4.1% 3.6% 2.9% 3.2% 3.4% 5.4% 3.4%<br />
= Profit for the period 9.1 20.0 1.3 3.2 11.3 4.9 3.1 1.5<br />
ROS 0.6% 1.4% 0.4% 0.8% 0.9% 0.4% 0.9% 0.5%<br />
24<br />
in MEUR 2011 2010<br />
comparable<br />
2010<br />
NET ASSETS 735.0 740.0 718.4<br />
Net current assets 470.5 463.0 451.6<br />
Net working capital 264.5 277.0 266.8<br />
Working capital 551.4 623.6 590.8<br />
- Current liabilities -286.9 -346.6 -324.0<br />
NET EQUITY INVESTED 735.0 740.0 718.4<br />
Equity 397.8 392.1 385.1<br />
Net debt equity 337.2 347.9 333.3<br />
Effect of disposal of Istrabenz Gorenje on the<br />
financial position of the Gorenje Group
Business Plan 2012: Goals<br />
Goal:<br />
STRENG<strong>THE</strong>NING <strong>THE</strong> PR<strong>OF</strong>ITABILITY – CASH FLOW GROWTH - REDUCING DEBT<br />
through the realization of the model of<br />
BUSINESS EXCELLENCE.<br />
►<br />
►<br />
Improving sales and diversifying geographically and product range;<br />
►<br />
Launching new products;<br />
Decreasing inventories and receivables - increasing free cash flow;<br />
►<br />
►<br />
►<br />
►<br />
Factoring and other activities to improve capital structure;<br />
Optimizing material costs, faster purchasing from LCC;<br />
Restructuring of Asko Group, HI Division, Trade companies;<br />
Restructuring of production companies, transfers of production<br />
►<br />
►<br />
Divesting of some real estate;<br />
►<br />
Reducing headcount;<br />
Exploring new listing locations;<br />
► Implementing new Strategy 2015.<br />
25
Business Plan 2012 – Highlights / Gorenje Group (1)<br />
MEUR B 2012<br />
Change<br />
vs. 2011<br />
Change<br />
vs. 2011<br />
comparable<br />
2011<br />
2011<br />
comparable<br />
Sales 1,391.4 -2.2% 5.6% 1,422.2 1,317.4 1,382.2<br />
CM 585.6 9.6% 10.4% 534.2 530.5 525.4<br />
% CM 42.1% / / 37.6% 40.3% 38.0%<br />
EBITDA 101.3 16.8% 17.6% 86.7 86.2 108.7<br />
2010<br />
% from sales 7.3% / / 6.1% 6.5% 7.9%<br />
EBIT 50.0 36.8% 37.1% 36.5 36.4 56.4<br />
26<br />
% from sales 3.6% / / 2.6% 2.8% 4.1%<br />
PBT 15.9 43.4% 60.9% 11.1 9.9 22.5<br />
% from sales 1.1% / / 0.8% 0.8% 1.6%<br />
PAT 13.4 47.2% 66.3% 9.1 8.1 20.0<br />
% from sales 1.0% / / 0.6% 0.6% 1.4%<br />
• B – Budget<br />
• CM - Contribution margin at the level of difference between sales<br />
revenue and costs of goods and material<br />
Comparable: In the base year 2011 are, to achieve comparability, eliminated the effects of sales Istrabenz Gorenje
Business Plan 2012 – Highlights / Gorenje Group (2)<br />
MEUR B 2012<br />
Change<br />
vs. 2011<br />
2011<br />
Change<br />
vs. 2010<br />
2010<br />
FCF / narrow 28.6 / 35.8 / 17.8<br />
Net debt 380.3 -0.6% 382.5 -4.7% 401.2<br />
27<br />
Net debt / EBITDA 3.8 -14.9% 4.4 19.5% 3.7<br />
Legend:<br />
FCF Narrow = NCF – Capex + Disinvestment +- Changes in Net Working Capital<br />
Net debt = Financial debt – Cash and Cash Equivalents<br />
Net debt / EBITDA = Net financial debt / EBITDA
Business Plan 2012: Sales by region in MEUR<br />
Region B 2012<br />
2011<br />
comparable<br />
Change<br />
W Europe 559.8 (40%) 520.7 (40%) +7.5%<br />
E/SE Europe 718.2 (52%) 701.7 (53%) +2.4%<br />
Other 113.4 (8%) 95.0 (7%) +19.4%<br />
28<br />
Total sales 1,391.4 1,317.4 +5.6%<br />
Comparable: In the year 2011 are, to achieve comparability, eliminated the effects of sales Istrabenz Gorenje
Business Plan 2012: Sales performance in MEUR<br />
Sales<br />
Group<br />
1,422.2<br />
-2.2% +5.6%<br />
1,317.4<br />
1,391.4<br />
2011 2011 comparable B 2012<br />
29<br />
13.9%<br />
1,202.4<br />
Sales<br />
HA<br />
1,055.8 1,055.8<br />
2011 2011 comparable B 2012<br />
B2012<br />
Business<br />
Segment<br />
Home<br />
As % of<br />
Group sales<br />
74.2% 80.1%<br />
86.4%<br />
Comparable: In the year 2011 are, to achieve comparability, eliminated the effects of sales Istrabenz Gorenje
Business Plan 2012: EBIT performance<br />
EBIT<br />
Margin<br />
2.6%<br />
2.8%<br />
3.6%<br />
+36.8% +37.1%<br />
EBIT<br />
(MEUR)<br />
36.5 36.4<br />
50.0<br />
30<br />
2011 2011 comparable B 2012<br />
Comparable: In the year 2011 are, to achieve comparability, eliminated the effects of sales Istrabenz Gorenje
Business Plan 2012 – EBITDA performance<br />
7.3%<br />
EBITDA<br />
Margin<br />
6.5%<br />
6.1%<br />
+16.8% +17.6%<br />
101.3<br />
EBITDA<br />
(MEUR)<br />
86.7 86.2<br />
31<br />
2011 2011 comparable B 2012<br />
Comparable: In the year 2011 are, to achieve comparability, eliminated the effects of sales Istrabenz Gorenje
Business Plan 2012 – PAT performance<br />
1.0%<br />
ROS<br />
0.6% 0.6%<br />
PAT<br />
(MEUR)<br />
9.1 8.1<br />
+47.2% +66.3%<br />
13.4<br />
32<br />
2011 2011 comparable B 2012<br />
Comparable: In the year 2011 are, to achieve comparability, eliminated the effects of sales Istrabenz Gorenje
Business Plan 2012 – FCF (narrow) performance<br />
MEUR B 2012 2011 2010<br />
PAT 13.4 9.1 20.0<br />
Amortization 51.3 50.2 52.2<br />
= NCF 64.7 59.3 72.3<br />
Capex -47.6 -47.5 -44.7<br />
Divestment 19.7 4.4 4.5<br />
NWC -8.2 19.6 -14.2<br />
* Inventories 8.6 12.0 -6.0<br />
* Trade receivables -11.8 50.4 -25.3<br />
* Trade payables -5.0 -42.8 17.1<br />
= FCF (Narrow) 28.6 35.8 17.8<br />
33<br />
Effects of CF optimization in 2011 to 2010:<br />
‒ Net cash flow by -12.9 MEUR / -17.9%<br />
− Capex by -2.8 MEUR / +6.3%<br />
− Divestment by -0.1 MEUR / -2.2%<br />
+ Inventories by +18.0 MEUR<br />
+ Trade receivables by +75.7 MEUR<br />
‒ Trade payables by +59.9 MEUR<br />
Effects of CF optimization in B2012 to 2011:<br />
+ Net cash flow by +5.4 MEUR / +9.1%<br />
‒ Capex by -0.1 MEUR / +0.2%<br />
+ Divestment by +15.3 MEUR<br />
− Inventories by -3.4 MEUR / -28.3%<br />
− Trade receivables by -62.2 MEUR<br />
+ Trade payables by +37.8 MEUR
Business Plan 2012 – Consolidated Balance Sheet<br />
MEUR 2010 2011 B2012 MEUR 2010 2011 B2012<br />
Net non-current<br />
assets<br />
463.0 470.5 438.9 Equity 392.1 397.8 409.3<br />
Inventories 257.6 245.6 240.1 Financial<br />
investments<br />
as % in sales 18.6% 17.3% 17.3%<br />
-53.3 -45.3 -48.9<br />
Trade receivables 306.3 255.9 281.1 Cash and cash<br />
equivalents<br />
as % in sales 22.2% 18.0% 20.2%<br />
-82.7 -101.6 -23.5<br />
34<br />
Trade payables -237.0 -194.2 -180.4 Financial liabilities<br />
total<br />
as % in sales 17.1% 13.7% 13.0%<br />
Net Working Capital 326.9 307.3 340.8<br />
as % in sales 23.6% 21.6% 24.5%<br />
Other current assets /<br />
liabilities<br />
-49.9 -42.8 -39.0<br />
483.9 484.1 403.8<br />
Net Debt 347.9 337.2 331.4<br />
Net Assets 740.0 735.0 740.7<br />
Net Invested<br />
Capital<br />
740.0 735.0 740.7
Strategic plan 2015: Why a new strategy<br />
►<br />
Changes in the environment<br />
• Due to the unstable economic environment stirred by the global financial<br />
crisis, the operating conditions have changed drastically relative to the time<br />
of announcement of the previous strategic plan (early 2010).<br />
►<br />
Changes at the Gorenje Group<br />
• In August 2010, the Group acquired the Asko Group – a Swedish home<br />
appliance manufacturer.<br />
35<br />
• In 2011, intensive activities were launched for divestment of non-core<br />
property and activities (disposal of interest in the company Istrabenz-<br />
Gorenje, divestments in France, Serbia etc.).<br />
►<br />
Adjustment to the requirements of effective management<br />
• Taking a medium-term view of the Gorenje Group operating performance.
Strategic plan 2015: Measures to adjust to the new circumstances<br />
1. Increase robustness to the effects financial crises<br />
►<br />
►<br />
►<br />
►<br />
Profitable increase in volume of business operations<br />
Short-term generation of value: increase in free cash flow<br />
Long-term generation of value: improvement in economic profit / EVA<br />
Debt management: improving the capacity of self-financing, divestment of noncore<br />
assets and activities, diversification of financing sources → possibility of<br />
listing the share in an international stock exchange.<br />
36<br />
2. Seizing the opportunities in the core industry<br />
►<br />
►<br />
►<br />
►<br />
►<br />
Simplifying/streamlining the operations – new organization.<br />
Looking for market niches (both in terms of geographical distribution and<br />
products)<br />
Even more focus on design and innovation<br />
Multi-brand strategy to cover all price segments<br />
A shift from pan-European to global presence, especially with niche products.
Strategic plan 2015: New Gorenje Group Business Model<br />
FOCUS<br />
HOME<br />
DIFFERENTIATION<br />
THROUGH DESIGN<br />
INNOVATION<br />
GLOBALIZATION<br />
STRATEGIC<br />
ALLIANCES<br />
R&D, SALES,<br />
PRODUCTION<br />
INTERNATIONAL<br />
DRIVEN<br />
PERMANENT<br />
CREATION <strong>OF</strong> VALUE<br />
FOR <strong>THE</strong> CUSTOMERS,<br />
SHAREHOLDERS, AND<br />
EMPLOYEES<br />
BRAND/<br />
PRODUCT<br />
PORTFOLIO<br />
37<br />
RESEARCH AND<br />
DEVELOPMENT<br />
NICHE<br />
MANAGEMENT<br />
INDUSTRIAL<br />
KNOW-HOW<br />
DESIGN<br />
SCOPE<br />
&<br />
FLEXIBILITY<br />
CULTURE<br />
OPERATIONAL EXCELLENCE
Strategic plan 2015: Gorenje Group key strategic goals<br />
Profitability of<br />
operating volume<br />
Creating value,<br />
short term<br />
FCF (narrow) at least<br />
EUR 40 million,<br />
in 2015<br />
Turnover (sales<br />
revenue)<br />
> EUR 1.5 billion in<br />
2015<br />
(CAGR 3.8 %)*<br />
Share of brands/<br />
concepts in the<br />
premium price<br />
segment<br />
over 25% in 2015<br />
Creating value,<br />
long term<br />
EBIT above 5% in<br />
2015<br />
MAJOR<br />
STRATEGIC GOALS<br />
Turnover (sales<br />
revenue) beyond<br />
Europe<br />
more than EUR 150<br />
million<br />
in 2015<br />
38<br />
Debt<br />
management<br />
Net debt/EBITDA<br />
not more than 3.0<br />
from 2014 on<br />
* Base year 2011 (eliminated effect of<br />
Istrabenz-Gorenje divestment)<br />
New business model,<br />
organizational<br />
structure/human<br />
resource management,<br />
and corporate<br />
governance<br />
Core activity<br />
shall represent<br />
approximately 90%<br />
in 2015<br />
Financial/business goals<br />
Markets/marketing goals<br />
Business platforms
Strategic plan 2015: Specific goal s by 2015<br />
1<br />
Higher<br />
volume of<br />
operations<br />
2<br />
Improved<br />
profitability<br />
3<br />
Improving<br />
robustness to<br />
financial<br />
crisis<br />
39<br />
• Sales<br />
͌ 1.5 bn €<br />
3.5% CAGR<br />
> 5.0%<br />
• EBIT Margin<br />
• Net debt /<br />
EBITDA<br />
max. 3.0
Strategy without implementation is an illusion and therefore …<br />
►<br />
Annual update of the strategy.<br />
►<br />
The Management Board shall monitor<br />
strategy implementation on a monthly<br />
basis:<br />
►<br />
KPI, key strategic goals<br />
►<br />
Key implementation projects<br />
40<br />
►<br />
The Management Board shall report at<br />
each Supervisory Board session<br />
about the strategy implementation<br />
activities.<br />
STRATEGIC<br />
PLANNING<br />
►<br />
Annual review and adjustment of<br />
strategy – once per year, to be<br />
performed by the Strategic Business<br />
Council.
Factors affecting forward-looking statements<br />
This Presentation contains “forward-looking” statements and information – that is, statements related to future, not<br />
past, events, within the meaning of the Securities Market Act and the Rules and Regulations of the Ljubljana Stock<br />
Exchange. These statements may be identified by words such as “expects,” “looks forward to,” “anticipates,”<br />
“intends,” “plans,” “believes,” “seeks,” “estimates,” “will,” “project” or words of similar meaning. Such statements<br />
include, among others, the financial goals and targets of parent company Gorenje, d.d., and Gorenje Group for<br />
future periods and future business and financial plans. These statements are based on current expectations and<br />
are subject to risks and uncertainties that could cause actual results to differ materially due to a variety of factors. A<br />
variety of factors, many of which are beyond Gorenje's control, affect Gorenje’s operations, performance, business<br />
strategy and results and could cause the actual results, performance or achievements of Gorenje to be materially<br />
different from any future results, performance or achievements that may be expressed or implied by such forwardlooking<br />
statements. These factors include, but may not be limited to the following: consumer demand and market<br />
conditions in the geographical areas and industries in which Gorenje Group operates, effects of currency<br />
fluctuations, competitive pressures to reduce prices, significant loss of business from major retailers, the possibility<br />
that customers may delay the conversion of booked orders into revenue or that prices will decline as a result of<br />
continued adverse market conditions to a greater extent than currently anticipated by Gorenje's management, the<br />
success in developing new products and marketing initiatives, developments in product liability litigation, progress in<br />
achieving operational and capital efficiency goals, the success in identifying growth opportunities and acquisition<br />
candidates and the integration of these opportunities with existing businesses, continued volatility and a further<br />
deterioration of the capital markets, progress in achieving structural and supply-chain reorganization goals. Should<br />
one or more of these risks or uncertainties materialize, or should underlying assumptions prove incorrect, actual<br />
results may vary materially from those described in the relevant forward-looking statement as expected, anticipated,<br />
intended, planned, believed, sought, estimated or projected. Gorenje does not intend or assume any obligation to<br />
update or revise these forward-looking statements in light of developments which differ from those anticipated.<br />
41