The Group KD Group and KD Group dd
The Group KD Group and KD Group dd
The Group KD Group and KD Group dd

You also want an ePaper? Increase the reach of your titles
YUMPU automatically turns print PDFs into web optimized ePapers that Google loves.
<strong>The</strong> <strong>Group</strong> <strong>KD</strong> <strong>Group</strong> <strong>and</strong> <strong>KD</strong> <strong>Group</strong> d.d.<br />
Annual Report 2009
<strong>The</strong> <strong>KD</strong> <strong>Group</strong> Annual Report 2009<br />
Kazalo<br />
1. INTRODUCTION ............................................................................................................................................ 3<br />
Company profile .................................................................................................................................................... 3<br />
<strong>The</strong> <strong>KD</strong> <strong>Group</strong> corporate structure ...................................................................................................................... 5<br />
Activities of the <strong>Group</strong> <strong>KD</strong> <strong>Group</strong> ........................................................................................................................ 7<br />
2. BUSINESS REPORT ..................................................................................................................................... 8<br />
Report of the chief executive officer of <strong>KD</strong> <strong>Group</strong> d. d. ....................................................................................... 8<br />
Report of the management board of <strong>KD</strong> <strong>Group</strong> on the review of the annual report of <strong>KD</strong> <strong>Group</strong> d.d. <strong>and</strong> the<br />
<strong>KD</strong> <strong>Group</strong> for 2009 ............................................................................................................................................ 10<br />
Events that characterised 2009 ......................................................................................................................... 13<br />
Strategic orientations of the <strong>KD</strong> <strong>Group</strong> .............................................................................................................. 17<br />
Shares, dividends <strong>and</strong> ownership structure ...................................................................................................... 19<br />
Analysis of operations ....................................................................................................................................... 31<br />
Capital markets in 2009 ............................................................................................................................... 31<br />
Operations of the <strong>KD</strong> <strong>Group</strong> in 2009 ............................................................................................................. 33<br />
Business operations of <strong>KD</strong> <strong>Group</strong> d.d. in 2009 ............................................................................................. 40<br />
Internal audit ................................................................................................................................................. 45<br />
Human resources <strong>and</strong> development ............................................................................................................. 45<br />
Research <strong>and</strong> development .............................................................................................................................. 49<br />
Corporate social responsibility of the <strong>Group</strong> <strong>KD</strong> <strong>Group</strong> .................................................................................... 51<br />
3. OPERATIONS OF <strong>KD</strong> GROUP COMPANIES ............................................................................................. 54<br />
Banking <strong>and</strong> investment fund management ...................................................................................................... 54<br />
Banking ......................................................................................................................................................... 54<br />
Investment fund management ...................................................................................................................... 56<br />
Insurance .......................................................................................................................................................... 60<br />
Real estate ........................................................................................................................................................ 67<br />
4. FINANCIAL REPORT ............................................................................................................................... 69<br />
2
<strong>The</strong> <strong>KD</strong> <strong>Group</strong> Annual Report 2009<br />
1. INTRODUCTION<br />
Company profile<br />
Parent company: <strong>KD</strong> <strong>Group</strong>, finančna družba, d. d. 1<br />
Abbreviated company name: <strong>KD</strong> <strong>Group</strong> d. d. 4<br />
Registered Office: 206 Celovška cesta, Ljubljana 1000, Slovenia<br />
Telephone: +386 1 582 67 00<br />
Fax: +386 1 518 41 00<br />
E-mail: info@kd-group.com<br />
Website: www.kd-group.com<br />
Activity: 64.200 – Activity of holdings<br />
Legal status: Public limited company<br />
Company registration number: 1585126000<br />
Tax number: 66296374<br />
VAT identification number: SI66296374<br />
Entry in the Company Register: District Court of Ljubljana, no. 2000/15252 dated 3 January 2001, reg. no.<br />
1/34049/00<br />
Share capital: EUR 98,215,756.97<br />
Number of no-par value shares issued: 2,942,053<br />
Number of ordinary registered shares of <strong>KD</strong>HR: 2,675,640<br />
Number of participating preference shares of <strong>KD</strong>HP: 266,413<br />
Date of incorporation: 3 January 2001<br />
Financial highlights<br />
Unit <strong>KD</strong> <strong>Group</strong> d. d. <strong>The</strong> <strong>KD</strong> <strong>Group</strong><br />
Operating revenue in EUR thous<strong>and</strong> 501 367,869<br />
Net profit or loss in EUR thous<strong>and</strong> (52,827) (44,223)<br />
Assets in EUR thous<strong>and</strong> 336,356 847,785<br />
Equity capital in EUR thous<strong>and</strong> 162,305 151,605<br />
Return on equity % (28.3) (25.6)<br />
Share book value EUR 57.38 52.70<br />
Net earnings per share EUR (20.4) (17.1)<br />
1 Initially, <strong>and</strong> when their full or abbreviated name is used, names of the companies or enterprises in the Annual Report include designation of their<br />
organisational status such as d.d.; afterwards, these designations are omitted for more fluent reading.<br />
3
<strong>The</strong> <strong>KD</strong> <strong>Group</strong> Annual Report 2009<br />
Management Board of <strong>KD</strong> <strong>Group</strong> d. d. 2<br />
• Matjaž Gantar, President of the Management Board<br />
• Aleks<strong>and</strong>er Sekavčnik, Deputy President of the Management Board<br />
• Tomaž Butina, Member of the Management Board<br />
• Sergej Racman, Member of the Management Board<br />
• Dr. Draško Veselinovič, Member of the Management Board, CEO<br />
• Peter Grašek, Member of the Management Board, Deputy CEO<br />
2 Following registration in the court register as of 16 November 2009, a one-tier management system was implemented in <strong>KD</strong> <strong>Group</strong>, d.d..<br />
4
<strong>The</strong> <strong>KD</strong> <strong>Group</strong> Annual Report 2009<br />
<strong>The</strong> <strong>KD</strong> <strong>Group</strong> corporate structure<br />
Organisational chart at 31 December 2009<br />
<strong>KD</strong> Fund Advisors LLC, Delaware 90,00%<br />
<strong>KD</strong> Skladi d.o.o., Ljubljana 100,00% <strong>KD</strong> Finančna točka d.o.o., Ljubljana 50,00%<br />
<strong>KD</strong> Investments d.o.o., Zagreb 100,00% <strong>KD</strong> Fondovi AD, Skopje 85,00%<br />
<strong>KD</strong> Investments a.d., Beograd 100,00%<br />
SAI <strong>KD</strong> Investments s.a., Bucharest 100,00%<br />
<strong>KD</strong> Investments EAD, Sofia 100,00% 100,00%<br />
<strong>KD</strong> Banka d.d., Ljubljana 100,00%<br />
<strong>KD</strong> <strong>Group</strong> d.d.<br />
<strong>KD</strong> Upravljanje imovinom d.o.o., Zagreb 100,00%<br />
<strong>KD</strong> Capital Management s.a., Bucharest 100,00%<br />
<strong>KD</strong> Securities EAD, Sofia 100,00%<br />
<strong>KD</strong> Mark d.o.o., Ljubljana 100,00%<br />
<strong>KD</strong> Asset Management b.v., Amsterdam 100,00%<br />
<strong>KD</strong> Finančna točka d.o.o., Zagreb 100,00%<br />
80,10%<br />
<strong>KD</strong> Životno osiguranje d.d., Zagreb 100,00% <strong>KD</strong> Financial point, s.r.o., Bratislava 100,00%<br />
<strong>KD</strong> Life CJSC, Kiev 100,00% 19,90%<br />
<strong>KD</strong> Finančna točka d.o.o., Ljubljana 50,00% <strong>KD</strong> Financial point, s.r.l., Bucharest 100,00%<br />
<strong>KD</strong> Življenje d.d., Ljubljana 100,00%<br />
ZAP d.o.o., Murska Sobota 100,00% <strong>KD</strong> Financial point EOOD, Bulgaria 100,00%<br />
<strong>KD</strong> Life Asigurari s.a., Bucharest 100,00%<br />
Vitavizia d.o.o., Ljubljana 100,00%<br />
<strong>KD</strong> Život a.d., Sofia 100,00%<br />
SC <strong>KD</strong> Fond de Pensii s.a., Bucharest 99,00%<br />
<strong>KD</strong> Kvart d.o.o., Ljubljana 100,00%<br />
Adriatic Slovenica d.d., Koper 100,00% 90,82% AS Neživotno osiguranje a.d.o., Beograd 99,82%<br />
9,00%<br />
20,00%<br />
FM-NET d.o.o., Ljubljana 100,00% Radio Kranj d.o.o., Kranj 52,68%<br />
9,96%<br />
85,76% ABDS d.d., Sarajevo 95,72%<br />
Gama Holdings b.v., Amsterdam 100,00%<br />
ČZD Kmečki Glas d.o.o., Ljubljana 100,00%<br />
<strong>KD</strong> Kapital d.o.o., Ljubljana 100,00% Vrtnarstvo Celje d.o.o., Celje 50,46%<br />
VIB a.d., Banja Luka 51,00%<br />
<strong>KD</strong> Private Equity, Beograd 100,00%<br />
R.E. Invest d.o.o.- in liquidation, Ljubljana 100,00%<br />
Coloseum Multiplex Holdings b.v., Amsterdam 100,00%<br />
Firsthouse Investments ltd., Limassol 100,00% Manta Marine Ventures ltd, BVI 100,00%<br />
Fontes <strong>Group</strong> DOO, Beograd 100,00%<br />
GEA College d.d., Ljubljana 66,57% GEA College PIC d.o.o., Ljubljana 100,00% GEA College CVŠ d.o.o., Ljubljana 100,00%<br />
World Life <strong>Group</strong> ltd., Limassol 100,00%<br />
OOO Sarbon Invest, Tašken 100,00% OOO Kredo <strong>Group</strong>, Tašken 99,97%<br />
Ownership shares in companies in the <strong>KD</strong> <strong>Group</strong> represent interests held by enterprises in the <strong>KD</strong> <strong>Group</strong>.<br />
Associates<br />
Company Ownership stake (in %)<br />
Concorde PS, d. o. o., Šenčur 50.00<br />
Deželna banka Slovenije d. d., Ljubljana 35.62<br />
<strong>KD</strong> ID d. d., Ljubljana 22.06 3<br />
<strong>KD</strong> Private Equity Fund b. v., Amsterdam – in<br />
liquidation 48.21<br />
Nama d. d., Ljubljana 48.46<br />
Seaway <strong>Group</strong> d. o. o., Bled 45.00<br />
Seaway Skupina d.o.o., Ljubljana 48.65<br />
Seaway Technologies s.r.l., Monfalcone 48.65<br />
Semenarna Ljubljana d. d., Ljubljana 29.90<br />
Zellner Holdings Limited, Limassol 48.65<br />
Žicnice Vogel Bohinj d.d., Bohinjsko jezero 21.76<br />
3 Jointly with the parent company, <strong>KD</strong> d. d.<br />
5
<strong>The</strong> <strong>KD</strong> <strong>Group</strong> Annual Report 2009<br />
• <strong>The</strong> <strong>Group</strong> <strong>KD</strong> <strong>Group</strong> corporate structure<br />
<strong>The</strong> <strong>KD</strong> <strong>Group</strong><br />
Property<br />
insurance<br />
Life insurance<br />
Health insurance<br />
Financial services<br />
Banking<br />
Capital investments<br />
<strong>and</strong> real estater<br />
Adriatic Slovenica,<br />
Koper<br />
- property insurance<br />
AS N eživ otno osiguranje,<br />
Beograd<br />
<strong>KD</strong> Življenje, Ljubljana<br />
<strong>KD</strong> Živ otno osiguranje,<br />
Zagreb<br />
<strong>KD</strong> Life, Sofia<br />
<strong>KD</strong> Life Asigurari,<br />
Bucharest<br />
<strong>KD</strong> Life, Kiev<br />
Adriatic Slovenica,<br />
Koper<br />
– life insurance<br />
SC <strong>KD</strong> Fond de Pensii,<br />
Bucharest<br />
ZAP, Murska Sobota<br />
World Life <strong>Group</strong>,<br />
Limassol<br />
Vitav izia, Ljubljana<br />
<strong>KD</strong> Finančna točka,<br />
Ljubljana<br />
<strong>KD</strong> Finančna točka,<br />
Bucharest<br />
<strong>KD</strong> Finančna točka,<br />
Bratislava<br />
<strong>KD</strong> Finančna točka,<br />
Zagreb<br />
<strong>KD</strong> Finančna točka, Sofia<br />
<strong>KD</strong> Mark, Ljubljana<br />
Adriatic Slovenica,<br />
Koper<br />
- Health insurance<br />
<strong>KD</strong> <strong>Group</strong>, Ljubljana<br />
<strong>KD</strong> Skladi, Ljubljana<br />
<strong>KD</strong> Inv estments, Zagreb<br />
<strong>KD</strong> Investments, Beograd<br />
<strong>KD</strong> Fondov i, Skopje<br />
<strong>KD</strong> Investments, Sofia<br />
SAI <strong>KD</strong> Investments,<br />
Bucharest<br />
<strong>KD</strong> Fund Adv isors,<br />
Delaware<br />
ABDS, Sarajevo<br />
Coloseum Multiplex<br />
Holdings, Amsterdam<br />
Firsthouse Inv estments,<br />
Limassol<br />
Gama Holdings, Amsterdam<br />
<strong>KD</strong> Asset management,<br />
Amsterdam<br />
<strong>KD</strong> Priv ate Equity , Beograd<br />
Kredo <strong>Group</strong>, Taškent<br />
Manta Marine Ventures, BVI<br />
VIB, Banja Luka<br />
Sarbon Inv est, Taškent<br />
<strong>KD</strong> Banka, Ljubljana*<br />
<strong>KD</strong> C apital management,<br />
Bucharest<br />
<strong>KD</strong> Securities, Sofia<br />
<strong>KD</strong> U prav ljanje<br />
imov inom, Zagreb<br />
<strong>KD</strong> Kapital, Ljubljana<br />
<strong>KD</strong> Kvart, Ljubljana<br />
Skupina Gea College,<br />
Ljubljana<br />
ČZD Kmečki Glas,<br />
Ljubljana<br />
FM-N ET, Ljubljana<br />
Fontes <strong>Group</strong>, Beograd<br />
Radio Kranj, Kranj<br />
R.E. Invest – in<br />
liquidation, Ljubljana<br />
Vrtnarstvo Celje, Celje<br />
* <strong>KD</strong> Banka began operating on 2 March 2009 following the transformation <strong>and</strong> expansion of operations of the stockbrokerage company <strong>KD</strong> BPD, borznosposredniška družba,<br />
d.o.o.<br />
6
<strong>The</strong> <strong>KD</strong> <strong>Group</strong> Annual Report 2009<br />
Activities of the <strong>Group</strong> <strong>KD</strong> <strong>Group</strong><br />
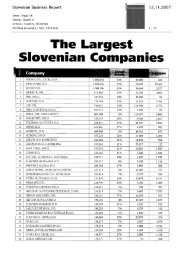
<strong>The</strong> <strong>Group</strong> <strong>KD</strong> <strong>Group</strong>, which celebrated its 15th anniversary in 2009, is one of the largest business groups in Slovenia. <strong>The</strong><br />
<strong>Group</strong>'s principal activities are:<br />
• insurance;<br />
• investment fund management;<br />
• banking <strong>and</strong>;<br />
• capital investments <strong>and</strong> real estate.<br />
<strong>The</strong> principal business activity of the parent company <strong>KD</strong> <strong>Group</strong> d. d. is the management of listed <strong>and</strong> non-listed investments<br />
<strong>and</strong> the generation of financial returns in accordance with the structure of its portfolio. <strong>The</strong> parent company makes decisions<br />
regarding all the <strong>KD</strong> <strong>Group</strong>’s major strategic investments.<br />
Insurance<br />
<strong>The</strong> <strong>KD</strong> <strong>Group</strong>'s insurance business comprises life, property <strong>and</strong> health insurance. It has two public limited companies in<br />
Slovenia: <strong>KD</strong> Življenje, a life insurer, <strong>and</strong> Adriatic Slovenica, a universal insurance company that markets life insurance <strong>and</strong><br />
property insurance, including health insurance. In accordance with the strategy of exp<strong>and</strong>ing the <strong>KD</strong> <strong>Group</strong> activities to<br />
foreign markets, in the previous year insurance companies within the <strong>Group</strong> operated on the following foreign markets:<br />
Ukraine, Croatia, Romania <strong>and</strong> Bulgaria, as well as in Slovakia through a branch office. <strong>The</strong> <strong>Group</strong> is marketing property<br />
insurance in Serbia through property insurance company AS neživotno osiguranje a.d.o. Beograd, Serbia.<br />
<strong>The</strong> key strategic orientations of the <strong>KD</strong> <strong>Group</strong> in the field of insurance are based primarily on operating growth on the local<br />
<strong>and</strong> foreign markets <strong>and</strong> on a comprehensive range of financial services provided through a variety of sales networks.<br />
In Slovenia, we further reinforced <strong>and</strong> consolidated existing sales channels.<br />
Investment fund management<br />
Five investment management companies within the <strong>KD</strong> <strong>Group</strong> manage a total of 27 mutual funds <strong>and</strong> two investment<br />
companies in the South-eastern region of Europe. <strong>KD</strong> Skladi, Ljubljana, currently the largest management company in<br />
Slovenia, is the leading investment fund management company in the <strong>Group</strong>. <strong>The</strong> company manages the umbrella fund “<strong>KD</strong><br />
Krovni sklad” with 17 sub funds <strong>and</strong> <strong>KD</strong> ID, delniška investicijska družba, d. d. as well as assets of the well-informed<br />
investors. Currently, four management companies operate outside the Slovenian borders who jointly manage eleven<br />
investment funds: four mutual funds in Croatia, two in Romania, two mutual funds <strong>and</strong> one investment company in Bulgaria<br />
<strong>and</strong> two mutual funds in Macedonia.<br />
Banking<br />
In 2009, the <strong>KD</strong> <strong>Group</strong> began operating on the banking market following a transformation of <strong>KD</strong> BPD from a limited liability<br />
company into a public limited company on 2 March 2009 <strong>and</strong> assuming a new name of <strong>KD</strong> Banka.<br />
Initially, <strong>KD</strong> Banka concentrated on private, personal <strong>and</strong> investment banking services, including stockbrokerage, individual<br />
asset management <strong>and</strong> corporate finance services. However, in order to adjust to the changed economic conditions, <strong>KD</strong><br />
Banka decided for early implementation of the basic corporate banking services, while at the same time it was developing<br />
services for the mass market, which began to be marketed through the sales network of branch offices by <strong>KD</strong> Finančna točka<br />
in February 2010.<br />
In a<strong>dd</strong>ition to <strong>KD</strong> Banka operating in Slovenia, other companies also operated in the banking division in 2009 namely in<br />
Croatia, Bulgaria <strong>and</strong> Romania.<br />
Capital investments <strong>and</strong> real estate<br />
<strong>The</strong> <strong>Group</strong>’s capital investments are managed by the <strong>KD</strong> Kapital. This division includes real estate services, publishing, <strong>and</strong><br />
managing of closed investment funds in South Eastern Europe (Bosnia <strong>and</strong> Herzegovina <strong>and</strong> Republika Srpska).<br />
In the <strong>Group</strong> <strong>KD</strong> <strong>Group</strong>, real estate services are provided by <strong>KD</strong> Kvart, a young, dynamic <strong>and</strong> ambitious company, whose<br />
core activity is investment engineering in the field of real estate. <strong>The</strong> strategy of the real estate division is to search for new<br />
opportunities for the development of real estate projects, real estate sale, <strong>and</strong> management of real estate owned by the<br />
<strong>Group</strong> <strong>KD</strong> <strong>Group</strong>.<br />
7
<strong>The</strong> <strong>KD</strong> <strong>Group</strong> Annual Report 2009<br />
2. BUSINESS REPORT<br />
REPORT OF THE CHIEF EXECUTIVE OFFICER OF <strong>KD</strong> GROUP D. D.<br />
Global financial crisis provided an incentive for reorganisation of the <strong>Group</strong> <strong>KD</strong> <strong>Group</strong> <strong>and</strong> implementation of measures for<br />
business rationalisation. <strong>The</strong>se activities began in 2009 <strong>and</strong> will continue 2010. <strong>The</strong> loss of EUR 44 million incurred by the<br />
<strong>Group</strong> <strong>KD</strong> <strong>Group</strong> in 2009 is to a large extent the consequence of poor performances of companies operating abroad <strong>and</strong><br />
also a result of global financial crisis. <strong>The</strong> <strong>Group</strong> <strong>KD</strong> <strong>Group</strong> has already adopted strategic decisions concerning companies<br />
operating abroad in terms of which markets should be pursued further <strong>and</strong> from which to withdraw. <strong>The</strong> relevant measures<br />
have already been implemented. <strong>The</strong> poorest results were recorded by companies operating in South-eastern Europe<br />
(Romania, Bulgaria, Ukraine, <strong>and</strong> Serbia), the region where the financial crisis impact on financial institutions was worst <strong>and</strong><br />
where the consequences were the largest. <strong>The</strong> major share of the loss incurred by the <strong>Group</strong> <strong>KD</strong> <strong>Group</strong> is due to the<br />
<strong>Group</strong>'s withdrawal from the South-eastern European markets in which the <strong>Group</strong> did not have the controlling interest <strong>and</strong><br />
where no profits were expected in the long-term. <strong>The</strong> proceeds will be used to realise the adopted strategy. Companies<br />
operating in Slovenia are performing well <strong>and</strong> in 2009 exceeded the planned results.<br />
<strong>The</strong> <strong>KD</strong> <strong>Group</strong>'s performance in 2009 was better than in 2008, resulting in a loss of EUR 44 million. Operating revenue in<br />
2009 reached EUR 368 million, a decrease of 6 percent compared with 2008. Decrease in the revenue is due to the disposal<br />
of enterprises in the cinematographic division in 2008. Revenue from insurance premiums, which account for the majority of<br />
revenue, rose by 3 percent compared with 2008. At the end of the year, total assets amounted to EUR 848 million, an<br />
increase of 7 percent compared to 2008, whereas total capital was reduced by EUR 41 million or 21 percent compared with<br />
2008. At the end of 2009, the <strong>Group</strong> <strong>KD</strong> <strong>Group</strong> reported EUR 152 million of capital <strong>and</strong> EUR 182 million of financial liabilities.<br />
<strong>The</strong> majority (almost EUR 100 million) represents long-term financial liabilities maturing in 2015. I wish to stress that the<br />
<strong>Group</strong> <strong>KD</strong> <strong>Group</strong> regularly meets its obligations concerning interest <strong>and</strong> principal repayments. We have established good<br />
relationships with all commercial banks. In 2010, the <strong>Group</strong> <strong>KD</strong> <strong>Group</strong> is expected to generate profit of EUR 4 million, rising<br />
to as much as EUR 11 million in 2011. <strong>The</strong> results of the first few months of 2010 confirm these trends.<br />
<strong>The</strong> <strong>Group</strong> <strong>KD</strong> <strong>Group</strong> believes that the adopted strategic decisions provide solid basis for continued development of the<br />
Company <strong>and</strong> the entire <strong>Group</strong> <strong>KD</strong> <strong>Group</strong>. Majority of the <strong>KD</strong> <strong>Group</strong>'s revenue comes from the third largest insurance in<br />
Slovenia, Adriatic Slovenica, the largest investment management company in Slovenia - <strong>KD</strong> Skladi, fast growing life<br />
insurance company<strong>KD</strong> Življenje, <strong>and</strong> <strong>KD</strong> Banka, a private bank, rounding up a comprehensive palette of financial services<br />
provided by the <strong>Group</strong>.<br />
Insurance<br />
Insurance companies within the <strong>Group</strong> <strong>KD</strong> <strong>Group</strong> were in 2009 involved in intense expansion <strong>and</strong> improvement of their range<br />
of products <strong>and</strong> services as well as development of new, specialised insurance products aimed at individual target groups.<br />
Market share of 12.56 percent recorded in 2009, makes Adriatic Slovenica the third largest insurance company in Slovenia.<br />
In terms of property insurance, the insurance company held a 17.01 percent share in 2009, 23.9 percent share in health<br />
insurance places the company in the second place on the health insurance market, while the company holds the leading<br />
position on the market of above-st<strong>and</strong>ard health insurance. Due to its consolidated market network <strong>and</strong> modern insurance<br />
products supplemented by first-class assistance services, the insurance company has set even more ambitious goals for the<br />
next financial year.<br />
Life insurance company <strong>KD</strong> Življenje is the second largest life insurance providers in Slovenia <strong>and</strong> in spite of unstable<br />
economic conditions at the end of 2009 it increased its market share to 14.1 percent. Slovenian life insurance market was in<br />
2009 marked primarily by the financial crisis reflected in an average 3.8 percent decline which was preceded by several<br />
years of continuous growth of the life insurance sectors.<br />
<strong>The</strong> goals for 2010 include life insurance premiums of over EUR 84 million, over 256 million premiums for property insurance<br />
(including health insurance premiums) which translates into 3.6 percent increase in property insurance premiums <strong>and</strong> 5<br />
percent growth in the health insurance market.<br />
In accordance with the adopted strategic decisions, the <strong>Group</strong> <strong>KD</strong> <strong>Group</strong> will withdraw from those markets where the results<br />
are below the expectations <strong>and</strong> will instead, concentrate on the Slovenian market.<br />
8
<strong>The</strong> <strong>KD</strong> <strong>Group</strong> Annual Report 2009<br />
Investment fund management<br />
<strong>KD</strong> Skladi maintained its leading position among the Slovenian management companies in terms of assets <strong>and</strong> range of<br />
funds <strong>and</strong> at the end of 2009 it managed over EUR 421 million of assets in 17 sub funds of <strong>KD</strong> Krovni sklad <strong>and</strong> <strong>KD</strong> ID,<br />
delniška investicijska družba.<br />
Five management companies operate within the <strong>Group</strong> <strong>KD</strong> <strong>Group</strong> which jointly manage 27 mutual funds <strong>and</strong> two investment<br />
companies.<br />
By the mid 2009 conditions on the capital markets were slowly stabilizing <strong>and</strong> from March onwards we have seen increase in<br />
share prices indices which improved the general level of investors’ optimism. Funds within the <strong>Group</strong> <strong>KD</strong> <strong>Group</strong> performed<br />
well in terms of their return (majority recorded positive returns) <strong>and</strong> in terms of new investors. In terms of return, they<br />
successfully competed with local <strong>and</strong> foreign competition with some of them being the leaders in individual categories. <strong>The</strong><br />
increased trend in the number of accession forms continued <strong>and</strong> funds recorded positive inflows. At the end of 2009 total<br />
value of managed assets of all asset management companies in the <strong>KD</strong> <strong>Group</strong> reached EUR 449.1 million, compared to<br />
EUR 360.6 million recorded at the end of 2008.<br />
In 2010 we will continue with our efforts to confirm our excellence in asset management <strong>and</strong> justify investors' trust. We will<br />
intensify our efforts for improved recognition of <strong>KD</strong> funds in order to preserve the leading position in Slovenia <strong>and</strong> consolidate<br />
our market shares in South-eastern Europe.<br />
Banking<br />
2009 marked the entry of the <strong>Group</strong> <strong>KD</strong> <strong>Group</strong> in the banking sector. On 2 March 2009, following a resolution of the Bank of<br />
Slovenia to grant licence to <strong>KD</strong> BPD for the performance of banking <strong>and</strong> financial services <strong>and</strong> resolution of the Securities<br />
Market Agency to grant permission to <strong>KD</strong> BPD for statutory conversion from a limited liability company into a public limited<br />
company, the company became a public limited company <strong>and</strong> assumed a new name of <strong>KD</strong> Banka. Initially, <strong>KD</strong> Banka<br />
concentrated on private, personal <strong>and</strong> investment banking services, including stockbrokerage, individual asset management<br />
<strong>and</strong> corporate finance services. However, in order to adjust to the changed economic conditions, <strong>KD</strong> Banka decided for early<br />
implementation of the basic corporate banking services, while at the same time it was developing services for the mass<br />
market, which began to be marketed through the sales network of branch offices by <strong>KD</strong> Finančna točka in February 2010.<br />
At the end of 2009 <strong>KD</strong> Banka had more than 3,200 clients, while total value of assets held by private clients <strong>and</strong> assets in<br />
individual management stood at EUR 51 million, <strong>and</strong> 336 million of brokerage assets.<br />
In 2010 we intend to improve our range of banking services with new services including investment consultation, a range of<br />
credits <strong>and</strong> savings, as well as other financial instruments. <strong>The</strong> range of services adjusted to the needs <strong>and</strong> wishes of clients<br />
will be available through a variety of marketing channels.<br />
2010<br />
<strong>The</strong> basic orientation of the <strong>Group</strong> <strong>KD</strong> <strong>Group</strong> is to consolidate its position on the financial services market. In 2010 we will<br />
continue the process of business consolidation, preserve the existing strategy concerning strategic investments, <strong>and</strong><br />
continue with well-thought disposal of investments which are not of strategic importance. In a<strong>dd</strong>ition we will focus on<br />
successful companies <strong>and</strong> support their further development.<br />
Our mission is a satisfied customer able to choose between a comprehensive <strong>and</strong> complete range of financial services. We<br />
are gaining new, satisfied <strong>and</strong> loyal clients who are able to find solutions to their financial issues <strong>and</strong> realise their wishes at a<br />
single location – in the companies within the <strong>Group</strong> <strong>KD</strong> <strong>Group</strong>.<br />
Draško Veselinovič, PhD<br />
CEO<br />
9
<strong>The</strong> <strong>KD</strong> <strong>Group</strong> Annual Report 2009<br />
REPORT OF THE MANAGEMENT BOARD OF <strong>KD</strong> GROUP ON THE REVIEW OF THE ANNUAL REPORT OF <strong>KD</strong> GROUP<br />
D.D. AND THE <strong>KD</strong> GROUP FOR 2009<br />
Dear Shareholders,<br />
Based on authorisations <strong>and</strong> competences, laid down in the Articles of Association, the managing process <strong>and</strong> operations of<br />
<strong>KD</strong> <strong>Group</strong> d.d. <strong>and</strong> the <strong>Group</strong> <strong>KD</strong> <strong>Group</strong>, were supervised <strong>and</strong> monitored by the Supervisory Board until 15 November 2009<br />
<strong>and</strong> since 16 November 2009, by the Management Board in accordance with the legislation <strong>and</strong> Rules of procedures of the<br />
Supervisory Board <strong>and</strong> the Management Board.<br />
On 16 November 2009, members of the Supervisory Board who were again appointed at the 12 th General Meeting of<br />
Shareholders held on 6 March 2009, operated in unchanged composition as follows: Aleš Vahčič, PhD - President, Alojz<br />
Penko – Deputy president <strong>and</strong> Bojan Sekavčnik – member.<br />
A one-tier management system was implemented at the 14 th General Meeting of Shareholders, with appointment of the first<br />
Management Board of the Company in the following composition: Matjaž Gantar – President, Aleks<strong>and</strong>er Sekavčnik –<br />
Deputy president, Sergej Racman – member, Tomaž Butina- member, Draško Veselinovič, PhD – member <strong>and</strong> CEO, <strong>and</strong><br />
Peter Grašek, appointed as member of the Management Board <strong>and</strong> deputy CEO. <strong>The</strong> Management Board in its function of<br />
the supervisory <strong>and</strong> management body began its m<strong>and</strong>ate on 16 November 2009.<br />
<strong>The</strong> Report of the Management Board's operations includes <strong>and</strong> describes also operations of the Supervisory Board until the<br />
expiration of its m<strong>and</strong>ate. <strong>The</strong> term »management of the Company« comprises operations of the Management Board until<br />
the implementation of a one-tier management system, as well as operations of the executive members of the Management<br />
Board.<br />
Operations of the Supervisory Board <strong>and</strong> the Management Board<br />
<strong>The</strong> Supervisory Board <strong>and</strong> the Management Board performed their roles in the corporate governance system in accordance<br />
with the legal competences <strong>and</strong> responsibilities by regular monitoring of daily operations, by learning about the operations of<br />
the management <strong>and</strong> its decisions <strong>and</strong> by reviewing proposals for changes <strong>and</strong> amendments. Through discussion <strong>and</strong><br />
proposed initiatives <strong>and</strong> opinions, the Management Board as the Supervisory Board before it, operated not only in their<br />
supervisory role, but were also involved in developing of business strategies. <strong>The</strong> Supervisory Board <strong>and</strong> the Management<br />
Board performed their tasks consistently <strong>and</strong> responsibly.<br />
In accordance with their legal <strong>and</strong> statutory competences, the Supervisory Board <strong>and</strong> the Management Board in 2009<br />
regularly monitored <strong>and</strong> supervised the Company’s operations throughout their m<strong>and</strong>ates. <strong>The</strong>y discussed the management<br />
reports on daily operations <strong>and</strong> activities of the Company, learnt about important business events, monitored the work of the<br />
management <strong>and</strong> followed implementation of the adopted resolutions. <strong>The</strong>y primarily focused on professional supervision of<br />
the operations <strong>and</strong> realisation of the strategy of the Company <strong>and</strong> the <strong>KD</strong> <strong>Group</strong>. <strong>The</strong>y regularly monitored performance of<br />
the Company <strong>and</strong> <strong>Group</strong> companies located abroad. By regular monitoring of the Company's performance, reviewing<br />
proposals for changes <strong>and</strong> developing initiatives <strong>and</strong> opinions, their role was not only that of an active supervisor but also of<br />
someone actively involved in the development of business strategies jointly with the Company's management.<br />
In 2009 the Supervisory Board of <strong>KD</strong> <strong>Group</strong> held one constitutive meeting, eleven regular sessions <strong>and</strong> four correspondence<br />
sessions <strong>and</strong> adopted a total 69 resolutions.<br />
<strong>The</strong> Management Board of <strong>KD</strong> <strong>Group</strong> held a constitutive meeting in 2009, two regular meetings <strong>and</strong> adopted a total of 25<br />
resolutions.<br />
Through written materials <strong>and</strong> explanations provided by the management at meeting <strong>and</strong> through close cooperation with the<br />
management, the Management Board <strong>and</strong> the Supervisory Board regularly monitored performance of the Company. <strong>The</strong><br />
quorum was always present at the meetings of the Management Board <strong>and</strong> the Supervisory Board <strong>and</strong> all members actively<br />
participated in the discussions. <strong>The</strong> Company's management supplied all the relevant information to the Supervisory <strong>and</strong> the<br />
Management Boards which were necessary for the performance of their supervisory <strong>and</strong> managerial roles. <strong>The</strong> Management<br />
Board therefore assesses the co-operation of the Company's management as good.<br />
At their meetings, the Management Board <strong>and</strong> the Supervisory Board discussed the following more important business<br />
events <strong>and</strong> adopted the following more important resolutions:<br />
10
<strong>The</strong> <strong>KD</strong> <strong>Group</strong> Annual Report 2009<br />
• At the correspondence meeting on 2 February 2009 the Supervisory Board appointed a four-member Management<br />
Board whose m<strong>and</strong>ate commenced on 3 February 2009 <strong>and</strong> determined competences of the President <strong>and</strong> members<br />
of the Board;<br />
• At its 4 th meeting held on 28 May 2009 the Supervisory Board discussed the audited Annual Report of <strong>KD</strong> <strong>Group</strong> d.d.<br />
<strong>and</strong> the audited Annual Report of the <strong>KD</strong> <strong>Group</strong> for 2008 <strong>and</strong> was informed of the auditor's opinions <strong>and</strong> proposal for<br />
the distribution of the profit; further it adopted annual report of the Supervisory Board on the review of the annual<br />
reports thus giving its approval to the Annual Reports of <strong>KD</strong> <strong>Group</strong> d.d. <strong>and</strong> the <strong>Group</strong> <strong>KD</strong> <strong>Group</strong>. <strong>The</strong> Supervisory<br />
Board adopted the Constitution of the Audit Committee of <strong>KD</strong> <strong>Group</strong> d.d., appointed Audit Committee of the<br />
Supervisory Board, <strong>and</strong> discussed <strong>and</strong> approved <strong>KD</strong> <strong>Group</strong>'s plan for 2009 <strong>and</strong> internal audit plan of <strong>KD</strong> <strong>Group</strong> for<br />
2009;<br />
• At its 5 th meeting held on 14 July 2009 the Supervisory Board discussed current business of the <strong>KD</strong> <strong>Group</strong> <strong>and</strong><br />
business report for the period January – May 2009;<br />
• At its 7 th meeting on 15 September 2009 the Management Board appointed Draško Veselinovič member of the<br />
Management Board with his m<strong>and</strong>ate commencing on 1 October 2009 <strong>and</strong> again allocated individual business areas to<br />
members of the Management Board;<br />
• At its 3 rd conference meeting on 7 October 2009 the Supervisory Board was informed of the proposed Agenda for the<br />
14 th General Meeting of Shareholders, proposals for decisions <strong>and</strong> their justification, <strong>and</strong> with regards to the<br />
implementation of a one-tier management system of the Company, gave its proposals for appointment of members of<br />
the Management Board of <strong>KD</strong> <strong>Group</strong>;<br />
• At its 10 th regular meeting on 30 October 2009 the Supervisory Board discussed the non-audited business report of <strong>KD</strong><br />
<strong>Group</strong> d.d. <strong>and</strong> the <strong>Group</strong> <strong>KD</strong> <strong>Group</strong> for the first six months of 2009 <strong>and</strong> the report on current business of <strong>KD</strong> <strong>Group</strong><br />
from January to September 2009;<br />
• At the constitutive meeting on 9 November 2009 the Management Board appointed Matjaž Gantar, member, President<br />
of the Management Board, Aleks<strong>and</strong>er Sekavčnik Deputy president, <strong>and</strong> Draško Veselinovič the CEO <strong>and</strong> Peter Graško<br />
Deputy CEO.<br />
• At its 1 st regular meeting held on 23 November 2009 the Management Board discussed current business <strong>and</strong> appointed<br />
Audit Committee of the Management Board.<br />
<strong>The</strong> Company ensured business transparency through periodical <strong>and</strong> a<strong>dd</strong>itional regular informing of the Shareholders <strong>and</strong><br />
other public via simultaneous publications on the Ljubljana Stock Exchange website SEOnet http://seonet.ljse.si <strong>and</strong> the<br />
Company's website www.kd-group.com.<br />
Based on the above, the Management Board has concluded that it was informed of all more important business events in<br />
2009 that affected the performance of the Company <strong>and</strong> the <strong>Group</strong> <strong>KD</strong> <strong>Group</strong>. In view of the method of information provision<br />
<strong>and</strong> cooperation between the management <strong>and</strong> the Management Board during the year it was not necessary for the<br />
Management Board or its individual members to ask for a<strong>dd</strong>itional information or to verify documentation on which the<br />
information, important for the decision-making, was based.<br />
Management Board's report on relations with the controlling entity<br />
<strong>The</strong> Management Board also discussed the management’s report about relations with the controlling entity <strong>KD</strong> d.d. <strong>and</strong><br />
transactions with related parties in 2009, <strong>and</strong> has concluded that in the conclusion of legal transactions <strong>and</strong> other legal acts<br />
between the controlling entity <strong>and</strong> its related parties, <strong>KD</strong> <strong>Group</strong> d.d. suffered no damage or deprivation.<br />
Annual Report 2009 – View of the auditor's report, review <strong>and</strong> the Annual Report's approval<br />
<strong>The</strong> audit of the Annual Reports of <strong>KD</strong> <strong>Group</strong> d.d. <strong>and</strong> the <strong>Group</strong> <strong>KD</strong> <strong>Group</strong> for the year 2009 (hereafter: Annual reports for<br />
2009) was performed by the auditing firm Ernst & Young d.o.o., Ljubljana, who issued an unqualified opinion on the two<br />
Annual Reports on 14 April 2009.<br />
<strong>The</strong> audited Annual reports for 2009 were discussed by the Management Board on 22 April 2010.<br />
<strong>The</strong> Management Board considered the two Annual reports <strong>and</strong> auditor's opinions for 2009 <strong>and</strong> has concluded the following:<br />
• <strong>The</strong> 2009 Annual reports have been compiled in accordance with the Companies Act, Articles of Association <strong>and</strong> the<br />
current accounting <strong>and</strong> reporting requirements;<br />
11
<strong>The</strong> <strong>KD</strong> <strong>Group</strong> Annual Report 2009<br />
• <strong>The</strong> reports are comprised of all statutory formal <strong>and</strong> substantive elements of a commercial company's annual report<br />
as required under the law <strong>and</strong> subsequently all the key data necessary for making decisions concerning their<br />
approval;<br />
• <strong>The</strong> 2009 Annual reports are inclusive of the auditor's opinion on the financial statement audit. It is clear from the<br />
auditor's report that the financial statements are true <strong>and</strong> fair presentation of the financial position, operating result<br />
<strong>and</strong> cash flows of <strong>KD</strong> <strong>Group</strong> d.d. <strong>and</strong> the <strong>Group</strong> <strong>KD</strong> <strong>Group</strong>. <strong>The</strong> certified auditor issued un unqualified opinion on<br />
both sets of the financial statements.<br />
Based on the above the Management Board issues the following observations:<br />
Following its review of the auditor's opinions in accordance with paragraph 2, Article 282 of ZGD-1, the Management Board<br />
hereby confirms that it has no comments on the opinions <strong>and</strong> agrees with the reports’ findings.<br />
In accordance with paragraph 2, Article 282 of ZGD-1C the Management Board hereby confirms that it has no comments on<br />
the Annual reports for the year 2009 <strong>and</strong> gives its approval to the Annual report 2009 of <strong>KD</strong> <strong>Group</strong> d.d. <strong>and</strong> to the Annual<br />
Report 2009 of the <strong>Group</strong> <strong>KD</strong> <strong>Group</strong>.<br />
Proposal for the net profit distribution<br />
As part of the Annual reports 2009 review, the Management Board has found that in accordance with the resolution of the<br />
management, the net loss of 2009 of EUR 52,827,433.37 was, as at 31 December 2009, settled as follows:<br />
- EUR 8,152,469.82 was debited to the remaining portion of the retained earnings after the formation of treasury<br />
reserves.<br />
- EUR 44,674,963.55 was debited to capital surplus.<br />
<strong>KD</strong> <strong>Group</strong> as at 31.12.2009 does not have profit for appropriation, therefore the Mangement Board did not create a<br />
resolution regarding the use of the profit for the assembly.<br />
Based on the review of operations of <strong>KD</strong> <strong>Group</strong> d.d. <strong>and</strong> the <strong>Group</strong> <strong>KD</strong> <strong>Group</strong> in 2009 as well as the audited Annual reports<br />
of the Company <strong>and</strong> the <strong>Group</strong>, the Management Board proposes to the General Meeting to grant dismissal to members of<br />
the management <strong>and</strong> supervisory bodies for the year 2009.<br />
Ljubljana, 22 April 2010<br />
Matjaž Gantar<br />
President of the Management Board of <strong>KD</strong> <strong>Group</strong><br />
12
<strong>The</strong> <strong>KD</strong> <strong>Group</strong> Annual Report 2009<br />
EVENTS THAT CHARACTERISED 2009<br />
Changes in the composition of the <strong>KD</strong> <strong>Group</strong><br />
16 January<br />
- <strong>KD</strong> Finančna Točka d.o.o., Ljubljana acquires <strong>KD</strong> Financial Point in Bulgaria.<br />
10 June<br />
- <strong>KD</strong> Finančna Točka d.o.o. acquires Vitavizia d.o.o.<br />
3 July<br />
- <strong>KD</strong> <strong>Group</strong> d.d. acquires Sarbon Invest d.o.o., Uzbekistan.<br />
27 July<br />
- <strong>KD</strong> Kapital acquires FM-NET d.o.o.<br />
29 October<br />
- <strong>KD</strong> Kapital d.o.o., Ljubljana disposes of its stake in <strong>KD</strong> Mont a.d., Monte negro.<br />
6 December<br />
- <strong>KD</strong> <strong>Group</strong> d.d. disposes of <strong>KD</strong> Investments Bratislava<br />
13
<strong>The</strong> <strong>KD</strong> <strong>Group</strong> Annual Report 2009<br />
Other key events in 2009<br />
January<br />
– As one of the first in Slovenia, <strong>KD</strong> Skladi, Ljubljana, establishes <strong>KD</strong> Krovni sklad whereby all of its 17 mutual funds<br />
are transformed into its sub funds.<br />
– <strong>KD</strong> Skladi, Ljubljana, in cooperation with Concorde Premoženjsko svetovanje d. o. o. begins marketing new<br />
savings plan VIP plus 100.<br />
– At the now traditional, fifth presentation of awards to the best mutual fund managers by the magazine Kapital, the<br />
<strong>KD</strong> MM money market fund receives a "Gold V" award in the category of one-year money market funds.<br />
February<br />
– On 3 February 2009, the Supervisory Board of <strong>KD</strong> <strong>Group</strong> d. d. adopts a decision on the appointment of a fourmember<br />
Management Board, comprising Matjaž Gantar, President, <strong>and</strong> Peter Grašek, Matija Šenk <strong>and</strong> Aljoša<br />
Tomaž, members.<br />
– <strong>KD</strong> Življenje organises an all-day family event at Postojna Caves to mark the Slovenian Cultural Holiday – the 3 rd<br />
Day of Culture <strong>and</strong> Attractions, where a palaeontology exhibition of cretaceous fossils <strong>and</strong> replicas of dinosaur<br />
skeletons are on display.<br />
– AS neživotno osiguranje, Beograd, opens a branch office in Niš.<br />
March<br />
- At the 12 th General Meeting of Shareholders on 6 March, the members of <strong>KD</strong> <strong>Group</strong> d. d.'s Supervisory Board,<br />
Aleš Vahčič, PhD, Alojz Penko <strong>and</strong> Bojan Sekavčnik are reappointed. <strong>The</strong> term of Supervisory Board members<br />
begins on 9 March.<br />
- <strong>KD</strong> Banka, specialising in private <strong>and</strong> personal banking services, begins operations.<br />
- <strong>The</strong> <strong>Group</strong> <strong>KD</strong> <strong>Group</strong> celebrates 15 years of operations: on 11 March 1994, Kmečka družba, the legal predecessor<br />
of <strong>KD</strong> Skladi, was entered in the Company Register.<br />
- <strong>KD</strong> Življenje begins marketing Fondpolica Maks Garant Plus, a unique whole of life insurance product with<br />
instalment or one-time premium payment <strong>and</strong> a payout of a minimum sum of net premium payments when the<br />
insurance term expires.<br />
– Peter Groznik, PhD assumes the function of President of the Management Board of <strong>KD</strong> Skladi.<br />
April<br />
– Matej Marošek becomes President of the Management Board of <strong>KD</strong> Finančna točka.<br />
– <strong>The</strong> concert event of the year, Volkswagner, takes place: the musical project, initiated by <strong>KD</strong> <strong>Group</strong> d. d., combines<br />
the talents of the legendary group Laibach, the RTV Slovenija symphony orchestra <strong>and</strong> conductor Izidor Leitinger.<br />
<strong>The</strong> <strong>KD</strong> <strong>Group</strong> uses the concert as a platform for the gr<strong>and</strong> celebration of its 15 th anniversary of operations.<br />
May<br />
– Matej Tomažin becomes president of the Management board of <strong>KD</strong> Investments d.o.o., Zagreb.<br />
– <strong>The</strong> <strong>KD</strong> Victoria fund, managed by <strong>KD</strong> Investments, Zagreb celebrates its 10 th anniversary of operations.<br />
– <strong>KD</strong> Življenje again sponsors the 3 rd Festival of families organised in front of the entrance to the Postojna Caves.<br />
– Adriatic Slovenica, insurance company, introduces a novelty – My first car policy – a new insurance cover available<br />
to drivers with less than three years of driving experience.<br />
June<br />
– <strong>The</strong> General Meeting of <strong>KD</strong> Finančna točka appoints Katja Kraškovic member of the Management Board to<br />
continue the work of Darja Gabrovšek Polajnar.<br />
– <strong>The</strong> Management Board of <strong>KD</strong> Življenje appoints Gregor Šušmelj Director of the branch office <strong>KD</strong> Life in Slovakia,<br />
thus replacing Pavol Norulak, the former CEO.<br />
– Radovan Pušnar assumes the role of a member of the Management Board <strong>and</strong> CEO of <strong>KD</strong> Life AD, Bulgaria.<br />
July<br />
– <strong>KD</strong> Življenje launches new life insurance product on the market called ŽIVLJENSKI KASKO (HULL LIFE<br />
INSURANCE) – life assurance policy where the sum insured is paid over the duration of the insurance policy..<br />
– <strong>KD</strong> Kapital d. o. o. <strong>and</strong> ABDS d. d., Sarajevo are joint sponsors of summer holidays at Debeli rtič for children from<br />
Bosnia <strong>and</strong> Herzegovina, organised for the fifth consecutive year by the institution »Krog« as part of their<br />
humanitarian <strong>and</strong> development project »Give a Smile«.<br />
14
<strong>The</strong> <strong>KD</strong> <strong>Group</strong> Annual Report 2009<br />
August<br />
– <strong>KD</strong> Skladi becomes the largest trust company in Slovenia in terms of the volume of assets under management.<br />
– At the ‘Trusted Br<strong>and</strong>'' award ceremony, <strong>KD</strong> Skladi is awarded first place in Slovenia in the category »Investment<br />
companies <strong>and</strong> Mutual funds«.<br />
September<br />
– From September <strong>KD</strong> Življenje offers a Guaranteed package, a stable <strong>and</strong> safe investment guaranteeing annual<br />
return of a minimum 2.75%. If the return exceeds the guaranteed level, life insurances with the Guaranteed<br />
package are eligible for the attribution of the annual surplus.<br />
– <strong>KD</strong> Skladi launches a new savings plan VIP 100 Premium, which provides long-term return <strong>and</strong> allows investors<br />
savings for a variety of purposes such as acquisition of a real estate, to supplement your pension, to provide<br />
schooling for your children or gr<strong>and</strong>children <strong>and</strong> other purposes, all with minimum regular payments into <strong>KD</strong> Krovni<br />
sub funds.<br />
– <strong>KD</strong> Privilege organises a lecture by Paul Krugman, a Nobel prize winner for economy <strong>and</strong> a lecturer at the<br />
University of Princeton.<br />
– <strong>KD</strong> Življenje opens a new branch office in Koper.<br />
October<br />
– <strong>The</strong> Management Board of Adriatic Slovenica Zavarovalna družba d. d. becomes a three-member Board following<br />
retirement of Milena Georgievski, a long-term member <strong>and</strong> Deputy Chairperson of the Management Board. Other<br />
functions of the insurance company's Management remain unchanged.<br />
– Celebration of arrival of three Saimiri Monkeys to the Ljubljana ZOO after <strong>KD</strong> Življenje sponsored construction of a<br />
new animal habitat.<br />
– AS osiguranje in Serbia opens new offices of its business unit in Čačak.<br />
– <strong>KD</strong> Banka integrates its first ATM into a network of ATMs linked to a Bankart processing centre.<br />
– Special achievements awards in the field of PR are awarded at a formal evening of the 13 th Slovene PR<br />
conference - Prizma 2009. One of the awarded communications projects is also project developed by <strong>KD</strong> Življenje<br />
»Dignitaries arriving to Ljubljana«, the first joint project marking a long-term partnership between <strong>KD</strong> Življenje <strong>and</strong><br />
Ljubljana ZOO.<br />
– <strong>KD</strong> Fondovi, Macedonia celebrates the first anniversary of its two funds: “<strong>KD</strong> Brik” <strong>and</strong> “<strong>KD</strong> Južen Balkan”.<br />
November<br />
– <strong>The</strong> first magazine is issued under the <strong>KD</strong> Privilege trademark, intended for all potential <strong>and</strong> existing private<br />
banking clients.<br />
– <strong>The</strong> one-tier management system is implemented in <strong>KD</strong> <strong>Group</strong> following its registration in the court register.<br />
– <strong>KD</strong> Življenje <strong>and</strong> Turizem Kras in cooperation with partners successfully bring to an end the Dinosaurs exhibition in<br />
the Postojna Caves. In more than 10 months, the skeleton of the Mamenchisaurus was probably seen by over<br />
472,000 visitors to the caves. <strong>The</strong> exhibition was seen by over 14,000 Slovene visitors who could purchase the<br />
ticket for the caves at a 50% family discount.<br />
December<br />
– <strong>The</strong> first anniversary of the publication of the “Financial consultant when&how” magazine issued by <strong>KD</strong> Skladi <strong>and</strong><br />
<strong>KD</strong> Življenje.<br />
– In order to optimize operations of <strong>KD</strong> <strong>Group</strong> as the only stakeholder in <strong>KD</strong> Investments, for the purpose of adapting<br />
the operations of the <strong>KD</strong> <strong>Group</strong> to market conditions, <strong>and</strong> following the resolution of the KHoV – Serbian Securities<br />
Market Agency (Komisija za Hartije od Vrednosti RS), consensus was given for the transfer of “<strong>KD</strong> Ekskluziv” fund<br />
to Citadel Asset Management.<br />
15
<strong>The</strong> <strong>KD</strong> <strong>Group</strong> Annual Report 2009<br />
Important events following the end of the 2009 financial year<br />
January<br />
– <strong>KD</strong> Galileo, the first Slovene investment fund became off age in 2010, celebrating its 18 th birthday. As a pioneer in<br />
this particular field it is of great importance for the development of Slovene capital market as it has contributed to<br />
the development of today's highly competitive mutual funds sector. Since its establishment, over 50,000 investors<br />
have entrusted their assets to the fund which is today, with over EUR 150 million of assets under management, the<br />
largest Slovene fund (excluding funds established on transformation of investment companies).<br />
– www.financna-tocka.si website presents its new image, structure <strong>and</strong> comprehensive range of products <strong>and</strong><br />
services provided by <strong>KD</strong>. For the first time a uniform <strong>and</strong> exp<strong>and</strong>ed presentation of financial, banking <strong>and</strong><br />
insurance products <strong>and</strong> services of the <strong>KD</strong> <strong>Group</strong> is available on one location.<br />
– <strong>KD</strong> Življenje life insurance company launches a new product on the market “Fondpolica Solist” life insurance tied to<br />
the value of a unit of the assets of a long-term business fund “Aktivni naložbeni paket”.<br />
February<br />
– As from 15 February 2010, <strong>KD</strong> Banka’s personal accounts, cards, online banking, savings account <strong>and</strong> deposits<br />
are available to the wider public in all branches of <strong>KD</strong> Finančna točka in Slovenia. Thus <strong>KD</strong> Banka, which has<br />
initially provided private, personal <strong>and</strong> investment banking services, upgraded its range of products <strong>and</strong> services<br />
with a wide palette of commercial banking services.<br />
– By opening a classical personal account, clients will be issued BA Maestro card which will allow them to draw cash<br />
at all ATMs in Slovenia <strong>and</strong> the EMU countries.<br />
– Mastercard allows clients to defer payments (interest-free), thus saving time <strong>and</strong> money whilst having also a free<br />
accident insurance in the event of death or permanent disability.<br />
– Advantages of savings account which is administered by <strong>KD</strong> Banka free-of-charge include instant liquidity of<br />
money, as cash can be transferred from personal account to the savings account <strong>and</strong> vice versa at any time.<br />
Savings account pays interest at highly competitive rates (currently one of the best rates of interest compared to<br />
other Slovene banks) <strong>and</strong> money can be withdrawn at any time as it is not deposited for a specified term.<br />
– Online bank, one of the first in Slovenia, combines commercial <strong>and</strong> investment banking services, allows for a<br />
comprehensive overview of services provided by <strong>KD</strong> Banka <strong>and</strong> domestic, overseas <strong>and</strong> international payment<br />
processing. Online banking clients are able to order purchase or sale of securities on domestic (LJSE) <strong>and</strong> foreign<br />
markets (currently XETA). In a<strong>dd</strong>ition, transfer from trading to a personal account is free. Through online banking<br />
clients may transfer funds between accounts freely <strong>and</strong> at any time.<br />
– <strong>KD</strong> Banka also offers short-term <strong>and</strong> long-term deposits as a means of a safe <strong>and</strong> reliable investment.<br />
– <strong>KD</strong> Življenje insurance company has for the fourth consecutive time organised now traditional gathering of families<br />
called Day of Culture <strong>and</strong> Attractions.<br />
March<br />
– <strong>KD</strong> Skladi sponsored the project Clean Slovenia in One day by becoming the project’s Golden sponsor.<br />
– <strong>KD</strong> Banka is integrated into the Bankarta centre which allows online payment using the special money order form.<br />
– <strong>KD</strong> banka organises roundtable “Where does exit strategy lead to <strong>and</strong> what it means for financial markets? on 3<br />
March in the Gr<strong>and</strong> Hotel Union where experts from the field of economy, finance <strong>and</strong> business exchanged their<br />
views <strong>and</strong> opinions.<br />
– <strong>KD</strong> Življenje life insurance company launches new life insurance product Fondpolica EKSKLUZIV, developed in<br />
cooperation with a renowned banking group BNP Paribas. This is a whole of life insurance policy where premiums<br />
are paid in instalments <strong>and</strong> which offers a number of exclusive benefits including the best entry in the investment<br />
<strong>and</strong> a<strong>dd</strong>itionally integrated safeguards which provides a unique opportunity for a safe <strong>and</strong> profitable investment.<br />
April<br />
– <strong>KD</strong> banka introduces new service for retail users allowing them to make long-term deposits via online banking or in<br />
any of the <strong>KD</strong> Finančna točka branches.<br />
16
<strong>The</strong> <strong>KD</strong> <strong>Group</strong> Annual Report 2009<br />
STRATEGIC ORIENTATIONS OF THE <strong>KD</strong> GROUP<br />
MISSION, VISION, VALUES<br />
Mission: responsible partnership between users, employees <strong>and</strong> owners<br />
<strong>The</strong> <strong>Group</strong> manages financial assets of its users in a responsible, efficient <strong>and</strong> safe manner to ensure return. Employees<br />
have the best working conditions, many possibilities for education, promotion <strong>and</strong> are granted incentives for job well done.<br />
<strong>The</strong> <strong>Group</strong> ensures expected growth <strong>and</strong> profit for the owners <strong>and</strong> creates socially responsible partnerships between<br />
mutually equal agents.<br />
Vision: development growth <strong>and</strong> response expansion<br />
We are a respected, dynamic <strong>and</strong> socially responsible financial group. Trustworthy experts fulfil the expectations of<br />
customers with services that are a step ahead of the times. Accessible in one location, we shape the trends of financial<br />
services in Southern <strong>and</strong> Eastern Europe.<br />
Values: growth, respect, trust, excellence <strong>and</strong> support.<br />
Growth<br />
- professional approach <strong>and</strong> innovation are the corner stone of our growth.<br />
- we are flexible <strong>and</strong> responsive.<br />
- through sharing of knowledge <strong>and</strong> ideas we disseminate good practices<br />
- my personal growth is our success<br />
Respect<br />
- in interactions with others we are kind, positive <strong>and</strong> honest<br />
- we are open to opinions of others – we know how to listen <strong>and</strong> hear<br />
- we appreciate everyone’s contribution, his/her uniqueness <strong>and</strong> diversity<br />
Trust<br />
- we have confidence in ourselves <strong>and</strong> our capabilities: we know how <strong>and</strong> we can<br />
- through prudent <strong>and</strong> responsible actions we create a circle of trust<br />
- we are genuine <strong>and</strong> keep to our agreements<br />
Excellence<br />
- through commitment <strong>and</strong> perseverance we realise our high objectives<br />
- we are a step in front<br />
- we work to the best of our abilities <strong>and</strong> together we recognise our successes<br />
- we act in concert<br />
Support<br />
- we generate safe <strong>and</strong> positive working environment<br />
- through collegiality we find the right way to ensure results<br />
- we promote healthy balance between personal, family <strong>and</strong> business life<br />
- we cooperate <strong>and</strong> help each other<br />
REALISATION OF STRATEGIC OBJECTIVES AND ORIENTATIONS<br />
<strong>The</strong> <strong>KD</strong> <strong>Group</strong>'s strategic objectives <strong>and</strong> orientations were realised again in 2009 by seeking the best solutions <strong>and</strong> taking<br />
advantage of opportunities for the growth <strong>and</strong> development of all companies in the <strong>Group</strong>.<br />
17
<strong>The</strong> <strong>KD</strong> <strong>Group</strong> Annual Report 2009<br />
Key operating highlights of division-based activities<br />
– At the end of 2009 <strong>KD</strong> Banka had over 3,200 clients, while total value of assets held by private clients <strong>and</strong> assets<br />
under individual management stood at EUR 51 million, <strong>and</strong> EUR 336 million of brokerage assets. <strong>The</strong> operations of<br />
the banking division were marked by financial crisis to which we have responded efficiently. Much attention was<br />
devoted to communications with our clients as we believe that direct communication is of vital importance as it<br />
enables development of an individual relationship between a bank clerk <strong>and</strong> the client. <strong>The</strong>refore we adjusted our<br />
communications with clients to the time that was most suitable for them. In 2009 <strong>KD</strong> Banka focused on private <strong>and</strong><br />
investment banking. We have developed a range of products for corporate entities inclusive of transaction accounts,<br />
deposits <strong>and</strong> a variety of credit facilities as well as online bank “Halcom”. For retail clients <strong>KD</strong> Banka developed<br />
variety o personal accounts, payment cards, savings accounts, deposit accounts with various maturities, Lombard<br />
loans <strong>and</strong> online banking.<br />
– By mid 2009 conditions on capital markets have slowly stabilised <strong>and</strong> from March onwards the growth on capital<br />
markets helped to boost investor confidence. In terms of return <strong>and</strong> also in terms of gaining new investors, the funds<br />
within the <strong>Group</strong> performed well. In terms of return our funds successfully competed against local <strong>and</strong> foreign<br />
competition <strong>and</strong> some were best performed funds in their individual categories. <strong>The</strong> trend of increasing number of<br />
accession forms has continued resulting in positive cash flows of the funds managed by the <strong>Group</strong>. At the end of the<br />
year total assets managed by all asset management companies in the <strong>Group</strong> stood at EUR 449.1 million, compared<br />
to EUR 360.6 million at the end of 2008.<br />
– Insurance sector could not avoid the impact of global economic crisis which was demonstrated in limited growth in<br />
property insurances <strong>and</strong> negative growth of gross life insurance premiums. In 2009 the <strong>KD</strong> <strong>Group</strong> gained a 17%<br />
share on Slovene insurance market with a total of EUR 329.3 million of insurance premiums ( Adriatic Slovenica<br />
EUR 260.6 million <strong>and</strong> <strong>KD</strong> Življenje EUR 68.7million). <strong>KD</strong> Življenje life insurance company is the second largest life<br />
insurance company in Slovenia <strong>and</strong> in spite of difficult market conditions, at the end of 2009 it increased its market<br />
share to solid 14.1 percent. In 2009 Adriatic Slovenica recorded a 12.56% market share, making it the third largest<br />
insurance company in Slovene insurance market. In property insurance division the insurance company recorded a<br />
17.01 percent share of the market <strong>and</strong> in health insurance divisions, a 23.9 percent % market share.<br />
– At the end of 2009 <strong>KD</strong> Finančna točka's range of insurance products comprised life insurance provided by <strong>KD</strong><br />
Življenje, information, consultancy <strong>and</strong> accession to 17 sub funds of <strong>KD</strong> Krovni sklad <strong>and</strong> VIP 100 Premium savings<br />
plan offered by <strong>KD</strong> Skladi, health <strong>and</strong> property insurance offered by Adriatic Slovenica, stockbrokerage services,<br />
individual asset management services provided by <strong>KD</strong> Banka <strong>and</strong> voluntary health insurance abroad inclusive of<br />
assistance, offered by Assistance CORIS. <strong>The</strong> range of services of <strong>KD</strong> Finančna točka will be further increased in the<br />
beginning of 2010 with banking services provided by <strong>KD</strong> Banka. At the end of 2009 <strong>KD</strong> Finančna točka registered<br />
851 new investors <strong>and</strong> over EUR 18 million of direct payments into the mutual funds of <strong>KD</strong> Skladi, <strong>and</strong> together with<br />
transfers, we recorded a total of EUR 32 million of payments. <strong>KD</strong> Finančna točka agreed over 9,000 new insurance<br />
policies <strong>and</strong> 2,000 insurance policies were agreed with the existing insurants. Total new annual premium stood at<br />
over EUR 5,300,000 <strong>and</strong> single premium over EUR 4,700,000. Our website www.financna-tocka.si had over 250,000<br />
visitors in 2009, <strong>and</strong> our <strong>KD</strong> Plus Club had over 72,000 members at the end of 2009.<br />
Looking ahead to 2010<br />
– In the previous year we focused on expansion of our range of services with banking products <strong>and</strong> services. Through<br />
a comprehensive range of financial <strong>and</strong> insurance services we have realised one of our key strategic objectives of the<br />
<strong>KD</strong> <strong>Group</strong>. In 2010 we will devote our attention to making our products <strong>and</strong> services available to the wider public by<br />
developing sales channels which will enable individuals to arrange all their financial matters in one place.<br />
– Comprehensive range of products <strong>and</strong> services <strong>and</strong> complementarities between the <strong>Group</strong> companies allow us to<br />
efficiently utilise internal synergies. In 2010 we shall strive to organise our operations in a manner that will ensure<br />
efficiency whilst at the same time preserving or even improving high quality st<strong>and</strong>ards of our services.<br />
– Due to stringent conditions on markets <strong>and</strong> sectors where the <strong>Group</strong> operates, we will have to focus primarily on the<br />
most promising markets <strong>and</strong> activities.<br />
18
<strong>The</strong> <strong>KD</strong> <strong>Group</strong> Annual Report 2009<br />
SHARES, DIVIDENDS AND OWNERSHIP STRUCTURE<br />
Basic information on shares, dividends <strong>and</strong> equity<br />
<strong>KD</strong> <strong>Group</strong>'s share capital totalled EUR 98,215,756.97 as at 31 December 2009 <strong>and</strong> was represented by 2,942,053 no-parvalue<br />
shares (of which 2,675,640 were ordinary shares of <strong>KD</strong>HR, while 266,413 were preference participating shares of<br />
<strong>KD</strong>HP).<br />
Ordinary shares of <strong>KD</strong> <strong>Group</strong> (<strong>KD</strong>HR) have been listed on the entry market of the Ljubljana Stock Exchange since 5<br />
February 2001. At incorporation, all issued shares were defined as ordinary registered shares with voting rights <strong>and</strong> a<br />
nominal value of EUR 33.38 each. <strong>The</strong> first General Meeting of Shareholders held in May 2001 passed a resolution<br />
converting a maximum of 595,691 ordinary registered shares into cumulative preference shares with no voting rights.<br />
Preference shares (<strong>KD</strong>HP) have been listed on the entry of the Ljubljana Stock Exchange since 12 July 2001. <strong>The</strong> rights of<br />
holders of these shares include:<br />
– the right of priority in payment of dividends before holders of ordinary shares in the amount of EUR<br />
1.67, for a cumulative period of five years;<br />
– in the event of a dividend payout to holders of ordinary shares, the right to the payment of a<strong>dd</strong>itional<br />
dividends of at least EUR 1.67, bringing the total dividend to a maximum of EUR 3.34;<br />
– during the liquidation of the company, priority in the payment of residual assets before holders of<br />
ordinary shares in the amount of EUR 33.38.<br />
Authorised capital totalled EUR 49,107,878 as at 31 December 2009. Pursuant to the resolution passed at the 8 th General<br />
Meeting of Shareholders on 13 October 2005, the Management Board is authorised to increase the company’s share capital<br />
by a maximum of EUR 49,107,878 by issuing new shares for cash or contributions-in-kind within five years following the<br />
entry of the amendment to the Articles of Association in the Company Register (16 November 2005). <strong>The</strong> Management<br />
Board has not yet used the authorised capital.<br />
<strong>The</strong> book value of the <strong>KD</strong>HR <strong>and</strong> <strong>KD</strong>HP shares was EUR 57.38 as at 31 December 2009, a decrease of 23% from the<br />
previous year, when it stood at EUR 74.57. <strong>The</strong> book value of a share is calculated as the book value of the equity of<br />
majority shareholders as at the end of the accounting period under the IFRS, divided by the number of all shares, excluding<br />
treasury shares, as at the end of the accounting period.<br />
Net earnings per share amounted to EUR -20.35 in 2009, compared to EUR -2.55 in 2008. Net earnings per share was<br />
calculated as the net profit pertaining to majority shareholders less dividends paid on preference shares (excluding treasury<br />
shares) for the accounting period divided by the average number of all issued ordinary shares, excluding treasury shares, in<br />
the accounting period.<br />
Share price movement<br />
Ordinary shares of <strong>KD</strong>HR in 2009<br />
Transactions made on the Ljubljana Stock Exchange in 2009 in ordinary shares of <strong>KD</strong>HR totalled EUR 2,676,049.41. <strong>The</strong><br />
share price stood at EUR 54.50 at the beginning of the year. <strong>The</strong> lowest share price in 2009 was EUR 48.40, while the<br />
highest price was EUR 61.46.<br />
Basic indicators for ordinary shares of <strong>KD</strong>HR:<br />
Share details As at 31 st December 2008<br />
As at 31 st December 2009<br />
(EUR) Index 09/08 (in %)<br />
Number of shares 2,675,640 2,675,640 0<br />
Market price (in EUR) 54.10 50.57 -6.52<br />
Market capitalisation (in million EUR) 144.75 135.31 -6.52<br />
Sources: Ljubljana Stock Exchange, GVIN <strong>and</strong> own calculations of <strong>KD</strong> <strong>Group</strong><br />
19
<strong>The</strong> <strong>KD</strong> <strong>Group</strong> Annual Report 2009<br />
Comparison of changes in SBITOP (in points) <strong>and</strong> the share price of <strong>KD</strong>HR (in EUR) from 1 January 2009 to 31 December<br />
2009:<br />
Source: Ljubljana Stock Exchange<br />
Preference shares of <strong>KD</strong>HP in 2009<br />
Transactions made on the Ljubljana Stock Exchange in 2009 in preference shares of <strong>KD</strong>HP reached EUR 738,359.30. <strong>The</strong><br />
share price of <strong>KD</strong>HP began the year at EUR 25.29. <strong>The</strong> share price fell to its lowest value on the one but last trading day (29<br />
December 2009), when it was worth EUR 18.21. <strong>The</strong>re were considerably fewer transactions made in preference shares of<br />
<strong>KD</strong> <strong>Group</strong> in 2009 than in ordinary shares, the difference being as much as 72.41 percent.<br />
Basic indicators for preference shares of <strong>KD</strong>HP:<br />
Share details As at 31st December 2008<br />
As at 31st December 2009<br />
(EUR) Index 09/08 (in %)<br />
Number of shares 266,413 266,413 0<br />
Market price (in EUR) 25.29 18.28 -27.72<br />
Market capitalisation (in million<br />
EUR) 6.74 4.87 -27.72<br />
Sources: Ljubljana Stock Exchange, Bloomberg, own calculations of <strong>KD</strong> <strong>Group</strong><br />
Comparison of changes in SBITOP (in points) <strong>and</strong> the share price of <strong>KD</strong>HP (in EUR) from 1 January 2009 to 31 December<br />
2009:<br />
Source: Ljubljana Stock Exchange<br />
20
<strong>The</strong> <strong>KD</strong> <strong>Group</strong> Annual Report 2009<br />
Ownership structure<br />
<strong>The</strong> largest shareholder of <strong>KD</strong> <strong>Group</strong> is the company <strong>KD</strong>, finančna družba, d. d., owning 1,859,312 registered ordinary<br />
shares of <strong>KD</strong>HR, or 69.49 % of all such shares, <strong>and</strong> 63.20 % of all shares issued. In all transactions with the parent company<br />
<strong>KD</strong> in 2009, <strong>KD</strong> <strong>Group</strong> d. d. received the appropriate payments <strong>and</strong> compensation <strong>and</strong> did not suffer any losses as the result<br />
of these transactions.<br />
Ownership structure of <strong>KD</strong> <strong>Group</strong> d. d. as at 31 December 2009:<br />
Number of<br />
shareholders Number of shares Share (in %)<br />
<strong>KD</strong>HR – registered ordinary shares<br />
Domestic entities 26,075 2,548,470 86.62<br />
Legal entities 112 2,276,685 77.38<br />
Individuals 25,963 271,785 9.24<br />
Foreign entities 282 127,170 4.32<br />
Legal entities 57 124,623 4.24<br />
Individuals 225 2,547 0.09<br />
Total <strong>KD</strong>HR 26,357 2,675,640 90.94<br />
<strong>KD</strong>HP – registered participating preference<br />
shares<br />
Domestic entities 10,961 225,945 7.68<br />
Legal entities 30 114,656 3.90<br />
Individuals 10,931 111,289 3.78<br />
Foreign entities 56 40,468 1.38<br />
Legal entities 13 40,036 1.36<br />
Individuals 43 432 0.01<br />
Total <strong>KD</strong>HP 11,017 266,413 9.06<br />
Total 37,374 2,942,053 100.00<br />
Ten largest holders of ordinary shares (<strong>KD</strong>HR) as at 31 December 2009:<br />
Shareholder<br />
Location<br />
Number of<br />
<strong>KD</strong>HR shares<br />
Proportion of all<br />
<strong>KD</strong>HR shares<br />
(in %)<br />
1 <strong>KD</strong> d. d. Ljubljana 1,859,312 69.49<br />
2 <strong>KD</strong>H Naložbe d. o. o. Ljubljana 111,095 4.15<br />
3 Caranthania Investments Luxembourg 102,457 3.83<br />
4 Auctor d. o. o. Ljubljana 99,168 3.71<br />
5 Avra d. o. o. Ljubljana 91,281 3.41<br />
6 Adriatic Slovenica d. d. Koper 46,000 1.72<br />
7 Onisac d. o. o. Ljubljana 20,862 0.78<br />
8 Zveza bank reg. z. zo. j. bank und revisions Celovec 17,897 0.67<br />
9 <strong>KD</strong> <strong>Group</strong> d. d. Ljubljana 16,201 0.61<br />
10 Šifrer Peter Medvode 7,982 0.30<br />
Total of the top ten holders of <strong>KD</strong>HR shares 2,372,255 88.66<br />
Others 303,385 11.34<br />
Total <strong>KD</strong>HR shares 2,675,640 100<br />
21
<strong>The</strong> <strong>KD</strong> <strong>Group</strong> Annual Report 2009<br />
Ten largest holders of preference shares (<strong>KD</strong>HP) as at 31 December 2009:<br />
Shareholder<br />
Location<br />
N umber of<br />
<strong>KD</strong>HP shares<br />
Proportion of all<br />
<strong>KD</strong>HP shares<br />
(in %)<br />
1 Adriatic Slovenica d. d. Koper 51,306 19.26<br />
2 Cercia Holding Limited Limassol 38,892 14.60<br />
3 Marles d. d. Limbuš 21,291 7.99<br />
4 <strong>KD</strong>H Naložbe, d. o. o. Ljubljana 13,070 4.91<br />
5 Krona Senior d. d. Ljubljana 10,000 3.75<br />
6 Vovk Boštjan Ljubljana 7,665 2.88<br />
7 Niton d. o. o. Ljubljana 7,441 2.79<br />
8 PM & A d. o. o. Ljubljana 6,040 2.27<br />
9 Tomažin Matej Ljubljana 2,050 0.77<br />
10 Gostinstvo Žalec, d. o. o. Žalec 2,019 0.76<br />
Total of the top ten holders of <strong>KD</strong>HP shares 159,774 59.98<br />
Others 106,639 40.02<br />
Total <strong>KD</strong>HP shares 266,413 100<br />
Ten largest holders of regular (<strong>KD</strong>HR) <strong>and</strong> preference shares (<strong>KD</strong>HP) jointly as at 31 December 2009:<br />
Shareholder<br />
Location<br />
Number of<br />
<strong>KD</strong>HR <strong>and</strong><br />
<strong>KD</strong>HP shares<br />
Proportion of share<br />
capital<br />
<strong>KD</strong>HR <strong>and</strong> <strong>KD</strong>HP<br />
(in %)<br />
1 <strong>KD</strong> d. d. Ljubljana 1,859,312 63.20<br />
2 <strong>KD</strong>H Naložbe, d. o. o. Ljubljana 124,165 4.22<br />
3 Caranthania investments Luxembourg 102,457 3.48<br />
4 Auctor d. o. o. Ljubljana 99,168 3.37<br />
5 Avra, d. o. o. Ljubljana 91,281 3.10<br />
6 Adriatic Slovenica d. d. Koper 97,306 3.31<br />
7 Cercia Holding Limited Limassol 38,892 1.32<br />
8 Marles d. d. Limuš 21,291 0.72<br />
9 Onisac d. o. o. Ljubljana 20,862 0.71<br />
10 Zveza bank reg. z. zo. j. bank und revisions Celovec 18,882 0.64<br />
Total of the top ten holders of <strong>KD</strong>HP <strong>and</strong> <strong>KD</strong>HR shares 2,473,616 84.08<br />
Others 468,437 15.92<br />
Total <strong>KD</strong>HP <strong>and</strong> <strong>KD</strong>HR shares 2,942,053 100<br />
Treasury shares<br />
<strong>KD</strong> <strong>Group</strong> d. d. held 16,201 ordinary <strong>KD</strong>HR shares representing 0.55% of the company's share capital as at 31 December<br />
2009<br />
22
<strong>The</strong> <strong>KD</strong> <strong>Group</strong> Annual Report 2009<br />
CORPORATE GOVERNANCE STATEMENT<br />
Responsible corporate governance is the basis for all the <strong>KD</strong> <strong>Group</strong>’s activities. This mission is followed by the management<br />
<strong>and</strong> supervisory bodies of the parent company <strong>KD</strong> <strong>Group</strong>, where a one-tier management system has been implemented<br />
since 16 November 2009. <strong>KD</strong> <strong>Group</strong> d. d. provides the Corporate Governance Statement in accordance with the provision<br />
from the fifth paragraph of Article 70 of the Companies Act. Explanations relating to the sixth paragraph of Article 70 of the<br />
Companies Act are given in the section Shares, Dividends <strong>and</strong> Ownership Structure <strong>and</strong> on the company's website at<br />
www.kd-group.com.<br />
Management system of <strong>KD</strong> <strong>Group</strong><br />
In 2009, <strong>KD</strong> <strong>Group</strong> d.d. changed from a two-tier management system where competences are divided between the General<br />
Meeting, Supervisory Board <strong>and</strong> the Management Board, to a one-tier management system where management process is<br />
exercised with cooperation between the General Meeting <strong>and</strong> the Management Board. Below we present operations of the<br />
General Meeting in 2009, whose competences in both systems are comparable, followed by a description of operations of<br />
the two-tier management system which was exercised in the Company from its establishment <strong>and</strong> until 15 November 2009.<br />
Further we provide description of the roles <strong>and</strong> position of the Management Board members, CEOs <strong>and</strong> audit committee in<br />
relation to the General Meeting, as assumed by them on 16 November 2009.<br />
1. General Meeting of Shareholders of <strong>KD</strong> <strong>Group</strong><br />
<strong>The</strong> General Meeting of Shareholders of <strong>KD</strong> <strong>Group</strong> d. d. adopts the basic decisions leading to the realisation of the central<br />
economic objective: creating value for shareholders.<br />
In 2009 the General Meeting held 12 th , 13 th <strong>and</strong> 14 th General Meeting of Shareholders, with an average 84.13 percent<br />
representation of all ordinary <strong>KD</strong>HR shares with voting rights. At the 13 th General Meeting where, according to the agenda,<br />
holders of the preference shares also had a right to vote, 20.68 percent of all preference <strong>KD</strong>HP shares were represented.<br />
At the 12 th General Meeting of Shareholders on 6 March 2009, the m<strong>and</strong>ate of the Supervisory Board members was<br />
extended.<br />
At the 13 th General Meeting of Shareholders on 28 August 2009, the Shareholders adopted a resolution not to appropriate<br />
the balance sheet profit of EUR 8,903,201.33 as at 31 December 2009 <strong>and</strong> to defer the decision on its appropriation until the<br />
next year. <strong>The</strong> Shareholders issued a discharge to the Management Board <strong>and</strong> the Supervisory Board, thus confirming <strong>and</strong><br />
approving the work of their members in 2008, further they adopted a resolution on determination of compensation to<br />
members of the Supervisory Board <strong>and</strong> its Committee members, <strong>and</strong> appointed auditing firm Ernst & Young, d. o. o.,<br />
Ljubljana, as the auditors for the financial year 2009.<br />
At the 14th General Meeting of Shareholders on 9 November 2009, the Shareholders adopted amendments to the Articles of<br />
Association of the Company related to the implementation of a one-tier management system, supplementation of the<br />
Company's activity, <strong>and</strong> harmonisation of the provisions of the General Meeting of Shareholders with the Companies Act<br />
ZGD-1C. Due to a transfer to a one-tier management system, the Shareholders decided that as of the day of registration of<br />
the amendments to the Article of Association in the court register, the m<strong>and</strong>ate of members of the Management <strong>and</strong><br />
Supervisory Board expires, <strong>and</strong> they appointed members of the first Management Board of <strong>KD</strong> <strong>Group</strong> for the first four-year<br />
m<strong>and</strong>ate.<br />
Resolutions passed at the 12 th , 13 th <strong>and</strong> 14 th General Meeting of Shareholders were published <strong>and</strong> are accessible on the<br />
SEOnet website <strong>and</strong> at the Company's website at (http://www.kd-group.com/?subpage=741).<br />
23
<strong>The</strong> <strong>KD</strong> <strong>Group</strong> Annual Report 2009<br />
2. Management bodies at <strong>KD</strong> <strong>Group</strong> d. d. – tasks <strong>and</strong> responsibilities in a two-tier management system<br />
2.1. Supervisory Board<br />
<strong>The</strong> operations of the parent company <strong>KD</strong> <strong>Group</strong> was until <strong>and</strong> including 15 November 2009, supervised by a threemember<br />
Supervisory Board. Its powers <strong>and</strong> responsibilities were set out in its own Rules of Procedure, the company’s<br />
Articles of Association <strong>and</strong> the applicable legislation. Due to a transfer to a one-tier management system, the m<strong>and</strong>ate of<br />
all members of the Supervisory Board expired whereby at the last day of their m<strong>and</strong>ate, on 15 November 2009, the<br />
composition of the Supervisory Board was as follows:<br />
• Aleš Vahčič, PhD (Chairman), doctorate in economics<br />
• Alojz Penko (Deputy Chairman), agronomic engineer<br />
• Bojan Sekavčnik (Member), university graduate in economics<br />
2.1.1. Work of the Supervisory Board<br />
<strong>KD</strong> <strong>Group</strong> d. d.’s Supervisory Board held one constitutive session, eleven regular sessions <strong>and</strong> four correspondence<br />
sessions in 2009. At its sessions, the Supervisory Board regularly monitored the Company's operations <strong>and</strong> that of the <strong>KD</strong><br />
<strong>Group</strong> <strong>and</strong> monitored the implementation of the adopted business plan. <strong>The</strong> Supervisory Board provided details regarding its<br />
work in the Report of the Supervisory Board to Shareholders on Verification of the Annual Report. This report is submitted to<br />
shareholders as part of the materials for the General Meeting of Shareholders, which decides on the appropriation of the<br />
balance sheet profit.<br />
24
<strong>The</strong> <strong>KD</strong> <strong>Group</strong> Annual Report 2009<br />
2.2. Management Board<br />
Until 16 November 2009, <strong>KD</strong> <strong>Group</strong> was managed by the Management Board, appointed by the Supervisory Board for a<br />
four-year m<strong>and</strong>ate. <strong>The</strong> number of the Management Board members was stipulated in the Articles of Association, while the<br />
scope of work <strong>and</strong> authorisations of individual members were after its expansion from a single to a four-member<br />
Management Board allocated by the Supervisory Board. Until 3 February 2009 the Management Board represented a single<br />
member - Matjaž Gantar. As of 3 February 2009, the Supervisory Board appointed a four-member Management Board with<br />
a four-year m<strong>and</strong>ate in the following composition:<br />
• Matjaž Gantar (<strong>The</strong> President of the Management Board), university economics graduate,<br />
• Peter Grašek (Member), bachelor of laws,<br />
• Aljoša Tomaž (Member), university graduate in economics,<br />
• Matija Šenk (Member), university graduate, mathematical engineer.<br />
On 11 November 2009, the Supervisory Board relieved Aljoša Tomaž from his office as member of the Management Board<br />
<strong>and</strong> appointed Draško Veselinovič, PhD. a new member as of 1 October 2009. Following the implementation of a one-tier<br />
management system, the Management Board consisting of Gantar Matjaž, President, Peter Grašek, Draško Veselinovič<br />
<strong>and</strong> Matija Šenk as members, ceased to operate <strong>and</strong> as from 16 November 2009, the majority of its competences for<br />
managing the business (as explained in section 3 of this chapter) were transferred to Draško Veselinovič, PhD, CEO <strong>and</strong> its<br />
Deputy, Peter Graško who were appointed by the Management Board members as CEOs.<br />
2.2.1. Members of the Management Board hold the following offices on management <strong>and</strong> supervisory<br />
bodies of other companies<br />
2.2.1. 1. Matjaž Gantar<br />
Company<br />
<strong>KD</strong> d. d., Ljubljana<br />
Adriatic Slovenica, d. d., Koper<br />
<strong>KD</strong> Banka d.d.<br />
Seaway <strong>Group</strong>, d. o. o., Bled<br />
DRI Naložbe, d. o. o., Ljubljana<br />
Vila Zahod, d. o. o., Ljubljana<br />
<strong>KD</strong>H Naložbe d. o. o., Ljubljana<br />
<strong>KD</strong>G Naložbe d. o. o., Ljubljana<br />
Vila Nova d.o.o., Ljubljana<br />
Function (as at 31.12.2009)<br />
Member of the Management Board<br />
Member of the Supervisory Board<br />
President of the Management Board<br />
Member of the Supervisory Board<br />
General Manager<br />
General Manager<br />
General Manager<br />
General Manager<br />
General Manager<br />
2.2.1.2. Peter Grašek<br />
As at 31 December 2009, Peter Grašek was not member of management or supervisory bodies of other entities.<br />
2.2.1.3. Aljoša Tomaž<br />
Company<br />
<strong>KD</strong> Banka d.d.<br />
Terme Maribor d.d., Maribor<br />
<strong>KD</strong> Upravljanje imovinom, d.o.o.,<br />
Zagreb<br />
<strong>KD</strong> Capital Management, Bucharest<br />
Function<br />
(as at 11.8.2009, the last day of the office of a member of the<br />
management of <strong>KD</strong> <strong>Group</strong>)<br />
CEO<br />
Deput y chairman of the Supervisory Board<br />
Member of the Supervisory Board<br />
Member of the Management Board<br />
2.2.1.4. Matija Šenk<br />
Company<br />
<strong>KD</strong> Življenje d.d.<br />
<strong>KD</strong> Life Asigurari s.a., Bucharest<br />
<strong>KD</strong> Life a.d, Sofia<br />
<strong>KD</strong> Životno osiguranje d.d., Zagreb<br />
<strong>KD</strong> Fond de Pensii s.a., Bucharest<br />
<strong>KD</strong> Banka d.d.<br />
Function<br />
(as at 15.11.2009, the last day of the office of a member of the<br />
management of <strong>KD</strong> <strong>Group</strong>)<br />
President of the Management Board<br />
President of the Management Board<br />
President of the Management Board<br />
Member of the Supervisory Board<br />
President of the Management Board<br />
Member of the Management Board<br />
25
<strong>The</strong> <strong>KD</strong> <strong>Group</strong> Annual Report 2009<br />
2.2.1.5. Dr. Draško Veselinovič<br />
Company<br />
Krka d.d., Novo mesto<br />
Function (as at 31.12.2009)<br />
Member of the Supervisory Board<br />
3. Management bodies of <strong>KD</strong> <strong>Group</strong> –tasks <strong>and</strong> competencies in a one-tier management system<br />
GENERAL MEETING OF<br />
SHAREHOLDERS<br />
Appointing <strong>and</strong> recalling Management Board members<br />
Awarding discharge to Management Board members<br />
Deliberating on Management Board members‘ remuneration<br />
Adoption of other resolutions in accordance with the law<br />
Authorisation to convene the General Meeting<br />
Formation of proposals for resolutions (appointing/recalling<br />
Management Board members, appropriation of undistributed profits,<br />
changes to the share capital, appointing the auditor <strong>and</strong> similar)<br />
tasks, report on the verification <strong>and</strong> approval of the annual report<br />
<strong>and</strong> opinion regarding the auditor’s report,<br />
Implementing the adopted resolutions<br />
Other reporting <strong>and</strong> notifying of the General Meeting<br />
Reporting <strong>and</strong> notifying regarding<br />
business conduct<br />
Preparation of the annual report<br />
MANAGEMENT<br />
BOARD<br />
NON-EXECUTIVE MEMBERS<br />
+<br />
CHIEF EXECUTIVE OFFICER<br />
Appointing/recalling chief executive<br />
officer (from within Management<br />
Board members)<br />
Appointing audit committee from<br />
within Management Board members<br />
<strong>and</strong> external experts)<br />
Signing contracts with chief executive<br />
officer, stipulating his /her<br />
remuneration, approval of loans to<br />
chief executive officer<br />
Supervising chief executive officer’s<br />
business conduct<br />
AUDIT COMMITTEE<br />
3.1. Management Board<br />
3.1.1. Operations of the Management Board<br />
<strong>The</strong> Management Board is comprised of members, appointed by the General Meeting of Shareholders. <strong>The</strong> Management<br />
Board manages <strong>and</strong> supervises the managing of the Company <strong>and</strong> represents Company in all matters that are outside the<br />
competencies of the Chief Executive Officers. <strong>The</strong> Management Board must meet at least on a quarterly basis.<br />
<strong>The</strong> Management Board from among its members appoints chief executive officers who present <strong>and</strong> represent the Company.<br />
<strong>The</strong> Management Board's competences are applicable to all its members, with some of them being transferred to the two<br />
CEOs. <strong>The</strong>refore, in accordance with the Articles of association, the two chief executive officers present <strong>and</strong> represent the<br />
Company, they manage daily business, they report entries <strong>and</strong> submit documents for entry in the register, they are in charge<br />
of keeping books of account <strong>and</strong> of the annual report preparation. <strong>The</strong> two CEOs manage the business by complying with<br />
instructions <strong>and</strong> limitations laid down by the Articles of Association, the Management Board, the General Meeting of<br />
Shareholders <strong>and</strong> the Rules of procedure of the CEOs. <strong>The</strong> Management Board may at any time recall a Chief executive<br />
officer.<br />
26
<strong>The</strong> <strong>KD</strong> <strong>Group</strong> Annual Report 2009<br />
As from 16 November 2009, <strong>KD</strong> <strong>Group</strong> is managed <strong>and</strong> supervised by the Management Board (MB) in the following<br />
composition:<br />
• Matjaž Gantar (President MB), university graduate in economics,<br />
• Aleks<strong>and</strong>er Sekavčnik (Deputy president MB), university graduate in economics,<br />
• Tomaž Butina (member MB, President of the Audit Committee), university graduate, computer engineer,<br />
• Sergej Racman (member MB, Deputy President of the Audit Committee), engineer of physics <strong>and</strong> mathematics,<br />
• Draško Veselinovič (member MB, CEO), doctorate in economic science,<br />
• Peter Grašek (member MB, deputy CEO), bachelor of laws.<br />
<strong>The</strong><br />
Management Board held a constitutive session <strong>and</strong> one regular session in 2009. <strong>The</strong> Management Board provided<br />
details regarding its work in the Report of the Management Board to Shareholders on Verification of the Annual Report. This<br />
report is submitted to shareholders as part of the materials for the General Meeting of Shareholders, which decides on the<br />
appropriation of the balance sheet profit <strong>and</strong> is also published on the Company's website.<br />
3.1.2. Members of the Management Board hold the following offices on management <strong>and</strong> supervisory<br />
bodies of other companies<br />
With regards to Matjaž Gantar, President of the Management Board, Draško Veselinovič, PhD <strong>and</strong> Peter Graško,<br />
membersthe presentation is given in section 2.2.1. of this Chapter.<br />
3.1.2.1. Aleks<strong>and</strong>er Sekavčnik<br />
Company<br />
<strong>KD</strong> d.d., Ljubljana<br />
<strong>KD</strong> Življenje d.d., Ljubljana<br />
<strong>KD</strong> Investments A.D., Beograd<br />
<strong>KD</strong> Banka d.d., Ljubljana<br />
P.C.I. d.o.o., Ljubljana<br />
Sekavčnik in družbenik d.n.o., Ljubljana<br />
PM & A FA d.d., Ljubljana<br />
Function (as at 31.12.2009)<br />
Member of the Management Board<br />
President of the Supervisory Board<br />
Member of the Management Board<br />
Member of the Management Board<br />
General Manager<br />
General Manager<br />
Member of the Supervisory Board<br />
3.1.2.2. Tomaž Butina<br />
Company<br />
<strong>KD</strong> d.d., Ljubljana<br />
<strong>KD</strong> Banka d.d., Ljubljana<br />
AVRA d.o.o., Ljubljana<br />
Dermatologija Bartenjev-Rogl d.o.o.<br />
Function (as at 31.12.2009)<br />
Member of the Management Board<br />
Member of the Management Board<br />
General Manager<br />
General Manager<br />
27
<strong>The</strong> <strong>KD</strong> <strong>Group</strong> Annual Report 2009<br />
3.1.2.3. Sergej Racman<br />
Company Function (as at day 31.12.2009)<br />
<strong>KD</strong> d.d., Ljubljana<br />
Member of the Management Board<br />
Kolosej kinematografi d.o.o., Ljubljana<br />
President of the Management Board<br />
Kolosej Maribor d.o.o., Maribor<br />
General Manager<br />
Kolosej zabavni centri d.o.o., Ljubljana<br />
General Manager<br />
Adriatic Invest d.o.o., Ljubljana<br />
General Manager<br />
Priori d.o.o., Ljubljana<br />
General Manager<br />
XpanD d.o.o., Ljubljana<br />
General Manager<br />
Zabavna znanost d.d., Ljubljana<br />
General Manager<br />
<strong>KD</strong> Življenje d.d., Ljubljana<br />
Deputy President of the Supervisory Board<br />
<strong>KD</strong> Banka d.d., Ljubljana<br />
Member of the Management Board<br />
PM & A FA d.d., Ljubljana<br />
President of the Management Board<br />
PM & A IP d.o.o., Ljubljana<br />
General Manager<br />
PM & A MT d.o.o.<br />
General Manager<br />
Adriatic Invest LLC., Wilmington<br />
General Manager<br />
European Funds Inc, Wilmington<br />
General Manager<br />
Sidbury Enterprises Ltd., Limassol<br />
General Manager<br />
Auctor d.o.o., Ljubljana<br />
General Manager<br />
3.1.3. Equity stakes of the Management Board<br />
As at 31 December 2009, members of the Management Board held the following direct stakes in the Company:<br />
• Matjaž Gantar held 2,643 of ordinary registered shares <strong>KD</strong>HR;<br />
• Tomaž Butina held 16 ordinary registered shares <strong>KD</strong>HR;<br />
• Aleks<strong>and</strong>er Sekavčnik held 3 ordinary registered shares <strong>KD</strong>HR;<br />
• Sergej Racman, Draško Veselinovič, PhD <strong>and</strong> Peter Grašek held no direct ordinary shares of the Company as at 31<br />
December 2009.<br />
<strong>The</strong> members of the Management Board currently hold no stock options in <strong>KD</strong> <strong>Group</strong> d. d.<br />
3.1.4. Management Board's Committees<br />
On 23 November 2009, in accordance with its competences, the Management Board appointed Audit Committee comprised<br />
of president <strong>and</strong> three members. <strong>The</strong> Audit Committee is the Management Board's body that supports the management<br />
Board in the fulfilment of its comprehensive responsibility for the supervision of the activities of the Company <strong>and</strong> its<br />
subsidiaries including the accounting reporting system, internal control system, audit processes <strong>and</strong> processes used to<br />
ensure compliance with the laws, regulations <strong>and</strong> internal rules as well as ethical guidelines or code of practice. <strong>The</strong> purpose<br />
of the Audit Committee's activity is to allow the Management Board to exercise more reliable, efficient <strong>and</strong> successful<br />
operations in realising the vision, mission <strong>and</strong> strategic goals of the Company <strong>and</strong> the <strong>Group</strong>. <strong>The</strong> Audit Committee is a<br />
professional working core of the Management Board for the fields for which it is responsible, who submits its professional<br />
proposals to the Management Board, reports its findings <strong>and</strong> is responsible for its actions to the Management Board.<br />
28
<strong>The</strong> <strong>KD</strong> <strong>Group</strong> Annual Report 2009<br />
4. Overview of remuneration paid to members of the management <strong>and</strong> supervisory bodies in 2009<br />
NAME AND SURNAME<br />
Meeting fees <strong>and</strong><br />
payments for<br />
Fixed<br />
Variable<br />
membership in the<br />
Reimburs Insurance<br />
earnings earnings Holiday<br />
Profit<br />
Option<br />
SB/MB/Audit<br />
ement of premiums- Commission<br />
allowance participation plan<br />
Committee, other<br />
costs PDPZ<br />
a<strong>dd</strong>itional payments<br />
(copyrights, benefits<br />
<strong>and</strong> similar)<br />
Matjaž Gantar 4 63,780.77 / 1,124.42 / / 1,166.19 248.40 / 7,859.84<br />
Peter Grašek 5 135,050.66 / 2,248.84 / / 956.80 248.40 / 5,064.00<br />
Aljoša Tomaž 6 140,869.99 115,676.16 2,248.84 / / 1,598.31 62.10 / 8,168.93<br />
Matija Šenk 7 126,641.75 / 2,248.84 / / 1,455.67 2,170.50 / /<br />
Draško Veselinovič<br />
/ / / /<br />
/ 1,976.44<br />
PhD 8<br />
21,131.00<br />
204.56 41.40<br />
Aleš Vahčič PhD 9 / / / / / / / / 150,102.06<br />
Alojz Penko 10 / / / / / / / / 6,551.00<br />
Bojan Sekavčnik 11 / / / / / / / / 6,025.86<br />
Sergej Racman 12 / / / / / / / / 5,437.93<br />
Aleks<strong>and</strong>er Sekavčnik<br />
/ / / / / / / / 46,858.92<br />
13<br />
Tomaž Butina 14 / / / / / / / / 3,514.30<br />
*Gross amounts in euros. <strong>The</strong>se remunerations are based on the performance of tasks <strong>and</strong> functions in the management <strong>and</strong> supervisory bodies of the <strong>KD</strong><br />
<strong>Group</strong> as well as the tasks <strong>and</strong> functions in the management <strong>and</strong> supervisory bodies of the following subsidiaries: Adriatic Slovenica d.d.; <strong>KD</strong> Skladi d.o.o.;<br />
<strong>KD</strong> Življenje d.d.; <strong>KD</strong> Banka d.d.; <strong>KD</strong> Životno Osiguranje d.d., Croatia; <strong>KD</strong> Life, Bulgaria; <strong>KD</strong> Life, Romania; <strong>KD</strong> Life Ukraine <strong>and</strong> SC <strong>KD</strong> Fond de Pensii,<br />
Romania.<br />
5. Auditing <strong>and</strong> the internal control system<br />
<strong>The</strong> financial statements of <strong>KD</strong> <strong>Group</strong> d. d. <strong>and</strong> the <strong>KD</strong> <strong>Group</strong> for 2009 were audited by the independent auditing firm Ernst &<br />
Young d.o.o., Ljubljana. <strong>The</strong> certified auditor issued an unqualified opinion on the annual reports of <strong>KD</strong> <strong>Group</strong> d. d. <strong>and</strong> the<br />
<strong>Group</strong> <strong>KD</strong> <strong>Group</strong> for 2009. More about risk management can be found in the section on Risk Management in this Annual<br />
Report.<br />
6. Transparency of the Company's operations<br />
Transparency of operations is provided primarily by keeping shareholders <strong>and</strong> the general public informed, namely by<br />
providing regular bulletins <strong>and</strong> information about particular events. Information regarding operations, business plans <strong>and</strong><br />
other important activities is published on the company’s website at www.kd-group.si, <strong>and</strong> on the Ljubljana Stock Exchange’s<br />
SEOnet website at http://seonet.ljse.si.<br />
7. Management of related parties<br />
Related companies are actively managed through representatives of the controlling entity in the management <strong>and</strong><br />
supervisory bodies of these companies <strong>and</strong> by participation at the General Meetings.<br />
4 Matjaž Gantar: Company Director until 3 February 2009; President of the Management Board from 3 February until 15 November 2009; (non-executive)<br />
member of the MB since 16 November 2009.<br />
5 Peter Grašek: General Manager until 3 February 2009; member of the MB from 3 February to 15November 2009, Member of the MB <strong>and</strong> CEO since 16<br />
November 2009.<br />
6 Aljoša Tomaž: Assistant director until 3 February 2009, member of the MB from 3 February to 11 August 2009.<br />
7 Matija Šenk: head of projects until 3 February 2009 ; from 3 February to 15 November 2009, Member of the MB.<br />
8 Draško Veselinovič, PhD, Member of the MB from 1 October to 15 November .2009 , Member of the MB <strong>and</strong> CEO since 16 November 2009.<br />
9 Aleš Vahčič, PhD: Member of the SB until 15 November 2009.<br />
10 Alojz Penko: Member od the SB until 15 November 2009.<br />
11 Bojan Sekavčnik: Member od the SB until 15 November 2009<br />
12 Sergej Racman: Member od the MB since 16 November 2009<br />
13 Aleks<strong>and</strong>er Sekavčnik: non-executive member of the MB since 16 November 2009.<br />
14 Tomaž Butina: non-executive member of the MB since 16 November 2009.<br />
29
<strong>The</strong> <strong>KD</strong> <strong>Group</strong> Annual Report 2009<br />
Statement of the Management Board of <strong>KD</strong> <strong>Group</strong> d. d. about compliance with the Corporate<br />
Code for Public Limited Companies<br />
<strong>The</strong> Management Board of <strong>KD</strong> <strong>Group</strong> d.d., finančna družba, Celovška 206, 1000 Ljubljana (<strong>KD</strong> <strong>Group</strong> or the Company)<br />
hereby declare that in the process of managing <strong>KD</strong> <strong>Group</strong> it follows provisions of the Corporate Code for Public Limited<br />
Companies ( Official Gazette of the RS No. 118/05 as amended on 5 February 2007, as published on the official website of<br />
the Ljubljana Stock Exchange d.d. http://www.ljse.si in the Slovene <strong>and</strong> English languages (the Code), whereas deviations<br />
from provisions of individual chapters of the Code as determined during the drawing up of this statement, are disclosed <strong>and</strong><br />
explained below:<br />
1. RELATIONSHIP BETWEEN THE COMPANY, SHAREHOLDERS AND OTHER STAKEHOLDERS<br />
• Items 1.2.6. <strong>and</strong> 1.3.12:<br />
In the past General Meetings of <strong>KD</strong> <strong>Group</strong> did not directly or through financial or other organisations <strong>and</strong> agents organise the<br />
collection of proxy statements. Further, it did not indicate on its website that members of the management or supervisory<br />
bodies were receiving proxy forms for voting at the General Meeting. If in future the Management of the Company assesses<br />
that there is sufficient interest to organise such collection, it will ensure that the data is indicated <strong>and</strong> available on the<br />
Company's official website.<br />
2. MANAGEMET BOARD<br />
• Items 2.3.2. <strong>and</strong> 2.3.3.:<br />
Policy relating to compensation, remuneration <strong>and</strong> other benefits has not been determined in advance.<br />
3. SUPERVISORY BOARD<br />
• Items 3.1.7. , 3.1.10., 3.1.11. <strong>and</strong> 3.7.:<br />
<strong>The</strong> Management Board is operating as a collective body <strong>and</strong> as a rule, meets in full composition, by participation of all<br />
members, who at all times strive for quality work <strong>and</strong> professional decision-making process. Until this statement was<br />
formulated, the Management Board did not implement assessment of work of individual members.<br />
8. DISCLOSURES<br />
• Item 8.2.:<br />
In view of the existing Shareholder structure, costs, <strong>and</strong> as the majority of the Company's business partners are located in<br />
the Republic of Slovenia <strong>and</strong> certain neighbouring countries, the Management Board believes that at the time of drafting this<br />
declaration updated publication of its reports also in the English language is not necessary. All the key basic information<br />
about the Company for English speaking business environment are included in the publication of the English language<br />
Annual Report.<br />
• Item 8.6.:<br />
Financial calendar for the next financial year is not published on the Company's official website. Both, periodical <strong>and</strong> »ad<br />
hoc« publications of all important business events are provided within the shortest possible deadlines as the Company is<br />
striving to ensure quality information to all of its investors.<br />
• Item 8.7.2.:<br />
<strong>The</strong> Company does not directly monitor or publicise any potential conflicts of interest with other companies (ownership of a<br />
significant share of voting rights in another company who also holds a significant share of voting rights of <strong>KD</strong> <strong>Group</strong>). All<br />
received notifications of changes in the ownership of significant share of voting rights in <strong>KD</strong> <strong>Group</strong> are disclosed in a<br />
transparent manner; in a<strong>dd</strong>ition, the Company notifies other public limited companies of any potential changes in significant<br />
share of voting rights of the latter in accordance with the current regulations.<br />
In Ljubljana, 22 April 2010<br />
President of the Management Board<br />
Matjaž Gantar<br />
30
<strong>The</strong> <strong>KD</strong> <strong>Group</strong> Annual Report 2009<br />
ANALYSIS OF OPERATIONS<br />
Capital markets in 2009<br />
<strong>The</strong> US <strong>and</strong> Europe in 2009<br />
In the latter months of 2008, the financial crisis of 2007, with its epicentre in the USA who account for almost one quarter of<br />
the world’s GBD <strong>and</strong> over 16 percent of global dem<strong>and</strong>, shifted from financial markets to the real market, spreading to the<br />
whole world. In the first quarter of 2009 there was no single safe investment as all sectors were in the red. In the beginning of<br />
March, the US S&P 500 index fell through the 700 barrier <strong>and</strong> continued its fall, reaching its lowest point in the past thirteen<br />
years on 9 March with 666 points. <strong>The</strong>re was much talk about the possible repeat of the depression from the 1930s, about<br />
the volatility of the financial system, potential nationalisation of some of the largest US banks, <strong>and</strong> similar scenarios. When<br />
the probability of such scenarios occurring reduced <strong>and</strong> several sectors succeeded to regain the position before the failure of<br />
the US investment bank Lehman Brothers, the conditions were right for the beginning of the strong growth of global stock<br />
markets. <strong>The</strong> winner of the first half of the year was the technology sector which in the first six months of 2009 gained 24.08<br />
percent, followed by the energy <strong>and</strong> raw materials sector with 12.28 percent growth <strong>and</strong> the sector of durable consumer<br />
goods which in that same period gained 7.52 percent, whereas the financial <strong>and</strong> industrial sector remained in negative<br />
figures in the first half of 2009 recording a 4.76 percent <strong>and</strong> 7.68 percent decline respectively. In the second half of 2009, the<br />
market needed proof that the economy had reached the bottom <strong>and</strong> was eagerly awaiting the first information of the actual<br />
outset of economical revival in the developed world. <strong>The</strong> next condition for higher exchange quotations was the publication of<br />
profits achieved in the second quarter of 2009 which, in the case of US S&P 500 index, surpassed all analysts’ expectations<br />
in over 70 percent of announced results. In a<strong>dd</strong>ition to these, the zero interest rates <strong>and</strong> support in the increased liquidity of<br />
central banks which a<strong>dd</strong>itionally contributed to high gains on stock markets, should not be overlooked. After the credit crunch<br />
in the second half of 2008 <strong>and</strong> the first few months of 2009, central banks were forced to, with increased liquidity, support the<br />
financial sector, make available credit lines <strong>and</strong> support the remaining economy in the developed world. <strong>The</strong> US S&P 500<br />
index recorded a nearly 26 percent growth at the end of 2009 <strong>and</strong> by the beginning of March, it increased by a total of 68<br />
percent compared to its lowest point. Last year’s growth of the S&P 500 index is the highest since 2003. Revival of the<br />
labour market <strong>and</strong> accessibility to <strong>and</strong> availability of new loans will be of key importance in 2010. <strong>The</strong> question of how stable<br />
is the final consumption which is, as has been demonstrated several times, to a large extent dependent on the repayment of<br />
debt of US consumers, still remains. In the past 20 years, consumers financed increased consumption with ever increasing<br />
indebtedness, a process which is, at least for the time being, locked. Increased consumption on account of higher stock<br />
market prices cannot be expected since real estate prices continue to be under pressure <strong>and</strong> nearly two thirds of an average<br />
American family’s assets are tied in this particular segment. <strong>The</strong> rate of savings is currently stable at around 4 <strong>and</strong> 5 percent<br />
<strong>and</strong> since production capacity utilisation remains at historically low levels, no wage <strong>and</strong> salary increases can be expected at<br />
least in the short-term. <strong>The</strong> main risks that could in 2010 surprise investors include the following:<br />
• Private sector’s inability to compensate for reduced government subsidies.<br />
• Analysts’ expectations during the year may become too optimistic.<br />
• Bank balances are worse than is currently reported.<br />
• Any difficulties in China.<br />
• Problems with government debt (Greece, Spain, Portugal, Irel<strong>and</strong>, Italy <strong>and</strong> other)<br />
• US dollar growth <strong>and</strong> break in the “carry trade” process.<br />
Other global markets<br />
In the developing economies, the beginning of 2009 was marked primarily by a number of crises aimed at stimulating the<br />
national economies. Central banks continued to reduce the base interest rates, while the governments were providing<br />
cashrescue plan, planning increased budget expenditures <strong>and</strong> through changed tax policies, waived future budgetary<br />
revenue. In November the government of the largest Asian economy, China, adopted aid package of nearly US$ 600 billion,<br />
which accounts for nearly 15 percent of its gross domestic product, with a view to primarily increase expenditure for<br />
infrastructure construction <strong>and</strong> modernisation, reduce taxes <strong>and</strong> provide welfare aid to the poorest. <strong>The</strong> global crisis was a<br />
strong signal to China that it will have to change its GDP structure, increase the share of domestic consumption <strong>and</strong> reduce<br />
its dependency on imports. In spite of a widespread scepticism that prevailed at the beginning of 2009, it is clear today that<br />
in 2009, Chinese economy with its 8.7 percent growth in GDP, was the main driving force behind the global economic revival.<br />
Despite low exports, by fiscal <strong>and</strong> monetary measures China succeeded in making domestic dem<strong>and</strong> the principal driver<br />
behind economic growth. With almost no exceptions, in 2009 central banks in developing economies reduced interest rates<br />
<strong>and</strong> some also reduced obligatory reserves which commercial banks have to ensure.<br />
31
<strong>The</strong> <strong>KD</strong> <strong>Group</strong> Annual Report 2009<br />
In India, successful parliamentary elections contributed to growth of the stock market index. At these elections, which lasted<br />
for a month (from mid April to mid May), the leading Congress party were the conclusive winners with 206 seats out of a<br />
total of 543, which is the best election result of any party since 1991. A day after the election results were announced, Indian<br />
stock market, after a few interruptions in trading, recorded an incredible 17 percent growth. With a slight delay, positive news<br />
began to trickle also from the Russian economy which was, due to its high dependency on exports of oil <strong>and</strong> some other raw<br />
materials, during the economic crisis most affected among the developing economies. <strong>The</strong> Russian central bank at the end<br />
of September again reduced the key interest rate to give a<strong>dd</strong>itional boost to the domestic economy. Currently the key interest<br />
rate st<strong>and</strong>s at 8.75 percent.<br />
One of the more piercing measures taken by the Brazilian government in 2009 was without a doubt expansion of its welfare<br />
aid for the poor which is currently provided to over a million of the poorest households. Extensive aid <strong>and</strong> social reforms are<br />
the reason why countries were able to more or less avoid otherwise expected social unrest <strong>and</strong> political crisis. <strong>The</strong> Brazilian<br />
Bovespa index recorded a 121 percent growth in 2009. Towards the end of 2009, capital markets were shocked by the news<br />
of impending bankruptcy of Dubai, but thanks to the intervention of Abu Dhabi, the news was short-lived.<br />
Slovenia <strong>and</strong> the Balkan markets<br />
Less liquid or marginal markets did not perform well in 2009 in terms of return. Almost all lagged behind the stock market<br />
indices of developed countries <strong>and</strong> large developing countries. <strong>The</strong> main reason why these markets are rightly described as<br />
marginal markets is certainly inefficiency of information technology <strong>and</strong> uncharacteristic deviation from foreign market trends.<br />
On the other h<strong>and</strong>, these markets are relatively new <strong>and</strong> investors were more or less restricted to the local or regional areas.<br />
All of the Balkan markets, including the Slovene market, reached their peaks as an example of a stock market boom fuelled<br />
by speculations of takeovers <strong>and</strong> in terms of its size, it can be compared to that experienced by the technological market in<br />
2009. An important element of fuelling these markets were high global tendencies to taking risks <strong>and</strong> low interest rates. <strong>The</strong><br />
Slovene SBI 20 index rose by 10 percent, Serbian Belex gained 15, Croatian Crobex 16 percent, <strong>and</strong> Macedonian MBI-10<br />
recorded a 31 percent increase, whereas Bosnian SASX-10 closed at a loss of 15 percent. <strong>The</strong> region successfully<br />
maintained stability in the most difficult period of the first half of 2009 primarily thanks to support provided by the IMF <strong>and</strong> the<br />
EU as well as the commitment of all major European banks not to significantly lower their lending facilities. In terms of<br />
currency, the highest depreciation was recorded by the Serbian dinar which lost 10 percent, <strong>and</strong> which affected positively on<br />
higher cover of imports with exports, stimulated domestic exporters <strong>and</strong> due to underdevelopment of the economy, there was<br />
a slight effect of imported inflation due to the general deflationary climate in importing partners. Slovenia recorded a<br />
considerable increase in unemployment rate following a fall of some of the giants such as Mura, <strong>and</strong> there was a<br />
considerable amount of uncertainty with regards to the fall of the domestic real estate market, which did not result in any<br />
significant decline in real estate prices. Based on quarterly results of Slonep the price of one m2 of an apartment in Ljubljana<br />
fell by an average of 3-6 percent, whereas December payout was by 6 percent higher than in the same period of 2008. In<br />
terms of the average annual salary increase in Slovenia, housing prices in Slovenia are slightly higher compared to the<br />
developed Western markets, whereas compared to the real estate prices in East <strong>and</strong> Central Europe, they are considerably<br />
lower. Based on an average salary, an average Slovene can acquire 4.5 m2 of real estate compared to nearly 10m2 that can<br />
be purchased by an average German house hunter or only 2m2 afforded by the Slovak or Bulgarian citizen. <strong>The</strong> past year<br />
lead to disintegration of a number of large systems such as: Istrabenz, the Pivovarna Laško <strong>Group</strong> (whose negative results<br />
burden the Slovene banking system), as well as Petrol. Foreign investments of some of Slovene companies such as<br />
Zavarovalnica Triglav <strong>and</strong> Intereuropa proved to be less profitable which resulted in limited amount of inexpensive sources of<br />
funds. In spite of low Euribor rate (0.7 percent) bank margins are high due to uncertain faith of the domestic construction<br />
industry, numerous new provisions <strong>and</strong> continued difficulties in securing external funding.<br />
32
<strong>The</strong> <strong>KD</strong> <strong>Group</strong> Annual Report 2009<br />
Operations of the <strong>KD</strong> <strong>Group</strong> in 2009<br />
<strong>The</strong> <strong>KD</strong> <strong>Group</strong> incurred a loss of EUR 44.2 million in 2009. During the year economic crisis at home <strong>and</strong> abroad deepened<br />
which resulted in an a<strong>dd</strong>itional write-off of investments in the <strong>Group</strong>.<br />
Important operating indicators of the <strong>Group</strong> <strong>KD</strong> <strong>Group</strong>:<br />
– Operating revenue of EUR 367.9 million presents a decline of 6 percent compared to the previous<br />
year. In terms of the revenue structure, net revenue from insurance premiums of EUR 330.1 million<br />
account for 90 percent of total revenue,<br />
– At the end of 2009 the value of total assets stood at EUR 847,8 million, an increase of 7 percent<br />
compared to 2008,<br />
– As at 31 December 2009, the <strong>Group</strong>'s capital of EUR 151.6 million presents a 22 percent reduction<br />
compared to 2008.<br />
Important indicators<br />
Indicator 2009 2008<br />
Index<br />
2009/2008<br />
Return on equity (in %) (25.6) (28.8) 89<br />
Equity financing (capital / total assets) (in %) 17.9 24.4 73<br />
Earnings per share attributed to majority shareholders (in EUR) 15 (17.1) (29.7) 58<br />
Share book value (in EUR) 16 52.70 66.86 79<br />
Market capitalisation / capital book value 17 0.91 0.78 118<br />
15<br />
Earnings per share attributed to majority shareholders:<br />
Net profit of majority shareholders – dividend payout on preference shares (excluding treasury preference shares)<br />
16<br />
Share book value:<br />
<strong>The</strong> average number of total issued shares excluding treasury shares<br />
Capital book value of majority shareholders (as at 31 December 2009)<br />
<strong>The</strong> number of total issued shares excluding treasury shares (as at 31 December 2009)<br />
17<br />
Market capitalisation / capital book value<br />
Market capitalisation of both share classes (excluding treasury shares) (as at 31 December 2009)<br />
Capital book value of majority shareholders (as at 31 December 2009)<br />
Diluted earnings per share also take into account any granted options, convertible bonds or other similar financial instruments. As the<br />
company issued no such financial instruments this indicator is identical to earnings per share attributed to majority shareholders.<br />
33
<strong>The</strong> <strong>KD</strong> <strong>Group</strong> Annual Report 2009<br />
Highlights from the income statement<br />
INCOME STATEMENT (in EUR thous<strong>and</strong>) 2009 2008<br />
Index<br />
2009 / 2008<br />
Operating revenue 367,869 391,619 94<br />
Net revenue from insurance premiums 330,130 321,283 103<br />
Net revenue from sales of goods <strong>and</strong> services 11,621 23,623 49<br />
Commission income 10,849 14,411 75<br />
Other operating revenue 15,268 32,303 47<br />
Net finance income* 45,098 (87,267) -<br />
Operating expenses (431,399) (354,212) 122<br />
Cost of services (68,690) (75,690) 91<br />
Labour costs (57,577) (64,406) 89<br />
Net benefits <strong>and</strong> claims paid (271,476) (156,842) 170<br />
Other operating expenses (37,762) (57,274) 66<br />
Operating profit or loss (18,432) (49,859) 37<br />
Finance costs (9,564) (8,023) 119<br />
Share of profit/loss of associate (23,427) (27,407) 85<br />
Income tax 7,200 8,286 87<br />
Net profit or loss for the year ** (44,223) (77,004) 57<br />
* <strong>The</strong> share of profits of associates is not included. Commission income is shown in a separate line.<br />
** Includes the portion of net profit for the financial year attributed to minority owners.<br />
Highlights from the balance sheet<br />
BALANCE SHEET (in EUR thous<strong>and</strong>) 31.12.2009<br />
31.12.2008<br />
adjusted<br />
Index<br />
31.12.2009 /<br />
31.12.2008<br />
Assets 847,785 795,464 107<br />
Intangible <strong>and</strong> tangible fixed assets 106,451 104,532 102<br />
Investment property 29,814 28,708 104<br />
Financial assets <strong>and</strong> investments 374,256 393,268 95<br />
Receivables, inventories <strong>and</strong> other 131,048 141,681 92<br />
Unit-linked investments of policyholders <strong>and</strong> reinsurance contracts 165,486 95,970 172<br />
Cash <strong>and</strong> cash equivalents 40,730 31,305 130<br />
Equity <strong>and</strong> liabilities 847,785 795,464 107<br />
Equity * 151,605 192,247 79<br />
Liabilities arising from insurance contracts 296,098 279,766 106<br />
Unit-linked liabilities to policyholders 140,109 79,309 177<br />
Investment contracts 17,703 16,394 108<br />
Financial liabilities 196,132 181,909 108<br />
Operating <strong>and</strong> other liabilities 46,137 45,838 101<br />
* Also includes minority interest.<br />
34
<strong>The</strong> <strong>KD</strong> <strong>Group</strong> Annual Report 2009<br />
Operating revenue<br />
Structure of operating revenue<br />
Operating revenue amounted to EUR 367.9 million in 2009, down 6percent compared to 2008. Net revenue from insurance<br />
premiums, which represents the largest share of total operating revenues (90%), was up 3 percent from 2008 to EUR 330.1<br />
million. Net revenue from sales of goods <strong>and</strong> services was down 51 percent in 2009 to EUR 11.6 million. <strong>The</strong> main reason<br />
lies in the sale of the cinematography activity in September 2008, whose relevant amount of revenue was included in the<br />
consolidated revenue. A sharp drop was also recorded in revenue from fees <strong>and</strong> commissions primarily due to the tightening<br />
of financing conditions. Revenue from fees <strong>and</strong> commissions was down 25 percent compared to 2008 <strong>and</strong> stood at EUR<br />
10.8 million. Other operating revenue accounts for 4 percent of total operating revenue.<br />
Operating revenue <strong>and</strong> changes in 2009 <strong>and</strong> 2008 (in EUR thous<strong>and</strong>):<br />
Operating income ( in EUR thous<strong>and</strong> )<br />
450.000<br />
400.000<br />
350.000<br />
300.000<br />
250.000<br />
200.000<br />
150.000<br />
100.000<br />
50.000<br />
0<br />
391.619<br />
367.869<br />
15.268<br />
32.303<br />
10.849 14.411<br />
11.621<br />
23.623<br />
330.130 321.283<br />
2009 2008<br />
Other operating<br />
revenue<br />
Commission revenue<br />
Net revenue from<br />
sales of goods <strong>and</strong><br />
services<br />
Net revenue from<br />
insurance premiums<br />
Sales revenue<br />
Sales revenue 18 amounted to EUR 352.6 million in 2009. <strong>The</strong> majority of revenue was earned by insurance activity (figure<br />
below total property, life <strong>and</strong> health insurances), accounting for 95 percent of total revenue of the <strong>Group</strong>.<br />
Structure of sales revenue by business segment in 2009 (in %):<br />
Financial services<br />
3%<br />
Banking<br />
0%<br />
Other<br />
2%<br />
Health insurance<br />
28%<br />
Property insurance<br />
41%<br />
Life insurance<br />
26%<br />
18 Sales revenue: Net revenue from sales of goods <strong>and</strong> services + net revenue from insurance premiums + revenue from fees <strong>and</strong> commissions<br />
35
<strong>The</strong> <strong>KD</strong> <strong>Group</strong> Annual Report 2009<br />
Sales revenue by business segment in 2009 <strong>and</strong> 2008 (in EUR thous<strong>and</strong>):<br />
Sales revenue in EUR thous<strong>and</strong>)<br />
160.000<br />
140.000<br />
120.000<br />
100.000<br />
80.000<br />
60.000<br />
40.000<br />
20.000<br />
0<br />
142.736<br />
137.832<br />
100.150<br />
95.961<br />
90.075 89.509<br />
16.094<br />
11.381<br />
12.128<br />
686<br />
7.571 7.793<br />
0<br />
0<br />
Property insurance Life insurance H ealth insurance Financial serv ices Banking C inematography Other<br />
2009 2008<br />
In terms of sales, property insurance leads with EUR 142.7 million followed by health insurance (EUR 100.2 million) <strong>and</strong> life<br />
insurance with EUR 90.1 million. <strong>The</strong> first two recorded 4 percent growth, while life insurance recorded 1 percent increase<br />
compared to 2008. Revenue earned by financial services fell on account of lower commissions, whereas cinematographic<br />
sector will probably be sold.<br />
Net finance income from investments<br />
Net finance income from investments reached EUR 45.1 million in 2009. <strong>The</strong> reason for the higher net inflow was the revival<br />
of stock markets which resulted in an increase of financial assets (financial assets measured at fair value through profit or<br />
loss).<br />
Net finance income from investments by business segment in 2009 <strong>and</strong> 2008 (in EUR thous<strong>and</strong>):<br />
60.000<br />
Net finance income ( in EUR thous<strong>and</strong>)<br />
40.000<br />
20.000<br />
0<br />
(20.000)<br />
(40.000)<br />
(60.000)<br />
(80.000)<br />
45.098<br />
(87.267)<br />
(100.000)<br />
2009 2008<br />
36
<strong>The</strong> <strong>KD</strong> <strong>Group</strong> Annual Report 2009<br />
Operating expenses<br />
In 2009 operating expenses 19 totalled EUR 431.4 million, up 22 percent compared to 2008. In the operating expenses<br />
structure, the majority, 63 percent represents net expenditure for insurance entitlements <strong>and</strong> claims, which recorded a 73<br />
percent increase in 2009, primarily due to increase in liabilities to the unit-linked investments (stock prices growth in 2009<br />
compared to 2008) <strong>and</strong> thus the increase in long-term insurance provisions. Compared to the previous year, costs of<br />
services which account for 16 percent of total operating expenses, are down by 9 percent, as are labour costs which account<br />
for 13 percent of total costs <strong>and</strong> which recorded an 11 percent decline. This reduction is due to the disposal of<br />
cinematographic activities <strong>and</strong> rationalisation of the costs in the <strong>Group</strong>. Majority of other expenses present revaluation<br />
operating expenses due to impairment of receivables, loans <strong>and</strong> goodwill.<br />
Structure of operating expenses <strong>and</strong> changes in 2009 <strong>and</strong> 2008 (in EUR thous<strong>and</strong>):<br />
2009 2008<br />
Operating expenses ( in EUR thous<strong>and</strong> )<br />
0<br />
(50.000)<br />
(100.000)<br />
(150.000)<br />
(200.000)<br />
(250.000)<br />
(300.000)<br />
(350.000)<br />
(400.000)<br />
(450.000)<br />
(500.000)<br />
(68.690) (75.690)<br />
(57.577) (64.406)<br />
(156.842)<br />
(271.476)<br />
(57.274)<br />
(33.657)<br />
(431.399)<br />
(354.212)<br />
Other expenses<br />
Net expenses for<br />
claims<br />
Labour costs<br />
Cost of services<br />
Net profit or loss<br />
<strong>The</strong> <strong>Group</strong> recorded a net loss in the amount of EUR 44.2 million in 2009.<br />
<strong>The</strong> tightened financing conditions resulted in the impairment <strong>and</strong> write-down of some of financial investments. Profits were<br />
generated in 2009 by the health insurance (EUR 3.8 million) <strong>and</strong> property insurance (EUR 2.2 million). <strong>The</strong> largest loss was<br />
recorded by financial services (EUR 35 million), followed by life insurance (EUR 10.4 million) <strong>and</strong> banking sector which<br />
incurred a loss of EUR 3.4 million.<br />
Net profit or loss of the <strong>Group</strong> in 2009 <strong>and</strong> 2008 (in EUR thous<strong>and</strong>):<br />
0<br />
2009 2008<br />
Net profit or loss ( in EUR thous<strong>and</strong>)<br />
(10.000)<br />
(20.000)<br />
(30.000)<br />
(40.000)<br />
(50.000)<br />
(60.000)<br />
(70.000)<br />
(80.000)<br />
(90.000)<br />
(44.223)<br />
(77.004)<br />
19 Expenses <strong>and</strong> costs are shown with a negative sign so that the tables in the analysis of operations are in line with the tables in the financial section of the<br />
Annual Report.<br />
37
<strong>The</strong> <strong>KD</strong> <strong>Group</strong> Annual Report 2009<br />
Net profit or loss by business segment in 2009 <strong>and</strong> 2008 (in EUR thous<strong>and</strong>):<br />
Net profit or loss ( in EUR thous<strong>and</strong>)<br />
Property insurance Life insurance Health insurance Financial serv ices Banking Cinematography Other<br />
10.000<br />
0<br />
2.180<br />
3.808<br />
1.668<br />
-10.000<br />
-3.418<br />
-10.429<br />
-20.000<br />
-13.715<br />
-20.961<br />
-30.000<br />
-40.000<br />
-34.996<br />
-50.000<br />
-43.396<br />
2009 2008<br />
0 0 -110<br />
-490<br />
-1.368<br />
Assets<br />
Total assets of the <strong>Group</strong> stood at EUR 847,8million at the end of 2009, an increase of 7 percent compared to total assets of<br />
EUR 795,5 million at the end of 2008.<br />
<strong>The</strong> highest growth was recorded by investments of the insured <strong>and</strong> reinsurance contracts (72 percent) which is tied to the<br />
growth in stock market prices in 2009. Cash <strong>and</strong> cash equivalents increased by 30 percent compared to 2008, pointing to an<br />
improved liquidity of the <strong>Group</strong> when compared to the end of 2008. In terms of their structure, financial assets <strong>and</strong><br />
investments which declined by 5 percent in 2009 primarily due to write-offs <strong>and</strong> impairments, account for 44 percent of total<br />
assets.<br />
Assets <strong>and</strong> changes in 2009 <strong>and</strong> 2008 (in EUR thous<strong>and</strong>):<br />
Assets ( in EUR thous<strong>and</strong>)<br />
900.000<br />
800.000<br />
700.000<br />
600.000<br />
500.000<br />
400.000<br />
300.000<br />
200.000<br />
100.000<br />
0<br />
847.785<br />
795.464<br />
40.730<br />
31.305<br />
165.486 95.970<br />
131.048<br />
141.681<br />
374.256 393.268<br />
29.814 28.708<br />
106.451 104.532<br />
31.12.2009 31.12.2008 restatement<br />
Cash <strong>and</strong> cash<br />
equivalents<br />
Unit-linked investments<br />
of policyholders <strong>and</strong><br />
reinsurance contracts<br />
Receivables,<br />
inventories <strong>and</strong> other<br />
Financial assets <strong>and</strong><br />
investments<br />
Investment property<br />
Intangible <strong>and</strong> tangible<br />
fixed assets<br />
38
<strong>The</strong> <strong>KD</strong> <strong>Group</strong> Annual Report 2009<br />
In terms of the structure of assets by business segment, the major share is taken by the insurance segment with 68 percent,<br />
<strong>and</strong> financial services (25 percent), whereas banking segment accounts for only 5 percent of total assets. All segments<br />
recorded an increase in assets with exception of banking services where due to impairment <strong>and</strong> write-offs, the assets<br />
declined by 26 percent compared to 2008. <strong>The</strong> highest growth in assets (34 percent ) was recorded by the life insurance<br />
segment.<br />
Structure of assets by business segment as at 31 December 2009 (in %):<br />
Banking<br />
6%<br />
Other<br />
2%<br />
Financial services<br />
25%<br />
Property insurance<br />
29%<br />
Health insurance<br />
5%<br />
Life insurance<br />
33%<br />
Assets by business segment as at 31 December 2009 <strong>and</strong> 2008 (in EUR thous<strong>and</strong>):<br />
350.000<br />
300.000<br />
292.170<br />
282.420<br />
Assets ( in EUR thous<strong>and</strong>)<br />
250.000<br />
200.000<br />
150.000<br />
100.000<br />
50.000<br />
0<br />
243.796 239.434<br />
218.568<br />
209.467<br />
39.974 38.227<br />
46.752<br />
15.625 16.363<br />
0<br />
Property insurance Life insurance H ealth insurance Financial serv ices Banking Other<br />
2009 2008<br />
Equity <strong>and</strong> liabilities<br />
Equity was reduced by 22 percent to EUR 151.6 million at the end of 2009, primarily due to a reduction in capital surplus.<br />
Liabilities to the unit-linked investments rose to EUR 140 million <strong>and</strong> there was also an increase in liabilities from insurance<br />
contracts which at the end of 2009 stood at EUR 296.1 million. Financial liabilities of EUR 196.1 million represent an 8<br />
percent increase, slightly more than the 7 percent increase of total equity <strong>and</strong> liabilities.<br />
39
<strong>The</strong> <strong>KD</strong> <strong>Group</strong> Annual Report 2009<br />
<strong>The</strong> equity independence ratio indicating the share of equity in total liabilities (shown in the introductory overview of ratios)<br />
dropped to 17.9 percent as a result of a decrease in equity. It should be noted that the ratio is low primarily due to the<br />
specific characteristics of the insurance balance sheets which include liabilities arising from insurance contracts within items<br />
of equity <strong>and</strong> liabilities.<br />
Equity <strong>and</strong> liabilities <strong>and</strong> changes as at 31 December 2009 <strong>and</strong> 2008 (in EUR thous<strong>and</strong>):<br />
Equity <strong>and</strong> liabilities ( in EUR thousnad)<br />
900.000<br />
800.000<br />
700.000<br />
600.000<br />
500.000<br />
400.000<br />
300.000<br />
200.000<br />
100.000<br />
0<br />
847.785<br />
46.137<br />
795.464<br />
45.838<br />
196.132<br />
181.909<br />
17.703<br />
16.394<br />
140.109 79.309<br />
279.766<br />
296.098<br />
151.605<br />
192.247<br />
31.12.2009 31.12.2008 restatement<br />
Operating <strong>and</strong> other<br />
liabilities<br />
Financial liabilities<br />
Investment contracts<br />
Unit-linked liabilities to<br />
policyholders<br />
Liabilities arising from<br />
insurance contracts<br />
Equity *<br />
Business operations of <strong>KD</strong> <strong>Group</strong> d.d. in 2009<br />
Significant operating indicators of <strong>KD</strong> <strong>Group</strong> d.d.:<br />
– <strong>KD</strong> <strong>Group</strong> d.d. ended the year 2009 with a loss of EUR 52.8 million,<br />
– Operating expenses in 2009 reached EUR 7.3 million, a drop of 51 percent compared to the previous<br />
year. <strong>The</strong> effects of rationalisation were reflected primarily in the reduction of costs of goods, materials<br />
<strong>and</strong> services (56 percent reduction) <strong>and</strong> labour costs (26 percent reduction),<br />
– Financial revenue of EUR 8.3 million represents a drop of 84 percent compared to 2008 mainly on<br />
account of lower financial revenue from shares <strong>and</strong> interests,<br />
– Compared to 2008, financial expenses increased by 24 percent. Deepened economic crisis at home <strong>and</strong><br />
abroad resulted in a<strong>dd</strong>itional impairment <strong>and</strong> write-off of investments which totalled EUR 54.8 million,<br />
– At the end of 2009, total value of assets reached EUR 336.4 million, a drop of 11 percent compared to<br />
2008,<br />
– As at 31 December 2009, equity of EUR 162.3 million presents a 23 percent reduction compared to<br />
2008,<br />
– Compared to 2008, financial liabilities rose by 6 percent to EUR 168.3 million, accounting for 50 percent<br />
of total equity <strong>and</strong> liabilities. In terms of financial liabilities, there was a reduction in long-term financial<br />
liabilities to banks, <strong>and</strong> an increase in short-term financial liabilities to the <strong>Group</strong> companies.<br />
40
<strong>The</strong> <strong>KD</strong> <strong>Group</strong> Annual Report 2009<br />
Highlights from the income statement<br />
INCOME STATEMENT (in EUR thous<strong>and</strong>) 2009 2008<br />
Index<br />
2009 / 2008<br />
Gross operating income 501 659 76<br />
Operating expenses (7,252) (12,378) 59<br />
Costs of goods, materials <strong>and</strong> services (3,025) (6,828) 44<br />
Labour costs (3,636) (4,903) 74<br />
Amortisation <strong>and</strong> depreciation (536) (453) 118<br />
Other operating expenses (54) (195) 28<br />
Operating profit or loss (6,751) (11,719) 58<br />
Finance revenues 8,262 53,003 16<br />
Finance revenue from shares <strong>and</strong> interests 6,222 49,240 13<br />
Finance revenue from loans 2,016 3,714 54<br />
Finance revenue from operating receivables 23 49 47<br />
Finance expenses (62,818) (50,675) 124<br />
Finance expenses due to investment impairment <strong>and</strong> write-off (54,784) (42,088) 130<br />
Finance expenses from financial liabilities (7,805) (8,565) 91<br />
Finance expenses from operating liabilities (228) (22) 1.040<br />
Other revenue 197 7 2.829<br />
Other expenses (0) (295) 0<br />
Deferred tax <strong>and</strong> income tax 8,283 3,380 245<br />
Net profit or loss for the year (52,827) (6,299) 839<br />
Highlights from the balance sheet<br />
BALANCE SHEET (in EUR thous<strong>and</strong>) 31.12.2009 31.12.2008<br />
Index<br />
31.12.2009 /<br />
31.12.2008<br />
Assets 336.356 379.611 89<br />
Long-term assets 291.368 323.904 90<br />
Long-term financial assets 271.104 301.716 90<br />
Long-term operating assets 20.264 22.188 91<br />
Current assets 44.988 55.707 81<br />
Short-term financial assets 33.732 47.495 71<br />
Short-term operating assets 11.257 8.212 137<br />
Equity <strong>and</strong> liabilities 336.356 379.611 89<br />
Equity 162.305 210.917 77<br />
Provisions 21 32 65<br />
Financial <strong>and</strong> operating liabilities 174.030 168.662 103<br />
Financial liabilities 168.258 158.241 106<br />
Operating <strong>and</strong> other liabilities 5.772 10.421 55<br />
41
<strong>The</strong> <strong>KD</strong> <strong>Group</strong> Annual Report 2009<br />
Risk management<br />
In times of deepened financial <strong>and</strong> economic crisis, the Management Board of <strong>KD</strong> <strong>Group</strong> is regularly adopting measures that<br />
will to the largest possible extent impact risk management <strong>and</strong> contribute to the achievement of set goals.<br />
Conditions in the internal <strong>and</strong> international business environment deteriorated significantly in 2009. Thus the deepening of<br />
the financial turmoil has already been felt in the real sector of the economy. In this situation, risk management at the<br />
company <strong>and</strong> the <strong>Group</strong> <strong>KD</strong> <strong>Group</strong> was immediately adapted to new conditions. Since the situation does not permit us to<br />
exert excessive influence on the revenue side, we are focused on the more efficient h<strong>and</strong>ling of resources, increasing<br />
effectiveness <strong>and</strong> searching for a<strong>dd</strong>itional opportunities to exploit synergies.<br />
Strategic risks<br />
<strong>KD</strong> Banka, which designed the overall risk management strategy, began operating in 2009. It defines, forecasts <strong>and</strong><br />
summaries for each individual type of risks the strategies applicable to risk assumption <strong>and</strong> management, as well as policies<br />
relating to risk assumption <strong>and</strong> management in conjunction with the internal control system organisation that ensures the<br />
implementation of the strategies. This lays down clearly <strong>and</strong> transparently the responsibilities, competences, systems <strong>and</strong><br />
processes from the Management Board, executive officers up to the senior management <strong>and</strong> all those involved in the risk<br />
management system.<br />
Strategic risks that affect the long-term development of the <strong>Group</strong> include the risk of a loss due to incorrect <strong>and</strong>/or untimely<br />
business decisions made by the <strong>Group</strong> companies, inappropriate implementation of the adopted decisions, <strong>and</strong> insufficient<br />
response of the <strong>Group</strong> companies to changes in the business environment. This is of exceptional importance particularly in<br />
such major changes in business environment as has been witnessed recently by the majority of global economy. In these<br />
conditions risks should be managed by implementing <strong>and</strong> regular monitoring of the appropriateness of the <strong>Group</strong>'s<br />
strategies, their implementation <strong>and</strong> timely response to changed business circumstances.<br />
Due to highly diversified activities of the companies owned by <strong>KD</strong> <strong>Group</strong>, investment decisions taken in individual segments<br />
continue to be of key importance. <strong>The</strong>refore, the managing <strong>and</strong> governing system is continually adjusting to the external<br />
changes <strong>and</strong> the development of individual segments, as well as to the achievement of target returns.<br />
General business risk<br />
Our activities <strong>and</strong> decisions have no impact of the wider economic environment or relevant legislation. Thus risks are more<br />
difficult to measure <strong>and</strong> model. We manage these risks by regularly monitoring legislation, capital markets <strong>and</strong><br />
macroeconomic parameters. Amendments to legal regulations that significantly affect our business environment are quite<br />
frequent <strong>and</strong> complex. A series of legislative changes have occurred in Slovenia <strong>and</strong> the countries of South Eastern Europe<br />
in the past year that have affected our key areas of operations <strong>and</strong> required numerous activities to adapt them.<br />
Financial risk<br />
<strong>The</strong> primary purpose of financial risk management is to achieve stable operations <strong>and</strong> reduce exposure to specific risks to an<br />
acceptable level. <strong>The</strong> <strong>Group</strong> is highly exposed to financial risks through its financial assets <strong>and</strong> liabilities, reinsurance<br />
receivables <strong>and</strong> insurance liabilities. <strong>The</strong> possibility that inflows from financial investments will not be sufficient to cover<br />
outflows from insurance contracts represents the main risk, as well as the risk that, at a given moment, other companies will<br />
not have sufficient funds to settle their current liabilities or to maintain current operations. Given that most companies in the<br />
<strong>Group</strong> are involved in regulated activities, this area is already controlled to a large extent by observing legislative provisions.<br />
<strong>The</strong> most significant components of financial risk are changing interest rates <strong>and</strong> securities prices, <strong>and</strong> currency <strong>and</strong> credit<br />
risk. It became clear in the most recent period that financial risk <strong>and</strong> its management are of key importance for the<br />
achievement of set objectives. <strong>The</strong>refore, we continuously plan <strong>and</strong> monitor cash flows <strong>and</strong> attempt to proactively ensure the<br />
stability of our operations.<br />
<strong>The</strong> risks related to market risk management are managed independently by <strong>Group</strong> companies using methods linked<br />
primarily to the legal aspects of specific industries <strong>and</strong> may vary significantly by individual divisions. <strong>Group</strong> companies<br />
monitor <strong>and</strong> manage market risks from investments in financial instruments by carefully selecting the sector <strong>and</strong><br />
geographical composition of investments. In the segment of asset management, market risks are monitored, assessed, <strong>and</strong><br />
42
<strong>The</strong> <strong>KD</strong> <strong>Group</strong> Annual Report 2009<br />
managed by using quantitative methods of risk assessment compared to the selected returns criteria. In accordance with the<br />
Insurance Act, insurance companies are obliged to match long-term business fund investments with their liabilities arising<br />
from insurance contracts, the amount of which depends on changes in exchange rates, interest rates <strong>and</strong> securities prices.<br />
<strong>The</strong> method of managing these risks <strong>and</strong> exposure thereto are presented in detail in the financial section of the consolidated<br />
Annual Report.<br />
Operational risk<br />
Operational risk (including legal risk) is the risk of loss arising primarily due to inadequate or incorrect implementation of<br />
internal controls, other inappropriate conduct by personnel involved in the company's internal operations, inadequate or<br />
incorrect functioning of systems that relate to the company's internal operations, <strong>and</strong> external events or acts. Operational risk<br />
also includes IT risk, which is the risk of data loss resulting from inadequate information technology <strong>and</strong> processing,<br />
particularly in terms of manageability, access, integrity, supervision <strong>and</strong> continuity. Operational risk is managed by<br />
companies by identifying opportunities <strong>and</strong> threats in their respective areas <strong>and</strong> by managing business processes. <strong>The</strong><br />
management of these risks is subordinate to the strategic <strong>and</strong> business objectives of individual segments <strong>and</strong> companies.<br />
In all larger <strong>KD</strong> <strong>Group</strong> companies, we manage operational risk by introducing ISO st<strong>and</strong>ards (at companies where this<br />
makes sense due to the complexity of processes) <strong>and</strong> using st<strong>and</strong>ard software for accounting <strong>and</strong> investments. Risks are<br />
also mitigated by a st<strong>and</strong>ardised system of annual planning <strong>and</strong> monthly reporting that provide the parent company with<br />
information about the operations of subsidiaries in a timely manner. In this regard, the new planning model facilitates flexible<br />
planning <strong>and</strong> contributes to the monitoring of established objectives <strong>and</strong> the timely adoption of measure in the context of a<br />
change in assumptions.<br />
<strong>The</strong> internal audit department has been particularly diligent with regard to signs of fraud in all previously performed internal<br />
audits. In this respect, the internal audit department assesses the probability of fraud arising. Any deviations are reported in<br />
the scope of individual internal audit reports. Risks of improper conduct of people, in the context of increased pressures on<br />
employees as a "by-product" of the current turmoil, may also be seen as the increased risk of fraud, common in the<br />
international environment. <strong>The</strong>refore, time has been reserved in the proposed plans of the internal audit department for<br />
2010 to raise the awareness of our employees. Plans include training on the subject of recognising indicators or signs of<br />
fraud.<br />
Insurance risks<br />
Within the framework of insurance risk, the operations of insurance companies are exposed to underwriting process risk,<br />
product design risk, pricing risk, economic environment risk, policyholder behaviour risk, reserving risk <strong>and</strong> claims risk.<br />
In view of the above, <strong>and</strong> the nature of insurance contracts, where insurance risks are r<strong>and</strong>om <strong>and</strong> unpredictable, insurance<br />
companies in the <strong>Group</strong> have developed their own policies for concluding insurance contracts in order to diversify the<br />
assumed risks. Measures taken in order to manage insurance risks are as follows:<br />
– risks that exceed a predetermined amount are transferred to a reinsurance company;<br />
– diversification of assumed risks <strong>and</strong> achieving sufficient number of risks in individual categories to reduce<br />
variability of anticipated results (diversification <strong>and</strong> portfolio increase),<br />
– parameters defining the insurance premium are assessed adequately when new insurance products are<br />
developed;<br />
– effective implementation of internal controls,<br />
– creation of appropriate amount of provisions,<br />
– monitoring <strong>and</strong> analysing changes to ensure timely <strong>and</strong> proactive measures.<br />
Details regarding the distribution of maximum loss (maximum insured sum) by the sectors in which policyholders operate <strong>and</strong><br />
the diversification of the insurance portfolio (exposure to the largest policyholders) are disclosed in the financial section of the<br />
Annual Report.<br />
43
<strong>The</strong> <strong>KD</strong> <strong>Group</strong> Annual Report 2009<br />
Human resource risk<br />
<strong>The</strong> risks in this area are carefully managed at the <strong>Group</strong> level <strong>and</strong> directly through individual companies in the <strong>Group</strong>, as<br />
employees are the key to our success. To mitigate the risk of excessive employee turnover, we educate <strong>and</strong> train our<br />
employees, attend to the working environment <strong>and</strong> general employee satisfaction, organise meetings of all employees,<br />
stimulate affiliation with the <strong>Group</strong>, strengthen the social security of employees with a<strong>dd</strong>itional insurance, <strong>and</strong> by<br />
implementation of modern human resource policies <strong>and</strong> practices in line with the adopted human resource vision <strong>and</strong><br />
strategy.<br />
More information about employees is included in chapter Human resources <strong>and</strong> their development.<br />
Reputation risk<br />
A potential loss due to a negative corporate or <strong>Group</strong> image is difficult to measure <strong>and</strong> even more difficult to correct. We<br />
maintain <strong>and</strong> augment the <strong>Group</strong>'s reputation <strong>and</strong> boost the value of our br<strong>and</strong>s in the eyes of our customers, business<br />
partners, owners, investors <strong>and</strong> regulators through good performance <strong>and</strong> by managing all other risks. We constantly<br />
communicate with the community <strong>and</strong> financially support numerous cultural <strong>and</strong> sporting events, <strong>and</strong> humanitarian<br />
campaigns.<br />
IT-related risk<br />
We constantly introduce new information support for work process at all companies in the <strong>Group</strong>. We manage this process<br />
through an appropriate organisational structure, the inclusion of specialist departments, internal auditing, diligent testing <strong>and</strong><br />
project management. In 2009, the information systems of <strong>Group</strong> companies functioned well, without major interruptions that<br />
would have a significant impact on the company's operations.<br />
Legal risk<br />
Legal risks form an integral part of operational risks. We define these risks as a behaviour, the consequence of which is the<br />
legally justified intervention of a third party in the company's operations that causes it material or moral damage. This could<br />
arise as a result of violations of regulations, internal instructions, professional recommendations, contracts, good practices or<br />
ethical st<strong>and</strong>ards. <strong>The</strong>se risks are managed through the adoption of internal rules of operation aimed at reducing the<br />
probability of harmful consequences <strong>and</strong> preventing actions caused by such circumstances. <strong>The</strong> legal function is integrated<br />
into the adoption of business decisions, providing for the timely detection of legal risks.<br />
Incidental risk<br />
Incidental events are quite rare but may have severe consequences for operations. <strong>The</strong> company protects itself against<br />
incidental risk through insurance or reinsurance contracts.<br />
Risk related to securities issued by <strong>KD</strong> <strong>Group</strong> d. d.<br />
<strong>The</strong> holders of securities issued by <strong>KD</strong> <strong>Group</strong> d. d. are exposed to the following risks:<br />
- Market risk: shares <strong>and</strong> bonds are sensitive to changes which the issuer cannot influence such as changes in the<br />
economy or legislation, crises, <strong>and</strong> natural <strong>and</strong> ecological disasters.<br />
- Liquidity risk: the risk of a security holder not being able to sell a security or only being able to sell it at a lower price<br />
owing to insufficient dem<strong>and</strong>.<br />
- Credit risk: the risk of the bond issuer failing to pay interest <strong>and</strong> principal.<br />
<strong>KD</strong> <strong>Group</strong> d. d. can only influence the exposure to credit risk by managing other risks <strong>and</strong> thus influencing the stability <strong>and</strong><br />
long-term growth of the <strong>Group</strong>.<br />
44
<strong>The</strong> <strong>KD</strong> <strong>Group</strong> Annual Report 2009<br />
Internal audit<br />
In 2009, the internal audit department, as an active member of the internal control system, helped the company <strong>and</strong> the <strong>KD</strong><br />
<strong>Group</strong> achieve established objectives by stimulating a prudent <strong>and</strong> regulated method of evaluating <strong>and</strong> improving the<br />
effectiveness of procedures for controlling <strong>and</strong> managing risks <strong>and</strong> thus contributed to the generation of a<strong>dd</strong>ed value by<br />
providing independent <strong>and</strong> impartial findings <strong>and</strong> serving in an advisory role. In 2009, it also directly verified whether the<br />
internal control system is established, if it functions <strong>and</strong> whether it is effective in its objective to continue ensuring the legality,<br />
security, effectiveness <strong>and</strong> efficiency of operations <strong>and</strong> the protection of assets. Furthermore, the internal audit department<br />
was responsible for improving risk management <strong>and</strong> the recognition of the internal audit department within the <strong>Group</strong> by<br />
carrying out individual audits, through its advisory function <strong>and</strong> by organising training for all <strong>Group</strong> employees.<br />
Based on the internal audit department's strategy adopted in 2007 <strong>and</strong> uniform rules on internal audit planning <strong>and</strong> reporting,<br />
the internal audit department amended <strong>and</strong> exp<strong>and</strong>ed general internal audit rules in 2009 with the aim of achieving<br />
st<strong>and</strong>ardised actions, greater efficiency <strong>and</strong> the success of the internal audit function at the <strong>Group</strong> level. This led to adoption<br />
of a revised Document on the internal audit function. <strong>The</strong> revised document was drafted as a result of substantial<br />
amendments to the binding internal audit st<strong>and</strong>ards <strong>and</strong> changes in the management of <strong>KD</strong> <strong>Group</strong> d.d. (one-tier system) <strong>and</strong><br />
represents the minimum st<strong>and</strong>ard applicable to the <strong>Group</strong>. Furthermore in 2009 we adopted the Policy of cooperation <strong>and</strong><br />
development of the internal audit function of the <strong>KD</strong> <strong>Group</strong> with a view of utilising synergies, harmonisation, <strong>and</strong> with an aim<br />
of sharing the knowledge <strong>and</strong> best practices among internal audit services which are, in terms of their status <strong>and</strong><br />
organisation, part of an independent <strong>and</strong> decentralised system.<br />
At the <strong>Group</strong> level, internal audit function is uniform to the extent that ensures that internal audit of the <strong>KD</strong> <strong>Group</strong> in individual<br />
subsidiary is involved in the selection of internal auditors, in annual preparation of plan of work, <strong>and</strong> in monitoring the<br />
implementation of recommendations <strong>and</strong> reporting in a manner that, in accordance with the professional recommendations, it<br />
acts as a coordination unit, <strong>and</strong> is charged with the development of st<strong>and</strong>ard internal audit methodology <strong>and</strong> general<br />
development of the internal audit function within the <strong>Group</strong>. <strong>The</strong> professional qualification of internal audit department<br />
employees is appropriate. Two internal auditors employed at <strong>KD</strong> <strong>Group</strong> d. d. are experienced in the areas of external <strong>and</strong><br />
internal auditing <strong>and</strong> hold the relevant titles as bestowed by the Slovenian Institute of Auditors (certified internal auditor <strong>and</strong><br />
certified accountant), as well as internationally recognised (CIA) <strong>and</strong> other titles (state internal auditor <strong>and</strong> state auditor).<br />
In 2009 we continued to carry out surveys of the audit subjects after completion of the internal audit (i.e. following a<br />
consolidated <strong>and</strong> final audit report). Based on the survey we drafted a plan of activities aimed at a<strong>dd</strong>itional increase in the<br />
satisfaction of audit subjects <strong>and</strong> at raising internal audit's a<strong>dd</strong>ed value.<br />
Human resources <strong>and</strong> development<br />
At the <strong>Group</strong> <strong>KD</strong> <strong>Group</strong> we are aware that our employees are our important asset <strong>and</strong> investment for the future. With this in<br />
mind we devoted much effort into development, education <strong>and</strong> primarily promotion of innovative potential of our employees<br />
in all segments <strong>and</strong> at all levels of the <strong>Group</strong>. <strong>The</strong>refore, we have specified what human resource management means <strong>and</strong><br />
also redefined new roles of HR leaders as the key holders of the HRM function. Moreover, the Management devotes much<br />
attention to monitoring, measuring efficiency <strong>and</strong> particularly improving <strong>and</strong> upgrading the manner of work. We should also<br />
highlight the even more important role of internal communication <strong>and</strong> to this aim the most senior management of the <strong>Group</strong><br />
was introduced <strong>and</strong> maintained dialog with all the employees.<br />
Within the framework of human resource strategy, we designed the concept of centralised HRM. Furthermore we redesigned<br />
<strong>and</strong> underlined the human resource management vision <strong>and</strong> mission <strong>and</strong> established its strategic goals.<br />
Key strategic goals of human resource management of the <strong>Group</strong> <strong>KD</strong> <strong>Group</strong> remain unchanged from one year to the other<br />
as these are of key importance for implementation of our vision. <strong>The</strong>se goals include efficient HR organisation, interaction<br />
<strong>and</strong> orientation towards common goals, activities that are consistent with values, inter-cultural cooperation <strong>and</strong> employee<br />
mobility, excellent system of employee remuneration <strong>and</strong> motivation, as well as recognition in terms of professional<br />
competence <strong>and</strong> innovation of employees.<br />
45
<strong>The</strong> <strong>KD</strong> <strong>Group</strong> Annual Report 2009<br />
Number of employees<br />
AS division<br />
Company 31.12.2008<br />
31.12.2008<br />
(share in %)<br />
31.12.2009<br />
Index<br />
2008/2009<br />
31.12.2009<br />
(share in %)<br />
Average<br />
number of<br />
employees<br />
in 2009<br />
Adriatic Slovenica d. d., Koper 1,033 53.00% 1,006 103 56.52% 1,020<br />
AS Neživotno osiguranje, Beograd 15 0.77% 49 31 2.75% 55<br />
Life insurance division<br />
<strong>KD</strong> Življenje, zavarovalnica, d. d. 156 8.00% 181 86 10.17% 176<br />
<strong>KD</strong> Životno osiguranje d. d., Zagreb 17 0.87% 42 40 2.36% 31<br />
<strong>KD</strong> Life AD, Sofia 49 2.51% 32 153 1.80% 36<br />
<strong>KD</strong> Life Asigurari, S.A., Bucharest 37 1.90% 43 86 2.42% 43<br />
<strong>KD</strong> Life d. d., Kiev 51 2.62% 15 340 0.84% 37<br />
SC <strong>KD</strong> Fond De Fond SA Bucharest 8 0.41% 7 114 0.39% 8<br />
ZAP d. o. o., Murska Sobota 0 0.00% 0 - 0.00% 0<br />
World Life <strong>Group</strong>, Limassol - - 0 - 0.00% 0<br />
Vitavizia, Vipava - - 0 - 0.00% 0<br />
<strong>KD</strong> Finančna točka d. o. o., Ljubljana 155 7.95% 60 258 3.37% 96<br />
<strong>KD</strong> Finančna točka d.o.o., Bucharest 3 0.15% 0 - 0.00% 2<br />
<strong>KD</strong> Financial point, s.r.o., Bratislava 2 0.10% 0 - 0.00% 0<br />
<strong>KD</strong> Finančna točka d. o. o., Zagreb 0 0.00% 0 - 0.00% 0<br />
<strong>KD</strong> Finančna točka d.o.o., Bulgaria - - 3 - 0.17% 0<br />
<strong>KD</strong> Mark, d. o. o., Ljubljana 2 0.10% 2 100 0.11% 2<br />
Financial operations division<br />
<strong>KD</strong> <strong>Group</strong> d. d., Ljubljana 77 3.95% 48 160 2.70% 50<br />
<strong>KD</strong> Skladi d. o. o., Ljubljana 59 3.03% 43 137 2.42% 43<br />
<strong>KD</strong> Investments d. o. o., Zagreb 34 1.74% 12 283 0.67% 17<br />
<strong>KD</strong> Investments a.d., Beograd 12 0.62% 3 400 0.17% 7<br />
<strong>KD</strong> Fondovi ad Skopje 4 0.21% 7 57 0.39% 7<br />
<strong>KD</strong> Investments EAD, Sofia 11 0.41% 8 138 0.45% 9<br />
SAI <strong>KD</strong> Investments, Bucharest 8 0.56% 8 100 0.45% 8<br />
<strong>KD</strong> Fund Advisors, LLC 0 0.00% 0 - 0.00% 0<br />
ABDS d. d., Sarajevo 7 0.36% 7 100 0.39% 7<br />
Coloseum Multiplex Holdings b.v., Amsterdam 0 0.00% 0 - 0.00% 0<br />
Gama Holdings b.v. Amsterdam 1 0.05% 1 100 0.06% 1<br />
<strong>KD</strong> Asset Management b. v. Amsterdam 0 0.00% 0 - 0.00% 0<br />
Manta Marine 0 0.00% 0 - 0.00% 0<br />
VIB a.d., Banja Luka 3 0.15% 3 100 0.17% 3<br />
<strong>KD</strong> Private Equity d. o. o., Beograd 1 0.05% 1 100 0.06% 1<br />
Firsthouse Investments Itd., Cyprus 0 0.00% 0 - 0.00% 0<br />
Kredo <strong>Group</strong>, Taškent - - 2 - 0.11% 0<br />
Sarbon Invest, Taškent - - 2 - 0.11% 0<br />
Banking division<br />
<strong>KD</strong> Banka d. d. , Ljubljana 35 1.80% 52 67 2.92% 50<br />
<strong>KD</strong> Capital Management S. A., Bucharest 14 0.72% 6 233 0.34% 8<br />
<strong>KD</strong> Securities EAD, Sofia 13 0.67% 2 650 0.11% 5<br />
<strong>KD</strong> Upravljanje imovinom d. o. o., Zagreb 8 0.41% 8 100 0.45% 8<br />
Capital investments <strong>and</strong> real estate division<br />
<strong>KD</strong> Kapital d. o. o., Ljubljana 8 0.41% 7 114 0.39% 7<br />
<strong>KD</strong> Kvart d. o. o., Ljubljana 7 0.36% 8 88 0.45% 7<br />
Gea College CVŠ d. o. o., Ljubljana 4 0.21% 4 100 0.20% 4<br />
Gea College d. d., Ljubljana 6 0.31% 5 120 0.26% 5<br />
Gea College PIC d. o. o., Ljubljana 5 0.26% 4 125 0.21% 4<br />
ČZD Kmečki Glas d. o. o., Ljubljana 34 1.74% 30 113 1.69% 32<br />
Fontes <strong>Group</strong> d. o. o., Beograd 0 0.00% 0 - 0.00% 0<br />
FM-NET , Ljubljana - - 0 - 0.00% 0<br />
Radio Kranj, Kranj - - 9 - 0.52% 9<br />
R.E. Invest d. o. o., Ljubljana 1 0.05% 1 100 0.06% 1<br />
Vrtnarstvo Celje d. o. o., Celje 69 3.54% 60 115 3.37% 68<br />
<strong>The</strong> <strong>KD</strong> <strong>Group</strong> 1,949 100.00% 1,780 100.00% 1,860<br />
46
<strong>The</strong> <strong>KD</strong> <strong>Group</strong> Annual Report 2009<br />
<strong>The</strong> <strong>Group</strong> had a total of 1,780 employees at the end of 2009, a decrease of 8.7 percent compared with 2008 (1,949<br />
employees). Reduction in employment is primarily due to optimisation of operations in <strong>KD</strong> Finančna točka, to certain extent<br />
in <strong>KD</strong> Skladi <strong>and</strong> in companies located abroad. In accordance with the project for establishment of <strong>KD</strong> Banka, a number of<br />
employees were transferred from <strong>KD</strong> <strong>Group</strong> d.d. into the newly established <strong>KD</strong> Banka. No other more significant changes in<br />
human resources occurred in the <strong>Group</strong> <strong>KD</strong> <strong>Group</strong> in 2009.<br />
Employee age structure in the <strong>Group</strong> <strong>KD</strong> <strong>Group</strong><br />
Employee age structure in the <strong>Group</strong> <strong>KD</strong> <strong>Group</strong> as at 31 December 2009<br />
compared to 2008<br />
Age category<br />
over 56 years<br />
51-55<br />
46-50<br />
41-45<br />
36-40<br />
31-35<br />
26-30<br />
21-25<br />
under 20 years<br />
0<br />
0,33<br />
3,46<br />
3,81<br />
4,20<br />
8,39<br />
5,93<br />
7,77<br />
10,37<br />
12,78<br />
11,36<br />
13,78<br />
17,53<br />
15,31<br />
18,74<br />
20,74<br />
19,07<br />
26,67<br />
2009<br />
2008<br />
0 5 10 15 20 25 30<br />
Percentage of employees<br />
In 2009, the majority of the <strong>Group</strong>'s employees were young, perspective <strong>and</strong>, above all, educated personnel. <strong>The</strong> largest<br />
group of employees (26.67%) were those between 31 <strong>and</strong> 35 years of age.<br />
Educational structure of employees in the <strong>Group</strong> <strong>KD</strong> <strong>Group</strong><br />
Educational structure of employees in the <strong>Group</strong> <strong>KD</strong> <strong>Group</strong> as at 31<br />
December 2009 compared to 2008<br />
PhD<br />
0,49<br />
1<br />
Educational category<br />
Master's degree<br />
College or university<br />
Higer education<br />
Secondary school<br />
5,19<br />
8,54<br />
9,88<br />
12,21<br />
31,76<br />
35,8<br />
39,48<br />
46,67<br />
2009<br />
2008<br />
Primary or vocational school<br />
4,69<br />
7,01<br />
0 10 20 30 40 50<br />
Percentage of employees<br />
In 2009, the <strong>Group</strong> primarily employed persons with a higher educational level. <strong>The</strong> share of employees with a higher<br />
educational level was 46.67 percent, whereas employees with secondary school level accounted for 35.8 percent of total<br />
staff.<br />
47
<strong>The</strong> <strong>KD</strong> <strong>Group</strong> Annual Report 2009<br />
Training <strong>and</strong> employee development<br />
We look upon investment in the knowledge of our employees as investment in the future of the <strong>KD</strong> <strong>Group</strong>. <strong>The</strong>refore we<br />
systematically invest in increased professional competence, general work competences <strong>and</strong> innovation of our employees. In<br />
2009 this was achieved through education, training <strong>and</strong> particularly through internal transfer of knowledge.<br />
Supporting formal education <strong>and</strong> training<br />
At the <strong>Group</strong> <strong>KD</strong> <strong>Group</strong>, we provide support <strong>and</strong> encourage our employees to continue education to achieve a higher level of<br />
formal education. To this aim we fund education <strong>and</strong> provide a<strong>dd</strong>itional study leave for all employees who decide to pursue<br />
further education. We are aware that through formal education <strong>and</strong> increased level of education, we will ensure new<br />
knowledge, modern practices <strong>and</strong> latest information flowing to the <strong>Group</strong>.<br />
Internal transfer of knowledge<br />
In 2009 we strived to further establish the concept of internal education <strong>and</strong> to include all potential internal tutors in the<br />
process of continual education in individual professional areas as well as in general. We ensured uninterrupted transfer of<br />
knowledge between employees with the help of modern technology, <strong>and</strong> particularly through audio <strong>and</strong> video technology <strong>and</strong><br />
we have begun establishing our internal knowledge base. <strong>The</strong> knowledge transfer was based primarily on the working<br />
system of learning using the Dschool method, <strong>and</strong> involved all employees in the workshops according to their competences<br />
in individual work areas.<br />
A<strong>dd</strong>itionally we strived to build up our internal library to promote knowledge transfer <strong>and</strong> self-learning process of employees.<br />
Monitoring job optimising <strong>and</strong> employee remuneration<br />
<strong>The</strong> <strong>Group</strong> <strong>KD</strong> <strong>Group</strong> is aware that efficient system of success recognition <strong>and</strong> remuneration is an extremely important<br />
element of human resource management towards their satisfaction <strong>and</strong> commitment.<br />
Employee remuneration<br />
Currently we are upgrading the complete system of employee remuneration at the <strong>Group</strong> level to promote success,<br />
entrepreneurial spirit <strong>and</strong> innovation of our employees. As we are also aware of the power <strong>and</strong> importance of non-financial<br />
remuneration, we have deliberately supported recognition of achievements of individuals with suitable commendation<br />
whenever appropriate.<br />
Care for our employees<br />
As the <strong>Group</strong> is active in the services sector, we are well aware of our strong dependency on satisfied, committed <strong>and</strong><br />
motivated employees as it is only through them that we can satisfy the needs <strong>and</strong> aspirations of our stakeholders – business<br />
partners, customers <strong>and</strong> owners. .<br />
Attention to our employees<br />
In 2009 we again surprised our employees with small tokens of appreciation at their job positions such as gifts <strong>and</strong> greetings<br />
cards on major celebrations <strong>and</strong> events, Christmas gifts for children <strong>and</strong> organisation of “<strong>The</strong> First Day of School” We also<br />
made it possible for our employees to participate at a variety of cultural events, concerts <strong>and</strong> other events. Special attention<br />
was devoted in 2009 to all those who have been with the <strong>Group</strong> for a number of years to show our appreciation for their<br />
commitment <strong>and</strong> loyalty.<br />
Developing a close-knit working group<br />
Our employees actively participated <strong>and</strong> socialised in the “Kaj Dogaja” sports club <strong>and</strong> organised the fifth, now traditional <strong>KD</strong><br />
Bowling Challenge. In a<strong>dd</strong>ition we organised a number of teambuilding events where in a<strong>dd</strong>ition to gaining new knowledge,<br />
employees were able to get to know each other better <strong>and</strong> socialise at a number of internally organised workshops <strong>and</strong><br />
meetings organised with the most senior management.<br />
Charity <strong>and</strong> solidarity<br />
We would like to point out that the employees of the <strong>Group</strong> <strong>KD</strong> <strong>Group</strong> in 2009 again regularly attended blood donor<br />
campaigns <strong>and</strong> by donating little something of our own we contributed to the wider social community. We also assisted in<br />
education <strong>and</strong> promotion of charity work with the younger generation.<br />
Health <strong>and</strong> safety at work<br />
At the <strong>Group</strong> <strong>KD</strong> <strong>Group</strong> we strive to ensure optimum <strong>and</strong> pleasant working environment for all employees. In 2009 we again<br />
provided safe <strong>and</strong> appropriate working conditions <strong>and</strong> pleasant working environment. We regularly monitored <strong>and</strong> continually<br />
improved the quality of food served in our <strong>KD</strong> restaurant. At request of our employees we included vegetarian dishes on the<br />
menu <strong>and</strong> continually improved selection of dishes as we support <strong>and</strong> encourage our employees to pursue healthy life styles.<br />
48
<strong>The</strong> <strong>KD</strong> <strong>Group</strong> Annual Report 2009<br />
In the autumn of 2009 we organised vaccination against seasonal <strong>and</strong> p<strong>and</strong>emic flu <strong>and</strong> carefully followed health<br />
organisations' guidelines concerning preventive health measures.<br />
Optimisation of operations<br />
<strong>The</strong> <strong>Group</strong> felt the impact of international economic <strong>and</strong> financial crisis <strong>and</strong> its consequences. Much of our energy <strong>and</strong><br />
knowledge was directed to specifying the role, organisation <strong>and</strong> holders of HR function of the <strong>Group</strong>. With a view of<br />
optimisation of operations we began the project of centralisation of the human resource division <strong>and</strong> introduced our own<br />
concept of HRM administrators. We continued with the introduction of a contemporary HR information system based on the<br />
»know-how« <strong>and</strong> which we will use to increase the transparency of HR processes, optimise them <strong>and</strong> provide IT support. In<br />
a<strong>dd</strong>ition this will give us an overall view of the human resource statistics of the <strong>Group</strong>.<br />
Recognition on the labour market<br />
In 2009 we strongly encouraged internal communication at the <strong>Group</strong> level, while we exercised more restraint in<br />
communication with the wider public <strong>and</strong> the labour market. Our aim was to strengthen our internal resources, optimise our<br />
strengths <strong>and</strong> grow so that in future years we can again actively take our position in public <strong>and</strong> on the markets. <strong>The</strong> HR<br />
vision remains unchanged as the <strong>KD</strong> <strong>Group</strong> strives to become the best employer for all our employees <strong>and</strong> to be recognised<br />
as such also by the labour market.<br />
RESEARCH AND DEVELOPMENT<br />
In the insurance segment, the <strong>Group</strong> has been active in the development <strong>and</strong> modernisation of our range of insurance<br />
products <strong>and</strong> assistance services, expansion of our sales network, development of modern information technology solutions<br />
<strong>and</strong> safe <strong>and</strong> high quality services in all business segments. In <strong>KD</strong> Življenje insurance company we introduced two new life<br />
insurance products in 2009: “Fondpolica Maks Garant Plus” <strong>and</strong> whole life insurance “Življenjski kasko”, <strong>and</strong> improved life<br />
insurance policy »Fondpilica« by offering a<strong>dd</strong>itional investment possibilities as well as the option of a wide selection of<br />
a<strong>dd</strong>itional insurance products. By doing this we can ensure that we remain innovative <strong>and</strong> closely follow the needs of our<br />
target groups. In a<strong>dd</strong>ition to product development, we actively pursued the development <strong>and</strong> adjustment of products for the<br />
dem<strong>and</strong>s of foreign markets. In 2009, <strong>KD</strong> Življenje continued processing its portfolio of existing insurance clients in order to<br />
improve <strong>and</strong> supplement existing insurance contracts. <strong>The</strong> process began in the last quarter of 2008 at the beginning of the<br />
global financial crisis. As part of the upgrading of the information system supporting life insurance products, in 2009 <strong>KD</strong><br />
Življenje successfully implemented new information system Amarta.<br />
Adriatic Slovenica insurance company in 2009 actively pursued development of property <strong>and</strong> health insurance products. As<br />
the leading Slovene health insurance provider, Adriatic Slovenica improved its wide range of products while in terms of life<br />
insurance products, efforts were devoted primarily to the establishment of sales <strong>and</strong> after-sales services. In a<strong>dd</strong>ition it<br />
launched a completely new property insurance “Dom AS”, which allows for insurance of all the property under one insurance<br />
policy, has a comprehensive range of extensive assistance services , <strong>and</strong> represents an important new development <strong>and</strong> a<br />
sales winner on the Slovene market. In the field of motor insurance Adriatic Slovenica designed new motor third-party<br />
liability insurance for the young drivers with fewer than three years of driving experience. This is a novelty on the Slovene<br />
market as is the new cover – option to surrender the first damage when underwriting motor liability insurance. Another new<br />
development is a long-term accident insurance of pre-school children <strong>and</strong> school children <strong>and</strong> liability insurance for members<br />
of management bodies where individuals can insure personal liability. Renewed “above” st<strong>and</strong>ard health insurance offers<br />
extensive existing cover in a<strong>dd</strong>ition to a completely new coverage – medical procedures which are part of a one day<br />
treatment, endoscopy <strong>and</strong> tissue <strong>and</strong> cell tests. Alongside these developments, the company focused its efforts on the<br />
development <strong>and</strong> adaptation of property <strong>and</strong> health insurance to fit the Serbian market where a new subsidiary »AS<br />
neživotno osiguranje« began operating in September <strong>and</strong> who, in its first year of operations, gained almost 1 percent of total<br />
Serbian insurance market, <strong>and</strong> at the end of the year, 2.5 percent share of motor third-party liability. Adriatic Slovenica<br />
pursued development of its own market network through new representative offices <strong>and</strong> a<strong>dd</strong>itional marketing channels, whilst<br />
at the same time exp<strong>and</strong>ing marketing network in Serbia with establishment of a new business unit <strong>and</strong> two representative<br />
offices in 2009. Today AS neživotno osiguranje operates in four branches <strong>and</strong> two offices. Adriatic Slovenica succeeded in<br />
preserving, strengthening <strong>and</strong> continually improving the quality of its insurance products <strong>and</strong> services thus increasing<br />
operating safety. <strong>The</strong> company successfully concluded the first stage of an extensive project of developing ASBI data<br />
warehouse, which allows its users (at various levels) fast access to uniform <strong>and</strong> quality information for decision-making<br />
process. <strong>The</strong> company is quickly transferring to a system of paperless, electronic data storage.<br />
Changed business conditions on the market as a result of financial <strong>and</strong> economic crisis required from companies in the<br />
segment of Investment fund management to continue with the process of business rationalisation <strong>and</strong> optimisation, while<br />
at the same time focusing on improving quality of existing services <strong>and</strong> developing new products, increasing business safety,<br />
improving quality of management services <strong>and</strong> ensuring simplified operations for the investor.<br />
49
<strong>The</strong> <strong>KD</strong> <strong>Group</strong> Annual Report 2009<br />
<strong>KD</strong> Skladi, Ljubljana <strong>and</strong> <strong>KD</strong> Investments, Zagreb, have launched new websites. <strong>KD</strong> Skladi upgraded its website with new<br />
user tools (investment computer, investor profile) <strong>and</strong>, as the first Asset management company in Slovenia, introduced video<br />
comments.<br />
<strong>The</strong> companies in this division were active in the development of risk management <strong>and</strong> information technology,<br />
methodologies <strong>and</strong> organisation as a response to amended relevant legislation <strong>and</strong> pursued development of sales<br />
techniques <strong>and</strong> new sales channels.<br />
In the beginning of 2009, <strong>KD</strong> Skladi introduced new Internet service for its investors - web-based office <strong>KD</strong> Skladi.net, where<br />
investors have free <strong>and</strong> safe access to their accounts in the selected <strong>KD</strong> Skladi funds. We continue development of<br />
information support to our operations <strong>and</strong> modern services for our investors to provide online access to individual funds.<br />
<strong>KD</strong> Skladi was among the first asset management companies in Slovenia to transform all of its 17 mutual funds into sub<br />
funds of the <strong>KD</strong> Krovni sklad.<br />
In cooperation with Concorde Premoženjsko svetovanje, <strong>KD</strong> Skladi develops new savings plan VIP plus 100 <strong>and</strong> VIP 100<br />
Premium.<br />
Investors (natural persons) in <strong>KD</strong> Skladi are able to make monthly payments through direct debit system.<br />
With a view of facilitating operations of investors, reducing investor documentation <strong>and</strong> making it easier to complete<br />
accession forms for several sub funds simultaneously, a new project »single accession form« was launched.<br />
<strong>KD</strong> Skladi began implementation of the Charles River order management IT system, support system that will allow for more<br />
efficient management (improved supervision, improved transaction implementation, introduction of derivative securities <strong>and</strong><br />
better underst<strong>and</strong>ing of a<strong>dd</strong>ed value), <strong>and</strong> most of all, reduce operating risks.<br />
Year 2010<br />
In future we will continue to direct our activities in the development of products in accordance with industry trends <strong>and</strong> sales<br />
network initiative ( development of savings accounts <strong>and</strong> baskets of funds), whilst at the same time endeavour to upgrade<br />
<strong>and</strong> improve the existing products <strong>and</strong> services.<br />
We continue to develop friendlier <strong>and</strong> simpler modern business methods using the Internet. Our web-based office <strong>KD</strong><br />
Skladi.net will be improved to allow investors not only to check the balance <strong>and</strong> monitor transactions, but also to gain access<br />
to funds <strong>and</strong> online services.<br />
Websites of the companies in the division will be upgraded with new contents <strong>and</strong> tools.<br />
In 2010 we intend to continue with activities related to the launch of a new distribution channel – newly established <strong>KD</strong><br />
Banka, primarily by utilising product <strong>and</strong> sales synergies.<br />
Our aim for 2010 is also to complete the implementation of the Charles River IT system.<br />
In the Banking division, 2009 was marked by the development of banking infrastructure, products <strong>and</strong> sales channels,<br />
based on identified needs of (potential) clients, development opportunities, activities of our competitors, development trends<br />
<strong>and</strong> amendments to legislation. Much effort was devoted to setting up the basic banking applications <strong>and</strong> integrating the<br />
bank in interbanking connections, developing commercial banking products <strong>and</strong> electronic banking, which provides a<br />
number of novelties <strong>and</strong> advantages. Online banking which <strong>KD</strong> Banka introduced for its first users in November 2009, was<br />
one of the first in Slovenia to combine services of commercial <strong>and</strong> investment banking. Particular attention was devoted to<br />
the online banking safety in the information environment of <strong>KD</strong> Banka. In 2009, we developed a number of banking products<br />
for retail <strong>and</strong> corporate clients. Priority was given to solutions that directly impact either profitability of a client, product or<br />
sales channels, or customer satisfaction. Existing products offered by private <strong>and</strong> investment banking was supplemented by<br />
above-st<strong>and</strong>ard products for the mass market. <strong>The</strong> bank offers a variety of deposits, savings accounts, transaction accounts<br />
for corporate clients, personal accounts, credit card transactions, credits <strong>and</strong> other banking products <strong>and</strong> services that<br />
supplement the existing products <strong>and</strong> services of <strong>KD</strong> Banka. Within the framework of asset management <strong>and</strong> financial<br />
analyses we continued training <strong>and</strong> educational courses to obtain CFA certificate, all analysts <strong>and</strong> fund managers are<br />
involved. As high-class banking professionals are one of the prerequisites for successful operations, in 2009 we continued<br />
with strengthening professional knowledge in the area of private banking. Private <strong>and</strong> personal banking clerks attended an<br />
intense seminar on asset management of clients with above-average high net value <strong>and</strong> obtained DC Gardner Training<br />
certificate for private banking. DC Gardner Training is one of the world's leading companies involved in specialised<br />
education <strong>and</strong> training of private financial advisors. In the second half of 2009, <strong>KD</strong> Banka organised a number of training<br />
courses in banking services for financial advisors of <strong>KD</strong> Finančna točka.<br />
50
<strong>The</strong> <strong>KD</strong> <strong>Group</strong> Annual Report 2009<br />
CORPORATE SOCIAL RESPONSIBILITY OF THE GROUP <strong>KD</strong> GROUP<br />
<strong>The</strong> <strong>KD</strong> <strong>Group</strong> is an active partner that encourages, is involved <strong>and</strong> strives to improve environment in which we work <strong>and</strong><br />
live. We encourage or clients to assume responsibility for their own financial safety <strong>and</strong> independence. We create safe,<br />
pleasant <strong>and</strong> stimulating working environment for our employees <strong>and</strong> encourage mutual cooperation <strong>and</strong> interaction.<br />
Through national <strong>and</strong> local sponsorship <strong>and</strong> humanitarian projects we are actively involved in social environment as we<br />
believe that this allows us to contribute to the implementation of values in which we firmly believe.<br />
EMPLOYEES<br />
<strong>The</strong> <strong>Group</strong> is aware that our employees are our key assets <strong>and</strong> investment in the future. To this aim we invested much<br />
energy <strong>and</strong> efforts into the development, education <strong>and</strong> particularly encouragement of innovative potential of employees in<br />
all areas <strong>and</strong> at all levels of the <strong>Group</strong>. <strong>The</strong> <strong>Group</strong> <strong>KD</strong> <strong>Group</strong> stimulates <strong>and</strong> encourages employees to pursue a higher level<br />
of formal education <strong>and</strong> we made special efforts to promote the concept of internal training <strong>and</strong> included all potential internal<br />
instructors in the process of continued education on individual specialised areas as well as at the general level. In 2009, we<br />
again delighted our employees with expressions of gratitude <strong>and</strong> giving gifts at major celebrations <strong>and</strong> events, Christmas<br />
gifts for children, organisation of the “First day of School” <strong>and</strong> supported our employees' participation at a variety of cultural<br />
events <strong>and</strong> visits to concerts <strong>and</strong> events. We organised the fifth, now traditional <strong>KD</strong> Bowling Challenge, a number of<br />
teambuilding events <strong>and</strong> meetings <strong>and</strong> took part in blood drives. More detailed information regarding employees <strong>and</strong><br />
employee care is provided in the section Human Resources <strong>and</strong> Development.<br />
NATURAL ENVIRONMENT<br />
<strong>The</strong> principle activities of <strong>Group</strong> <strong>KD</strong> <strong>Group</strong> companies are not directly linked to environmental impacts. However, in our<br />
everyday activities we act responsibly by saving electricity <strong>and</strong> separating waste. We also consider the environmental aspect<br />
in our investments. Thus in 2006, <strong>KD</strong> Skladi, Ljubljana established <strong>KD</strong> Nova energija (<strong>KD</strong> New Energy), an equity mutual<br />
fund that primarily invests in companies in the renewable energy sector.<br />
SOCIAL ENVIRONMENT<br />
We are actively involved in the local community through sponsorship activities <strong>and</strong> donations, which communicate a clear<br />
link to our corporate values of trust, growth, respect, excellence <strong>and</strong> support.<br />
CULTURE AND EDUCATION<br />
<strong>The</strong> <strong>Group</strong> has cultivated long-term partnerships with cultural institutions <strong>and</strong> with individuals <strong>and</strong> has invested in a number<br />
of educational projects. In 2009, we continued our work with the RTV Slovenija Symphony Orchestra. <strong>The</strong> guiding principle<br />
of this sponsorship activity is "the harmony of cooperation". We were again involved as sponsor in the P.A.R.A.S.I.T.E.<br />
Institute competition for the OHO <strong>Group</strong> prize for the young visual artist <strong>and</strong> supported the Cerkno Jazz Festival <strong>and</strong> the<br />
Comedy Days at Celje Public <strong>The</strong>atre.<br />
<strong>KD</strong> Življenje continued its partnership with the Ljubljana Puppet <strong>The</strong>atre, which began back in 2005. On the occasion of<br />
<strong>The</strong>atre's 60 th anniversary, in cooperation with the Anna's Fund which has for a decade supported large families to improve<br />
their quality of life, families with more than six children were given free tickets to see the puppets show. In cooperation with<br />
the Zveza prijateljev mladine (Association of Friends of Youth) they provided free entry to puppets shows for large number of<br />
under-privileged children from around Slovenia to try to reduce their distress <strong>and</strong> bring a smile to their faces.<br />
In 2009, <strong>KD</strong> Življenje continued its partnership with the Ljubljana Zoo. <strong>The</strong>y supported the »Bear Day« to raise awareness of<br />
endangered wild animals in Slovenia <strong>and</strong> Europe <strong>and</strong> which was organised by all zoos, members of the European<br />
Association of Zoos <strong>and</strong> Aquaria (EAZA). In the scope of long-term cooperation, we supported the project »Arrival of<br />
Mischievous Friends to the Zoo« which provided new, larger <strong>and</strong> more modern habitat for four Saimiri Monkeys who arrived<br />
from the Gaia park in the Netherl<strong>and</strong>s. <strong>The</strong>ir arrival of the Samiri Monkeys was celebrated by a family event organised in<br />
celebration of the World Animal Day.<br />
In 2009, <strong>KD</strong> Življenje again organised a major family event at Postojna Cave called Day of Culture <strong>and</strong> Attractions. We also<br />
cooperated with Iskreni.net as co-organiser during the Festival of Families at Postojna Caves.<br />
51
<strong>The</strong> <strong>KD</strong> <strong>Group</strong> Annual Report 2009<br />
Upon its entry on the market <strong>and</strong> under the private banking trademark <strong>KD</strong> Privilege, on 16 September 2009 <strong>KD</strong> Banka<br />
organised a professional event with a foreign speaker – then current Nobel prize winner for economy - Professor Paul<br />
Krugman. <strong>The</strong> event attracted over 600 of prominent guests from economy, politics, academic life, professional public <strong>and</strong><br />
media, <strong>and</strong> received a wide response in Slovenia. As a sponsor, <strong>KD</strong> Banka participated at a charity event “Easter Yacht Ball”<br />
in hotel Kempinski in Portorož <strong>and</strong> at a charity Rotary-Lions golf tournament.<br />
Adriatic Slovenica insurance company continually recognises <strong>and</strong> responds to the needs of environment <strong>and</strong> is striving for<br />
sustainable development of local <strong>and</strong> wider social environment. In 2009, it was again actively involved in numerous activities<br />
<strong>and</strong> events organised by a variety of organisations, institutions, associations <strong>and</strong> societies, thus contributing to the<br />
implementation of initiatives <strong>and</strong> ideas. At this level the company participates on projects where, in line with the business<br />
policy, it participates as a sponsor or donator. Traditionally, the company supports projects from the field of health,<br />
education, culture, sport <strong>and</strong> traffic accident prevention. In the field of culture, education <strong>and</strong> nature preservation, Adriatic<br />
Slovenica's most important cooperation include those with Stud Farm Lipica, Auditorium Portorož, Koper <strong>The</strong>atre (who is<br />
celebrating its first centenary in 2010 <strong>and</strong> which Adriatic Slovenia has supported since its establishment), <strong>and</strong> Ljubljana<br />
Festival.<br />
Sport<br />
Our support for a variety of sporting activities is aimed at spreading the idea of the active <strong>and</strong> sociable enjoyment of free<br />
time. <strong>The</strong> <strong>Group</strong> has supported the Slovenian Chess Federation for several years in an effort to promote professional <strong>and</strong><br />
amateur chess in Slovenia. In 2009, <strong>KD</strong> <strong>Group</strong> supported the Slovenian Gymnastics Association on the occasion of the 42 nd<br />
Šalamun Memorial – World Cup in Men’s <strong>and</strong> Women’s Artistic Gymnastics, <strong>and</strong> the event organised at the 50 th anniversary<br />
of establishment of the Sorica Hunting Club.<br />
Both, <strong>Group</strong> <strong>KD</strong> <strong>Group</strong> <strong>and</strong> <strong>KD</strong> Življenje were sponsors of International bridge tournament organised by the Bridge club<br />
Tivoli. <strong>KD</strong> Življenje also sponsored Sports Club Twist Nova Gorica, Ski Association Bohinj <strong>and</strong> Sports Club Poskokec. In<br />
a<strong>dd</strong>ition to the insurance company <strong>KD</strong> Življenje, <strong>KD</strong> Finančna točka also participated as sponsor of various sports projects.<br />
Both companies sponsored <strong>KD</strong> Finančna točka Cycling Club Radenska, Marathon Franja <strong>and</strong> the Franja mini-marathon,<br />
Family marathon <strong>and</strong> many other cycling events. <strong>KD</strong> Finančna točka also sponsored Olimpija Swimming Club.<br />
In October 2009, <strong>KD</strong> Skladi participated as one of the sponsors at the 14 th Ljubljana Marathon <strong>and</strong> gave special awards to<br />
the most senior participants in the marathon <strong>and</strong> half-marathon.<br />
Adriatic Slovenica's support to sports is diverse however the majority of support has been give since 1993 to top athletes <strong>and</strong><br />
Olympic representatives, in cooperation with the Slovenian Olympic Committee. One of recipients of its support is Vasilij<br />
Žbogar, a sailor from Izola who won a gold medal at the Athens Olympic games. In 2009, Adriatic Slovenica supported the<br />
promising swimmer Matjaž Markič who won a gold medal at the European Championships. For the ninth consecutive year<br />
Adriatic Slovenia is the proud sponsor <strong>and</strong> official insurance agency of the Slovenian Football Association. A variety of<br />
sports, societies, clubs <strong>and</strong> events are sponsored by Adriatic Slovenica. Among higher profile events, we also supported the<br />
Slovenia Open women's tennis tournament.<br />
Humanitarian activities<br />
<strong>The</strong> <strong>Group</strong> <strong>KD</strong> <strong>Group</strong> supports the volunteer efforts of its employees. We therefore include them in various humanitarian<br />
activities via <strong>KD</strong> Fundacija. We also organise blood drives in which an increasing number of employees participate.<br />
In 2009, <strong>KD</strong> Skladi again, for the second time participated in the humanitarian campaign “So lahko otroci boljši od borznih<br />
gurujev? “ (Can kids be better than stock exchange gurus?), organised by the magazine Moje finance. <strong>The</strong> aim of the<br />
campaign was to help children from poorer families.<br />
<strong>The</strong> main focus at Adriatic Slovenica remains the support of healthcare. In the field of health insurance we closely cooperate<br />
with the providers of healthcare <strong>and</strong> support education <strong>and</strong> initiatives that contribute to the development <strong>and</strong> reputation of<br />
medical profession. As the principal sponsor, we again supported the national My Doctor campaign, supported the two<br />
Health centres in Piran <strong>and</strong> Koper, the Izola General hospital, <strong>and</strong> assisted in organisation of International Congress of<br />
Medical Experts. We also assisted Park Škocjanske jame in the purchase of new automated defibrillator for visitors in the<br />
event of su<strong>dd</strong>en nausea or cardiac arrest. We continued UNICEF Slovenia's Safe Points project in 2009, thus contributing to<br />
greater safety for children <strong>and</strong> adolescents in major urban areas. All the offices of Adriatic Slovenica are safe points for<br />
children <strong>and</strong> the projects has spread to 204 safe points around Slovenia. In cooperation with the Association of Friends of<br />
52
<strong>The</strong> <strong>KD</strong> <strong>Group</strong> Annual Report 2009<br />
Youth we donated funds to organise holidays for children from socially deprived families as part of the project »Wink at the<br />
Sun«.<br />
<strong>KD</strong> Fundacija<br />
<strong>The</strong> <strong>Group</strong> established the AJDA Foundation back in 1995. Its primary purpose is to fund the education of children <strong>and</strong><br />
investors in <strong>KD</strong> funds <strong>and</strong> those with above-average results <strong>and</strong> , but an under-privileged social background. Over time, the<br />
<strong>Group</strong> <strong>KD</strong> <strong>Group</strong> determined that the Foundation's original purpose had become too narrow. With the renaming of the AJDA<br />
Foundation to the <strong>KD</strong> Fundacija Foundation at the end of 2008, we exp<strong>and</strong>ed its objectives <strong>and</strong> purpose. In accordance with<br />
its purpose, in 2009 the Foundation encouraged <strong>and</strong> supported education <strong>and</strong> development of children <strong>and</strong> donated assets<br />
for humanitarian aid. As part of the exclusive musical event Volkswagner, organised on the occasion of the 15 th anniversary<br />
of its establishment, the <strong>KD</strong> <strong>Group</strong> donated some of the proceeds from each ticket sold to the <strong>KD</strong> Fundacija. With the funds<br />
collected, <strong>KD</strong> Fundacija in cooperation with the Association of Friends of Youth supported the Young <strong>and</strong> Europe project <strong>and</strong><br />
made it possible for forty senior school pupils to take part in an educational trip around Europe. <strong>The</strong> Fundacija supported<br />
participation at International Children's Games in Athens.<br />
53
<strong>The</strong> <strong>KD</strong> <strong>Group</strong> Annual Report 2009<br />
3. OPERATIONS OF <strong>KD</strong> GROUP COMPANIES<br />
BANKING AND INVESTMENT FUND MANAGEMENT<br />
Banking<br />
2009 marked the entry of the <strong>Group</strong> <strong>KD</strong> <strong>Group</strong> in the banking sector. On 2 March 2009, following a resolution of the Bank of<br />
Slovenia to grant licence to <strong>KD</strong> BPD for the performance of banking <strong>and</strong> financial services <strong>and</strong> resolution of the Securities<br />
Market Agency to grant permission to <strong>KD</strong> BPD for statutory conversion from a limited liability company into a public limited<br />
company, the company became a public limited company <strong>and</strong> assumed a new name of <strong>KD</strong> Banka. Initially, <strong>KD</strong> Banka<br />
concentrated on private, personal <strong>and</strong> investment banking services, including stockbrokerage, individual asset management<br />
<strong>and</strong> corporate finance services. However, in order to adjust to the changed economic conditions, <strong>KD</strong> Banka decided for early<br />
implementation of the basic corporate banking services, while at the same time it was developing services for the mass<br />
market, which began to be marketed through the sales network of <strong>KD</strong> Finančna točka branches in February 2010.<br />
In a<strong>dd</strong>ition to <strong>KD</strong> Banka in Slovenia, in 2009 the following companies within the banking segment operated on foreign<br />
markets: <strong>KD</strong> Securities in Bulgaria, SSIF <strong>KD</strong> Capital Management S. A. in Romania, <strong>and</strong> <strong>KD</strong> Upravljanje imovinom d. o. o.,<br />
Zagreb, in Croatia. With the aim of adapting to the market circumstances <strong>and</strong> business optimisation of the stockbrokerage<br />
segment, in 2009 we began the process of the closure of <strong>KD</strong> Securities in Bulgaria.<br />
<strong>KD</strong> Bank's main projects in 2009 included successful start-up of the banking operations, development of the bank's<br />
infrastructure <strong>and</strong> services, <strong>and</strong> implementation of the private <strong>and</strong> personal banking concepts based on a wide palette of<br />
banking <strong>and</strong> non-banking services <strong>and</strong> top quality relationship with clients, <strong>and</strong> recruitment of new clients. Initially <strong>KD</strong> Banka<br />
entered the market of wealthy clients under the <strong>KD</strong> Privilege trademark intended primarily for increasing wealth <strong>and</strong> as such<br />
is designed to meet requirements of the most dem<strong>and</strong>ing individuals. As part of positioning <strong>and</strong> consolidating the reputation<br />
of <strong>KD</strong> Banka in the field of private banking <strong>and</strong> in order to gain new clients <strong>and</strong> strengthen relationships with other<br />
professional <strong>and</strong> influential public, in September 2009 <strong>KD</strong> Banka invited the then Nobel prize winner for economy, professor<br />
Paul Krugman, one of the most admired <strong>and</strong> influential world economists to be a speaker at the professional event <strong>KD</strong><br />
Privelege. Professor Paul Krugman, professor of economy at the University of Princeton, talked about the current financial<br />
crisis, its origin, development <strong>and</strong> future measures of the financial sector <strong>and</strong> global economy. In the organisation of the<br />
event, <strong>KD</strong> Banka set up excellent cooperation with the Faculty of Economy in Ljubljana as the partner of the event <strong>and</strong> longterm<br />
relationships with other influential associations.<br />
In 2009, <strong>KD</strong> Bank focused on private <strong>and</strong> investment banking. We have developed a range of products for corporate entities<br />
inclusive of transaction accounts, deposits <strong>and</strong> a variety of credit facilities as well as online bank »Halcom«. For retail clients<br />
<strong>KD</strong> Banka developed variety o personal accounts, payment cards, savings accounts, deposit accounts with various<br />
maturities, Lombard loans <strong>and</strong> online banking. At the beginning of 2010, <strong>KD</strong> Banka entered the mass market with<br />
st<strong>and</strong>ardised products where the key sales channels include online banking <strong>and</strong> the network of <strong>KD</strong> Finančna točka branches<br />
all over Slovenia.<br />
At the end of 2009, <strong>KD</strong> Banka had over 3,200 clients, while total value of assets held by private clients <strong>and</strong> assets under<br />
individual management stood at EUR 51 million, <strong>and</strong> EUR 336 million of brokerage assets. <strong>The</strong> operations of the banking<br />
division were marked by financial crisis to which we have responded efficiently. Much attention was devoted to<br />
communications with our clients as we believe that direct communication is of vital importance as it enables development of<br />
an individual relationship between a bank clerk <strong>and</strong> the client. <strong>The</strong>refore we adjusted our communications with clients to the<br />
time that was most suitable for them. In terms of corporate communications our efforts were devoted to the positioning <strong>and</strong><br />
consolidating the recognition of the bank <strong>and</strong> its trademark <strong>KD</strong> Privilege. Improved client communications, further<br />
development of <strong>KD</strong> Banka products <strong>and</strong> services, <strong>and</strong> successful marketing of our products that allow for a number of<br />
options to increase wealth, are the vital elements for realising the set goals.<br />
54
<strong>The</strong> <strong>KD</strong> <strong>Group</strong> Annual Report 2009<br />
Challenges in 2010:<br />
In the first quarter of 2010 we intend to successfully penetrate the mass market <strong>and</strong> offer wider population comprehensive<br />
range of banking products <strong>and</strong> services through a network of <strong>KD</strong> Finančna točka branches.<br />
In 2010 we will a<strong>dd</strong> new services to our range of banking products <strong>and</strong> services such as investment consultancy services, a<br />
number of different credit facilities, savings <strong>and</strong> other financial instruments. <strong>The</strong> range of products <strong>and</strong> services will reflect<br />
the needs <strong>and</strong> wishes of our clients <strong>and</strong> will be available through a number of marketing channels.<br />
<strong>KD</strong> Banka will continue to develop a<strong>dd</strong>itional services of commercial <strong>and</strong> investment banking <strong>and</strong> will strive to meet the<br />
needs <strong>and</strong> wishes of both, individual clients <strong>and</strong> small <strong>and</strong> medium-size companies. Thus the bank will pursue its basic<br />
strategy - for <strong>KD</strong> Banka to become recognised medium-sized bank focused on private banking <strong>and</strong> the best provider of a<br />
comprehensive palette of investment banking services <strong>and</strong> asset management in Slovenia.<br />
In 2010 the development of sales channels will pursue three key goals: to enable <strong>and</strong> support introduction of new products<br />
<strong>and</strong> services through all key sales channels; ensure comprehensive overview of a client's transactions with the <strong>KD</strong> <strong>Group</strong> in<br />
one place for unification of user experience <strong>and</strong> improvement of the available functions, as well as development of new ones<br />
that are adjusted to the needs of clients.<br />
Companies within the division:<br />
Slovenia<br />
<strong>KD</strong> Banka d.d.<br />
Neubergerjeva 30, Ljubljana, Slovenia<br />
Telephone: + 386 59 22 00 00<br />
Fax: + 386 59 22 00 45<br />
E-mail:info@kdb.si<br />
Website: www.kdb.si<br />
www.kd-privilege.si (<strong>KD</strong> Privilege private banking website)<br />
Croatia<br />
<strong>KD</strong> Upravljanje imovinom d. o. o., Zagreb<br />
Radnička cesta 39, Zagreb, Croatia<br />
Telephone: + 385 1 627 44 44<br />
Fax: + 385 1 627 44 08<br />
E-mail: kdam@kd-group.hr<br />
Website: www.kd-group.hr<br />
Romania<br />
SSIF <strong>KD</strong> Capital Management S. A., Bucharest<br />
Gheorghe Manu 5, Bucharest, Romania<br />
Telephone: + 40 21 650 04 47<br />
Fax: + 40 21 650 04 48<br />
Website: www.kd-capital.ro, www.kd-group.ro<br />
E-mail: office@kd-capital.ro<br />
Bulgaria<br />
<strong>KD</strong> Securities EAD, Sofia<br />
Frityof Nansen Blvd. 9, Sofia, Bulgaria<br />
Telephone: + 359 2 810 26 95<br />
Fax: +359 2 981 01 08<br />
E-mail: kds.office@kd-group.bg<br />
Website: www.kd-group.bg<br />
55
<strong>The</strong> <strong>KD</strong> <strong>Group</strong> Annual Report 2009<br />
Investment fund management<br />
Five asset management companies operating within the <strong>Group</strong> <strong>KD</strong> <strong>Group</strong> manage a total of 27 mutual funds <strong>and</strong> two<br />
investment companies in the South Eastern European region. <strong>The</strong> leading investment management company, <strong>KD</strong> Skladi,<br />
Ljubljana, is currently the largest asset management company in Slovenia. It manages <strong>KD</strong> Krovni sklad with 17 sub funds<br />
<strong>and</strong> <strong>KD</strong> ID, delniška investicijska družba, d. d.. In a<strong>dd</strong>ition, it manages assets of well-informed investors. Currently there are<br />
four asset management companies operating outside Slovenia who jointly manage eleven investment funds: four mutual<br />
funds in Croatia, two in Romania, two mutual funds <strong>and</strong> one investment company in Bulgaria <strong>and</strong> two mutual funds in<br />
Macedonia.<br />
<strong>The</strong> core activity in this division is management of investment funds <strong>and</strong> assets of well informed investors. Our core strategy<br />
is to offer investors, primarily those from South Eastern Europe, the widest possible selection of investment opportunities,<br />
while also providing a comprehensive range of investment services in the region to investors from around the world. <strong>The</strong> goal<br />
of <strong>KD</strong> Skladi is to become within a period of five years a recognised central asset management company in Central Europe<br />
who, with top class professionals <strong>and</strong> excellent business processes manage assets of both Slovene investors <strong>and</strong> that of<br />
investors from neighbouring countries as well as money of global institutional investors. Our aim is to within five years gain a<br />
25 percent share of the Slovene market. In all other countries our goal is to establish profitable asset management<br />
companies with increasing market shares.<br />
By the mid 2009 conditions on the capital markets were slowly stabilizing <strong>and</strong> from March onwards we have seen increase in<br />
share prices indices which improved the general level of optimism of investors. Funds within the <strong>KD</strong> <strong>Group</strong> performed well in<br />
terms of their return (majority recorded positive returns) <strong>and</strong> in terms of investors. In terms of return, they successfully<br />
competed with local <strong>and</strong> foreign competition with some of them being the leaders in individual categories. <strong>The</strong> increased<br />
trend in the number of accession forms continued <strong>and</strong> funds recorded positive inflows. At the end of 2009 total value of<br />
managed assets of all asset management companies in the <strong>Group</strong> <strong>KD</strong> <strong>Group</strong> reached EUR 449.1 million, compared to EUR<br />
360.6 million recorded at the end of 2008.<br />
Changed business conditions on the market as a result of financial <strong>and</strong> economic crisis required from companies in the<br />
segment of Investment fund management to continue with the process of business rationalisation <strong>and</strong> optimisation, while at<br />
the same time focusing on the core activity of fund management <strong>and</strong> looking for synergies within the <strong>Group</strong> to improve<br />
quality of services <strong>and</strong> achieve professionalism <strong>and</strong> excellence in all business areas including corporate governance <strong>and</strong><br />
responsibility of supervisory bodies. Asset management companies in the <strong>Group</strong> took advantage of the increased prices in<br />
capital markets to intensify sales efforts <strong>and</strong> market new savings plans <strong>and</strong> regain investors' trust.<br />
Main activities <strong>and</strong> achievements in 2009:<br />
- <strong>KD</strong> Skladi retained the leading position among Slovene asset management companies in terms of the volume of assets<br />
under management <strong>and</strong> selection of funds <strong>and</strong> at the end of 2009 it managed over EUR 421 million of assets in 17 sub<br />
funds of the <strong>KD</strong> Krovni sklad <strong>and</strong> <strong>KD</strong> ID, delniška investicijska družba, d. d.<br />
- <strong>KD</strong> Skladi was among the first in Slovenia to transform all of its 17 mutual funds into sub funds of <strong>KD</strong> Krovni sklad,<br />
making transfer between individual sub funds more beneficial for investors (in terms of tax).<br />
- <strong>The</strong> <strong>Group</strong> <strong>KD</strong> <strong>Group</strong> funds were among the most successful Slovene <strong>and</strong> foreign funds in their categories.<br />
- <strong>KD</strong> BRIK equity fund was the most profitable fund in Macedonia.<br />
- For the second consecutive year <strong>KD</strong> Skladi were awarded Trusted Br<strong>and</strong> prize by the Reader's Digest readers as the<br />
trademark that is most trusted by Slovene consumers.<br />
- In cooperation with Concorde Premoženjsko svetovanje, <strong>KD</strong> Skladi began marketing new savings plan VIP plus 100<br />
<strong>and</strong> VIP 100 Premium.<br />
- At the fifth, now traditional awards ceremony for the best mutual funds managers, <strong>KD</strong> MM monetary fund received "Zlati<br />
V" (Golden V) in the category of one-year monetary funds.<br />
- <strong>KD</strong> Skladi introduced new modern service, web-based office <strong>KD</strong> Skladi.net, where investors can freely <strong>and</strong> safely check<br />
their balances in the selected funds.<br />
- <strong>KD</strong> Skladi introduced the option of monthly payments for its investors (natural persons) through direct debit facilities.<br />
- Asset management companies devoted much attention to communications with investors <strong>and</strong> organisation of seminars.<br />
<strong>KD</strong> Skladi, Ljubljana, <strong>and</strong> <strong>KD</strong> Investments, Zagreb, redesigned their websites; <strong>KD</strong> Skladi were first to introduce in<br />
Slovenia video commentary; jointly with <strong>KD</strong> Življenje, <strong>KD</strong> Skladi began publishing a magazine for investors ”Kdaj in<br />
kako” (When <strong>and</strong> How).<br />
- For more efficient operations, Slovak asset management companies <strong>KD</strong> Investments, Bratislava <strong>and</strong> laD Investments<br />
merged <strong>and</strong> transferred mutual funds to <strong>KD</strong> Prosperita <strong>and</strong> <strong>KD</strong> Russia, who were until then managed by <strong>KD</strong><br />
Investments, Bratislava, to the successor company laD Investments.<br />
- To optimise operations of <strong>KD</strong> <strong>Group</strong> as the only partner in <strong>KD</strong> Investments, Beograd, <strong>and</strong> to adapt the <strong>KD</strong> <strong>Group</strong><br />
operations to market conditions, Serbian fund <strong>KD</strong> Ekskluziv was transferred to the asset management company Citadel<br />
Asset Management, Društvo za upravljanje investicionim fondovima.<br />
56
<strong>The</strong> <strong>KD</strong> <strong>Group</strong> Annual Report 2009<br />
Challenges in 2010:<br />
• We will continue to confirm excellence in management to justify investors' trust.<br />
• We shall intensify our efforts for improved recognition of <strong>KD</strong> funds in order to retain the leading position in Slovenia<br />
<strong>and</strong> consolidate market shares in South Eastern Europe.<br />
• We will continue to improve our portfolio of products in line with the current industry trends <strong>and</strong> market needs, while<br />
preserving the main drivers of innovation <strong>and</strong> focussing on the investor. Most of all, we will market existing<br />
products in even more attractive packages.<br />
• In realisation of increased recognition <strong>and</strong> development of new products <strong>and</strong> services with the existing companies<br />
in the <strong>Group</strong>, we will endeavour to utilise the newly established <strong>KD</strong> Banka as a<strong>dd</strong>itional sales channel thus utilising<br />
product <strong>and</strong> sales synergies.<br />
• We shall develop friendlier <strong>and</strong> simpler transactions for investors by using Internet to access funds <strong>and</strong> online<br />
services.<br />
• By registration of Slovene funds for local sale <strong>and</strong> in accordance with the legislation, we will exp<strong>and</strong> the range of<br />
funds available in Romania <strong>and</strong> Bulgaria where we are already present.<br />
• In accordance with new regulatory guidelines <strong>and</strong> possibilities of adapting the operations of asset management<br />
companies, investment funds <strong>and</strong> relationships with clients, we shall continue to strive to achieve the highest<br />
possible satisfaction of existing <strong>and</strong> future investors.<br />
• By 2011, <strong>KD</strong> Skladi will transform <strong>KD</strong> ID, delniška investicijska družba, d. d., into a mutual fund.<br />
Data concerning investment funds of the <strong>Group</strong> <strong>KD</strong> <strong>Group</strong> as at 31 December 2009<br />
Geographical /<br />
segmental orientation<br />
Unit price<br />
(in EUR)<br />
Net value of<br />
the fund (in<br />
EUR)<br />
Number of units<br />
in circulation<br />
Number of<br />
investors<br />
Fund<br />
Type of fund<br />
Slovenia<br />
Flexible asset<br />
<strong>KD</strong> Galileo<br />
structure Europe 8.81 150,009,865 17,031,696.8525 28,931<br />
<strong>KD</strong> Rastko Equity Europe 20.25 65,892,677 3,253,889.7709 16,243<br />
<strong>KD</strong> Bond Bond Europe 13.15 9,732,800 740,245.6894 3,377<br />
Fund of equity<br />
<strong>KD</strong> Prvi izbor<br />
funds Global 4.89 27,412,226 5,604,736.3695 4,105<br />
Money market<br />
<strong>KD</strong> MM<br />
fund Global 49.49 12,566,957 253,944.8251 1,315<br />
<strong>KD</strong> Balkan Equity South Eastern Europe 2.60 24,090,779 9,266,134.5347 8,236<br />
<strong>KD</strong> Novi trgi Equity Emerging markets 4.90 23,340,083 4,767,896.3165 4,518<br />
<strong>KD</strong> Severna Amerika Equity North America 3.11 795,390 255,904.4944 216<br />
<strong>KD</strong> Surovine in<br />
energija Equity Raw materials, energy 4.15 4,910,865 1,183,497.5666 1,447<br />
<strong>KD</strong> Tehnologija Equity Technology 4.50 1,603,774 356,566.9320 455<br />
<strong>KD</strong> Nova energija Equity<br />
Renewable sources of<br />
energy 0.81 11,719,368 14,450,885.7290 3,397<br />
<strong>KD</strong> Vitalnost<br />
Equity<br />
Healthcare consumer<br />
goods, etc. 0.96 869,143 901,815.9833 392<br />
<strong>KD</strong> Indija-Kitajska Equity India <strong>and</strong> China 1.30 13,332,283 10,225,863.0084 1,264<br />
<strong>KD</strong> EM Infrastruktura<br />
in gradbeništvo Equity<br />
Infrastructure-related<br />
activities 1.13 425,592 375,996.9139 190<br />
<strong>KD</strong> Finance Equity Finance 0.79 656,408 826,358.7687 185<br />
<strong>KD</strong> Latinska Amerika Equity Latin America 1.38 6,719,799 4,871,549.5889 546<br />
<strong>KD</strong> Vzhodna Evropa Equity Eastern Europe 1.14 1,644,889 1,443,321.2576 421<br />
Share<br />
<strong>KD</strong> ID (<strong>KD</strong>IR)<br />
Geographical /<br />
segmental orientation<br />
Share<br />
market<br />
price (in<br />
EUR)<br />
Net value of<br />
the fund (in<br />
EUR)<br />
Number of<br />
investors<br />
Name<br />
Number of shares<br />
<strong>KD</strong> ID, delniška<br />
investicijska<br />
družba, d. d. Europe 5.30 66,050,676.74 9,181,542 33,799<br />
Euro<br />
exchange<br />
rate<br />
31. 12. 2008<br />
Euro<br />
exchange<br />
rate<br />
31. 12. 2008<br />
57
<strong>The</strong> <strong>KD</strong> <strong>Group</strong> Annual Report 2009<br />
Croatia<br />
Share<br />
<strong>KD</strong> Victoria<br />
<strong>KD</strong> Prvi izbor<br />
<strong>KD</strong> Balanced<br />
<strong>KD</strong> Nova Europa<br />
Romania<br />
<strong>KD</strong> Maximus<br />
<strong>KD</strong> Optimus<br />
Bulgaria<br />
<strong>KD</strong> Equity Bulgaria<br />
<strong>KD</strong> Bond Bulgaria<br />
Share<br />
<strong>KD</strong> Pelikan<br />
Fund<br />
Macedonia<br />
<strong>KD</strong> BRIK<br />
Name<br />
Geographical /<br />
segmental orientation<br />
Share<br />
market<br />
price (in<br />
EUR)<br />
Net value of<br />
the fund (in<br />
EUR)<br />
Number of shares<br />
Number of<br />
investors<br />
Equity Europe 2.0848 9,182,451,46 4,404,400.0591 3,399<br />
Fund of funds Europe 1.5764 675,797.33 428,683.6965 26<br />
Flexible asset<br />
structure Europe 1.1296 1,763,679.45 1,561,323.2471 305<br />
Equity Europe 0.8634 2,572,631.79 2,979,560.1522 1,010<br />
Equity Romania 2.9321 9,117,818 3,109,692.31 849<br />
Balanced Romania 2.1390 220,237 102,961.15 17<br />
Equity<br />
Debt<br />
Name<br />
<strong>KD</strong> Pelikan<br />
Type of fund<br />
Central <strong>and</strong> Eastern<br />
Europe 0.38 993,660.34 2,645,484.3191 359<br />
Central <strong>and</strong> Eastern<br />
Europe 64.40 393,645.72 6,112.5259 17<br />
Geographical / segmental Share market Net value of the<br />
Number of<br />
orientation<br />
price (in EUR) fund (in EUR) Number of shares investors<br />
Central <strong>and</strong> Eastern<br />
Europe 7.62 2,204,266.15 289,349.0000 175<br />
Geographical / segmental<br />
orientation<br />
Unit price (in<br />
EUR)<br />
Net value of the<br />
fund (in EUR)<br />
Number of units in<br />
circulation<br />
Number<br />
investors<br />
Equity Global 2.2931 201,174.65 87,729.1838 400<br />
<strong>KD</strong> Južen Balkan Equity Balkans 2.1893 79,328.18 36,233.5095 181<br />
of<br />
Euro<br />
exchange<br />
rate<br />
31. 12. 2008<br />
1 EUR =<br />
7.31 HRK<br />
1 EUR =<br />
7.31 HRK<br />
1 EUR =<br />
7.31 HRK<br />
1 EUR =<br />
7.31 HRK<br />
1 EUR =<br />
4.23 RON<br />
1 EUR =<br />
4.23 RON<br />
1 EUR =<br />
1.96 BGN<br />
1 EUR =<br />
1.96 BGN<br />
Euro<br />
exchange<br />
rate<br />
31. 12. 2008<br />
1 EUR =<br />
1.96 BGN<br />
Euro<br />
exchange<br />
rate<br />
31. 12. 2008<br />
1 EUR =<br />
61.17 M<strong>KD</strong><br />
1 EUR =<br />
61.17 M<strong>KD</strong><br />
Companies in the division:<br />
Slovenia<br />
<strong>KD</strong> Skladi, družba za upravljanje, d. o. o.<br />
Celovška cesta 206, Ljubljana, Slovenia<br />
Telephone: + 386 1 582 67 80<br />
Fax: + 386 1 518 40 88<br />
E-mail: kd-skladi@kd-group.si<br />
Website: www.kd-skladi.si<br />
Management Board (31 December 2009):<br />
Peter Groznik, PhD, President of the Management Board<br />
Roman Androjna, Member of the Management Board<br />
Louise Chatwood, MBA, Member of the Management Board<br />
Croatia<br />
<strong>KD</strong> Investments, društvo za upravljanje investicijskim fondovima, d. o. o., Zagreb<br />
Radnička cesta 39, Zagreb, Croatia<br />
(25 January 2010)<br />
Miramarska 105, Zagreb, Croatia<br />
Telephone: + 385 1 627 45 55<br />
Fax: + 385 1 627 45 10<br />
E-mail: info@kd-group.hr<br />
Website: www.kd-group.hr<br />
Management Board (31 December 2009):<br />
Matej Tomažin, President of the Management Board<br />
Branko Gladović, Member of the Management Board<br />
58
<strong>The</strong> <strong>KD</strong> <strong>Group</strong> Annual Report 2009<br />
Romania<br />
SAI <strong>KD</strong> Investments S. A., Bucharest<br />
Calea Giulesti 8D, 3rd floor, Bucharest, Romania<br />
Telephone: + 402 1 650 04 44<br />
Fax: + 402 1 650 04 42<br />
E-mail: info@kd-group.ro<br />
Website: www.kd-group.ro<br />
Management Board (31 December 2009):<br />
Gerrit Alberts, President of the Management Board<br />
Peter Groznik, PhD, Member of the Management Board<br />
Katja Kraškovic, MSc., Member of the Management Board<br />
Bulgaria<br />
<strong>KD</strong> Investments EAD, Sofia<br />
58 Bolgarija Blvd., fl. 7, offise 24, Sofia, Bulgaria<br />
Telephone: + 359 2 810 26 51<br />
Fax: + 359 2 981 21 65<br />
E-mail: info@kd-group.bg<br />
Website: www.kd-group.bg<br />
Management Board (31 December 2009):<br />
Georgi Biserinski, President of the Management Board<br />
Nelly Petrova, Member of the Management Board<br />
Luka Flere, MSc., Member of the Management Board<br />
Louise Chatwood, MBA, Member of the Management Board<br />
Katja Kraškovic, MSc., Member of the Management Board<br />
Macedonia<br />
<strong>KD</strong> Fondovi A. D. Skopje<br />
Ul. Vodnjanska nr. 7/1, Skopje, Macedonia<br />
Telephone: + 389 2 3105 930<br />
Fax: + 389 2 3105 939<br />
E-mail: kdfondovi@kd-group.com<br />
Website: www.kd-fondovi.mk<br />
Management Board (31 December 2009):<br />
Peter Groznik, PhD, President of the Management Board<br />
Laze Kamčev, Member of the Management Board<br />
Marijan Nikolovski, Member of the Management Board<br />
Grega Meden, Member of the Management Board<br />
Žiga Hieng, MSc., Member of the Management Board<br />
59
<strong>The</strong> <strong>KD</strong> <strong>Group</strong> Annual Report 2009<br />
INSURANCE<br />
<strong>The</strong> insurance-related activities of the <strong>Group</strong> <strong>KD</strong> <strong>Group</strong> include life <strong>and</strong> property insurance (including health insurance. Two<br />
life insurance companies operate in Slovenia: <strong>KD</strong> Življenje, a life insurer, <strong>and</strong> Adriatic Slovenica, a universal insurer that<br />
markets life insurance <strong>and</strong> property insurance, including health insurance. In accordance with the <strong>Group</strong>'s strategy of<br />
expansion to foreign markets, in 2009 insurance companies within the <strong>Group</strong> operated in the following foreign markets:<br />
Ukraine, Croatia, Romania, Bulgaria <strong>and</strong> Slovakia through subsidiaries. Property insurance is marketed by property<br />
insurance company AS neživotno osiguranje a.d.o. Beograd in Serbia.<br />
Features of the Slovenian insurance market in 2009<br />
In the history of business, 2009 was marked by the biggest global economic crisis which affected also the field of insurance.<br />
This is evident in a moderate growth of property insurance premium <strong>and</strong> negative growth of gross life insurance premium.<br />
Experts assume that the latter is a consequence of a lower interest among the population to invest free assets in investments<br />
funds which have accelerated the growth of life insurances in the past years. At the same time the market is becoming more<br />
<strong>and</strong> more competitive since foreign insurance companies are entering the market of the already fierce domestic competition.<br />
By the end of December 2009, there were 23 insurance entities engaged in the insurance activities <strong>and</strong> based in the<br />
Republic of Slovenia. Among them, 11 insurance companies sell life insurances, 2 reinsurance companies <strong>and</strong> 3 affiliates of<br />
foreign insurance companies. <strong>The</strong> competitiveness in the insurance sector has become stronger in all segments, especially<br />
in the field of life <strong>and</strong> health insurance.<br />
In terms of the insurance market development, Slovenia ranks among semi-developed countries. Regarding the share of the<br />
total life insurance premium in the gross domestic product in 2008, Slovenia reached the seventeenth place among the EU<br />
countries, according to the latest available data. It was thus placed before the Czech Republic, Luxembourg, Slovakia,<br />
Bulgaria, Estonia, Latvia, Lithuania, Greece <strong>and</strong> Romania. Regarding the height of the premium income per capita it holds<br />
the eighteenth place.<br />
Unlike the comparable EU countries, Slovenia still reaches a significantly lower share of life insurances in the total insurance<br />
premium. <strong>The</strong> share has been constantly growing. From 2000 to 2009 it increased by 11 percentage points, from 19.4<br />
percent to 30.4 percent (including pension insurance). <strong>The</strong> reasons for such a low share of life insurance are considerable<br />
share of social insurances, insufficient knowledge about life insurance products <strong>and</strong> lack of awareness of the importance of<br />
such insurances.<br />
In comparison to 2008, the extent of transactions in property insurance companies grew on the average by 5 percent. In<br />
2009, property insurance companies (not considering the Pension Fund Management <strong>and</strong> the Fund for Craftsmen <strong>and</strong><br />
Entrepreneurs) gained EUR 1,445.2 million with property insurance premiums. While a 3.8 percent decrease has been noted<br />
on the life insurance market during the period under review, the ordinary insurance companies (excluding the Pension Fund<br />
Management <strong>and</strong> the Fund for Craftsmen <strong>and</strong> Entrepreneurs) gained EUR 486.8 million of life insurance premiums.<br />
Insurance at the <strong>Group</strong> <strong>KD</strong> <strong>Group</strong><br />
<strong>The</strong> <strong>Group</strong> <strong>KD</strong> <strong>Group</strong>'s key strategic orientations in the insurance division are based primarily on growth in domestic <strong>and</strong><br />
foreign operations <strong>and</strong> the provision of a comprehensive range of financial services through various sales networks.<br />
Thus the <strong>Group</strong> consolidated <strong>and</strong> strengthened existing sales channels in Slovenia.<br />
In 2009, <strong>Group</strong> <strong>KD</strong> <strong>Group</strong> insurance companies comprehensively exp<strong>and</strong>ed <strong>and</strong> enriched their portfolios <strong>and</strong> developed<br />
new, specialised products for individual target groups. In Slovenia, <strong>KD</strong> Življenje continued in its role as the leader in new<br />
product development <strong>and</strong> developed two new products in 2009: Fondpolica Maks Garant Plus, Fondpolica Maks Garant with<br />
a<strong>dd</strong>itional safety features that allow for fast <strong>and</strong> high return in spite of fluctuating financial markets <strong>and</strong> Whole life insurance –<br />
life insurance for the event of death with a constant <strong>and</strong> downward insurance premium <strong>and</strong> defined insurance term. <strong>The</strong><br />
insurance company improved life insurance policies Fondpolica <strong>and</strong> <strong>KD</strong> Družina <strong>and</strong> <strong>KD</strong> Pokojnine by inclusion of the<br />
Zajamčeni paket (Guaranteed package) a new investment package which makes these insurance products even more<br />
adaptable. With the introduction of the Active investment package the insurance company has upgraded the best selling of<br />
its all investment packages in the Fondpolica investment-linked life insurance packages namely, Dynamic investment<br />
package.<br />
In the field of property insurance Adriatic Slovenica once again developed a range of new products in 2009. It offered Dom<br />
AS, a new, comprehensive immovable <strong>and</strong> movable property insurance enabling the insurance holders to insure their entire<br />
property (their house, apartment <strong>and</strong> its equipment, agricultural machines, pets <strong>and</strong> many more subject matters) with one<br />
policy. In the field of car insurance they exp<strong>and</strong>ed their quality offer <strong>and</strong> launched a new package of car insurance offering<br />
special advantages to the insurance holders upon taking out the car liability insurance (AO) <strong>and</strong> car liability insurance plus<br />
(AO plus) package. <strong>The</strong>y were the first in Slovenia to introduce something completely new for young drivers - the insurance<br />
60
<strong>The</strong> <strong>KD</strong> <strong>Group</strong> Annual Report 2009<br />
policy called “My first car policy” intended for the young with less than three years of driving experience. This policy<br />
substitutes a 25 percent a<strong>dd</strong>itional payment in the car liability insurance for a car driven by a less experienced driver. In<br />
a<strong>dd</strong>ition, the insurance covers a driver <strong>and</strong> not an individual vehicle. Those who chose the car liability insurance package in<br />
June were offered also the possibility of redemption of the first loss which prevents them from losing points on a rating scale<br />
after the first loss event. <strong>The</strong> company actively began to market unique credit insurances in case of accidental death,<br />
permanent disability <strong>and</strong> unemployment due to non-fault-based grounds. It introduced an exclusive offer of liability insurance<br />
for the members of the Slovenian Directors’ Association performing management or supervisory functions, with which one<br />
can insure personal liability for damages for the performance of the function of a member of management <strong>and</strong> supervisory<br />
boards. In a<strong>dd</strong>ition, Adriatic Slovenica broadened its offer of accident insurance for school children. In September they<br />
offered a possibility of long-term accident insurance policies for preschool children <strong>and</strong> primary <strong>and</strong> secondary school<br />
students. This offered fixed premiums <strong>and</strong> insurance sums during the entire educational process, health insurance with<br />
assistance CORIS during every summer holiday <strong>and</strong> numerous other advantages <strong>and</strong> benefits. Adriatic Slovenica also<br />
remained the leading Slovenian insurance company offering above st<strong>and</strong>ard health insurances in 2009. In June it launched a<br />
renewed above st<strong>and</strong>ard health insurance for the above st<strong>and</strong>ard services in specialist outpatient clinics, offering exp<strong>and</strong>ed<br />
existing coverage <strong>and</strong> also medical procedures which are part of a one day treatment, endoscopic <strong>and</strong> cell <strong>and</strong> tissue tests.<br />
We have exp<strong>and</strong>ed our offer abroad as well. At the beginning of 2009 we introduced a new type of life insurance called<br />
Debut in Ukraine <strong>and</strong> in the mi<strong>dd</strong>le of the year we presented a new type of accidental death insurance in Bulgaria. On other<br />
markets we continued to sell life insurances which we had offered on the market already in the previous years. <strong>The</strong> Serbian<br />
AS neživotno osiguranje a.d.o. Beograd markets besides property insurance also accident <strong>and</strong> voluntary health insurances<br />
(in packages together with car insurances) <strong>and</strong> assistance insurances through Coris. AS neživotno osiguranje a.d.o. Beograd<br />
started operating in September 2008. In 2009 it was already well established on the Serbian insurance market.. By the end<br />
of 2009 the company held a 3.5 percent market share in the field of third party car insurance.<br />
In 2009, the <strong>Group</strong> <strong>KD</strong> <strong>Group</strong> achieved a 17.0 percent share of the Slovenian insurance market, with total premiums<br />
collected of EUR 329.3 million (AS 260.6 + <strong>KD</strong>Ž 68.7).<br />
On foreign markets, the <strong>Group</strong> <strong>KD</strong> <strong>Group</strong> collected total life insurance premiums of EUR 6.8 million <strong>and</strong> total property<br />
insurance premiums of EUR 5.1 million EUR (restated at the effective mean rate of the National Bank of Serbia as at 31<br />
December 2009).<br />
Life insurance company <strong>KD</strong> Življenje is the second largest life insurance providers in Slovenia <strong>and</strong> in spite of unstable<br />
economic conditions, at the end of 2009 it increased its market share to 14.1 percent. Slovenian life insurance market was in<br />
2009 marked primarily by the financial crisis reflected in an average 3.8 percent decline which was preceded by several<br />
years of continuous growth in the number of life insurances.<br />
Life insurance companies experienced a large number of cancellations or withdrawals from insurances in comparison to the<br />
previous years. <strong>The</strong>refore in the future life insurance offers shall include current life insurances covering the risk of death, or<br />
st<strong>and</strong>ard life insurances under which the insured person receives the agreed sum after a set period of time. <strong>The</strong> investment<br />
insurances will include interesting products with a guarantee, <strong>and</strong> in not so distant future, also annuity insurances. Regarding<br />
the situation on the financial markets we expect a moderate increase in the number of life insurances in the medium term.<br />
12.56 percent market share of Adriatic Slovenica in 2009 makes it the third largest insurance company in Slovenia. In terms<br />
of property insurance, the insurance company held a 17.01 percent share, in terms of health insurance its share in 2009 of<br />
23.9 percent places the company in the second place on the health insurance market, while it holds the leading position on<br />
the market of above-st<strong>and</strong>ard health insurance. Due to its consolidated market network <strong>and</strong> modern insurance products<br />
supplemented by first-class assistance services, the insurance company has set even more ambitious goals for the next<br />
financial year. Regarding the situation on the Slovenian market, the offer <strong>and</strong> the possibility to take out the widest range of<br />
insurances (property, health, life <strong>and</strong> pension insurances) bring an a<strong>dd</strong>itional advantage on the market. In times of limited<br />
access to other financial sources, comprehensive <strong>and</strong> quality insurance <strong>and</strong> financial services give our insurance holders a<br />
bigger financial <strong>and</strong> personal security.<br />
In Slovenia, the largest share of sales of <strong>KD</strong> Življenje life insurance was achieved through <strong>KD</strong> Finančna točka, which last<br />
year had 14 regional branches, while the mobile network employs more than 250 active contractual partners <strong>and</strong> employed<br />
marketing professionals. In terms of their number, contractual agencies of the insurance company took the second place<br />
after the marketers, followed by our own network of representatives <strong>KD</strong> Življenje.<br />
Adriatic Slovenica is increasing property insurance sales through an extensive marketing network <strong>and</strong>, at the end of the last<br />
year, provided insurance services at nine business units in all of Slovenia’s main regional centres, three branches, 46<br />
representative offices <strong>and</strong> in the contracted marketing network of insurance agents with 96 underwriting locations <strong>and</strong> 114<br />
points of sale via complementary sales channels, for a total of 268 sales outlets. <strong>The</strong> marketing network was equipped with<br />
61
<strong>The</strong> <strong>KD</strong> <strong>Group</strong> Annual Report 2009<br />
a<strong>dd</strong>itional points of sales <strong>and</strong> improved after-sales services developed to improve market coverage. <strong>The</strong> insurance company<br />
also developed complementary market channels.<br />
In foreign countries life insurances were marketed through the network of our own representatives, <strong>KD</strong> Finančna točka <strong>and</strong><br />
EU Life sales channels, contractual agencies <strong>and</strong> representative insurance agencies. <strong>The</strong> marketing of property insurance<br />
was carried out through the subsidiary company AS neživotno osiguranje a.d.o. Beograd <strong>and</strong> through its operating units <strong>and</strong><br />
offices <strong>and</strong> points of contract conclusions. In 2009 the marketing network exp<strong>and</strong>ed. In a<strong>dd</strong>ition to the business units in<br />
Belgrade, Novi Sad <strong>and</strong> Čačak which was transferred to a new location because of the increased scope of business<br />
transactions, a new business unit was opened in Niš. Two new offices started to operate in June in Kruševac <strong>and</strong> Šabac.<br />
Challenges in 2010<br />
- To generate over EUR 84 million of life insurance premiums, over EUR 256 million of property insurance premiums<br />
(including health insurance premiums) which translates to 3.6 percent increase in property insurance <strong>and</strong> 5 percent<br />
increase in health insurance.<br />
- To increase returns on investments <strong>and</strong> boost short <strong>and</strong> long-term liquidity.<br />
- To follow the strategy of stabilisation <strong>and</strong> costs efficiency with the aim of reaching the level of profitability required by the<br />
owner.<br />
- To grow <strong>and</strong> consolidate the market positions of <strong>Group</strong> <strong>KD</strong> <strong>Group</strong> insurance companies <strong>and</strong> maintain the leading role in<br />
the development of new insurance products.<br />
- To upgrade existing insurance products, particularly through the development of cross-sales of insurance, thus offering<br />
policyholders a<strong>dd</strong>itional services; to develop insurance products adapted to the needs of the market <strong>and</strong> individual<br />
customers; to develop innovative life insurance products; to update existing property insurance products, in particular by<br />
developing new st<strong>and</strong>ardised <strong>and</strong> supplementary insurance packages; to develop a<strong>dd</strong>itional <strong>and</strong> enhanced assistance<br />
services <strong>and</strong>, to develop new after-sales activities.<br />
- To develop <strong>and</strong> upgrade the existing sales network.<br />
- To exploit the synergy effects of the various sales channels of both insurance companies; To maintain <strong>KD</strong> Finančna<br />
točka as the primary sales channel for <strong>KD</strong> Življenje; To maintain <strong>and</strong> develop existing sales channels at Adriatic<br />
Slovenica, to strengthen the company's own network of agents <strong>and</strong> to continue developing sales of insurance via<br />
complementary sales channels, including an Internet-based sales channel<br />
- To ensure the growth of operations at <strong>KD</strong> Življenje <strong>and</strong> Adriatic Slovenica outpaces growth on the domestic <strong>and</strong> foreign<br />
markets.<br />
Insurance companies<br />
Slovenia<br />
Adriatic Slovenica, Zavarovalna družba, d. d., Koper<br />
Ljubljanska cesta 3a, Koper, Slovenia<br />
Telephone: + 386 5 664 31 00<br />
Fax: + 386 5 664 31 09<br />
E-mail: info@adriatic-slovenica.si<br />
Website: www.adriatic-slovenica.si<br />
Management Board (31 December 2009):<br />
Gabrijel Škof, President of the Management Board<br />
Matej Cergolj, Member of the Management Board<br />
Marko Rems, Member of the Management Board<br />
Management Board (1 October 2009): Gabrijel Škof, President of the Management Board<br />
Milena Georgievski, Deputy President of the Management Board**<br />
Matej Cergolj, Member of the Management Board<br />
Marko Rems, Member of the Management Board<br />
* On 28 February 2009, Marko Rems’ tenure as member of the Management Board came to an end<br />
** As from 1 October 2009, the m<strong>and</strong>ate of Milena Georgievska, Deputy President of the Management Board expired <strong>and</strong><br />
she retired.<br />
<strong>KD</strong> Življenje, zavarovalnica, d. d., Ljubljana<br />
Celovška cesta 206, Ljubljana, Slovenija<br />
Telephone: +386 1 58 26 550<br />
Fax: +386 1 518 18 95<br />
E-mail: info@kd-zivljenje.si<br />
Website: www.kd-zivljenje.si<br />
62
<strong>The</strong> <strong>KD</strong> <strong>Group</strong> Annual Report 2009<br />
Management Board (31 December 2009):<br />
Matija Šenk, President of the Management Board<br />
Mateja Keržič, Member of the Management Board<br />
Ingrid Kuk, MSc., Member of the Management Board<br />
Croatia<br />
<strong>KD</strong> životno osiguranje d. d., Zagreb<br />
Radnička cesta 39, Zagreb, Croatia<br />
Telephone: + 385 1 6285 101<br />
Fax: + 385 1 6197 456<br />
E-mail: info@kd-life.hr<br />
Website: www.kd-life.hr<br />
Management Board (31 December 2009):<br />
Neven Tišma, President of the Management Board<br />
Andreja Radič, Member of the Management Board<br />
Slovakia<br />
Branch<br />
<strong>KD</strong> Life, Insurance Company, plc, Ljubljana<br />
Astrova 2/A, Bratislava, Slovakia<br />
Telephone: +421907948244<br />
E-mail: info@kd-life.sk<br />
Website: www.kd-life.sk<br />
Management (31 December 2009): Gregor Šušmelj, Branch Director<br />
Czech Republic<br />
Cross-border operations<br />
E-mail: pojistovna@kd-life.cz<br />
Website: www.kd-life.cz<br />
Romania<br />
<strong>KD</strong> Life Asigurari S.A.<br />
8D Calea Giulesti 3rd floor, Bucharest, Romania<br />
Telephone: +40 21 650 55 06<br />
Fax: +40 21 650 55 04<br />
E-mail: office@kd-life.ro<br />
Website: www.kd-group.ro<br />
Management Board (31 December 2009): Matija Šenk, President of the Management Board until 12 December 2009<br />
Ian Harrocks, CEO<br />
Zefir Castris, Member of the Management Board<br />
Bulgaria<br />
<strong>KD</strong> ZHIVOT AD<br />
Al. Dondukov blvd. 79-81, 4th floor, Sofia, Bolgarija<br />
Telephone: +357 2 933 79 11<br />
Fax: +357 2 933 79 19<br />
E-mail: office@kd-life.bg<br />
Website: www.kd-life.bg<br />
Management Board (31 December 2009):<br />
Matija Senk, President of the Management Board<br />
Radovan Pusnar, Member of the Management Board<br />
Ivan Janakiev, Member of the Management Board<br />
63
<strong>The</strong> <strong>KD</strong> <strong>Group</strong> Annual Report 2009<br />
Ukraine<br />
<strong>KD</strong> Life CJSC<br />
Lineynaya str., 17 Building A, Kiev, Ukraine<br />
Telephone: +380 44 499 5999<br />
Fax: +380 44 499 5990<br />
E-mail: office@kd-life.com.ua<br />
Website: www.kd-life.com.ua<br />
Management Board (31 December 2009):<br />
Vitaly Kovalenko, President of the Management Board<br />
Alyona Stepanova, Member of the Management Board<br />
Neda Thaler, Member of the Management Board<br />
Serbia<br />
AS neživotno osiguranje a.d.o. Beograd<br />
Bulevar Mihajla Pupina 165E, 11070 Novi Beograd, Serbia<br />
Telephone: +381 11 260 8676<br />
Fax: +381 11 260 8684<br />
E-mail: info@as-osiguranje.rs<br />
Board of Directors (31 December 2009):<br />
Prof. Jova Miloradić, PhD, General Manager <strong>and</strong> President of the Board of Directors<br />
Grah, Procurator<br />
Gabrijel Škof, President of the Assembly<br />
Metod<br />
Board of Directors (until 7 August 2009):<br />
Metod Grah, General Manager<br />
Prof. Jova Miloradić, PhD, Deputy General Manager<br />
Gabrijel Škof, President of the Assembly<br />
Metod Grah, President of the Board of Directors<br />
Selling activities of the <strong>Group</strong> <strong>KD</strong> <strong>Group</strong><br />
During the global crises it is crucial to take care of the buyer, therefore the sale is our most important activity. By reorganising<br />
the <strong>Group</strong> <strong>KD</strong> <strong>Group</strong> we raised the sale to a strategic level where <strong>KD</strong> Finančna točka plays the key role. Namely, it is the<br />
<strong>Group</strong>’s main selling channel <strong>and</strong> at the same time the only channel which joins <strong>and</strong> combines all products of the companies<br />
within the <strong>Group</strong> <strong>KD</strong> <strong>Group</strong> - investment in mutual funds, life, property <strong>and</strong> health insurances, securities brokerages <strong>and</strong> also<br />
banking services. Our vision is to provide the widest range of products <strong>and</strong> services at one place <strong>and</strong> remain the leading<br />
company selling financial products of the <strong>Group</strong> <strong>KD</strong> <strong>Group</strong> in Slovenia with the best st<strong>and</strong>ard of services. Apart from a wide<br />
range of products <strong>and</strong> expert advisory service, the main advantage of <strong>KD</strong> Finančna točka is its accessibility, which can only<br />
be reached with our strong network of regional branch offices all over Slovenia <strong>and</strong> mobile networks of marketing advisers.<br />
A<strong>dd</strong>itional support is provided through our web portal www.financna-tocka.si <strong>and</strong> a call centre. <strong>The</strong> mission of <strong>KD</strong> Finančna<br />
točka is thus to increase the satisfaction of our clients with our offer of innovative, excellent <strong>and</strong> competitive financial<br />
products at one place with the help of a chosen personal adviser. By doing this we meet <strong>and</strong> importantly supplement the<br />
goals of the <strong>Group</strong>.<br />
<strong>The</strong> <strong>KD</strong> plus club functions within the framework of the company <strong>KD</strong> Mark. Its main goal is to strengthen the trust of the<br />
already existing clients of the <strong>Group</strong>. <strong>The</strong> <strong>KD</strong> plus club offers its clients numerous advantages related to the <strong>Group</strong>’s financial<br />
services <strong>and</strong> benefits from other various fields offered by external partners. In a<strong>dd</strong>ition, the Club connects the services of the<br />
companies within the <strong>Group</strong>, <strong>and</strong> strengthens <strong>and</strong> establishes synergy effects among the companies.<br />
In 2009, <strong>KD</strong> Finančna točka had 14 regional branch offices. <strong>The</strong> mobile network was composed of 250 active contractual<br />
partners <strong>and</strong> employed marketing professionals. A call centre with 24 associates, 4 of which are permanently employed, <strong>and</strong><br />
of course our website www.financna-tocka.si provide a<strong>dd</strong>itional support to personal sales <strong>and</strong> an a<strong>dd</strong>itional communication<br />
channel for clients. In 2010, the website will get a new image <strong>and</strong> structure as well as an integrated <strong>and</strong> enhanced the offer<br />
of the <strong>Group</strong>’s products. <strong>The</strong> website www.financna-tocka.si will thus enable quick, transparent <strong>and</strong> simple obtaining of<br />
information in carrying out the <strong>Group</strong>’s financial services anyplace <strong>and</strong> anytime.<br />
64
<strong>The</strong> <strong>KD</strong> <strong>Group</strong> Annual Report 2009<br />
At the end of 2009, the offer of <strong>KD</strong> Finančna točka comprised life insurances of the insurance company <strong>KD</strong> Življenje,<br />
information, advisory services <strong>and</strong> an access to 17 sub-funds of the <strong>KD</strong> Krovni sklad <strong>and</strong> the savings plan VIP 100 Premium<br />
of the asset management company <strong>KD</strong> Skladi, health <strong>and</strong> property insurances of Adriatic Slovenica, securities brokerage,<br />
individual assets management services of <strong>KD</strong> Banka <strong>and</strong> the possibility of voluntary health insurance abroad with the<br />
Assistance CORIS. <strong>The</strong> offer of <strong>KD</strong> Finančna točka will be supplemented with banking services of <strong>KD</strong> Banka from the<br />
beginning of 2010 on.<br />
Since the very beginning, the plans of <strong>KD</strong> Finančna točka have been focused on the penetration to different Central <strong>and</strong><br />
Eastern European markets, where other companies within the <strong>Group</strong> were also present. But with regard to the existing global<br />
economic crisis, the Company has decided to withdraw from Slovakia, Romania <strong>and</strong> Croatia. <strong>The</strong> subsidiary company in<br />
Bulgaria has remained active.<br />
At the end of 2009, 851 new investors <strong>and</strong> over EUR 18 million of indirect payments into <strong>KD</strong> Skladi investment funds, <strong>and</strong><br />
over EUR 32 million of payments (including transfers) , were recorded at the branch offices of <strong>KD</strong> Finančna točka. Over<br />
9,000 new insurances were taken out at <strong>KD</strong> Finančna točka, <strong>and</strong> 2,000 from the “existing insurance holders” offer. <strong>The</strong> total<br />
new written annual premium amounted to over EUR 5,300,000, <strong>and</strong> a single premium to over EUR 4,700,000. In 2009, the<br />
website www.financna-tocka.si was visited by more than 250,000 users, <strong>and</strong> at the end of 2009 the <strong>KD</strong> plus club had more<br />
than 72,000 members.<br />
Challenges in 2010:<br />
• to sell more than 10,000 life insurance policies in Slovenia <strong>and</strong> to contribute more than EUR 30 million of direct<br />
inflows to mutual funds of <strong>KD</strong> Skladi (total transfers <strong>and</strong> <strong>KD</strong> MM), to gain over 4,000 clients for <strong>KD</strong> Banka<br />
• to set up a model <strong>KD</strong> Finančna točka branch that will offer a comprehensive range of services of all financial pillars<br />
the so called »all-finance« service, <strong>and</strong> combine knowledge, products <strong>and</strong> services at one place<br />
• to continue active marketing of banking products of <strong>KD</strong> Banka for the whole market<br />
• to exp<strong>and</strong> the (mobile) sales network<br />
• to achieve a high st<strong>and</strong>ard of sales accompanied by a high level of professionalism of financial advisors to be<br />
achieved through constant training.<br />
Companies in the sales of financial services division<br />
<strong>KD</strong> Finančna točka, premoženjsko svetovanje, d.o.o., Ljubljana<br />
A<strong>dd</strong>ress: Celovška cesta 206, Ljubljana, Slovenia<br />
Telephone: + 386 1 582 67 51<br />
Fee number: 080 12 08<br />
Fax: + 386 1 582 66 52<br />
E-mail: info@kd-financnatocka.si<br />
Website: www.financna-tocka.si<br />
Management Board (31 December 2009): Matej Marošek, President of the Management Board<br />
Katja Kraškovic, MSc., Member of the Management Board<br />
<strong>KD</strong> Mark, storitveno podjetje, d.o.o., Ljubljana<br />
A<strong>dd</strong>ress: Celovška cesta 206, Ljubljana, Slovenia<br />
Telephone: + 386 1 582 67 12 <strong>and</strong> +386 1 582 68 25<br />
Fax: + 386 1 582 66 52<br />
E-mail: info@kdplus.si<br />
Website: www.kdplus.si<br />
Management Board (31 December 2009): Špela Klun, Director<br />
65
<strong>The</strong> <strong>KD</strong> <strong>Group</strong> Annual Report 2009<br />
Capital investments<br />
<strong>The</strong> <strong>Group</strong> <strong>KD</strong> <strong>Group</strong>’s capital investment division is managed by <strong>KD</strong> Kapital, Ljubljana. With the establishment of the<br />
company, the <strong>Group</strong> separated the management of non-listed investments <strong>and</strong> significant listed investments from strategic<br />
<strong>and</strong> listed portfolio investments. <strong>The</strong> capital investments division also includes real estate.<br />
<strong>KD</strong> Kapital's activities include: management of non-listed investments <strong>and</strong> specific significant listed investments;<br />
management of management companies <strong>and</strong> investment funds that succeeded privatisation funds in Bosnia <strong>and</strong><br />
Herzegovina <strong>and</strong> the Republic of Srpska.<br />
Management of non-listed investments <strong>and</strong> specific significant listed investments<br />
In 2009, <strong>KD</strong> Kapital disposed off <strong>and</strong> pledged a portion of existing investments <strong>and</strong> used the proceeds to extend a loan to the<br />
parent company. <strong>The</strong> sole source of funding of <strong>KD</strong> Kapital is the equity capital. <strong>The</strong> company preserved flat organisation with<br />
a small team of key staff, reasonable out sourcing <strong>and</strong> efficient application of management leverages through asset<br />
management companies in the investment funds. <strong>KD</strong> Kapital is the direct holder of 32 investments. <strong>The</strong> ten largest<br />
investments include investment in: Elektro Ljubljana d. d., Nama d. d., Žito d. d., Kmečki glas d. o.o., Savske elektrarne d. o.<br />
o., Semenarna Ljubljana d. d., Žičnice Vogel d. d., Ljubljanske mlekarne d. d., Mlekarna Celeia d.o.o., Cimos d.d. <strong>and</strong><br />
Vrtnarstvo Celje d. o. o.<br />
Significant capital investments held indirectly or directly by <strong>KD</strong> <strong>Group</strong> d. d. include Gea College d. d., Deželna banka<br />
Slovenije d. d. <strong>and</strong> Seaway <strong>Group</strong> d. o. o.<br />
Closed-end investment funds in South Eastern Europe<br />
At the end of the year, <strong>KD</strong> Kapital owned two subsidiaries among management companies established in the privatisation<br />
process in the Federation of Bosnia <strong>and</strong> Herzegovina <strong>and</strong> the Republika Srpska:<br />
- a stake of 95.71 percent in ABDS d. d., Sarajevo, which manages the investment fund BIG;<br />
- a stake of 51.0 percent in VIB a. d., Banja Luka, which manages the investment fund VIB.<br />
<strong>KD</strong> Kapital holds a direct investment of 3.73 percent in MIG, investment fund in Monte negro.<br />
Investments in <strong>KD</strong> Mont, asset management company, BIG <strong>and</strong> a portion of MIG (both funds) were disposed of.<br />
<strong>The</strong> total value of the three investment funds in which <strong>KD</strong> Kapital holds either direct or indirect stake, stood at EUR 40<br />
million as at 31 December 2009. Based on the management companies' reports, the net value of the funds was EUR 115<br />
million as at 31 December 2009.<br />
In 2009 liquidation process was instigated for <strong>KD</strong> Private Equity Fund B. V. (venture capital fund).<br />
Investment fund MIG AD, Podgorica, Montenegro Data as at 31 December 2009<br />
Net share price (in EUR) 0.26<br />
Number of shares 109,685,100<br />
Net value of the fund (in EUR million) 28.3<br />
Market price per share (in EUR) 0.065<br />
Closed-end investment fund VIB a. d., Banja Luka, Republic of Srpska Data as at 31 December 2009<br />
Net share price (in EUR) 3.62<br />
Number of shares 1,987,956<br />
Net value of the fund (in EUR million) 7.2<br />
Market price per share (in EUR) 1.28<br />
Local currency: Convertible Mark (EUR–BAM exchange rate as at 31 December 2009)<br />
1 EUR = 1.96 BAM<br />
Closed-end investment fund BIG d. d., Sarajevo, Federation of Bosnia <strong>and</strong> Data as at 31 December 2009<br />
Herzegovina<br />
Net share price (in EUR) 6.76<br />
Number of shares 10,654,406<br />
Net value of the fund (in EUR million) 71.98<br />
Market price per share (in EUR) 2.81<br />
Local currency: Convertible Mark (EUR–BAM exchange rate as at 31 December 2009)<br />
1 EUR = 1.96 BAM<br />
66
<strong>The</strong> <strong>KD</strong> <strong>Group</strong> Annual Report 2009<br />
Company profile:<br />
<strong>KD</strong> Kapital, finančna družba, d. o. o., Ljubljana<br />
Celovška cesta 206, Ljubljana, Slovenia<br />
Telephone: + 386 1 582 67 96<br />
Fax: + 386 1 582 68 23<br />
E-mail: info@kd-group.com<br />
Website: www.kd-group.com<br />
Management Board: Janez Bojc, President<br />
REAL ESTATE<br />
<strong>The</strong> <strong>Group</strong> <strong>KD</strong> <strong>Group</strong>'s real estate division is managed by <strong>KD</strong> Kvart, a young, dynamic <strong>and</strong> ambitious company. <strong>The</strong><br />
company's core activity is real estate investment engineering. <strong>The</strong> purpose of the real estate division is to search for<br />
opportunities for the development of real estate projects, trade in real estate <strong>and</strong> the management of the <strong>Group</strong> <strong>KD</strong> <strong>Group</strong>'s<br />
real estate.<br />
Business operation in 2009:<br />
<strong>The</strong> Šumi project<br />
<strong>The</strong> main project of the company is Šumi, a business <strong>and</strong> residential complex. During the last year, we focused chiefly on the<br />
following activities:<br />
Representing the interests of the <strong>KD</strong> Kvart (<strong>Group</strong>) in the settlement of dispute with a complainant regarding the issued<br />
building permit – the legal validity has been obtained,<br />
Preparing project documentation (in several alternative solutions) for a change of the building permit for the Šumi project,<br />
Seeking financial resources to finance the construction of the Šumi project.<br />
Engineering <strong>and</strong> project management<br />
<strong>KD</strong> Kvart provided technical support <strong>and</strong> drew up the project documentation in the network expansion or the renovation of<br />
the <strong>KD</strong> Finančna točka in Slovenia, where coordination of implementation was realised. We carried out project management<br />
<strong>and</strong> supervision in the arrangement of the <strong>KD</strong> Banka premises, carried out professional advising on the “<strong>KD</strong> joint sale”<br />
project, <strong>and</strong> supervised the AS projects– arrangement of new branch offices.<br />
Real estate marketing<br />
In 2009, the following activities in the field of real estate marketing were carried out by <strong>KD</strong> Kvart, d.o.o.:<br />
Marketing of own real estate:<br />
Slovenska cesta 12: in 2009 we hired out 3 apartments for a profit rent for an indefinite duration of the rent.<br />
Soteska 6: in 2009 we hired out a business premise for a profit rent for an indefinite duration of the rent.<br />
Kino Vič: in 2009 we launched marketing activities (lease, sale) of the Vič cinema facility.<br />
Real estate brokerage in the <strong>KD</strong> <strong>Group</strong>:<br />
<strong>KD</strong> Finančna točka: brokerage at hiring a business premise at Prešernov trg<br />
Bežigrad cinema: realisation of h<strong>and</strong>over <strong>and</strong> acceptance of facility under trust<br />
Bežigrad cinema: in 2009 we launched marketing activities (lease, sale) of the Bežigrad cinema facility<br />
AS, facility-Celovška 206, <strong>KD</strong> Banka, Bežigrad cinema: real estate advising <strong>and</strong> brokerage; reviewing, arranging <strong>and</strong><br />
obtaining the missing documentation.<br />
Real estate management<br />
In accordance with the real estate division development strategy <strong>and</strong> the cost management synergy, <strong>KD</strong> Kvart took over the<br />
management <strong>and</strong> maintenance of the <strong>KD</strong> facilities in 2009, which also resulted in the transfer of the <strong>KD</strong> <strong>Group</strong> maintenance<br />
staff to <strong>KD</strong> Kvart. In relation to this, new leases of <strong>KD</strong> companies were signed with the AS insurance company as the owner<br />
of the premises at Celovška 206 <strong>and</strong> a multi-party agreement on real estate management with <strong>KD</strong> Kvart. A special<br />
agreement on real estate management was signed also with the AS insurance company. In the field of operating expenses,<br />
negotiations on lowering the prices were carried out in cooperation with the <strong>KD</strong> <strong>Group</strong>’s Purchase Department, which were<br />
successfully completed in most cases.<br />
R & R<br />
Planning alternative solutions for the following facilities: Soseska 6, Vič cinema, Bežigrad cinema<br />
67
<strong>The</strong> <strong>KD</strong> <strong>Group</strong> Annual Report 2009<br />
Challenges in 2010:<br />
To obtain an internal decision on the final selection of the architectural solution for the Šumi building.<br />
To manage procedures for drawing up the project documentation to obtain a modified Building permit.<br />
To manage the marketing procedures of the Šumi business <strong>and</strong> residential premises:<br />
To search for new investment opportunities in Slovenia <strong>and</strong> abroad;<br />
To design <strong>and</strong> launch a new website to present the Šumi project to potential customers;<br />
To obtain funding for the Šumi project.<br />
To implement tangible <strong>and</strong> competitive engineering in the realisation of the projects for the <strong>KD</strong> <strong>Group</strong>.<br />
To successfully complete sales or hire of unnecessary property in terms of business of <strong>KD</strong> (the Bežigrad cinema, Travessini<br />
palace, Vič cinema).<br />
To introduce a quality <strong>and</strong> efficient maintenance system for the <strong>KD</strong> <strong>Group</strong>.<br />
Company:<br />
<strong>KD</strong> Kvart, nepremičninska in holdinška dejavnost, d.o.o.<br />
A<strong>dd</strong>ress: Levstikova 14, 1000 Ljubljana<br />
Telephone: + 386 1 24 45 050<br />
Fax: + 386 1 24 45 055<br />
E-mail: kdkvart@kd-group.si<br />
Website: www.kd-group.si<br />
Management Board (31 December 2009): Miha Gostiša, Director<br />
68
Consolidated Financial Statements<br />
of the <strong>KD</strong> <strong>Group</strong><br />
for the year ended 31 December 2009<br />
69
<strong>The</strong> <strong>Group</strong> <strong>KD</strong> <strong>Group</strong> Annual Report 2009<br />
Consolidated Financial Statements as at <strong>and</strong> for the year ended 31 December 2009<br />
CONTENTS<br />
Consolidated income statement ............................................................................................................................ 73<br />
Consolidated statement of comprehensive income ............................................................................................... 74<br />
<strong>The</strong> notes are an integral part of these consolidated financial statements............................................................ 74<br />
Consolidated balance sheet .................................................................................................................................. 75<br />
Consolidated statement of changes in equity ....................................................................................................... 76<br />
Consolidated cash flow statement ........................................................................................................................ 78<br />
Notes to the consolidated financial statements ..................................................................................................... 80<br />
1. General information ...................................................................................................................................... 80<br />
2. Summary of significant accounting policies .................................................................................................. 80<br />
3. Significant accounting judgements, estimates <strong>and</strong> assumptions ................................................................ 105<br />
4. Comparatives .............................................................................................................................................. 109<br />
5. Risk management ....................................................................................................................................... 110<br />
6. Segment reporting ...................................................................................................................................... 139<br />
7. Property, plant <strong>and</strong> equipment .................................................................................................................... 143<br />
8. Investment property .................................................................................................................................... 144<br />
9. Intangible assets ......................................................................................................................................... 145<br />
10. Investments in associates ........................................................................................................................... 147<br />
11. Financial assets .......................................................................................................................................... 149<br />
12. Receivables ................................................................................................................................................ 153<br />
13. Inventories .................................................................................................................................................. 154<br />
14. Cash <strong>and</strong> cash equivalents ......................................................................................................................... 154<br />
15. Equity .......................................................................................................................................................... 155<br />
16. Other reserves <strong>and</strong> retained earnings ......................................................................................................... 156<br />
17. Borrowings .................................................................................................................................................. 157<br />
18. Insurance contracts liabilities ...................................................................................................................... 158<br />
19. Derivative financial instruments .................................................................................................................. 161<br />
20. Trade <strong>and</strong> other payables ........................................................................................................................... 161<br />
21. Deferred tax ................................................................................................................................................ 161<br />
22. Revenue ...................................................................................................................................................... 163<br />
23. Expenses .................................................................................................................................................... 164<br />
24. Investment income ...................................................................................................................................... 166<br />
25. Net realised gains on financial assets available for sale ............................................................................. 166<br />
26. Net fair value gains on assets at fair value through profit or loss ................................................................ 167<br />
27. Operating loss before interests, tax, exchange differences <strong>and</strong> influence of associates ............................ 167<br />
28. Finance costs .............................................................................................................................................. 167<br />
29. Income tax expense .................................................................................................................................... 167<br />
30. Earnings per share .................................................................................................................................... 168<br />
31. Dividends per share .................................................................................................................................... 168<br />
32. Acquisitions <strong>and</strong> disposals of subsidiaries .................................................................................................. 168<br />
33. Related-party transactions .......................................................................................................................... 170<br />
34. Events after the balance sheet date ............................................................................................................ 172<br />
70
<strong>The</strong> <strong>Group</strong> <strong>KD</strong> <strong>Group</strong> Annual Report 2009<br />
Consolidated Financial Statements as at <strong>and</strong> for the year ended 31 December 2009<br />
Statement of management's responsibilities<br />
Pursuant to Article 60 of the Companies Act, the members of Board of Directors of the <strong>KD</strong> <strong>Group</strong> affirm that the annual report<br />
of the <strong>KD</strong> <strong>Group</strong> for 2009, including the statement on management, is compiled <strong>and</strong> published in accordance with the<br />
Companies Act, the Financial Instruments Market Act <strong>and</strong> the International Financial Reporting St<strong>and</strong>ards. Board of directors<br />
of <strong>KD</strong> <strong>Group</strong> d. d. confirmed financial statements on April 14, 2010.<br />
<strong>The</strong> Company's Board of Directors hereby:<br />
- approves the financial statements of the <strong>KD</strong> <strong>Group</strong>, as well as the applied accounting policies <strong>and</strong> notes to the<br />
financial statements;<br />
- affirms, that the annual report of the <strong>KD</strong> <strong>Group</strong> for 2009, with all constituent parts, is compiled in accordance with<br />
valid legislation <strong>and</strong> the International Financial Reporting St<strong>and</strong>ards;<br />
- confirms that the financial statements of the <strong>KD</strong> <strong>Group</strong> is a true <strong>and</strong> fair presentation of the Company's financial<br />
position <strong>and</strong> the results of its operations for 2009;<br />
- declares that the financial statements of the <strong>KD</strong> <strong>Group</strong> are compiled under the assumption of a going concern, that<br />
the selected accounting policies have been applied consistently <strong>and</strong> that any changes have been disclosed;<br />
- states that it is responsible for the adoption of measures to prevent <strong>and</strong> detect fraud <strong>and</strong> misstatements, <strong>and</strong> for<br />
preserving the value of the assets of the <strong>KD</strong> <strong>Group</strong>.<br />
Pursuant to Article 110 of the Financial Instruments Market Act, the members of Board of Directors of the <strong>KD</strong> <strong>Group</strong> declare:<br />
- that the financial report of the <strong>KD</strong> <strong>Group</strong> for 2009 is compiled in accordance with the International Financial<br />
Reporting St<strong>and</strong>ards, <strong>and</strong> that it is a true <strong>and</strong> fair presentation of the assets <strong>and</strong> liabilities, the financial position <strong>and</strong><br />
operating results of the <strong>KD</strong> <strong>Group</strong>;<br />
- that the business report of the <strong>KD</strong> <strong>Group</strong> for 2009 includes a fair review of the development <strong>and</strong> operating results of<br />
the Company, including a description of the principle risks to which the <strong>KD</strong> <strong>Group</strong> is exposed.<br />
Ljubljana, April 22, 2010<br />
Matjaž Gantar<br />
President of Board of Directors<br />
Aleks<strong>and</strong>er Sekavčnik<br />
Deputy President of Board of Directors<br />
Dr. Draško Veselinovič<br />
Member of Board of Directors, CEO<br />
Peter Grašek<br />
Member of Board of Directors, Deputy CEO<br />
Tomaž Butina<br />
Member of Board of Directors<br />
Sergej Racman<br />
Member of Board of Directors<br />
72
<strong>The</strong> <strong>Group</strong> <strong>KD</strong> <strong>Group</strong> Annual Report 2009<br />
Consolidated Financial Statements as at <strong>and</strong> for the year ended 31 December 2009<br />
Consolidated income statement<br />
(in EUR) Note 2009 2008<br />
Gross premium 342,116,815 332,537,765<br />
Premiums ceded to reinsurers (11,986,438) (11,255,070)<br />
Net premiums 22 330,130,377 321,282,695<br />
Fees <strong>and</strong> commissions income 22 10,849,086 14,410,812<br />
Investment income 24 16,569,959 22,694,921<br />
Net gains on available-for-sale financial assets 25 4,421,911 9,997,641<br />
Impairment of available-for-sale financial assets 25 (2,926,357) (24,846,254)<br />
Net gains / (losses) on assets at fair value through profit or loss 26 27,354,774 (101,432,513)<br />
Net gains / (losses) – derivative financial instruments 26 (322,132) 6,319,371<br />
Net finance income 55,947,241 (72,856,022)<br />
Sales of goods <strong>and</strong> services 22 11,621,037 23,623,244<br />
Other operating income 22 15,268,189 32,302,659<br />
Other income 26,889,226 55,925,903<br />
Gross benefits <strong>and</strong> claims paid 23 (283,528,827) (169,014,533)<br />
Claims ceded to reinsurers 23 12,053,097 12,172,911<br />
Net insurance contracts benefits <strong>and</strong> claims (271,475,730) (156,841,622)<br />
Costs of services (68,689,724) (75,690,259)<br />
Labour costs 23 (57,576,822) (64,405,668)<br />
Other expenses 23 (33,657,053) (57,274,415)<br />
Other expenses 23 (159.923.599) (197,370,342)<br />
Operating profit 27 (18,432,485) (49,859,388)<br />
Finance costs 28 (9,563,914) (8,023,466)<br />
Share of profit of associates 10 (23,426,946) (27,407,028)<br />
(32,990,860) (35,430,494)<br />
Profit before tax (51,423,345) (85,289,882)<br />
Income tax expense 29 7,199,907 8,285,899<br />
Net profit or loss for the year (44,223,438) (77,003,983)<br />
Attributable to:<br />
Equity holders of the parent (43,887,570) (77,217,976)<br />
Minority interests (335,868) 213,993<br />
(44,223,438) (77,003,983)<br />
Earnings per share for profit attributable to the equity holders<br />
of the Company during the year (expressed in EUR per share)<br />
- basic <strong>and</strong> diluted 30 (16,93) (29.41)<br />
<strong>The</strong> notes are an integral part of these consolidated financial statements.<br />
73
<strong>The</strong> <strong>Group</strong> <strong>KD</strong> <strong>Group</strong> Annual Report 2009<br />
Consolidated Financial Statements as at <strong>and</strong> for the year ended 31 December 2009<br />
Consolidated statement of comprehensive income<br />
(in EUR) 1. 1. - 30. 12. 2009 1. 1. - 31. 12. 2008<br />
Profit for the year (44,223,438) (77,003,983)<br />
Other comprehensive income<br />
Net (loss)/gain on available for sale financial assets 7,572,878 (68,011,703)<br />
Changes of revaluation reserves - associates 559,924 (288,334)<br />
Income tax effect (1,655,662) 12,046,306<br />
6,477,140 (56,253,731)<br />
Net movement of cash flow hedges 70,715 (317,425)<br />
Income tax (14,140) 70,139<br />
56,575 (247,286)<br />
Exchange differences on translation of foreign operations (74,229) (2,919,677)<br />
Other comprehensive income for the year, net of tax 6,459,486 (59,420,694)<br />
Total comprehensive income for the year, net of tax (37,763,952) (136,424,677)<br />
Total comprehensive income for the year, net of tax attributable to:<br />
- equity holders of the parent (38,000,854) (136,397,326)<br />
- non-controlling interests 236,902 (27,351)<br />
Total (37,763,952) (136,424,677)<br />
<strong>The</strong> notes are an integral part of these consolidated financial statements.<br />
74
<strong>The</strong> <strong>Group</strong> <strong>KD</strong> <strong>Group</strong> Annual Report 2009<br />
Consolidated Financial Statements as at <strong>and</strong> for the year ended 31 December 2009<br />
Consolidated balance sheet<br />
(in EUR) Note 31.12.2009<br />
31.12.2008<br />
restated<br />
31.12.2007<br />
restated<br />
ASSETS<br />
Property, plant <strong>and</strong> equipment 7 35,125,412 36,303,670 83,867,010<br />
Investment property 8 29,813,540 28,707,587 20,601,521<br />
Intangible assets 9 71,325,802 68,228,028 87,896,641<br />
Investments in associates 10 52,308,751 81,077,285 71,687,821<br />
Financial assets:<br />
- loans <strong>and</strong> other receivables 11 90,335,200 96,742,037 56,598,625<br />
- credits to banks 4,896,696 - -<br />
- credits to non-banking clients 14,110,082 - -<br />
- other loans <strong>and</strong> receivables 71,328,422 96,742,037 56,598,625<br />
- at fair value through profit or loss 11 36,695,860 33,692,752 59,425,329<br />
- held to maturity 11 16,461,698 7,844,709 7,590,164<br />
- available for sale 11 177,308,048 173,911,332 305,845,228<br />
Derivative financial instruments 1.146.675 - -<br />
321,947,481 312,190,830 429,459,346<br />
Unit-linked investments of policyholders 146,036,822 78,607,121 115,158,176<br />
Reinsurance assets 18 19,449,008 17,362,703 11,004,824<br />
Investment contracts 17,648,068 16,425,104 15,669,491<br />
Deferred tax asset 21 29,682,588 20,427,164 -<br />
Income tax receivable 490,870 7,260,081 3,102,335<br />
Inventories 13 13,443,059 13,932,808 12,200,210<br />
Insurance receivables <strong>and</strong> other receivables 12 57,881,610 69,848,127 67,615,294<br />
Deferred acquisition costs 12 8,103,645 11,566,010 8,248,809<br />
Deferred expenses <strong>and</strong> accrued revenues 12 3,798,016 2,221,991 2,075,776<br />
Cash <strong>and</strong> cash equivalents 14 40,730,072 31,305,192 27,692,313<br />
Total assets 847,784,744 795,463,701 956,279,567<br />
EQUITY<br />
Capital <strong>and</strong> reserves attributable to equity holders of the company<br />
Share capital 15 98,215,757 98,215,757 98,215,757<br />
Capital reserves 15 60,471,037 104,395,312 104,395,312<br />
Profit reserves 16 4,048,103 4,048,103 17,850,609<br />
Treasury shares 15 (3,852,955) (3,852,955) (3,852,955)<br />
Revaluation reserve 16 785,639 (5,101,077) 54,078,273<br />
Retained earnings 16 (10,591,492) (10,295,314) 56,867,744<br />
149,076,089 187,409,826 327,554,740<br />
Minority interest 2,528,930 4,837,468 11,011,536<br />
Total equity 151,605,019 192,247,294 338,566,276<br />
LIABILITIES<br />
Insurance contract liabilities 18 296,097,984 279,766,288 258,028,873<br />
Investment contract liabilities 18 17,703,254 16,394,308 15,668,418<br />
Unit-linked liabilities of policyholders 18 140,108,844 79,308,743 112,978,279<br />
Financial liabilities 17 194,705,529 181,557,903 164,250,682<br />
- time deposit 15,530,894 - -<br />
- other financial liabilities 179,174,635 181,557,903 164,250,682<br />
Derivative financial instruments 19 1,426,656 350,696 6,312,734<br />
Other provisions <strong>and</strong> long-term accruals 20 2,607,327 2,862,590 4,582,141<br />
Income tax liability 1,528,147 350,717 7,296,627<br />
Deferred tax liability 21 1,418,370 - 2,308,659<br />
Dividends Payable 20 686,098 1,435,220 360,202<br />
Insurance payables <strong>and</strong> other payables 20 31,510,435 33,627,541 38,705,893<br />
Accrued expenses <strong>and</strong> deferred income 20 8,387,081 7,562,401 7,220,783<br />
Total liabilities 696,179,725 603,216,407 617,713,291<br />
Total equity <strong>and</strong> liabilities 847,784,744 795,463,701 956,279,567<br />
<strong>The</strong> notes are an integral part of these consolidated financial statements.<br />
75
<strong>The</strong> <strong>Group</strong> <strong>KD</strong> <strong>Group</strong> Annual Report 2009<br />
Consolidated Financial Statements as at <strong>and</strong> for the year ended 31 December 2009<br />
Consolidated statement of changes in equity<br />
Attributable to equity holders of the parent<br />
Share<br />
capital<br />
Capital<br />
reserves<br />
Profit<br />
reserves<br />
Treasury<br />
shares<br />
Revaluation<br />
reserves<br />
Retained<br />
earnings<br />
Minority<br />
interests<br />
Total equity<br />
(in EUR)<br />
Balance at 1 January<br />
2009 98,215,757 104,395,312 4,048,103 (3,852,955) (5,101,077) (10,295,314) 4,837,468 192,247,294<br />
Profit for the year - - - - - (43,887,570) (335,868) (44,223,438)<br />
Other comprehensive<br />
income - - - - 5,886,716 - 572,770 6,459,486<br />
Total recognised<br />
income of equity<br />
holders - - - - 5,886,716 (43,887,570) 236,902 (37,763,952)<br />
Issue of share capital to<br />
minority shareholders - - - - - - - -<br />
Dividends relating to<br />
2008 - - - - - (166,630) (214,581) (381,211)<br />
Minority interest arising<br />
on business<br />
combinations - - - - - - 339,520 339,520<br />
Other changes - - - - - (166,253) (54,552) (220,805)<br />
Reserves - (43,924,275) - - - 43,924,275 - -<br />
Increase in equity share<br />
of associates - - - - - - - -<br />
Increase in equity share<br />
of subsidiaries - - - - - - (1,392,970) (1,392,970)<br />
Disposal of a stake in a<br />
company - - - - - - (1,222,857) (1,222,857)<br />
Total - (43,924,275) - - - 43,591,392 (2,545,440) (2,878,323)<br />
Balance at 31<br />
December 2009 98,215,757 60,471,037 4,048,103 (3,852,955) 785,639 (10,591,492) 2,528,930 151,605,019<br />
<strong>The</strong> notes are an integral part of these consolidated financial statements.<br />
76
<strong>The</strong> <strong>Group</strong> <strong>KD</strong> <strong>Group</strong> Annual Report 2009<br />
Consolidated Financial Statements as at <strong>and</strong> for the year ended 31 December 2009<br />
Consolidated statement of changes in equity<br />
Attributable to equity holders of the parent<br />
Share<br />
capital<br />
Capital<br />
reserves<br />
Profit<br />
reserves<br />
Treasury<br />
shares<br />
Revaluation<br />
reserves<br />
Retained<br />
earnings<br />
Minority<br />
interests<br />
Total equity<br />
(in EUR)<br />
Balance at 1 January<br />
2008 98,215,757 104,395,312 17,850,609 (3,852,955) 54,078,273 58,565,835 11,011,536 340,264,367<br />
Restatement of<br />
opening balance - - - - - (1,698,091) - (1,698,091)<br />
Balance at 1 January<br />
2008 98,215,757 104,395,312 17,850,609 (3,852,955) 54,078,273 56,867,744 11,011,536 338,566,276<br />
Profit for the year - - - - - (77,217,976) 213,993 (77,003,983)<br />
Other comprehensive<br />
income - - - - (59,179,350) - (241,344) (59,420,694)<br />
Total recognised<br />
income of equity<br />
holders - - - - (59,179,350) (77,217,976) (27,351) (136,424,677)<br />
Issue of share capital to<br />
minority shareholders - - - - - - 32,301 32,301<br />
Dividends relating to<br />
2007 - - - - - (19,744,507) (257,031) (20,001,538)<br />
Minority interest arising<br />
on business<br />
combinations - - - - - - - -<br />
Other changes - - - - - 1,667,879 - 1,667,879<br />
Reserves - - (13,802,506) - - 13,802,506 - -<br />
Increase in equity share<br />
of associates - - - - - 14,329,040 - 14,329,040<br />
Increase in equity share<br />
of subsidiaries - - - - - - (5,879,337) (5,879,337)<br />
Disposal of a stake in a<br />
company - - - - - - (42,650) (42,650)<br />
Total - - (13,802,506) - - 10,054,918 (6,146,717) (9,894,305)<br />
Balance at 31<br />
December 2008 98,215,757 104,395,312 4,048,103 (3,852,955) (5,101,077) (10,295,314) 4,837,468 192,247,294<br />
<strong>The</strong> notes are an integral part of these consolidated financial statements.<br />
77
<strong>The</strong> <strong>Group</strong> <strong>KD</strong> <strong>Group</strong> Annual Report 2009<br />
Consolidated Financial Statements as at <strong>and</strong> for the year ended 31 December 2009<br />
Consolidated cash flow statement<br />
(in EUR) Note 2009 2008<br />
CASH FLOWS FROM OPERATING ACTIVITIES<br />
Profit before tax (51,423,345) (85,289,882)<br />
Adjustments for:<br />
- Depreciation of PPE 7 3,562,971 5,771,708<br />
- Depreciation of investments property 8 558,933 642,637<br />
- Amortisation/depreciation 9 1,936,761 1,509,026<br />
- (Gain)/loss on sale of PPE 110,028 (991,548)<br />
- (Gain)/loss on sale of intangible assets 1,355 21,193<br />
- (Gain)/loss on sale of investment property - -<br />
- Impairment of goodwill 9 5,904,886 25,722,775<br />
- Net movements in provisions for liabilities <strong>and</strong> charges 18.1 18,417,035 (18,290,000)<br />
- Net movements in investment contracts 1,373,090 722,890<br />
- Net movements in employee benefits 20 (255,263) 654,941<br />
- Excess on acquisition of subsidiary 22.2 620,680 (8,994,904)<br />
- Gain from increase in the share capital of a subsidiary 22.2 - -<br />
- Gain from acquisition of associates 10 - (5,130,921)<br />
- Investment income 24 (16,569,959) (22,694,921)<br />
- Net fair value gains on available-for-sale securities 25 (4,421,911) (9,997,641)<br />
- Impairment of AFS 25 (2,927,247) 24,846,254<br />
- Net fair value gains on assets at fair value through profit or loss 26 4,837,568 95,113,142<br />
- Impairment of trade receivables <strong>and</strong> loans 9,355,631 2,722,944<br />
- Finance cost 28 9,563,914 8,023,466<br />
- Share of profit of associates 10 23,426,946 27,407,029<br />
Changes in working capital<br />
- Inventories 13 (489,749) (1,732,598)<br />
- Trade <strong>and</strong> other receivables (578,717) (14,374,533)<br />
- Trade <strong>and</strong> other payables (114,996) 23,681,074<br />
Net (purchase)/proceeds of operating assets 11<br />
- Available-for-sale financial assets (5,499,681) 45,407,191<br />
- Financial assets at fair value through profit or loss 873,866 (17,038,870)<br />
- Investments held to maturity 9,676,810 (254,545)<br />
- Increases of borrowings (<strong>KD</strong> Banka) 9,961,240 -<br />
Dividends received 2,318,229 7,870,526<br />
Cash generated from operations 20,219,075 85,326,433<br />
Interest paid (7,847,731) (9,665,671)<br />
Income tax paid (2,051,617) (12,638,848)<br />
NET CASH FLOWS FROM OPERATING ACTIVITIES 10,319,727 63,021,914<br />
78
<strong>The</strong> <strong>Group</strong> <strong>KD</strong> <strong>Group</strong> Annual Report 2009<br />
Consolidated Financial Statements as at <strong>and</strong> for the year ended 31 December 2009<br />
(in EUR) Note 2009 2008<br />
CASH FLOWS FROM INVESTING ACTIVITIES<br />
Acquisition of subsidiary, net of cash acquired 32 (2,647,049) 12,192,046<br />
Increase in equity share of subsidiaries (1,822,573) (10,409,684)<br />
Acquisition of associates 10 (4,018,887) (14,571,598)<br />
Disposals of associates 10 9,808,855 2,962,628<br />
Purchases of property, plant <strong>and</strong> equipment 7 (4,644,503) (17,653,619)<br />
Proceeds from sale of property, plant <strong>and</strong> equipment 2,791,852 7,626,628<br />
Purchases of intangible assets 9 (10,091,412) (5,353,929)<br />
Proceeds from sale of intangible assets 5,260,956 26,908<br />
Purchases of investment property 8 (1,555,931) (1,649,333)<br />
Proceeds from sale of investment property 68,567 536,071<br />
Loans granted to related parties 33 (6,782,642) (14,712,870)<br />
Loan repayments received from related parties 33 8,511,098 11,533,545<br />
Loans <strong>and</strong> deposits granted (311,816,857) (302,830,052)<br />
Loan <strong>and</strong> deposit payments received 328,473,157 249,166,606<br />
Interest received 2,306,550 2,096,420<br />
Dividends received from associates 10 61,473 5,874,425<br />
NET CASH FLOWS USED IN INVESTING ACTIVITIES 13,902,654 (75,165,808)<br />
CASH FLOWS FROM FINANCING ACTIVITIES<br />
Proceeds from issuance of ordinary shares – minority interest - 32,301<br />
Purchase of treasury shares - -<br />
Disposal of treasury shares - -<br />
Proceeds from borrowings 65,162,870 86,357,994<br />
Repayment of borrowings (79,959,157) (51,281,218)<br />
Dividends paid to Company's shareholders 16 - (19,744,507)<br />
Dividends paid to minority interest - (48,289)<br />
NET CASH FLOWS USED IN FINANCING ACTIVITIES (14,796,287) 15,316,281<br />
NET INCREASE IN CASH AND CASH EQUIVALENTS 9,426,094 3,172,387<br />
CASH AND CASH EQUIVALENTS AT BEGINNING OF THE YEAR 31,305,192 27,692,313<br />
Foreign exchange gains on cash <strong>and</strong> cash equivalents (1,214) 440,492<br />
CASH AND CASH EQUIVALENTS AT END OF THE YEAR 40,730,072 31,305,192<br />
<strong>The</strong> notes are an integral part of these consolidated financial statements.<br />
79
<strong>The</strong> <strong>Group</strong> <strong>KD</strong> <strong>Group</strong> Annual Report 2009<br />
Notes to Consolidated Financial Statements as at <strong>and</strong> for the year ended 31 December 2009<br />
Notes to the consolidated financial statements<br />
1. General information<br />
<strong>The</strong> principal activities of <strong>KD</strong> <strong>Group</strong> d. d. (“the Company”) <strong>and</strong> its subsidiaries (“the <strong>Group</strong>”) are quite diversified, namely, from<br />
insurance to asset management financial services, banking <strong>and</strong> many others (real estate/immoveable property, publishing,<br />
etc.).<br />
<strong>KD</strong> <strong>Group</strong> d. d. is a public limited company with its registered office in Ljubljana, Celovška 206, Slovenia. Its shares are listed<br />
on the OTC market of the Ljubljana Stock Exchange. <strong>The</strong> Company’s ultimate parent entity is <strong>KD</strong> d. d., with its registered<br />
office in Ljubljana, Celovška 206, Slovenia.<br />
<strong>The</strong>se consolidated financial statements have been approved for issue by the Board of Directors on 22 April 2010 <strong>and</strong> can be<br />
obtained from the Company’s registered office in Ljubljana, Celovška 206, Slovenia.<br />
2. Summary of significant accounting policies<br />
2.1 Basis for the preparation of financial statements<br />
<strong>The</strong> accounting policies used are consistent with those applied in the previous year, except for the newly adopted<br />
st<strong>and</strong>ards <strong>and</strong> interpretations as presented below.<br />
IAS 1 Revised Presentation of Financial Statements<br />
<strong>The</strong> revised St<strong>and</strong>ard separates owner <strong>and</strong> non-owner changes in equity. <strong>The</strong> statement of changes in equity includes only<br />
details of transactions with owners, with non-owner changes in equity presented as a single line. In a<strong>dd</strong>ition, the St<strong>and</strong>ard<br />
introduces the statement of comprehensive income; it presents all items of recognised income <strong>and</strong> expense, either in one<br />
single statement, or in two linked statements. <strong>The</strong><strong>Group</strong> has elected to present two statements.<br />
IAS 23 Borrowing Costs (Revised)<br />
<strong>The</strong> definition of borrowing costs is revised to consolidate the two types of items that are considered components of ‘borrowing<br />
costs’ into one - the interest expense calculated using the effective interest rate method in accordance with IAS 39. <strong>The</strong> <strong>KD</strong><br />
<strong>Group</strong> has amended its accounting policy accordingly. This amendment did not have any impact on the <strong>Group</strong>’s financial<br />
statements<br />
IFRS 2 Share-based Payment - Vesting Conditions <strong>and</strong> Cancellations<br />
<strong>The</strong> St<strong>and</strong>ard has been amended to clarify the definition of vesting conditions <strong>and</strong> to prescribe the accounting treatment of an<br />
award that is effectively cancelled because a non-vesting condition is not satisfied. <strong>The</strong> adoption of this amendment did not<br />
have any impact on the financial position or performance of the <strong>Group</strong>.<br />
IFRS 7 Financial Instruments: Disclosures<br />
<strong>The</strong> amended st<strong>and</strong>ard requires a<strong>dd</strong>itional disclosure about fair value measurement <strong>and</strong> liquidity risk. Fair value<br />
measurements are to be disclosed by source of inputs using a three level hierarchy for each class of financial instrument. In<br />
a<strong>dd</strong>ition, reconciliation between the beginning <strong>and</strong> ending balance for Level 3 fair value measurements is now required, as<br />
well significant transfers between Level 1 <strong>and</strong> Level 2 fair value measurements. <strong>The</strong> amendments also clarify the<br />
requirements for liquidity risk disclosures. <strong>The</strong> fair value measurement disclosures <strong>and</strong> the liquidity risk disclosures are<br />
impacted by the amendments (Note 5.6.)<br />
IFRS 8 Operating Segments<br />
<strong>The</strong> new St<strong>and</strong>ard requires an entity to adopt “management approach” to reporting on the financial performance of its operating<br />
segments. As such it replaces the requirement for determining <strong>and</strong> reporting by business <strong>and</strong> regional segments. If the<br />
numbers used by management for internal performance measurement of operating segments are different to the numbers<br />
reported in the financial statements, this requires a reconciliation of numbers used by management to the financial statements.<br />
IAS 32 Financial Instruments: Presentation <strong>and</strong> IAS 1 Puttable Financial Instruments <strong>and</strong> Obligations Arising on Liquidation<br />
<strong>The</strong> St<strong>and</strong>ards have been amended to allow a limited scope exception for puttable financial instruments to be classified as<br />
equity if they fulfil a number of specified criteria. <strong>The</strong> adoption of this amendment did not have any impact on the financial<br />
position or performance of the <strong>Group</strong>.<br />
80
<strong>The</strong> <strong>Group</strong> <strong>KD</strong> <strong>Group</strong> Annual Report 2009<br />
Notes to Consolidated Financial Statements as at <strong>and</strong> for the year ended 31 December 2009<br />
IFRIC 9 Reassessment of Embe<strong>dd</strong>ed Derivatives <strong>and</strong> IAS 39 Financial Instruments: Recognition <strong>and</strong> Measurement<br />
<strong>The</strong>se amendments to IFRIC 9 require an entity to assess whether an embe<strong>dd</strong>ed derivative must be separated from a host<br />
contract when the entity reclassifies a hybrid financial asset out of the fair value through profit or loss category. This<br />
assessment is to be made based on circumstances that existed on the later of the date the entity first became a party to the<br />
contract <strong>and</strong> the date of any contract amendments that significantly change the cash flows of the contract. IAS 39 now states<br />
that if an embe<strong>dd</strong>ed derivative cannot be reliably measured, the entire hybrid instrument must remain classified as at fair<br />
value through profit or loss. <strong>The</strong> adoption of this amendment did not have any impact on the financial position or performance<br />
of the <strong>Group</strong>.<br />
IFRIC 12 Service Concession Agreement<br />
This interpretation outlines the approach to account for contractual arrangements arising from entities providing public<br />
services. It provides that the operator should not account for infrastructure as property, plant <strong>and</strong> equipment, but rather<br />
recognize a financial asset <strong>and</strong>/or intangible asset. <strong>The</strong> adoption of this amendment did not have any impact on the financial<br />
position or performance of the <strong>Group</strong>.<br />
IFRIC 13 Customer Loyalty Programmes<br />
This interpretation requires customer loyalty credits to be accounted for as a separate component of the sales transaction in<br />
which they are granted. A portion of the fair value of the consideration received is allocated to the award credits <strong>and</strong> deferred.<br />
This is then recognised as revenue over the period that the award credits are redeemed. <strong>The</strong> adoption of this amendment did<br />
not have any impact on the financial position or performance of the <strong>Group</strong>.<br />
IFRIC 15 Agreement for the Construction of Real Estate<br />
<strong>The</strong> interpretation is to be applied retrospectively. It clarifies when <strong>and</strong> how revenue <strong>and</strong> related expenses from the sale of a<br />
real estate unit should be recognised if an agreement between a developer <strong>and</strong> a buyer is reached before the construction of<br />
the real estate is completed. Furthermore, the interpretation provides guidance on how to determine whether an agreement is<br />
within the scope of IAS 11 or IAS 18. <strong>The</strong> adoption of this amendment did not have any impact on the financial position or<br />
performance of the <strong>Group</strong>.<br />
IFRIC 16 Hedges of a Net Investment in a Foreign Operation<br />
<strong>The</strong> interpretation is to be applied prospectively. IFRIC 16 provides guidance on the accounting for a hedge of a net<br />
investment. As such it provides guidance on identifying the foreign currency risks that qualify for hedge accounting in the<br />
hedge of a net investment, where within the group the hedging instruments can be held in the hedge of a net investment <strong>and</strong><br />
how an entity should determine the amount of foreign currency gain or loss, relating to both the net investment <strong>and</strong> the<br />
hedging instrument, to be recycled on disposal of the net investment. <strong>The</strong> adoption of this amendment did not have any<br />
impact on the financial position or performance of the <strong>Group</strong>.<br />
81
<strong>The</strong> <strong>Group</strong> <strong>KD</strong> <strong>Group</strong> Annual Report 2009<br />
Notes to Consolidated Financial Statements as at <strong>and</strong> for the year ended 31 December 2009<br />
Improvements to IFRSs<br />
In May 2008 the Board issued its first omnibus of amendments to its st<strong>and</strong>ards, primarily with a view to removing<br />
inconsistencies <strong>and</strong> clarifying wording. <strong>The</strong>re are separate transitional provisions for each st<strong>and</strong>ard.<br />
IAS 1 Presentation of Financial Statements<br />
Assets <strong>and</strong> liabilities classified as held for trading in accordance with IAS 39 Financial Instruments: Recognition <strong>and</strong><br />
Measurement are not automatically classified as current in the statement of financial position. <strong>The</strong> <strong>Group</strong> amended its<br />
accounting policy accordingly <strong>and</strong> analysed whether Management’s expectation of the period of realisation of financial assets<br />
<strong>and</strong> liabilities differed from the classification of the instrument. This did not result in any re-classification of financial<br />
instruments between current <strong>and</strong> non-current in the statement of financial position. Improvement does not have any impact on<br />
the <strong>Group</strong>s financial statements.<br />
IAS 8 Accounting Policies, Changes in Accounting Estimates <strong>and</strong> Errors<br />
Clarifies that only implementation guidance that is an integral part of an IFRS is m<strong>and</strong>atory when selecting accounting<br />
policies. Improvement does not have any impact on the <strong>Group</strong>s financial statements.<br />
IAS 10 Events after the Reporting Period<br />
Clarifies that dividends declared after the end of the reporting period are not obligations. Improvement does not have any<br />
impact on the <strong>Group</strong>s financial statements.<br />
IAS 16 - Property, Plant <strong>and</strong> Equipment<br />
Replaces the term “net selling price” with “fair value less costs to sell” to be consistent with IFRS 5 <strong>and</strong> IAS 36. <strong>The</strong><br />
Company/<strong>Group</strong> amended its accounting policy accordingly, which did not result in any change in its financial position.<br />
Items of property, plant <strong>and</strong> equipment held for rental that are routinely sold in the ordinary course of business after rental, are<br />
transferred to inventory when rental ceases <strong>and</strong> they are held for sale. Proceeds of such sales are subsequently shown as<br />
revenue. Cash payments on initial recognition of such items <strong>and</strong> the cash receipts from rents <strong>and</strong> subsequent sales are all<br />
shown as cash flows from operating activities.<br />
IAS 18 Revenue<br />
Replaces the term ‘direct costs’ with ‘transaction costs’ as defined in IAS 39.<br />
IAS 19 Employee Benefits<br />
Curtailments <strong>and</strong> negative past service costs<br />
Revises the definition of ‘past service costs’ to include reductions in benefits related to past services (‘negative past service<br />
costs’) <strong>and</strong> to exclude reductions in benefits related to future services that arise from plan amendments. Amendments to<br />
plans that result in a reduction in benefits related to future services are accounted for as a curtailment.<br />
Plan administration costs<br />
Revises the definition of ‘return on plan assets’ to exclude plan administration costs if they have already been included in the<br />
actuarial assumptions used to measure the defined benefit obligation.<br />
Replacement of term ‘fall due’<br />
Revises the definition of ‘short-term’ <strong>and</strong> ‘other long-term’ employee benefits to focus on the point in time at which the liability<br />
is due to be settled.<br />
Guidance on contingent liabilities<br />
Deletes the reference to the recognition of contingent liabilities to ensure consistency with IAS 37 Provisions, Contingent<br />
Liabilities <strong>and</strong> Contingent Assets.<br />
Improvement does not have any impact on the <strong>Group</strong>s financial statements.<br />
IAS 20 Accounting for Government Grants <strong>and</strong> Disclosures of Government Assistance<br />
Government loans with no interest or a below-market interest rate<br />
Loans granted with no or low interest rates will not be exempt from the requirement to impute interest. <strong>The</strong> difference between<br />
the amount received <strong>and</strong> the discounted amount is accounted for as a government grant. Improvement does not have any<br />
impact on the <strong>Group</strong>s financial statements.<br />
82
<strong>The</strong> <strong>Group</strong> <strong>KD</strong> <strong>Group</strong> Annual Report 2009<br />
Notes to Consolidated Financial Statements as at <strong>and</strong> for the year ended 31 December 2009<br />
IAS 23 – Borrowing Costs<br />
<strong>The</strong> definition of borrowing costs is revised to consolidate the two types of items that are considered components of<br />
‘borrowing costs’ into one - the interest expense calculated using the effective interest rate method calculated in accordance<br />
with IAS 39. <strong>The</strong> <strong>Group</strong> has amended its accounting policy accordingly. Improvement does not have any impact on the<br />
<strong>Group</strong>s financial statements.<br />
IAS 27 – Consolidated <strong>and</strong> Separate Financial Statements<br />
Measurement of a subsidiary held for sale in separate financial statements<br />
When a parent entity accounts for a subsidiary at fair value in its separate financial statements, this treatment continues when<br />
the subsidiary is subsequently classified as held for sale. Improvement does not have any impact on the <strong>Group</strong>s financial<br />
statements.<br />
IAS 28 - Investments in Associates<br />
Required disclosures when investments in associates are accounted for at fair value through profit or loss<br />
If an associate is accounted for at fair value through profit or loss, only the requirement of IAS 28 to disclose the nature <strong>and</strong><br />
extent of any significant restrictions on the ability of the associate to transfer funds to the entity in the form of cash or<br />
repayment of loans applies.<br />
Impairment of investment in an associate<br />
An investment in an associate is a single asset for the purpose of conducting the impairment test - including any reversal of<br />
impairment. <strong>The</strong>refore, any impairment is not separately allocated to the goodwill included in the investment balance.<br />
Improvement does not have any impact on the <strong>Group</strong>s financial statements.<br />
IAS 29 – Financial Reporting in Hyperinflationary Economies<br />
Description of measurement basis in financial statements<br />
Revises the reference to the exception that assets <strong>and</strong> liabilities should be measured at historical cost, such that it notes<br />
property, plant <strong>and</strong> equipment as being an example, rather than implying that it is a definitive list. Improvement does not have<br />
any impact on the <strong>Group</strong>s financial statements.<br />
IAS 31 - Interests in Joint Ventures<br />
Required disclosures when investments in jointly controlled entities are accounted for at fair value through profit or loss<br />
If a joint venture is accounted for at fair value, the only disclosure requirements of IAS 31 are those relating to the<br />
commitments of the venturer <strong>and</strong> the joint venture, as well as summary financial information about the assets, liabilities,<br />
income <strong>and</strong> expenses. Improvement does not have any impact on the <strong>Group</strong>s financial statements.<br />
IAS 34 – Interim Financial Reporting<br />
Clarifies that earnings per share is disclosed in interim financial reports if an entity is within the scope of IAS 33. Improvement<br />
does not have any impact on the <strong>Group</strong>s financial statements.<br />
IAS 36 Impairment of Assets<br />
Disclosure of estimates used to determine recoverable amount<br />
When discounted cash flows are used to estimate ‘fair value less costs to sell’, the same disclosures are required as when<br />
discounted cash flows are used to estimate ‘value in use’. Improvement does not have any impact on the <strong>Group</strong>s financial<br />
statements.<br />
IAS 38 – Intangible Assets<br />
Unit of production method of amortisation<br />
<strong>The</strong> improvement deletes references to there being rarely, if ever, persuasive evidence to support an amortisation method for<br />
finite life intangible assets that results in a lower amount of accumulated amortisation than under the straight-line method,<br />
thereby effectively allowing the use of the unit of production method. <strong>The</strong> <strong>Group</strong> reassessed the useful lives of intangible<br />
assets <strong>and</strong> found the straight-line method still applicable.<br />
Advertising <strong>and</strong> promotional activities<br />
Expenditure on advertising <strong>and</strong> promotional activities is recognised as an expense when the entity either has the right to<br />
access the goods or has received the services. Advertising <strong>and</strong> promotional activities now specifically include mail order<br />
catalogues. This amendment has no impact on the <strong>Group</strong>s financial statements.<br />
83
<strong>The</strong> <strong>Group</strong> <strong>KD</strong> <strong>Group</strong> Annual Report 2009<br />
Notes to Consolidated Financial Statements as at <strong>and</strong> for the year ended 31 December 2009<br />
IAS 39 Financial instruments: Recognition <strong>and</strong> Measurement<br />
Reclassification of derivatives into or out of the classification of at fair value through profit or loss<br />
Changes in circumstances relating to derivatives - specifically derivatives designated or de-designated as hedging<br />
instruments after initial recognition - are not reclassifications.<br />
When financial assets are reclassified as a result of an insurance company changing its accounting policy in accordance with<br />
paragraph 45 of IFRS 4 Insurance Contracts, this is a change in circumstance, not a reclassification.<br />
Designation <strong>and</strong> documentation of hedges at the segment level<br />
Removes the reference to a ‘segment’ when determining whether an instrument qualifies as a hedge.<br />
Applicable effective interest rate on cessation of fair value hedge accounting<br />
Requires use of the revised effective interest rate (rather than the original effective interest rate) when re-measuring a debt<br />
instrument on the cessation of fair value hedge accounting. Improvement does not have any impact on the <strong>Group</strong>s financial<br />
statements.<br />
IAS 40 – Investment property<br />
Property under construction or development for future use as investment property<br />
Revises the scope (<strong>and</strong> the scope of IAS 16 Property, Plant <strong>and</strong> Equipment) to include property that is being constructed or<br />
developed for future use as an investment property. Where an entity is unable to determine the fair value of an investment<br />
property under construction, but expects to be able to determine its fair value on completion, the investment under<br />
construction will be measured at cost until fair value can be determined or construction is complete.<br />
Revises the conditions for a voluntary change in accounting policy to be consistent with IAS 8. Clarifies that the carrying<br />
amount of investment property held under lease is the valuation obtained increased by any recognised liability.<br />
Improvement does not have any impact on the <strong>Group</strong>s financial statements.<br />
IAS 41 Agriculture<br />
A<strong>dd</strong>itional biological transformations<br />
Removes the prohibition to take into account cash flows resulting from any a<strong>dd</strong>itional transformations when estimating fair<br />
value. Instead, cash flows that are expected to be generated in the ‘most relevant market’ are taken into account.<br />
Discount rate for fair value calculations<br />
Removes the reference to the use of a pre-tax discount rate to determine fair value, thereby allowing use of either a pre-tax or<br />
a post-tax discount rate depending on the valuation methodology used. Improvement does not have any impact on the<br />
<strong>Group</strong>s financial statements.<br />
IFRS 5 Non-current Assets Held for Sale <strong>and</strong> Discontinued Operations<br />
Plan to sell the controlling interest in a subsidiary When a subsidiary is held for sale, all of its assets <strong>and</strong> liabilities will be<br />
classified as held for sale under IFRS 5, even when the entity retains a non-controlling interest in the subsidiary after the sale.<br />
This amendment is effective for periods commencing 1 July 2009. Improvement does not have any impact on the <strong>Group</strong>s<br />
financial statements.<br />
IFRS 7 Financial Instruments Disclosures<br />
Removes the reference to ‘total interest income’ as a component of finance costs. Improvement does not have any impact on<br />
the <strong>Group</strong>s financial statements.<br />
84
<strong>The</strong> <strong>Group</strong> <strong>KD</strong> <strong>Group</strong> Annual Report 2009<br />
Notes to Consolidated Financial Statements as at <strong>and</strong> for the year ended 31 December 2009<br />
Early application of IFRS <strong>and</strong> IFRIC's interpretations not yet effective<br />
<strong>Group</strong> has not early adopted any st<strong>and</strong>ards or interpretations issued <strong>and</strong> not yet effective.<br />
<strong>The</strong> following new <strong>and</strong> amended IFRIC will be adopted in future periods as required by International Financial<br />
Reporting St<strong>and</strong>ards:<br />
IFRIC 17 Distribution of Non-Cash Assets to Owners<br />
IFRIC 17 becomes effective for annual periods beginning on 1 July 2009. <strong>The</strong> interpretation provides guidance on how to<br />
account for non-cash distribution of assets to owners. <strong>The</strong> interpretation clarifies when an entity should recognize the liability,<br />
how it should be measured, <strong>and</strong> how to recognize <strong>and</strong> measure the related assets, as well as when such assets <strong>and</strong> liabilities<br />
should be derecognised in books of accounts.<br />
IFRIC 18 Transfers of Assets from Customers<br />
IFRIC 18 applies to transfers of assets from customers on or after 1 July 2009.<br />
<strong>The</strong> interpretation provides guidance on how to account for property, plant <strong>and</strong> equipment transferred from customers or cash<br />
received for acquisition or construction of certain assets. This guidance applies only to assets used by an entity to connect the<br />
customer to a network or to provide the customer with an ongoing access to a supply of goods, services or, in some cases, to<br />
do both. <strong>The</strong> entity must identify the service or services rendered <strong>and</strong> allocate the received payment (the fair value of assets)<br />
to each identifiable service. Revenue should be recognised on delivery or performance of each individual service by the entity.<br />
<strong>The</strong> following new <strong>and</strong> amended IFRIC’s will be adopted in future periods as required by International Financial<br />
Reporting St<strong>and</strong>ards <strong>and</strong> if adopted by the EU.<br />
IFRIC 19 Extinguishing Financial Liabilities with Equity Instruments<br />
<strong>The</strong> interpretation becomes effective on 1 July 2010 <strong>and</strong> provides guidance on how to account for the extinguishment of a<br />
financial liability by the issue of equity instruments (a debt for equity swaps). <strong>The</strong> interpretation clarifies how to measure <strong>and</strong><br />
recognise such swaps.<br />
<strong>The</strong> following new st<strong>and</strong>ards will be adopted in future periods as required by International Financial Reporting<br />
St<strong>and</strong>ards <strong>and</strong> the EU.<br />
IFRS 3R – Business Combinations <strong>and</strong> IAS 27R – Consolidated <strong>and</strong> Separate Financial Statements.<br />
<strong>The</strong> revised st<strong>and</strong>ards were issued in January 2008 <strong>and</strong> become effective for financial years beginning on 1 July 2009. IFRS<br />
3R introduces a number of changes in the accounting for business combinations that will impact the amount of goodwill<br />
recognised, the reported results in the period that an acquisition occurs, <strong>and</strong> future reported results. IAS 27R requires that a<br />
change in the ownership interest of a subsidiary is accounted for as an equity transaction. <strong>The</strong>refore, such a change will have<br />
no impact on goodwill, nor will it give raise to a gain or loss. Furthermore, the amended st<strong>and</strong>ard changes the accounting for<br />
losses incurred by the subsidiary as well as the loss of control of a subsidiary. <strong>The</strong> changes introduced by IFRS 3R <strong>and</strong> IAS<br />
27R must be applied prospectively <strong>and</strong> will affect future acquisitions <strong>and</strong> transactions with minority interests.<br />
IAS 39 – Financial Instruments: Recognition <strong>and</strong> Measurement – Eligible Hedged Items<br />
<strong>The</strong>se amendments to IAS 39 were issued in August 2008 <strong>and</strong> become effective for financial years beginning on or after 1<br />
July 2009. <strong>The</strong> amendment a<strong>dd</strong>resses the designation of a one-sided risk in a hedged item, <strong>and</strong> the designation of inflation as<br />
a hedged risk or portion in particular situations. It clarifies that an entity is permitted to designate a portion of the fair value<br />
changes or cash flow variability of a financial instrument as a hedged item.<br />
<strong>The</strong> following new <strong>and</strong> amended st<strong>and</strong>ards will be adopted in future periods as required by International Financial<br />
Reporting St<strong>and</strong>ards, if endorsed by the EU.<br />
IFRS 2 – Cash-Settled Share-Based Payment Transactions in the <strong>Group</strong><br />
Applicable for periods beginning on or after 1 January 2009.<br />
Amendments to IFRS 2 comprise three basic amendments: revised definition of share-based transactions <strong>and</strong> agreements,<br />
the scope of IFRS2, <strong>and</strong> a<strong>dd</strong>itional clarification of how to account for cash-settled share-based payment transactions in the<br />
group.<br />
IAS 32 Financial Instruments: Presentation, Classification of the Option to Purchase Shares Denominated in a Foreign<br />
Currency<br />
85
<strong>The</strong> <strong>Group</strong> <strong>KD</strong> <strong>Group</strong> Annual Report 2009<br />
Notes to Consolidated Financial Statements as at <strong>and</strong> for the year ended 31 December 2009<br />
Applicable for periods beginning on or after 1 February 2010.<br />
<strong>The</strong> amended St<strong>and</strong>ard allows an entity issuing puttable financial instruments denominated in foreign currency not to account<br />
for these rights as derivatives but rather to recognize the effects in the profit or loss. <strong>The</strong>se rights are classified as equity if<br />
they fulfil a number of specified criteria.<br />
IAS 24 – Related Party Disclosures<br />
Applicable for periods beginning after 1 January 2011<br />
Amendments to IAS 24 define in more detail <strong>and</strong> simplify definition of a related party. Furthermore the amended st<strong>and</strong>ard<br />
reduces the scope of disclosures of transactions of a government owned entity with the government <strong>and</strong> other government<br />
owned entities.<br />
IFRS 9 – Financial Instruments<br />
<strong>The</strong> St<strong>and</strong>ard replaces IAS 39 <strong>and</strong> is applicable for periods beginning on 1 January 2013. <strong>The</strong> first part of the st<strong>and</strong>ard<br />
introduces new requirements for classifying <strong>and</strong> measuring financial assets.<br />
Improvements to IFRSs<br />
In April 2009 the Board issued its second omnibus of amendments to its st<strong>and</strong>ards, primarily with a view to removing<br />
inconsistencies <strong>and</strong> clarifying wording. <strong>The</strong>re are separate transitional provisions for each st<strong>and</strong>ard. So far these<br />
amendments have not been endorsed by the EU.<br />
IFRS 2- Share-Based Payments – specification when to apply IFRS 2 <strong>and</strong> IFRS 3<br />
IFRS 5 – Non-current Assets Held for Sale – Disclosure<br />
IFRS 8- Operating Segments – Disclosure of Segments' assets<br />
IAS 1 –Presentation of Financial Statements – current/non-current liabilities for swap instruments<br />
IAS 7 – Statement of Cash Flows – classifying expenditure for unrecognized assets<br />
IAS 17 – Leases – classifying l<strong>and</strong> <strong>and</strong> buildings<br />
IAS 18 - Revenue – designation whether an entity acts as a principal or an agent<br />
IAS 36 – Impairment of Assets – the maximum unit to which goodwill may be attributed<br />
IAS 38 – Intangible Assets – amendments as a result of new IFRS 3 St<strong>and</strong>ard <strong>and</strong> amendments in relation to determining<br />
fair value<br />
IAS 39 – Financial Instruments – assessment of liquidating damages for prepayment of a credit as a derivative, cash flow<br />
hedges<br />
IFRIC 9 – Reassessment of Embe<strong>dd</strong>ed Derivatives – impact of IFRS 3 <strong>and</strong> IFRIC 9<br />
IFRIC 16 – Hedges of a Net Investment in a Foreign Operation– amendment of restriction to an entity allowed to have a<br />
hedge<br />
86
<strong>The</strong> <strong>Group</strong> <strong>KD</strong> <strong>Group</strong> Annual Report 2009<br />
Notes to Consolidated Financial Statements as at <strong>and</strong> for the year ended 31 December 2009<br />
2.2 Consolidated financial statements<br />
2.2.1 Assets <strong>and</strong> liabilities according to expected maturity<br />
(in EUR) 31.12.2009 31.12.2008<br />
Non current assets<br />
Financial assets 196,487,576 173,221,477<br />
Reinsurance contracts 4,603,946 5,085,554<br />
Insurance receivables <strong>and</strong> other receivables 10,207,953 19,036,827<br />
Other non current assets 188,573,505 214,316,570<br />
399,872,980 411,660,428<br />
Current assets<br />
Financial assets 143,107,973 155,394,457<br />
Reinsurance contracts 14,845,062 12,277,149<br />
Insurance receivables <strong>and</strong> other receivables 47,673,657 50,811,300<br />
Other current assets 96,248,250 86,261,854<br />
301,874,942 304,744,760<br />
Unit-linked investments of policyholders 146,036,822 78,607,121<br />
Total assets 847,784,744 795,012,309<br />
(in EUR) 31.12.2009 31.12.2008<br />
Non current liabilities<br />
Insurance contracts 150,387,932 136,122,771<br />
Investment contracts 17,654,644 16,272,396<br />
Financial liabilities 112,433,921 109,225,022<br />
Insurance liabilities <strong>and</strong> other liabilities 712,890 623,677<br />
281,189,387 262,243,866<br />
Current liabilities<br />
Insurance contracts 145,710,052 141,558,178<br />
Investment contracts 48,610 57,768<br />
Financial liabilities 82,271,608 72,332,881<br />
Insurance liabilities <strong>and</strong> other liabilities 30,797,545 33,003,864<br />
Other current liabilities 16,053,679 12,561,624<br />
274,881,494 259,514,315<br />
Unit-linked liabilities of policyholders 140,108,844 79,308,743<br />
Total liabilities 696,179,725 601,066,924<br />
2.2.2 Subsidiaries<br />
Subsidiaries are those companies for which the Company <strong>and</strong> its subsidiaries hold, directly or indirectly, more than one half of<br />
voting rights. Subsidiaries are fully consolidated from the date on which control is transferred to the <strong>Group</strong>. <strong>The</strong>y are deconsolidated<br />
from the date on which control of the Company ceases.<br />
<strong>The</strong> cost method of accounting is used to account for the acquisition of subsidiaries by measuring the acquisition value of the<br />
investment first. <strong>The</strong> cost of an acquisition is measured as the fair value of the assets given, equity instruments issued <strong>and</strong><br />
liabilities incurred or assumed at the date of exchange, plus costs directly attributable to the acquisition.<br />
87
<strong>The</strong> <strong>Group</strong> <strong>KD</strong> <strong>Group</strong> Annual Report 2009<br />
Notes to Consolidated Financial Statements as at <strong>and</strong> for the year ended 31 December 2009<br />
Identifiable assets acquired <strong>and</strong> liabilities <strong>and</strong> contingent liabilities assumed in a business combination are measured initially<br />
at fair value at the acquisition date. <strong>The</strong> excess of the cost of acquisition over the fair value of the <strong>Group</strong>’s share of the<br />
identifiable assets, liabilities <strong>and</strong> contingent liabilities is recorded as goodwill. If the cost of acquisition is less than the fair<br />
value of the <strong>Group</strong>’s share of net assets acquired, the difference is recognised directly in the income statement.<br />
Inter-company transactions, balances <strong>and</strong> unrealised gains on transactions as well as income, expenses <strong>and</strong> dividends<br />
between <strong>Group</strong> companies have been eliminated. Subsidiaries’ accounting policies have been changed or adequately<br />
restated where necessary to ensure consistency with the policies adopted by the <strong>Group</strong>. All Members of the <strong>Group</strong> have the<br />
same balance sheet date.<br />
2.2.3 Transactions <strong>and</strong> minority interests<br />
<strong>The</strong> <strong>Group</strong> applies a policy of treating transactions with minority interests as transactions with parties external to the <strong>Group</strong>.<br />
Purchases from minority interests result in goodwill (excess), being the difference between any consideration paid <strong>and</strong> the<br />
relevant share acquired of the carrying value of net assets of the subsidiary. Disposals of minority interests result in gains <strong>and</strong><br />
losses for the <strong>Group</strong> that are recorded in the income statement. Minority interests are disclosed as a separate item of the<br />
<strong>Group</strong>’s equity. Net profit or loss is divided into net profit (loss) of the majority owner <strong>and</strong> net profit (loss) of the minority<br />
owner.<br />
2.2.4 Associates<br />
Associates are all entities over which the <strong>Group</strong> has a significant influence but not control, generally accompanying a direct or<br />
indirect shareholding of between 20% <strong>and</strong> 50% of the voting rights. Investments in associates are accounted for under the<br />
equity method of accounting according to which such investments are initially recognised at cost <strong>and</strong> are subsequently<br />
increased or decreased by the <strong>Group</strong>’s share of the associate’s profit or loss. Dividends received from an associate reduce<br />
the carrying amount of the investment.<br />
<strong>The</strong> <strong>Group</strong>’s share of its associates’ post-acquisition profits or losses is recognised in the income statement. <strong>The</strong> <strong>Group</strong>’s<br />
share of post-acquisition movements in associates’ reserves is recognised as a movement in the <strong>Group</strong>’s reserves.<br />
If the <strong>Group</strong>’s share of losses of an associate equals or exceeds its interest in the associate, including unsecured receivables<br />
to the associate, the <strong>Group</strong> discontinues recognising its share of further losses unless the <strong>Group</strong> has any legal or other<br />
liabilities assumed on behalf of the associate. If the associate subsequently reports profits, the <strong>Group</strong> resumes recognising its<br />
share of those profits only after its share of the profits equals the share of losses not recognised.<br />
Unrealised gains on transactions between the <strong>Group</strong> <strong>and</strong> its associates are eliminated to the extent of the <strong>Group</strong>’s interest in<br />
the associates. Accounting policies of associates have been changed where necessary to ensure consistency with the<br />
policies adopted by the <strong>Group</strong>.<br />
<strong>The</strong> <strong>Group</strong>’s investments in the internally managed mutual funds where the <strong>Group</strong> has a significant influence are treated as<br />
investments in associated companies <strong>and</strong> are accounted for using the equity method. <strong>The</strong> unit-linked insurance funds are<br />
categorised as financial assets designated at fair value through profit or loss at inception as permitted by IAS 28, Investments<br />
in Associates (see Note 10).<br />
In the case of a gradual purchase of affiliated companies, the <strong>Group</strong> recognises goodwill or negative goodwill resulting from<br />
individual transactions. Negative goodwill is recognised in the profit or loss of the year during which the company became<br />
associated (the part that refers to purchases made in that year). Negative goodwill in connection with purchases made in the<br />
previous period however, is recognized directly in the retained earnings.<br />
88
<strong>The</strong> <strong>Group</strong> <strong>KD</strong> <strong>Group</strong> Annual Report 2009<br />
Notes to Consolidated Financial Statements as at <strong>and</strong> for the year ended 31 December 2009<br />
2.2.5 Subsidiaries<br />
Registered office<br />
Percentage of ownership<br />
Members of the <strong>Group</strong> – direct:<br />
<strong>KD</strong> Skladi d. o. o. Ljubljana Slovenia 100.00%<br />
<strong>KD</strong> Investments d. o. o. Zagreb Croatia 100.00%<br />
<strong>KD</strong> Investments a. d. Belgrade Serbia 100.00%<br />
SAI <strong>KD</strong> Investments s. a. Bucharest Romania 100.00%<br />
<strong>KD</strong> Investments plc Sofia Bulgaria 100.00%<br />
<strong>KD</strong> Investments Bratislava Slovakia 100.00%<br />
<strong>KD</strong> Banka d. d. Ljubljana Slovenia 100.00%<br />
<strong>KD</strong> Upravljanje imovinom d. o. o. Zagreb Croatia 100.00%<br />
<strong>KD</strong> Capital Management s. a. Bucharest Romania 100.00%<br />
<strong>KD</strong> Securities EAD, Sofia Bulgaria 100.00%<br />
<strong>KD</strong> Asset Management b. v. Amsterdam Netherl<strong>and</strong>s 100.00%<br />
<strong>KD</strong> Life d. d. Kiev Ukraine 100.00%<br />
<strong>KD</strong> Življenje d. d. Ljubljana Slovenia 100.00%<br />
<strong>KD</strong> Life Asigurari s. a., Bucharest Romania 100.00%<br />
<strong>KD</strong> Life a. d., Sofia Bulgaria 100.00%<br />
SC <strong>KD</strong> Fond De Pensii s. a. Bucharest Romania 99.00%<br />
Adriatic Slovenica d. d. Koper Slovenia 100.00%<br />
<strong>KD</strong> Kapital d. o. o. Ljubljana Slovenia 100.00%<br />
<strong>KD</strong> Private Equity d. o. o., Belgrade Serbia 100.00%<br />
R.E. Invest d. o. o. Ljubljana Slovenia 100.00%<br />
<strong>KD</strong> Kvart d. o. o. Ljubljana Slovenia 100.00%<br />
Coloseum Multiplex Holdings b. v., Amsterdam Netherl<strong>and</strong>s 100.00%<br />
Firsthouse Investments Ltd., Limassol Cyprus 100.00%<br />
Fontes <strong>Group</strong> d. o. o., Belgrade Serbia 100.00%<br />
Gea College d. d. Ljubljana Slovenia 66.57%<br />
World Life <strong>Group</strong> ltd., Limassol Cyprus 100,00%<br />
OOO Sarbon Invest, Taškent Uzbekistan 100,00%<br />
Members of the <strong>Group</strong> through subsidiaries<br />
ABDS d. d. Sarajevo Bosnia <strong>and</strong> Herzegovina 95.72%<br />
<strong>KD</strong> Finančna točka d. o. o. Ljubljana Slovenia 100.00%<br />
<strong>KD</strong> Fund Advisors LLC, Delaware United States 90.00%<br />
<strong>KD</strong> Financial point s. r. l. Bucharest Romania 100.00%<br />
ZAP d. o. o. Murska Sobota Slovenia 100.00%<br />
ČZD Kmečki Glas d. o. o. Ljubljana Slovenia 100.00%<br />
Vrtnarstvo Celje d. o. o. Celje Slovenia 50.46%<br />
VIB a. d. Banja Luka Bosnia <strong>and</strong> Herzegovina 51.00%<br />
Gea College PIC d. o. o. Ljubljana Slovenia 100.00%<br />
Gea College CVŠ d. o. o. Ljubljana Slovenia 100.00%<br />
<strong>KD</strong> Fondovi a. d. Skopje Bosnia <strong>and</strong> Herzegovina 85.00%<br />
<strong>KD</strong> Životno osiguranje d. d. Zagreb Croatia 100.00%<br />
AS Neživotno osiguranje a. d. o. Beograd Serbia 99.82%<br />
Manta Marine Ventures Ltd United States 100,00%<br />
<strong>KD</strong> Financijska točka d. o. o. Zagreb Croatia 100,00%<br />
<strong>KD</strong> Financial point, s. r. o. Bratislava Slovakia 100,00%<br />
<strong>KD</strong> Mark d. o. o. Ljubljana Slovenia 100,00%<br />
<strong>KD</strong> Financial point EOOD, Sofia Bulgaria 100,00%<br />
Vitavizia d. o. o., Ljubljana Slovenia 100,00%<br />
FM-NET d. o. o., Ljubljana Slovenia 100,00%<br />
Gama Holdings b. v., Amsterdam Netherl<strong>and</strong>s 100,00%<br />
OOO Kredo <strong>Group</strong>, Taškent Uzbekistan 99,97%<br />
Radio Kranj d. o. o., Kranj Slovenia 52,68%<br />
89
<strong>The</strong> <strong>Group</strong> <strong>KD</strong> <strong>Group</strong> Annual Report 2009<br />
Notes to Consolidated Financial Statements as at <strong>and</strong> for the year ended 31 December 2009<br />
2.3 Segment reporting<br />
Business <strong>and</strong> geographical segments are parts of the <strong>Group</strong>’s operations that are subject to different rates of profitability,<br />
opportunities for growth, future prospects <strong>and</strong> risks. A business segment is a distinguishable component of the <strong>Group</strong> that is<br />
engaged in providing a group of related products or services <strong>and</strong> that is subject to risks <strong>and</strong> returns that are different from<br />
those of other business segments. A geographical segment is a distinguishable component of the <strong>Group</strong> that is engaged in<br />
providing products or services within a particular economic environment <strong>and</strong> that is subject to risks <strong>and</strong> returns that are<br />
different from those of segments operating in other economic environments.<br />
2.4 Foreign currency translation<br />
Functional <strong>and</strong> presentation currency<br />
Items included in the financial statements of each of the <strong>Group</strong>’s entities are measured using the currency of the primary<br />
economic environment in which the entity operates (the "functional currency"). <strong>The</strong> consolidated financial statements are<br />
presented in euros, which is the <strong>Group</strong>’s presentation currency.<br />
Transactions <strong>and</strong> balances<br />
Foreign currency transactions <strong>and</strong> balances are translated into the functional currency using the exchange rates prevailing at<br />
the dates of the transactions. Foreign exchange gains <strong>and</strong> losses resulting from the settlement of such transactions <strong>and</strong> from<br />
the translation at year-end exchange rates of monetary assets <strong>and</strong> liabilities denominated in foreign currencies are recognised<br />
in the income statement.<br />
If the transaction is recognised directly in equity, exchange differences from the conversion to the functional currency are also<br />
recognised directly in equity. Exchange differences arising in respect of investments of the parent company in the capital of<br />
subsidiaries abroad are recognised directly in other comprehensive income, <strong>and</strong> recognised in the income statement only on<br />
disposal of the investments.<br />
Foreign currency monetary items are translated on the balance sheet date using the reference rate of ECB or Bank of<br />
Slovenia exchange rates (for currencies for which the ECB does not publish reference rates) on the last day of the year. Nonmonetary<br />
items that are measured in terms of historical cost in a foreign currency are translated using the mean exchange<br />
rate of the Bank of Slovenia applicable at the date of transaction, while non-monetary items that are measured at fair value in<br />
a foreign currency are translated using the reference rate of the ECB applicable at the date when the fair value was<br />
determined.<br />
In the context of changes in the fair value of monetary securities denominated in foreign currency classified as available for<br />
sale, translation differences resulting from changes in the amortised cost of the security <strong>and</strong> other changes in the carrying<br />
amount of the security are accounted for separately.. Translation differences related to changes in the amortised cost are<br />
recognised in profit or loss, whereas other changes in the carrying amount are recognised in other comprehensive income.<br />
Translation differences on non-monetary financial assets <strong>and</strong> liabilities are reported as part of the fair value gain or loss.<br />
Translation differences on non-monetary financial assets <strong>and</strong> liabilities, such as equities held at fair value through profit or<br />
loss, are recognised in profit or loss as part of the fair value gain or loss. Translation differences on non-monetary financial<br />
assets, classified as available for sale, are included in other comprehensive income.<br />
90
<strong>The</strong> <strong>Group</strong> <strong>KD</strong> <strong>Group</strong> Annual Report 2009<br />
Notes to Consolidated Financial Statements as at <strong>and</strong> for the year ended 31 December 2009<br />
<strong>Group</strong> companies<br />
<strong>The</strong> financial statements of all <strong>Group</strong> entities (none of which has the currency of a hyperinflationary economy) that have a<br />
functional currency different from the presentation currency of the <strong>Group</strong> are translated into the presentation currency as<br />
follows:<br />
- assets <strong>and</strong> liabilities for each balance sheet presented are translated at the reference rate of ECB or Bank of<br />
Slovenia exchange rates on the date of the balance sheet;<br />
- income <strong>and</strong> expenses for each income statement are translated at the average annual reference rate of ECB or<br />
Bank of Slovenia exchange rates;<br />
- all resulting exchange differences are recognised as a separate component of equity (reserves).<br />
Upon consolidation, exchange differences arising from the translation of the net investment in foreign entities are transferred<br />
to other comprehensive income. When a foreign operation is sold, such exchange differences are recognised in the income<br />
statement as part of the gain or loss on sale.<br />
2.5 Property, plant <strong>and</strong> equipment<br />
Property, plant <strong>and</strong> equipment are l<strong>and</strong>, buildings <strong>and</strong> equipment used by the <strong>Group</strong> for the performance of its activities.<br />
After initial recognition, property <strong>and</strong> equipment are carried at historical cost less accumulated depreciation <strong>and</strong> accumulated<br />
impairment losses, if any (cost model). Historical cost includes expenditure that is directly attributable to the acquisition of the<br />
items. Subsequent costs are included in the asset’s carrying amount or recognised as a separate asset, as appropriate, only<br />
when it is probable that future economic benefits associated with the item will flow to the <strong>Group</strong> <strong>and</strong> the cost of the item can<br />
be measured reliably. All other repairs <strong>and</strong> maintenance are charged to the income statement during the financial period in<br />
which they are incurred. If the cost of an item of property, plant <strong>and</strong> equipment is significant, it is allocated to its individual<br />
parts. If the parts are significant in relation to the total cost, <strong>and</strong> have different useful lives, each individual part of the asset is<br />
accounted for separately.<br />
An item of property <strong>and</strong> equipment is derecognised upon disposal or when no further economic benefits are expected from<br />
the asset. <strong>The</strong> gain or loss arising from derecognition of an item of property or equipment is determined as the difference<br />
between the disposal proceeds <strong>and</strong> the carrying amount of the item, <strong>and</strong> is recognised in other operating income or<br />
expenses.<br />
Depreciation<br />
<strong>The</strong> <strong>Group</strong> systematically allocates to profit or loss the cost less residual value (depreciable amount) over the useful life of<br />
each individual item of property, plant <strong>and</strong> equipment. <strong>The</strong> <strong>Group</strong> uses the straight-line depreciation method. L<strong>and</strong> is not<br />
depreciated.<br />
Depreciation is calculated individually.<br />
<strong>The</strong> useful lives are as follows:<br />
Property, plant <strong>and</strong> equipment<br />
Buildings<br />
Vehicles <strong>and</strong> machinery<br />
Furniture, fittings <strong>and</strong> equipment<br />
20 to 59 years<br />
3 to 10 years<br />
2 to 7 years<br />
<strong>The</strong> assets’ residual values <strong>and</strong> useful lives are reviewed at least once a year on the balance sheet date <strong>and</strong> restated if<br />
appropriate. If the asset’s recoverable amount is lower than its book value the asset is written down immediately to its<br />
recoverable amount <strong>and</strong> the impairment loss is recognised in the income statement. <strong>The</strong> recoverable amount is the higher of<br />
an asset's value in use <strong>and</strong> fair value less costs to sell (see Note 2.1.10).<br />
91
<strong>The</strong> <strong>Group</strong> <strong>KD</strong> <strong>Group</strong> Annual Report 2009<br />
Notes to Consolidated Financial Statements as at <strong>and</strong> for the year ended 31 December 2009<br />
2.6 Investment property<br />
Investment property is property (l<strong>and</strong> or a building, or part of a building, or both) held to earn rentals <strong>and</strong>/or for capital<br />
appreciation or both, rather than for administrative purposes or sale in the ordinary course of business. Investment property is<br />
initially measured at cost. After initial recognition, investment property of the <strong>Group</strong> is carried at its cost less accumulated<br />
depreciation <strong>and</strong> accumulated impairment losses, if any (cost model), i.e. the same as property, plant <strong>and</strong> equipment. <strong>The</strong><br />
<strong>Group</strong> reviews once a year the proportion of investment property obtained by other companies in the <strong>Group</strong> under lease<br />
agreements; in the consolidated balance sheet, the value of investmet property is recognised within the items of property,<br />
plant <strong>and</strong> equipment.<br />
<strong>The</strong> recognition <strong>and</strong> derecognition policies <strong>and</strong> methods of accounting for depreciation <strong>and</strong> impairment are defined under<br />
property, plant <strong>and</strong> equipment. <strong>The</strong> costs of day-to-day servicing of the investment property (repairs <strong>and</strong> maintenance) are<br />
expensed when incurred.<br />
2.7 Intangible assets<br />
After initial recognition, an intangible asset is carried at its cost less any accumulated amortisation <strong>and</strong> any accumulated<br />
impairment losses (cost model). An entity assesses whether the useful life of an intangible asset is finite or indefinite. If finite,<br />
it is amortised over its useful life. An intangible asset with an indefinite useful life is not amortised.<br />
Goodwill<br />
Goodwill represents the excess of the cost of acquisition over the fair value of the <strong>Group</strong>’s share of the net identifiable assets,<br />
liabilities <strong>and</strong> contingent liabilities of the acquired subsidiary, <strong>and</strong> is disclosed under intangible assets with an indefinite useful<br />
life.<br />
Goodwill on acquisition of subsidiaries is included in intangible assets <strong>and</strong> carried at cost less accumulated impairment<br />
losses. Goodwill on acquisitions of associates is included in investments in associates. Separately recognised goodwill is<br />
tested annually, <strong>and</strong> any impairment is recognised in the income statement. Impairment losses on goodwill are not reversed.<br />
Gains <strong>and</strong> losses on the disposal of an entity include the carrying amount of goodwill relating to the entity sold. Once a year<br />
the adequacy of the goodwill is reviewed <strong>and</strong> any impairment loss is recognised in the profit <strong>and</strong> loss account. <strong>The</strong> reversal of<br />
impairment of goodwill is not allowed. Gains <strong>and</strong> losses on disposal of subsidiaries also include the value of goodwill, which<br />
refers to the disposed subsidiary.<br />
Excess of fair value of the acquired identifiable assets, liabilities <strong>and</strong> contingent liabilities above the cost of their acquisition is<br />
reassessed, <strong>and</strong> any excess remaining after the reassessment is recognised as income in the income statement.<br />
Goodwill is allocated to cash-generating units for the purpose of impairment testing. Goodwill is allocated to the <strong>Group</strong>’s cashgenerating<br />
units that are expected to benefit from the synergies of the combination.<br />
Other intangible assets<br />
<strong>The</strong> <strong>Group</strong>’s intangible assets with a finite useful life include computer software <strong>and</strong> licences. <strong>The</strong> cost of acquired software<br />
comprises the costs of acquisition <strong>and</strong> preparation of the asset for its intended use, <strong>and</strong> for licences it is the cost of<br />
acquisition. Throughout the useful life of an individual item of an intangible asset the <strong>Group</strong> consistently allocates the amount<br />
of its amortisation to individual accounting periods as amortisation at that time. Amortisation is calculated using the straightline<br />
method.<br />
Amortisation is charged individually. <strong>The</strong> periods of amortisation of intangible assets with a finite useful life are the following:<br />
Intangible assets:<br />
Licences<br />
Computer software<br />
3 to 5 years<br />
3 to 5 years<br />
92
<strong>The</strong> <strong>Group</strong> <strong>KD</strong> <strong>Group</strong> Annual Report 2009<br />
Notes to Consolidated Financial Statements as at <strong>and</strong> for the year ended 31 December 2009<br />
2.8 Financial assets<br />
<strong>The</strong> <strong>Group</strong> classifies its financial assets in the following categories: financial assets at fair value through profit or loss; loans<br />
<strong>and</strong> receivables; held-to-maturity investments; <strong>and</strong> available-for-sale financial assets. Management determines the<br />
classification of its investments at initial recognition.<br />
2.8.1 Financial assets at fair value through profit or loss<br />
This category has two sub-categories: financial assets held for trading, <strong>and</strong> those designated at fair value through profit or<br />
loss at inception.<br />
A financial asset is classified as held for trading if it is acquired or incurred principally for the purpose of selling or<br />
repurchasing in the near term or if it is part of a portfolio of identified financial instruments that are managed together <strong>and</strong> for<br />
which there is evidence of a recent actual pattern of short-term profit-taking.<br />
Financial assets <strong>and</strong> financial liabilities are designated at fair value through profit or loss when:<br />
- doing so significantly reduces measurement inconsistencies that would arise if the related derivatives were treated<br />
as held for trading <strong>and</strong> the underlying financial instruments were carried at amortised cost for loans <strong>and</strong> advances to<br />
customers or banks <strong>and</strong> debt securities in issue; <strong>and</strong><br />
- certain investments, such as equity investments, are managed <strong>and</strong> evaluated on a fair value basis in accordance<br />
with a documented risk management or investment strategy <strong>and</strong> reported to key management personnel on that<br />
basis, <strong>and</strong> are designated at fair value through profit or loss.<br />
2.8.2 Held-to-maturity financial assets<br />
Held-to-maturity investments are non-derivative financial assets with fixed or determinable payments <strong>and</strong> fixed maturities that<br />
the <strong>Group</strong>’s management has the positive intention <strong>and</strong> ability to hold to maturity. If the <strong>Group</strong> were to sell other than an<br />
insignificant amount of held-to-maturity assets, the entire category would be reclassified as available for sale.<br />
2.8.3 Loans <strong>and</strong> receivables<br />
Loans <strong>and</strong> receivables are non-derivative financial assets with fixed or determinable payments that are not quoted on an<br />
active market, other than: (a) those that the entity intends to sell immediately or in the short term, which are classified as held<br />
for trading, <strong>and</strong> those that the entity upon initial recognition designates as at fair value through profit or loss; (b) those that the<br />
entity upon initial recognition designates as available for sale; or (c) those for which the holder may not recover substantially<br />
all of its initial investment, other than for reason of credit deterioration. If the loan is irrecoverable, it is written-off <strong>and</strong><br />
recognised in revaluation expenses - impairment of loans. Loans are considered to be irrecoverable when all the necessary<br />
procedures of recovery have been performed <strong>and</strong> the amount of loss can be determined. <strong>The</strong> subsequent repayments of<br />
debts written off reduce the impairment loss recognised in the income statement, providing the repayments are received in the<br />
current year; if not, they increase the revenue.<br />
2.8.4 Available-for-sale financial assets<br />
Available-for-sale investments are those intended to be held for an indefinite period of time, <strong>and</strong> which may be sold in<br />
response to needs for liquidity or changes in interest rates, exchange rates or equity prices.<br />
2.8.4.1. Recognition of financial assets<br />
Regular purchases <strong>and</strong> sales of financial assets at fair value through profit or loss, held to maturity <strong>and</strong> available for sale are<br />
recognised at the trade-date – the date on which the <strong>Group</strong> commits to purchase or sell the asset.<br />
Financial assets are initially recognised at fair value plus transaction costs for all financial assets not carried at fair value<br />
through profit or loss. Financial assets carried at fair value through profit or loss are initially recognised at fair value, <strong>and</strong><br />
transaction costs are expensed in the income statement. Financial assets are derecognised when the rights to receive cash<br />
flows from the financial assets have expired or where the <strong>Group</strong> has transferred substantially all risks <strong>and</strong> rewards of<br />
ownership. Financial liabilities are derecognised when they are extinguished − that is, when the obligation is discharged,<br />
cancelled or expires.<br />
93
<strong>The</strong> <strong>Group</strong> <strong>KD</strong> <strong>Group</strong> Annual Report 2009<br />
Notes to Consolidated Financial Statements as at <strong>and</strong> for the year ended 31 December 2009<br />
2.8.4.2. Measurement of financial assets<br />
Available-for-sale financial assets <strong>and</strong> financial assets at fair value through profit or loss are subsequently carried at fair value.<br />
Loans <strong>and</strong> receivables <strong>and</strong> held-to-maturity investments are carried at amortised cost using the effective interest method.<br />
Gains <strong>and</strong> losses arising from changes in the fair value of the "financial assets at fair value through profit or loss" category are<br />
included in the income statement in the period in which they arise. Gains <strong>and</strong> losses arising from changes in the fair value of<br />
available-for-sale financial assets are recognised directly inother comprehensive income, until the financial asset is<br />
derecognised or impaired. At this time, the cumulative gain or loss previously recognised in equity is recognised in profit or<br />
loss. However, interest calculated using the effective interest method <strong>and</strong> foreign currency gains <strong>and</strong> losses on monetary<br />
assets classified as available for sale are recognised in the income statement. Dividends on available-for-sale equity<br />
instruments are recognised in the income statement when the entity’s right to receive payment is established.<br />
<strong>The</strong> fair values of investments listed on active markets are based on current bid prices. If there is no active market for a<br />
financial asset, the <strong>Group</strong> establishes fair value using valuation techniques. <strong>The</strong>se include the use of recent arm’s length<br />
transactions, discounted cash flow analysis <strong>and</strong> other valuation techniques commonly used by market participants.<br />
2.9 Impairment of assets<br />
2.9.1 Impairment of financial assets<br />
(a) Financial assets carried at amortised cost<br />
<strong>The</strong> <strong>Group</strong> assesses at balance sheet date whether there is objective evidence that a financial asset or group of financial<br />
assets is impaired. A financial asset or a group of financial assets is impaired <strong>and</strong> impairment losses are incurred if, <strong>and</strong> only<br />
if, there is objective evidence of impairment as a result of one or more events that occurred after the initial recognition of the<br />
asset (a "loss event") <strong>and</strong> that a loss event (or events) has an impact on the estimated future cash flows of the financial asset<br />
or group of financial assets that can be reliably estimated. Objective evidence that a financial asset or group of assets is<br />
impaired includes observable data that comes to the attention of the <strong>Group</strong> about the following loss events:<br />
• significant financial difficulty of the issuer;<br />
• a breach of contract, such as a default or delayed payement of interest or principal amount;<br />
• the <strong>Group</strong> granting to the borrower, for economic or legal reasons relating to the borrower’s financial difficulty, a<br />
concession that the lender would not otherwise consider;<br />
• it is becoming probable that the borrower will enter bankruptcy or other financial reorganisation;<br />
• the disappearance of an active market for that financial asset because of financial difficulties; or<br />
• observable data indicating that there has been a measurable decrease in the estimated future cash flows from a<br />
group of financial assets since the initial recognition of those assets, although the decrease cannot yet be identified<br />
with the individual financial assets in the <strong>Group</strong>, including:<br />
- adverse changes in the payment status of borrowers in the <strong>Group</strong>; or<br />
- national or local economic conditions that correlate with defaults on the assets in the <strong>Group</strong>.<br />
<strong>The</strong> <strong>Group</strong> first assesses whether objective evidence of impairment exists individually for financial assets that are individually<br />
significant. If the <strong>Group</strong> determines that no objective evidence of impairment exists for an individually assessed financial<br />
asset, whether significant or not, it includes the asset in a group of financial assets with similar credit risk characteristics <strong>and</strong><br />
collectively assesses them for impairment. Assets that are individually assessed for impairment <strong>and</strong> for which an impairment<br />
loss is or continues to be recognised are not included in a collective assessment of impairment.<br />
If there is objective evidence that an impairment loss on loans <strong>and</strong> receivables or held-to-maturity investments carried at<br />
amortised cost has been incurred, the amount of the loss is measured as the difference between the asset’s carrying amount<br />
<strong>and</strong> the present value of estimated future cash flows (excluding future credit losses that have not been incurred) discounted at<br />
the financial asset’s original effective interest rate. <strong>The</strong> carrying amount of the asset is reduced through the use of an<br />
allowance account <strong>and</strong> the amount of the loss is recognised in the income statement. If a loan or held-to-maturity investment<br />
has a variable interest rate, the discount rate for measuring any impairment loss is the current effective interest rate<br />
determined under the contract. As a practical expedient, the <strong>Group</strong> may measure impairment on the basis of an instrument’s<br />
fair value using an observable market price. <strong>The</strong> calculation of the present value of the estimated future cash flows of a<br />
collateralised financial asset reflects the cash flows that may result from foreclosure less costs for obtaining <strong>and</strong> selling the<br />
collateral, whether or not foreclosure is probable.<br />
94
<strong>The</strong> <strong>Group</strong> <strong>KD</strong> <strong>Group</strong> Annual Report 2009<br />
Notes to Consolidated Financial Statements as at <strong>and</strong> for the year ended 31 December 2009<br />
For the purposes of a collective evaluation of impairment, financial assets are grouped on the basis of similar credit risk<br />
characteristics (using the valuation model of the <strong>Group</strong>, which takes into account the type of assets, industry, geographical<br />
location, type of investment, maturity <strong>and</strong> other relevant characteristics).<br />
Those characteristics are relevant to the estimation of future cash flows for groups of such assets by being indicative of the<br />
debtors’ ability to pay all amounts due according to the contractual terms of the assets being evaluated.<br />
Future cash flows in a group of financial assets that are collectively assessed for impairment are estimated on the basis of the<br />
contractual cash flows of the assets in the <strong>Group</strong> <strong>and</strong> historical loss experience, namely on the basis of similar credit risk<br />
exposure in the past. Historical loss experience is restated on the basis of current observable data to reflect the effects of<br />
current conditions that did not affect the period on which the historical loss experience is based <strong>and</strong> to remove the effects of<br />
conditions in the historical period that do not exist currently.<br />
Estimates of changes in future cash flows for groups of assets should reflect <strong>and</strong> be directly consistent with changes in<br />
related observable data from period to period (for example, changes in unemployment rates, property prices, payment status,<br />
or other factors indicative of changes in the probability of losses in the group <strong>and</strong> directly consistent with their magnitude). <strong>The</strong><br />
methodology <strong>and</strong> assumptions used for estimating future cash flows are reviewed regularly by the <strong>Group</strong> to reduce any<br />
differences between loss estimates <strong>and</strong> the actual loss .<br />
If, in a subsequent period, the amount of the impairment loss decreases <strong>and</strong> the decrease can be related objectively to an<br />
event occurring after the impairment was recognised (such as an improvement in the debtor’s credit rating), the previously<br />
recognised impairment loss is reversed by adjusting the allowance account. <strong>The</strong> amount of the reversal is recognised in the<br />
income statement.<br />
When an asset is uncollectible, it is written off against the allowance account for the asset. Such assets are written off after all<br />
the necessary procedures have been completed <strong>and</strong> the amount of the loss has been determined. Subsequent recoveries of<br />
amounts previously written off decrease the amount of the impairment charge in the income statement.<br />
(b) Financial assets classified as available for sale<br />
<strong>The</strong> <strong>Group</strong> assesses at each balance sheet date whether there is objective evidence that a financial asset or a group of<br />
financial assets is impaired. In the case of equity investments classified as available for sale, a significant or prolonged<br />
decline in the fair value below their cost, a maximum period of 9 months from the date when the fair value of equity<br />
instruments first fell below the purchase price <strong>and</strong> has remained below the total period of 9 months is taken into account,<br />
while in determination of a significant decrease in the assessment of fair value, the management takes into account at least<br />
40% reduction in the fair value.<br />
If any such evidence exists, the cumulative loss – measured as the difference between the acquisition cost <strong>and</strong> the current<br />
fair value, less any impairment loss on the financial asset previously recognised in profit or loss – is removed from equity <strong>and</strong><br />
recognised in the income statement. If, in a subsequent period, the fair value of a debt instrument classified as available for<br />
sale increases <strong>and</strong> the increase can be objectively related to an event occurring after the impairment loss was recognised in<br />
profit or loss, the impairment loss is reversed through the income statement.<br />
2.9.2 Impairment of non-financial assets<br />
Intangible assets which are not subject to amortisation are tested annually for impairment. Assets that are subject to<br />
amortisation are reviewed for impairment whenever events or changes in circumstances indicate that the carrying amount<br />
may not be recoverable. An impairment loss is recognised for the amount by which the asset’s carrying amount exceeds its<br />
recoverable amount. <strong>The</strong> recoverable amount is determined for an individual asset, unless the asset does not generate cash<br />
inflows that are largely independent of those from other assets or groups of assets. In such case, the recoverable amount is<br />
established for a cash-generating unit i.e. the smallest identifiable group of assets that generates cash inflows that are largely<br />
independent of the cash inflows from other assets or groups of assets. <strong>The</strong> criterion for determining the cash-generating units<br />
is the individual business area of the <strong>Group</strong>. <strong>The</strong> recoverable amount of an asset or a cash-generating unit is the higher of its<br />
fair value less costs to sell <strong>and</strong> its value in use.<br />
2.10 Inventories<br />
Inventories are stated at the lower of cost <strong>and</strong> net realisable value. Cost is determined using the weighted average cost<br />
method. Net realisable value is the estimated selling price in the ordinary course of business, less applicable variable selling<br />
expenses.<br />
95
<strong>The</strong> <strong>Group</strong> <strong>KD</strong> <strong>Group</strong> Annual Report 2009<br />
Notes to Consolidated Financial Statements as at <strong>and</strong> for the year ended 31 December 2009<br />
2.11 Offsetting financial instruments<br />
Financial assets <strong>and</strong> liabilities are offset <strong>and</strong> the net amount reported in the balance sheet only when there is a legally<br />
enforceable right to offset the recognised amounts <strong>and</strong> there is an intention to settle on a net basis, or to realise the asset <strong>and</strong><br />
settle the liability simultaneously.<br />
2.12 Cash <strong>and</strong> cash equivalents<br />
Cash <strong>and</strong> cash equivalents include cash in h<strong>and</strong> <strong>and</strong> dem<strong>and</strong> deposits held with banks. <strong>The</strong> <strong>Group</strong> reports cash flows from<br />
operating activities using the indirect method, whereby profit or loss is restated for the effects of transactions of a non-cash<br />
nature, any deferrals or accruals of past or future operating cash receipts or payments, <strong>and</strong> items of income or expense<br />
associated with investing or financing cash flows.<br />
2.13 Share capital <strong>and</strong> dividend distribution<br />
Ordinary <strong>and</strong> preference shares are equity. Incremental costs directly attributable to the issue of new shares or options or to<br />
the acquisition of a business are shown in equity as a deduction, net of tax, from the proceeds.<br />
Where the Company or another member of the <strong>Group</strong> purchases the Company's equity share capital, the consideration paid<br />
is deducted from total shareholders’ equity. Where such shares are subsequently sold or reissued, any consideration received<br />
is included in the shareholders’ equity.<br />
Dividends on ordinary <strong>and</strong> preference shares are recognised as a liability in the period in which they are approved by the<br />
Company's shareholders. Dividends for the year that are declared after the balance sheet date <strong>and</strong> before the financial<br />
statements are authorised for issue are disclosed in the subsequent events note (see Note 30).<br />
2.14 Insurance <strong>and</strong> investment contracts<br />
<strong>The</strong> <strong>Group</strong> issues contracts that transfer insurance risk or financial risk, or both. Insurance contracts are those contracts that<br />
transfer significant insurance risk. Such contracts may also transfer financial risk. As a general guideline, the <strong>Group</strong> defines<br />
as significant insurance risk the possibility of having to pay benefits on the occurrence of an insured event that are at least<br />
10% above the benefits payable if the insured event did not occur.<br />
Investment contracts are those contracts that transfer financial risk with no significant insurance risk.<br />
Traditional life insurance contracts <strong>and</strong> investment contracts include the possibility of discretionary participation in the positive<br />
result realised through management of assets from said contracts (hereinafter: DPF). <strong>The</strong> possibility of discretionary<br />
participation is a contractual right to a<strong>dd</strong>itional benefits supplementary to guaranteed benefits, namely:<br />
- benefits which are likely to represent a significant share of the total contract benefits;<br />
- benefits whose amount or time frame is specified by the insurer; <strong>and</strong><br />
- benefits which are contractually based on:<br />
• the success of a given category of contracts or certain types of contracts;<br />
• realised <strong>and</strong>/or unrealised investment returns on a specific pool of assets held by the issuer; or<br />
• the profit of the company, cover of assurance or other entity that issues the contract.<br />
Traditional life insurance contracts with DPF <strong>and</strong> investment contracts with DPF contain an agreed insurance sum or annuity<br />
(calculated under the premise of achieving a certain rate of return on accumulated assets) <strong>and</strong> an a<strong>dd</strong>itional possibility of the<br />
insured’s participation in the <strong>Group</strong>’s realised profits in the segments of life insurance <strong>and</strong> annuity insurance at the end of the<br />
financial period <strong>and</strong>/or with regard to the profitability of assets if higher than the pre-calculated amounts. <strong>The</strong> basis for<br />
determining the amounts of discretionary participation of the insured <strong>and</strong> the percentage vary between individual insurance<br />
products <strong>and</strong> are defined in the insurance terms.<br />
Insurance <strong>and</strong> financial life insurance contracts are defined as contracts with DPF because the interest rate used at the time<br />
of preparing the product <strong>and</strong> calculating the agreed insurance sum or annuity was lower than the expectations at the time with<br />
regard to commercial interest rates. A<strong>dd</strong>itional benefits for the policyholder were expected at the stage of preparing the<br />
insurance product, which represents a discretionary right to a<strong>dd</strong>itional benefits.<br />
96
<strong>The</strong> <strong>Group</strong> <strong>KD</strong> <strong>Group</strong> Annual Report 2009<br />
Notes to Consolidated Financial Statements as at <strong>and</strong> for the year ended 31 December 2009<br />
2.14.1 Insurance contracts<br />
2.14.1.1 Recognition <strong>and</strong> measurement<br />
<strong>The</strong> <strong>Group</strong> offers four main categories of insurance contracts, depending on the duration of risk <strong>and</strong> whether or not the terms<br />
<strong>and</strong> conditions are fixed:<br />
• Property insurance contracts<br />
• Health insurance contracts<br />
• Life insurance contracts with DPF<br />
• Unit-linked life insurance contracts<br />
2.14.1.2 Property insurance contracts<br />
This category includes accident insurance, insurance of l<strong>and</strong> vehicles, fire <strong>and</strong> other damage insurance, liability insurance,<br />
financial loss insurance, transport insurance, credit <strong>and</strong> suretyship insurance, <strong>and</strong> insurance of assistance <strong>and</strong> costs of<br />
procedures. This mainly involves short-term insurance contracts, with the exception of credit insurance.<br />
In accident insurance, in a<strong>dd</strong>ition to the basic insured risks such as disability <strong>and</strong> death, policyholders mainly opt for a<strong>dd</strong>itional<br />
insurance coverage such as daily accident insurance, daily insurance in the event of hospital treatment due to an accident,<br />
<strong>and</strong> daily insurance in the event of prolonged treatment in a medical facility due to an accident. In a<strong>dd</strong>ition to the<br />
aforementioned risks, an insurance policy may also be taken out for the event of death in a traffic accident, reimbursement of<br />
medical expenses, funeral costs in the event of the insured’s death, <strong>and</strong> reimbursement of accommodation costs for adult<br />
supervisors in the case of insuring schoolchildren.<br />
L<strong>and</strong> motor vehicle insurance covers material damage (partial or total loss of the vehicle’s value) which might result from<br />
traffic accidents, natural disasters, theft, fire, malicious acts <strong>and</strong> other insured risks.<br />
Car insurance falls under the category of m<strong>and</strong>atory traffic insurance <strong>and</strong> must be ensured by every owner of a motor vehicle<br />
prior to beginning to use the vehicle in traffic. This applies to all types of motor vehicles which require registration. <strong>The</strong> <strong>Group</strong><br />
reimburses the injured party for damages incurred as a result of the use or possession of the vehicle causing the damage.<br />
<strong>The</strong> insurance also provides coverage of property (destruction, accidental damage) as well as non-property damage (bodily<br />
injury, health conditions or death), providing the insured with total property security. <strong>The</strong> amount of indemnification is limited in<br />
both cases by the legally defined minimum insurance sum.<br />
Fire insurance covers real <strong>and</strong> moveable property from the risk of fire, lightning, explosion, hailstorm, windstorm, crash of the<br />
insured’s motor vehicle <strong>and</strong> work machinery, airplane crash <strong>and</strong> public manifestations <strong>and</strong> demonstrations. By special<br />
agreement <strong>and</strong> subject to an a<strong>dd</strong>itional premium, it is also possible to include insurance coverage in the event of flooding,<br />
water spill, l<strong>and</strong>slide, avalanche, spill of fluids or gases, self-combustion of inventories <strong>and</strong> spill of glowing mass in industrial<br />
environments. A<strong>dd</strong>itionally, insurance coverage can extend to earthquake <strong>and</strong> torrential flooding. Insurance can be taken out<br />
on new or actual value.<br />
In the context of the insurance category "Other indemnity insurance", the following subcategories are of significance<br />
according to the amount of the premium: home insurance for insuring domestic non-fixed assets, machinery malfunction to<br />
insure machinery <strong>and</strong> its parts, burglary insurance to insure moveable property from burglary <strong>and</strong> theft, building insurance,<br />
insurance of computers <strong>and</strong> glass.<br />
General liability insurance covers damages from indemnification claims enforced by third parties against the insured due to a<br />
su<strong>dd</strong>en event which resulted in damage to persons or things. <strong>The</strong> key element of this insurance category is insurance of<br />
general liability, including employer liability. Other important subcategories include: forwarding, manufacturer, project<br />
engineering, medical <strong>and</strong> accounting liability. To a smaller degree, other forms of professional liability insurance are traded:<br />
professional liability of attorneys, insurance agents, real estate agents, surveyors, members of management boards <strong>and</strong><br />
supervisory boards, liability of auditing firms <strong>and</strong> other legally prescribed professional liability insurance types.<br />
<strong>The</strong> category of financial loss insurance includes insurance for the event of halting the working process due to fire or machine<br />
breakage, <strong>and</strong> insurance of public events. <strong>The</strong> former are taken as a<strong>dd</strong>itional insurances against fire <strong>and</strong> machine breakage<br />
insurance, <strong>and</strong> events are insured independently. Insurance of halted production processes involves insurance of fixed costs<br />
which the insured was unable to cover due to the fire or machine breakage. By special agreement, insurance may also<br />
97
<strong>The</strong> <strong>Group</strong> <strong>KD</strong> <strong>Group</strong> Annual Report 2009<br />
Notes to Consolidated Financial Statements as at <strong>and</strong> for the year ended 31 December 2009<br />
include profits which the policyholder was unable to realise during the halt in production. Insurance of events covers damages<br />
incurred by the organiser in the event of cancellation of an event due to weather, <strong>and</strong> by special agreement also if the<br />
cancellation occurs as a result of natural or administrative force majeure, or due to fire or explosion.<br />
Transport insurance includes coverage of goods in domestic <strong>and</strong> international transport, comprehensive insurance of boats<br />
<strong>and</strong> airplanes, liability insurance of the owner or authorised user of the boat or airplane, insurance of the transporter’s liability<br />
in road traffic, insurance of the forwarding agent’s liability <strong>and</strong> insurance of maritime agents. <strong>The</strong> quote is also customised to<br />
fit the needs of the policyholder in the field of liability insurance, or in case of damage to goods under the FIATA bill of lading,<br />
<strong>and</strong> we also design <strong>and</strong> provide more specific insurance policies such as liability coverage for repairers of boats, marina <strong>and</strong><br />
harbour managers, <strong>and</strong> insurance of risk borne by constructors of boats <strong>and</strong> shipyards.<br />
Credit insurance marketed by the <strong>Group</strong> covers failure to pay contractual obligations for whatever reason <strong>and</strong> comprises<br />
insurance of commercial loans, insurance of loans for investment in real property, bank overdraft limits, etc. In the segment of<br />
suretyship insurance, the policyholder is provided with a guarantee for earnest deposits, good performance of works, repair of<br />
malfunctions during the warranty period, payment of customs duties, for the event of insolvency of tourist organisations, for<br />
ensuring the payment of goods <strong>and</strong> services acquired through use of a credit card, guarantees for TIR carnets, etc.<br />
Insurance of assistance costs provides the policyholder with emergency assistance either in relation to vehicles in the event of<br />
malfunction or traffic accident, or in relation to an apartment or house when normal residence is impossible due to the su<strong>dd</strong>en<br />
emergence of events, or when emergency assistance is needed when travelling abroad. In insuring the costs of procedures,<br />
the most important feature is the insurance of legal aid, which provides the policyholder with coverage of attorney fees.<br />
In all of the above contracts, premiums accrue when they become payable by the policyholder. Premiums contain all costs in<br />
a<strong>dd</strong>ition to premiums, including the agency fee, except taxes. <strong>The</strong> part of the premiums from valid insurance contracts which<br />
refers to unexpired insurance coverage on the balance sheet date is presented as unearned premium reserve <strong>and</strong> represents<br />
a liability of the <strong>Group</strong>. Accrued premiums less changes in unearned premium reserves are recognised as revenue.<br />
<strong>The</strong> amounts of damage <strong>and</strong> appraisal costs are recognised as liabilities at the time the claim was incurred. Claims incurred<br />
but not fully resolved as at the balance sheet date are recognised as provisions for claims. Liabilities for claims incurred <strong>and</strong><br />
reported as at the balance sheet date are formed on the basis of individual appraisal of claims. Liabilities for claims incurred<br />
but not reported as at the balance sheet date are assessed through statistical analysis. Liabilities for claims are further<br />
increased by the estimated costs of resolving such claims. Accrued indemnifications/insurance amounts, including costs of<br />
appraisal <strong>and</strong> resolution of cliams, increased by the difference of provisions for claims, are recognised as an expense.<br />
2.14.1.3 Health insurance contracts<br />
<strong>The</strong> <strong>Group</strong> offers three of the four types of optional health insurance as set forth by the Health Care <strong>and</strong> Health Insurance Act<br />
(ZZVZZ), namely supplementary health insurance, extra health insurance <strong>and</strong> parallel health insurance.<br />
Supplementary health insurance covers the difference between the health care costs under Art. 23 of ZZVZZ <strong>and</strong> the share of<br />
these costs which is covered under m<strong>and</strong>atory health insurance or part of this difference where the extra payable amount<br />
relates to the right to medical products included on the list of interchangeable medical products, medical aids <strong>and</strong> technical<br />
accessories.<br />
Extra health insurance covers the costs of health services <strong>and</strong> related services <strong>and</strong> supply of medical products <strong>and</strong> medical<br />
aids <strong>and</strong> technical accessories, <strong>and</strong> the costs involved in cash payouts which are not part of m<strong>and</strong>atory health insurance <strong>and</strong><br />
are not covered under supplementary or substitute health insurance.<br />
Parallel health insurance covers the costs of health services <strong>and</strong> related services, <strong>and</strong> supply of medical products <strong>and</strong><br />
medical aids <strong>and</strong> technical accessories which, although they constitute entitlement under m<strong>and</strong>atory health insurance, are<br />
pursued by the insured under alternative procedures <strong>and</strong> under different conditions than those regulated under m<strong>and</strong>atory<br />
health insurance.<br />
<strong>The</strong> <strong>Group</strong> concludes long-term insurance contracts on the basis of monthly or annual premiums.<br />
In a<strong>dd</strong>ition to the above, the <strong>Group</strong> also offers travel insurance abroad with assistance from CORIS, which covers the costs of<br />
medical treatment <strong>and</strong> emergency transport. <strong>The</strong>se insurance policies are short term in nature.<br />
<strong>The</strong> premium is recognised as revenue when the policyholder’s obligation to pay falls due. Premiums contain all costs in<br />
a<strong>dd</strong>ition to premiums, including the agency fee, except taxes. <strong>The</strong> part of the premiums from valid insurance contracts which<br />
98
<strong>The</strong> <strong>Group</strong> <strong>KD</strong> <strong>Group</strong> Annual Report 2009<br />
Notes to Consolidated Financial Statements as at <strong>and</strong> for the year ended 31 December 2009<br />
refers to unexpired insurance coverage on the balance sheet date is presented as unearned premium reserve. Accrued<br />
premiums less changes in unearned premium reserves are recognised as revenue.<br />
<strong>The</strong> amounts of claims <strong>and</strong> appraisal costs are recognised as an appraised liability at the time the claim was incurred. Claims<br />
incurred but not fully resolved as at the balance sheet date are recognised as provisions for claims. Provisions for claims<br />
incurred <strong>and</strong> reported as at the balance sheet date are formed on the basis of individual appraisal of claims. Provisions for<br />
claims incurred but not reported as at the balance sheet date are assessed through statistical analysis. Provisions for claims<br />
are further increased by the estimated costs of resolving such claims. Accrued indemnifications/insurance amounts, including<br />
costs of appraisal <strong>and</strong> resolution of claims, increased by the difference of provisions for claims, are recognised as an<br />
expense.<br />
Insurance companies offering supplementary health insurance are included in compensatory schemes under ZZVZZ, which<br />
offset the differences in the medical costs between different structures of insured with individual insurance companies with<br />
regard to gender <strong>and</strong> age. As a compensatory scheme payer, the <strong>Group</strong> recognises these expenses as damage expenses.<br />
2.14.1.4 Long-term insurance contracts with included guarantees <strong>and</strong> DPF<br />
<strong>The</strong>se contracts include contracts insuring events related to the insured’s life (e.g. death, maturity) over a longer period of<br />
time. <strong>The</strong> premium is recognised as revenue when the policyholder’s obligation to pay falls due. Premiums are disclosed<br />
before deduction of expenses.<br />
Liabilities stemming from the insurance contract are recorded as expenses as they are incurred.<br />
Liabilities for anticipated future contract entitlements are recorded at the recognition of premiums. For long-term life insurance<br />
contracts with included guarantees, the liabilities on the valuation date are formed in the amount of current values of the<br />
<strong>Group</strong>’s anticipated future liabilities less the current estimate of future premiums to be paid in on the basis of concluded<br />
insurance policies (prospective method). <strong>The</strong> <strong>Group</strong> uses reduction in insurance liabilities in terms of the Zillmer method. <strong>The</strong><br />
Zillmer method is an actuarial method used in traditional life insurance business for deferral of acquisition costs (reduction in<br />
mathematical provisions). <strong>The</strong> Zillmer amount for an individual contract does not exceed 3.5% of the insured sum. Negative<br />
mathematical provisions are set to 0.<br />
<strong>The</strong> assumptions used in the assessment of iabilities also take into account the risk adjustment.<br />
Liabilities also include liabilities connected with the distribution of a surplus to holders of life insurance policies. In accordance<br />
with the insurance terms, only a valid contract of mixed insurance <strong>and</strong> insurance in annuities which has been in place for at<br />
least 24 months at the end of the financial period is included in the distribution of a surplus.<br />
<strong>The</strong> surplus in endowment life insurances is a<strong>dd</strong>ed at the end of each year as an a<strong>dd</strong>itional premium, <strong>and</strong> consequently the<br />
sum insured is increased. An a<strong>dd</strong>itional insured sum is paid out in the event of death or maturity. For annuity insurance, the<br />
a<strong>dd</strong>ition of the surplus during the time of postponement of pension increases the agreed sum of the annuity. <strong>The</strong> surplus can<br />
be distributed due to higher yield of investments, under-mortality (over-mortality for annuities) or lower expenses than<br />
anticipated <strong>and</strong> provided for.<br />
In accordance with insurance terms, the distribution of profits attributable to life insurance is within the discretion of the<br />
management, which passes a resolution each year setting the amount of participation in the surplus. This amount is not<br />
specified in the internal regulations.<br />
In the case of insurance contracts with a single payment of the premium, or when the period of premium payments is shorter<br />
than the period during which the entitlements from the insurance contract are created, the surplus of premiums which have<br />
fallen due is deferred <strong>and</strong> recognised as revenue as <strong>and</strong> when entitlements from the insurance contract fall due, i.e. in<br />
accordance with anticipated future entitlements. Deferred revenue on the balance sheet date is recognised as a liability. For<br />
life insurance (with the exception of extra accident insurance policies), this part is recognised under liabilities from insurance<br />
contracts. For extra accident insurance policies, this part is disclosed as a liability for the unearned premium. <strong>The</strong> liability is<br />
formed using the pro-rata method for all insurance contracts which do not involve monthly payments <strong>and</strong> is calculated for<br />
each insurance contract individually.<br />
In the context of the remaining obligations under insurance contracts, the <strong>Group</strong> recognised liabilities for unexpired risks for<br />
insurance products of supplementary accident insurance, for which a sufficient amount of the premium was charged to cover<br />
the risk <strong>and</strong> cost.<br />
99
<strong>The</strong> <strong>Group</strong> <strong>KD</strong> <strong>Group</strong> Annual Report 2009<br />
Notes to Consolidated Financial Statements as at <strong>and</strong> for the year ended 31 December 2009<br />
As the <strong>Group</strong> has no reinsurance to partially cover its liabilities from such contracts, the reinsurance part of liabilities is zero<br />
as at 31 December 2009.<br />
Liabilities are calculated on the balance sheet date on the basis of the assumptions applicable at the time of concluding such<br />
contracts, or in certain cases on the assumptions which the <strong>Group</strong> adopted during the insurance term. <strong>The</strong> assumptions<br />
a<strong>dd</strong>itionally take into account an adjustment for unanticipated deviations.<br />
Liabilities from claims incurred <strong>and</strong> reported <strong>and</strong> from claims incurred but not reported represent estimated amounts for:<br />
• claims settled, but not paid out as of the balance sheet date;<br />
• incurred but not reported claims as of the balance sheet date (IBNR);<br />
• incurred but not fully reported claims as of the balance sheet date (IBNFR);<br />
• estimated expenses related to claims h<strong>and</strong>ling.<br />
Liabilities for reported but not yet resolved claims are recognised based on the estimated amount <strong>and</strong> are regularly reviewed.<br />
Accident insurance liabilities related to incurred but not reported claims are determined for accident insurance based on the<br />
statistical method, <strong>and</strong> for other life insurances based on the trend method.<br />
<strong>The</strong> liabilities also include expenses related to claims h<strong>and</strong>ling in the lump sum amount of 2.5% of total liabilities. Claims<br />
liabilities are not discounted. In accordance with the reinsurance contract, the <strong>Group</strong> discloses the reinsurance part of its<br />
liabilities attributable to claims as reinsurance assets.<br />
2.14.1.5 Long-term unit-linked insurance contracts<br />
Unit-linked insurance contracts cover insurance events referring to the life of the policyholder (in the event of death <strong>and</strong><br />
maturity) for a longer term. A unit-linked insurance contract is a contract where the contractual payments are invested in units<br />
of an internal or external investment fund selected by the policyholder. In accordance with accounting st<strong>and</strong>ards, the financial<br />
<strong>and</strong> insurance parts of the contract do not need to be separated, <strong>and</strong> their accounting does not need to be conducted<br />
separately. Liabilities arising from those contracts are recognised at fair value to income.<br />
<strong>The</strong> premium is recognised as revenue when the policyholder’s obligation to pay falls due. <strong>The</strong> <strong>Group</strong> discloses its liabilities to<br />
its policyholders under liabilities related to unit-linked insurance contracts, in accordance with the relevant individual insurance<br />
contract <strong>and</strong> product.<br />
Liabilities are increased by premiums <strong>and</strong> decreased by costs. Furthermore, the amount of liabilities takes into account<br />
changes in the value of fund unit prices <strong>and</strong> is reduced by the management fees <strong>and</strong> risk premium. In the event of<br />
redemption, the liabilities are reduced <strong>and</strong> the redemption value equals the <strong>Group</strong>’s liabilities less exit fees charged in the<br />
event of redemption or upon termination of insurance.<br />
It is assumed that the risk premiums charged in an individual time period for the expected population mortality are adequate to<br />
cover the insurance claims from entitlements in the event of death which exceed the value of units on individual personal<br />
accounts of the policyholders. A<strong>dd</strong>itional liabilities in regard of such claims are therefore not disclosed. <strong>The</strong> risk premium for<br />
an individual insurance contract is calculated on a monthly basis according to the asset value.<br />
For an individual long-term unit-linked life insurance contract, the balance of liabilities as at the balance sheet date equals the<br />
sum of the value of units on the balance sheet date, not evaluated net premiums paid, the revised claims <strong>and</strong> a<strong>dd</strong>itional<br />
liability. <strong>The</strong> balance also includes the revised claims, as the financial statements are prepared on the basis of the invoiced<br />
premium.<br />
<strong>The</strong> <strong>Group</strong> defers costs with regards to those relating to paid commission - that is, when the dynamics of the<br />
payment of fees is different from the dynamics of calculated acquisition costs. Commission costs are deferred only with<br />
regards to life insurance for which the Zillmer method is not applied in the calculation of liabilities. Nor is the Zillmer method<br />
applied where the dynamics of the payment of fees is consistent with the dynamics of accrued acquisition costs.<br />
2.14.1.6 Deferred policy acquisition costs (DAC)<br />
Commissions <strong>and</strong> other acquisition costs for unit-linked insurance contracts that vary with <strong>and</strong> are related to securing new<br />
contracts <strong>and</strong> renewing existing contracts are deferred <strong>and</strong> charged to the income statement in proportion to <strong>and</strong> over the<br />
100
<strong>The</strong> <strong>Group</strong> <strong>KD</strong> <strong>Group</strong> Annual Report 2009<br />
Notes to Consolidated Financial Statements as at <strong>and</strong> for the year ended 31 December 2009<br />
period when premium allocations to the unit-linked insurance liability are reduced for upfront charges. For property insurance<br />
contracts a proportional share of acquisition costs is deducted from the unearned premium reserves. For life insurance<br />
contracts with DPF <strong>and</strong> investment contracts with DPF, acquisition costs are deducted from mathematical provisions.<br />
.<br />
2.14.1.7 Liability adequacy test<br />
On each balance sheet date, contract liability adequacy tests are carried out. <strong>The</strong> <strong>Group</strong> assesses at each reporting date<br />
whether its recognised insurance liabilities are adequate, using current estimates of future cash flows under its insurance<br />
contracts, appraisal costs <strong>and</strong> administration costs, as well as financial income from the investments to cover these liabilities.<br />
If this estimate shows that the carrying amount of insurance liabilities is not appropriate in terms of estimated future cash<br />
flows, the entire amount of the deficit is recognised in the profit or loss.<br />
<strong>The</strong> liability adequacy test is done on the basis of recognised gross liabilities. <strong>The</strong> relevant insurance assets are considered<br />
separately. In carrying out the liability adequacy test, the insurance considers only liabilities which stem from contracts listed<br />
under the insurance contract category according to the st<strong>and</strong>ard. <strong>The</strong>se liabilities include liabilities for unearned premiums,<br />
liabilities from insurance contracts, deferred agency fee costs, claims liabilities <strong>and</strong> other liabilities.<br />
If the liability adequacy test indicates inadequate liabilities, the calculation of liabilities from such insurance contracts in future<br />
periods is done on the basis of the assumption of the test which showed inadequate disclosure of liabilities.<br />
2.14.1.8 Reinsurance contracts<br />
Contracts entered into by the <strong>Group</strong> with reinsurers under which the <strong>Group</strong> is compensated for losses on one or more<br />
contracts issued by the <strong>Group</strong> <strong>and</strong> that meet the classification requirements for insurance contracts are classified as<br />
reinsurance contracts held.<br />
<strong>The</strong> benefits to which the <strong>Group</strong> is entitled under its reinsurance contracts held are recognised as reinsurance assets. <strong>The</strong>se<br />
assets consist of short-term balances due from reinsurers, as well as long-term receivables that are dependent on the<br />
expected claims <strong>and</strong> benefits arising under the related reinsured insurance contracts. Amounts recoverable from or due to<br />
reinsurers are measured consistently with the amounts associated with the reinsured insurance contracts <strong>and</strong> in accordance<br />
with the terms of each reinsurance contract. Reinsurance liabilities are primarily premiums payable for reinsurance contracts<br />
<strong>and</strong> are recognised as an expense when due.<br />
<strong>The</strong> <strong>Group</strong> assesses its reinsurance assets for impairment on a regular basis. If there is objective evidence that the<br />
reinsurance asset is impaired, the <strong>Group</strong> reduces the carrying amount of the reinsurance asset to its recoverable amount <strong>and</strong><br />
recognises the impairment loss in the income statement.<br />
2.14.1.9 Receivables <strong>and</strong> payables related to insurance contracts<br />
Receivables <strong>and</strong> payables are recognised when due. <strong>The</strong>se include amounts due to <strong>and</strong> from agents, brokers <strong>and</strong> insurance<br />
contract holders. If there is objective evidence that the insurance receivable is impaired, the <strong>Group</strong> reduces the carrying<br />
amount of the insurance receivable accordingly <strong>and</strong> recognises that impairment loss in the income statement.<br />
2.14.1.10 Salvage <strong>and</strong> subrogation reimbursements<br />
Some insurance contracts permit the <strong>Group</strong> to sell (usually damaged) property acquired in settling a claim (i.e. salvage). <strong>The</strong><br />
<strong>Group</strong> may also have the right to pursue third parties for payment of some or all costs (i.e. subrogation).<br />
Estimates of salvage recoveries are included as an allowance in the measurement of the insurance liability for claims, <strong>and</strong><br />
salvage property is recognised in other assets when the liability is settled. <strong>The</strong> allowance is the amount that can reasonably<br />
be recovered from the disposal of the property.<br />
Subrogation reimbursements are also considered as an allowance in the measurement of the insurance liability for claims <strong>and</strong><br />
are recognised in other assets when the liability is settled. <strong>The</strong> allowance is the assessment of the amount that can be<br />
recovered from action against the liable third party.<br />
101
<strong>The</strong> <strong>Group</strong> <strong>KD</strong> <strong>Group</strong> Annual Report 2009<br />
Notes to Consolidated Financial Statements as at <strong>and</strong> for the year ended 31 December 2009<br />
2.14.2 Investment contracts<br />
Investment contracts are contracts which involve financial risk without significant insurance risk.<br />
All of the <strong>Group</strong>’s investment contracts include the option of discretionary participation, giving policyholders the right to<br />
participate in the generated surplus over the guaranteed returns through management of assets which relate to such<br />
investment contracts. <strong>The</strong> attribution of the generated surplus is the discretionary right of the management.<br />
In this category the <strong>Group</strong> includes voluntary supplementary pension insurance under the PN-A01 pension plan, <strong>and</strong> annuity<br />
contracts with specific periods of pay-ins <strong>and</strong> payouts with a fixed (technical) interest rate.<br />
Voluntary supplementary pension insurance is based on the Pension <strong>and</strong> Disability Insurance Act. It provides extra pension<br />
savings <strong>and</strong> ensures receiving pension benefits until death. <strong>The</strong> pension basis is a collective pension plan which a company<br />
subscribing to the collective insurance contract, wishing to take care of its employees, may join with a minimum of 51% of all<br />
employees. Through this type of insurance, employees of the company subscribing to the insurance contract invest in assets<br />
held in special personal pension accounts. <strong>The</strong> paid-in assets accrue interest with a guaranteed return which is at least 60%<br />
of the interest rate on long-term government securities with a maturity of more than one year. Based on accumulated assets,<br />
an a<strong>dd</strong>itional pension will be calculated when the insured retires. Each policy is entitled to the distribution of a surplus from<br />
higher returns than the guaranteed return, which is generated through the long-term business fund. <strong>The</strong> profit generated is<br />
distributed among the insured in the form of regular <strong>and</strong> final bonuses, as per the insurance conditions. <strong>The</strong> amount of the<br />
regular bonus is set each year by the management depending on the market value of assets held in the long-term business<br />
fund.<br />
Limited-time annuity insurance is a new form of savings which represents a source of income for a specific period, <strong>and</strong> the<br />
insured chooses the term of savings <strong>and</strong> the term of annuity payouts. <strong>The</strong> <strong>Group</strong> guarantees the payout of agreed annuities,<br />
which can be increased during the term of the contract at the expense of the insured’s participation in the profits realised<br />
within the insurance category.<br />
Premiums attributable to investment contracts with DPF are recognised in the same way as with life insurance contracts with<br />
DPF.<br />
At the end of the business year, the <strong>Group</strong> determines the DPF distribution based on the realised result/returns on the pool of<br />
assets relating to the investment contracts (DPF portion). This amount is a<strong>dd</strong>ed to the liabilities from investment contracts with<br />
DPF, <strong>and</strong> no unallocated DPF portion remains as of the end of the year.<br />
Obligations <strong>and</strong> revenue from financial contracts are calculated <strong>and</strong> recognised in the accounts in the same way as with the<br />
mixed life insurance component of the DPF.<br />
Where the resulting liability is lower than the sum of the amortised cost of the guaranteed element of the contract <strong>and</strong> the<br />
intrinsic value of the surrender option embe<strong>dd</strong>ed in the contract, it is restated <strong>and</strong> any shortfall is recognised immediately in<br />
the income statement.<br />
Unearned premium <strong>and</strong> claim reserves are calculated in the same manner as in the case of life insurance contracts with DPF.<br />
Mathematical reserves for annuities contracts for a limited time are calculated based on the prospective net Zillmer method.<br />
Its value is calculated as the current value of future payments of agreed annuities, including payment commissions, restated<br />
for the current value of future technical premiums that will be paid based on those annuity contracts.<br />
Mathemtical reserves from long-term pension insurance contracts are computed as the mathematical product of the value per<br />
unit of the long-term business fund <strong>and</strong> the number of units held on the reporting date. <strong>The</strong> calculation is made for each<br />
policy. This covers the liability to the policyholder. In a<strong>dd</strong>ition, the <strong>Group</strong> forms an a<strong>dd</strong>itional liability for surplus returns over<br />
the guaranteed returns (for attribution of regular <strong>and</strong> final bonuses).<br />
102
<strong>The</strong> <strong>Group</strong> <strong>KD</strong> <strong>Group</strong> Annual Report 2009<br />
Notes to Consolidated Financial Statements as at <strong>and</strong> for the year ended 31 December 2009<br />
2.15 Borrowings<br />
Borrowings are recognised initially at fair value, net of transaction costs incurred. Borrowings are subsequently stated at<br />
amortised cost; any difference between the amount at initial recognition <strong>and</strong> the redemption value is recognised in the income<br />
statement over the period of the borrowings using the effective interest method.<br />
Borrowings are classified as current liabilities unless the <strong>Group</strong> has an unconditional right to defer settlement of the liability for<br />
at least 12 months after the balance sheet date.<br />
If the <strong>Group</strong> purchases its own debt, it is removed from the balance sheet <strong>and</strong> the difference between the carrying amount of<br />
the liability <strong>and</strong> the consideration paid is included in investment income.<br />
2.16 Derivative financial instruments <strong>and</strong> accounting point of hedging<br />
Derivative financial instruments including futures <strong>and</strong> forwards, swaps <strong>and</strong> options are initially recognised at fair value on the<br />
balance sheet date. Fair values are obtained from quoted market prices on active markets, including recent market<br />
transactions, <strong>and</strong> valuation techniques, including discounted cash flow models <strong>and</strong> options pricing models, as appropriate. All<br />
derivatives are carried as assets when fair value is positive <strong>and</strong> as liabilities when fair value is negative.<br />
<strong>The</strong> method of recognising the resulting fair value gain or loss depends on whether the derivative is designated as a hedging<br />
instrument, <strong>and</strong> if so, the nature of the item being hedged. <strong>The</strong> <strong>Group</strong> uses derivative financial instruments for hedging future<br />
cash flows which are attributable to assets, liabilities <strong>and</strong> future business.<br />
From an accounting point of view, hedging is used only under specific conditions.<br />
<strong>The</strong> <strong>Group</strong> documents at the inception of the transaction the relationship between hedging instruments <strong>and</strong> hedged items, as<br />
well as its risk management objective <strong>and</strong> strategy for undertaking various hedging transactions. <strong>The</strong> <strong>Group</strong> also documents<br />
its assessment, both at hedge inception <strong>and</strong> on an ongoing basis, of whether the derivatives that are used in hedging<br />
transactions are expected to be <strong>and</strong> have been highly effective in offsetting changes in fair values or cash flows of hedged<br />
items. <strong>The</strong> <strong>Group</strong> assesses the success of hedging at the time of transaction <strong>and</strong> for the duration of hedging.<br />
Cash flow hedges<br />
<strong>The</strong> effective portion of changes in the fair value of derivatives that are designated <strong>and</strong> qualify as cash flow hedges is<br />
recognised in other comprehensive income. <strong>The</strong> gain or loss relating to any ineffective portion is recognised immediately in<br />
the income statement within net fair value gains on financial assets at fair value through profit or loss.<br />
Amounts recognised directly in other comprehensive income are recycled into the income statement in the periods in which<br />
the hedged item affects profit or loss.<br />
When a hedging instrument expires or is sold, or when a hedge no longer meets the criteria for hedge accounting, any<br />
cumulative gain or loss existing in equity at that time remains in other comprehensive income <strong>and</strong> is recognised when the<br />
forecast transaction is ultimately recognised in the income statement. However, when a forecast transaction is no longer<br />
expected to occur, the cumulative gain or loss that was reported in other comprehensive income is immediately transferred to<br />
the income statement.<br />
2.17 Trade payables<br />
Trade payables are recognised initially at fair value <strong>and</strong> subsequently measured at amortised cost using the effective interest<br />
rate method.<br />
2.18 Income tax<br />
2.18.1 Current tax<br />
<strong>The</strong> <strong>Group</strong> charges taxes in accordance with the provisions of the legislation applicable in individual countries in which the<br />
<strong>Group</strong>’s subsidiaries are located. In Slovenia, the corporate income tax rate for the year 2009 is 21%. In the year 2010 the tax<br />
rate will be 20%.<br />
103
<strong>The</strong> <strong>Group</strong> <strong>KD</strong> <strong>Group</strong> Annual Report 2009<br />
Notes to Consolidated Financial Statements as at <strong>and</strong> for the year ended 31 December 2009<br />
2.18.2 Deferred tax<br />
Deferred tax is provided in full, using the balance sheet liability method, on temporary differences arising between the tax<br />
bases of assets <strong>and</strong> liabilities <strong>and</strong> their carrying amounts in the consolidated financial statements. In accordance with the initial<br />
recognition exemption, deferred taxes are not recorded for temporary differences on initial recognition of an asset or a liability in<br />
a transaction other than a business combination if the transaction, when initially recorded, affects neither accounting nor taxable<br />
profit. Deferred income tax is determined using tax rates (<strong>and</strong> laws) that have been enacted or substantively enacted by the<br />
balance sheet date <strong>and</strong> are expected to apply when the related deferred tax asset is realised or the deferred tax liability is<br />
settled.<br />
Deferred tax assets are the amounts of taxable profits, which will be available in future periods for deductible temporary<br />
differences, unused tax losses <strong>and</strong> unused tax credits carried forward to the next period. Deferred tax liabilities are the<br />
amounts of tax to be paid in future periods depending on the taxable temporary differences. Deferred tax liabilities are<br />
recognised in full. Deferred tax assets <strong>and</strong> liabilities are not discounted <strong>and</strong> are offset if they relate to tax expense in the same<br />
tax authority <strong>and</strong> the companies of the <strong>Group</strong> have legally enforceable right to offset the assessed tax assets <strong>and</strong> tax<br />
liabilities.<br />
Deferred tax assets are recognised to the extent that it is probable that future taxable profit will be available against which the<br />
temporary differences can be utilised.<br />
<strong>The</strong> effects of recognising deferred tax assets <strong>and</strong> liabilities are recognised as income or expense in the <strong>Group</strong>’s income<br />
statement unless the tax arises from a transaction that has been recognised directly other comprehensive incomeor a<br />
business combination.<br />
Deferred tax is provided on temporary differences arising from investments in subsidiaries <strong>and</strong> associates, except where the<br />
<strong>Group</strong> controls the timing of the reversal of the temporary difference <strong>and</strong> it is probable that the temporary difference will not be<br />
reversd in the foreseeable future.<br />
2.19 Provisions for jubilees <strong>and</strong> post-employment benefits<br />
<strong>The</strong> <strong>Group</strong> provides benefits to employees as a legal obligation – jubilees <strong>and</strong> retirement benefit bonuses. According to<br />
Slovenian legislation, employees retire after 40 years of working life, at which time, if fulfilling certain conditions, they are<br />
entitled to benefits paid in a lump sum t. Employees are also entitled to jubilees for every 10 years of employment with the<br />
<strong>Group</strong>.<br />
<strong>The</strong> <strong>Group</strong> recognises all actuarial gains <strong>and</strong> losses immediately in the income statement.<br />
<strong>The</strong> future liabilities are calculated by an independent certified actuary. Key assumptions included in the calculation of<br />
provisions for jubilees <strong>and</strong> post-employment benefits are:<br />
- discount rate of 4.5%,<br />
- expected wage growth in the company <strong>and</strong> the expected wage growth due to promotions – 4.5%,<br />
- the estimated fluctuation rate according to historical data – the average rate of 4%.<br />
2.20 Revenue recognition<br />
Revenue comprises the fair value of the consideration received or receivable for the sale of goods <strong>and</strong> services, in the<br />
ordinary course of the <strong>Group</strong>’s activities. Revenue is shown net of value-a<strong>dd</strong>ed tax, returns, rebates <strong>and</strong> discounts <strong>and</strong> after<br />
elimination of sales within the <strong>Group</strong>. <strong>The</strong> <strong>Group</strong> recognises revenue when the amount of revenue can be reliably measured,<br />
it is probable that future economic benefits will flow to the entity <strong>and</strong> specific criteria have been met for each of the <strong>Group</strong>’s<br />
activities as described below. <strong>The</strong> amount of revenue is not considered to be reliably measurable until all contingencies<br />
relating to the sale have been resolved. <strong>The</strong> <strong>Group</strong> bases its estimates on historical results, taking into consideration the type<br />
of customer, the type of transaction <strong>and</strong> the specifics of each arrangement.<br />
Revenues are recognised as follows:<br />
(a) Sales of goods<br />
Sales of goods are recognised when a <strong>Group</strong> entity has delivered products to the customer <strong>and</strong> the customer has accepted<br />
the products. Revenue is recognised when it is probable that the economic benefits associated with the transaction will flow to<br />
the <strong>Group</strong> entity <strong>and</strong> the <strong>Group</strong> entity has transferred to the buyer the significant risks <strong>and</strong> rewards of ownership of the goods.<br />
104
<strong>The</strong> <strong>Group</strong> <strong>KD</strong> <strong>Group</strong> Annual Report 2009<br />
Notes to Consolidated Financial Statements as at <strong>and</strong> for the year ended 31 December 2009<br />
(b) Sales of services<br />
Sales of services are recognised in the accounting period in which the services are rendered, by reference to completion of<br />
the specific transaction assessed on the basis of the actual service provided as a proportion of the total services to be<br />
provided.<br />
(c) Interest income <strong>and</strong> expenses<br />
Interest income <strong>and</strong> expense for all interest-bearing financial instruments, except for those classified as held for trading or<br />
designated at fair value through profit or loss, are recognised within interest income <strong>and</strong> interest expense in the income<br />
statement using the effective interest method.<br />
<strong>The</strong> effective interest method is a method of calculating the amortised cost of a financial asset or a financial liability <strong>and</strong> of<br />
allocating the interest income or interest expense over the relevant period. <strong>The</strong> effective interest rate is the rate that exactly<br />
discounts estimated future cash payments or receipts over the expected life of the financial instrument or, when appropriate, a<br />
shorter period to the net carrying amount of the financial asset or financial liability. When calculating the effective interest rate,<br />
the <strong>Group</strong> estimates cash flows considering all contractual terms of the financial instrument (for example, prepayment<br />
options) but does not consider future credit losses. <strong>The</strong> calculation includes all fees <strong>and</strong> points paid or received between<br />
parties to the contract that are an integral part of the effective interest rate, transaction costs <strong>and</strong> all other premiums or<br />
discounts.<br />
Once a financial asset or a group of similar financial assets has been written down as a result of an impairment loss, interest<br />
income is recognised using the rate of interest used to discount the future cash flows for the purpose of measuring the<br />
impairment loss.<br />
(d) Dividend income<br />
Dividend income is recognised when the right to receive payment is established.<br />
(e) Premium income<br />
Income from insurance premiums includes net income from insurance premiums, calculated on the basis of gross written<br />
premiums accrued in the accounting period, less the share of gross written premiums ceded to the reinsurer <strong>and</strong> restated for<br />
changes in net unearned premium reserves.<br />
Income from insurance contracts is recognised as premium income in the following way:<br />
- Income arising from a single premium is recognised when the insurance policy is incepted <strong>and</strong> bills charged;<br />
- Income arising from long-term insurance contracts in which the premium is paid in instalments (monthly, quarterly,<br />
annually) is recognised upon the recognition of premium receivables.<br />
<strong>The</strong> premium charged by the <strong>Group</strong> covers transaction costs (the fees of concluding the contract, management <strong>and</strong><br />
collection) <strong>and</strong> represents income in the period of settlement. If a period of more than one year is concerned, a portion of the<br />
premium is deferred as a liability <strong>and</strong> transferred to income over the life of the contract.<br />
3. Significant accounting judgements, estimates <strong>and</strong> assumptions<br />
3.1 Significant accounting judgements, estimates <strong>and</strong> assumptions in applying accounting policies<br />
<strong>The</strong> <strong>Group</strong> makes estimates <strong>and</strong> assumptions that affect the reported amounts of assets <strong>and</strong> liabilities within the next<br />
financial year. Estimates <strong>and</strong> assumptions are continually evaluated <strong>and</strong> based on historical experience <strong>and</strong> other factors,<br />
including expectations of future events that are believed to be reasonable under the circumstances.<br />
3.1.1 Estimated impairment of goodwill<br />
<strong>The</strong> <strong>Group</strong> annually tests goodwill for potential impairment in accordance with the accounting policy stated in Note 2.7. <strong>The</strong><br />
recoverable amounts of cash-generating units have been determined based on value-in-use calculations. <strong>The</strong>se calculations<br />
require the use of estimates.<br />
3.1.2 Ultimate liability arising from claims made under insurance contracts<br />
<strong>The</strong> estimation of the ultimate liability arising from claims made under insurance contracts is the <strong>Group</strong>’s most critical<br />
accounting estimate. <strong>The</strong>re are several sources of uncertainty that need to be considered in the estimate of the liability that<br />
105
<strong>The</strong> <strong>Group</strong> <strong>KD</strong> <strong>Group</strong> Annual Report 2009<br />
Notes to Consolidated Financial Statements as at <strong>and</strong> for the year ended 31 December 2009<br />
the <strong>Group</strong> will ultimately pay for such claims. At each balance sheet date, liability adequacy tests are performed to ensure the<br />
adequacy of liabilities. In performing these tests, current best estimates of future contractual cash flows <strong>and</strong> claims h<strong>and</strong>ling<br />
<strong>and</strong> administration expenses, as well as investment income from the assets backing such liabilities, are used. Any deficiency<br />
is charged to profit or loss by establishing a provision for losses arising from liability adequacy tests.<br />
<strong>The</strong> <strong>Group</strong> performs the adequacy test of the obligations from insurance contracts on the balance sheet day.Through this test<br />
the <strong>Group</strong> revisits the adequacy of the insurance liabilities recognised. <strong>The</strong> test of provisions considers all the liabilities arising<br />
form insurance contracts <strong>and</strong> deferred acquisition costs. In the test the current estimates of the future cash flows form<br />
insurance contracts are applied.<br />
If the liability adequacy test shows deficit of the provisions recognised, the deficit is recognised as <strong>and</strong> increase of provision<br />
through the income statement.<br />
<strong>The</strong> liability adequacy test is performed separately for life <strong>and</strong> non-life insurances.<br />
Liability adequacy test for life insurance<br />
<strong>The</strong> test is carried out for each contract which was valid on the balance sheet date, <strong>and</strong> the outcome is summarised <strong>and</strong><br />
presented by insurance contract category.<br />
Expected cash flows are generated for:<br />
• premiums (life insurance contracts <strong>and</strong> extra accident insurance);<br />
• payout of damages (death, maturity, annuities, redemptions, accident loss);<br />
• costs (remaining commission fees, administrative fees, costs of claims);<br />
• revenue from investments.<br />
For individual future cash flows, the following items are taken into consideration:<br />
• provisions of individual insurance policies (amount of the premium, premium payment dynamics, amount of the<br />
insured sum in the event of death <strong>and</strong> maturity, amount of annuities);<br />
• technical bases of the relevant products (mortality tables, interest rate, initial fee costs, other administrative costs);<br />
• assumptions (the realised mortality rates for life insurance policies, mortality in annuity insurances, rates of<br />
redemption, future profitability, level of realised administrative costs, future inflation, damage outcome from accident<br />
insurance policies, profitability, etc.). Assumptions are individually explained.<br />
<strong>The</strong> cash flows for individual years (development up to 80 years) are discounted on the balance sheet date.<br />
Economic <strong>and</strong> operative assumptions<br />
1. Risk discount rate<br />
To calculate the present value of expected cash flows, the discount rate, shown by the curve of AAA-rated euro area central<br />
government bonds as at 4 January 2010 are taken into account.<br />
2. <strong>The</strong> rate of return on investments<br />
While peforming the LAT test for life <strong>and</strong> annuity insurance, the return on investment ranging from 4 to 5% for the first ten<br />
years <strong>and</strong> 5% for subsequent years was taken into account. <strong>The</strong> same dynamics of the return on investments, increased by<br />
1% was considered for insurance products with investment risk.<br />
3. Inflation<br />
<strong>The</strong> expected inflation rates (2%) are considered in the estimate of expected costs.<br />
4. Costs<br />
Costs of operations (administration, costs of payout of damages, etc.) are calculated on the basis of estimates contained in<br />
the technical bases of the product, multiplied by a factor which represents the estimate of expected realised costs compared<br />
to those calculated into the products, under the assumption that one half of the costs is not subject to inflation. Other costs are<br />
increased at the inflation rates.<br />
5. Mortality<br />
35% mortality tables werer considered for life insurance which was used as technical base of product (based on the <strong>Group</strong>´s<br />
10 years of experience). Based on this assumption, a small number of deaths <strong>and</strong> a small amount of payments in case of<br />
death is assumed compared with mortality based on technical grounds.<br />
106
<strong>The</strong> <strong>Group</strong> <strong>KD</strong> <strong>Group</strong> Annual Report 2009<br />
Notes to Consolidated Financial Statements as at <strong>and</strong> for the year ended 31 December 2009<br />
For annuities contracts, the <strong>Group</strong> used Austrian annuity tables from 1996 (this is a cautious estimation, which provides a<br />
lower mortality <strong>and</strong> longer life expectancy, which is also observed in the Slovenian population).<br />
6. Redemption rates<br />
Based on an analysis of redemptions of life insurance policies <strong>and</strong> investment risk insurance policies, the following rates of<br />
redemption are used:<br />
Year after<br />
Rate of buy-out<br />
agreement Life insurance<br />
Unitlinked<br />
0 17.00% 10.00%<br />
1 6.00% 5.00%<br />
≥2 3.00% 3.00%<br />
7. Claims from extra accident insurance contracts<br />
Based on historical data, the future claims from a<strong>dd</strong>itional accident insurance is estimated at 40% of the a<strong>dd</strong>itional accident<br />
insurance premium.<br />
Result of the adequacy test for 2008<br />
<strong>The</strong> LAT test has shown that the provisions formed as at 31 December 2008 are adequate for all long-term business funds.<br />
<strong>The</strong> liabilities calculated under the LAT test based on the best estimate as at 31 December 2008 are lower than the liabilities<br />
calculated by the Company using the aforementioned methodology <strong>and</strong> recognised in its financial statements.<br />
Life insurance<br />
With regard to life insurance with guarantee <strong>and</strong> DPF, liabilities do not increase enough at any upper sensitivity to lead to<br />
overstated liabilities as at 31 December 2009.<br />
For unit-linked life insurance, the adequacy test has shown that future liabilities will be covered from overstated liabilities <strong>and</strong><br />
future costs <strong>and</strong> premiums. This means that supplementary liabilities beside overstated liabilities are not disclosed. <strong>The</strong> same<br />
applies to all sensitivity tests which were carried out.<br />
Property <strong>and</strong> health insurance<br />
<strong>The</strong> <strong>Group</strong> has tested the adequacy of the provisioning for unearned premiums for property <strong>and</strong> health insurance contracts.<br />
<strong>The</strong> provisions for losses <strong>and</strong> provisions for bonuses, discounts <strong>and</strong> cancellations are calculated on the basis of the estimates<br />
made at the time of the calculation; hence it is deemed that the provisions formed for these liabilities have been made in the<br />
adequate amount.<br />
<strong>The</strong> liability adequacy test is therefore limited to the unexpired portion of active (in-force) contracts. It is performed by<br />
examining the difference between the expected amount of claims for losses <strong>and</strong> the expenses attributable to the unexpired<br />
portion of policies still in force at the balance sheet date <strong>and</strong> the amount of provisions formed for unearned premiums.<br />
For those classes of insurance where an inadequate amount of unearned premium provisions in relation to the expected loss<br />
event is determined, the <strong>Group</strong> forms a<strong>dd</strong>itional provisions for unexpired risk <strong>and</strong> recognises them in the financial statements<br />
as liabilities in the scope of other insurance technical provisions.<br />
Result of the adequacy test for 2009<br />
LAT test results have not shown any deficit in the amount of the obligations created under the unearned premiums, provisions<br />
for claims, reserves <strong>and</strong> provisions for bonuses <strong>and</strong> discounts for property <strong>and</strong> health insurance as at 31 December 2009.<br />
107
<strong>The</strong> <strong>Group</strong> <strong>KD</strong> <strong>Group</strong> Annual Report 2009<br />
Notes to Consolidated Financial Statements as at <strong>and</strong> for the year ended 31 December 2009<br />
3.1.3 Estimate of future benefit payments <strong>and</strong> premiums arising from long-term insurance contracts<br />
<strong>The</strong> determination of the liabilities under long-term insurance contracts is dependent on estimates made by the <strong>Group</strong>.<br />
Estimates are made as to the expected number of deaths for each of the years in which the <strong>Group</strong> is exposed to risk. <strong>The</strong><br />
<strong>Group</strong> bases these estimates on st<strong>and</strong>ard industry <strong>and</strong> national mortality tables that reflect recent historical mortality<br />
experience, restated where appropriate to reflect the <strong>Group</strong>’s own experience. For contracts that insure the risk of longevity,<br />
appropriate but not excessively prudent allowance is made for expected mortality improvements. <strong>The</strong> estimated number of<br />
deaths determines the value of the benefit payments <strong>and</strong> the value of the valuation premiums. <strong>The</strong> main source of uncertainty<br />
is that epidemics such as AIDS, SARS <strong>and</strong> wide-ranging lifestyle changes, such as in diet, smoking <strong>and</strong> exercise habits,<br />
could result in future mortality being significantly worse than in the past for the age groups in which the <strong>Group</strong> has significant<br />
exposure to mortality risk. However, continuing improvements in medical care <strong>and</strong> social conditions could result in<br />
improvements in longevity in excess of those allowed for in the estimates used to determine the liability for contracts where<br />
the <strong>Group</strong> is exposed to longevity risk.<br />
For long-term insurance contracts with fixed <strong>and</strong> guaranteed terms, estimates are made in two stages. Estimates of future<br />
deaths, voluntary terminations, investment returns <strong>and</strong> administration expenses are made at the inception of the contract <strong>and</strong><br />
form the assumptions used for calculating the liabilities during the life of the contract. A margin for risk <strong>and</strong> uncertainty is<br />
a<strong>dd</strong>ed to these assumptions. <strong>The</strong>se assumptions are "locked in" for the duration of the contract. New estimates are made<br />
each subsequent year in order to determine whether the previous liabilities are adequate in light of these latest estimates. If<br />
the liabilities are considered adequate, the assumptions are not altered. If they are not adequate, the assumptions are altered<br />
("unlocked") to reflect the best estimate assumptions. A key feature of the adequacy testing for these contracts is that the<br />
effects of changes in the assumptions on the measurement of the liabilities <strong>and</strong> related assets are not symmetrical. Any<br />
improvements in estimates have no impact on the value of the liabilities <strong>and</strong> related assets until the liabilities are<br />
derecognised, while significant enough deterioration in estimates is immediately recognised to make the liabilities adequate.<br />
3.1.4 Impairment of available-for-sale equity financial assets<br />
<strong>The</strong> <strong>Group</strong> determines that available-for-sale equity financial assets are impaired when there has been a significant or<br />
prolonged decline in the fair value below its cost. This determination of what is significant or prolonged requires judgement. In<br />
making this judgement the <strong>Group</strong> evaluates among other factors, the normal volatility in share price, the financial health of the<br />
investee, industry <strong>and</strong> sector performance, changes in technology <strong>and</strong> operational <strong>and</strong> financing cash flows. Impairment may<br />
be appropriate when there is evidence of deterioration in the financial health of the investee, industry <strong>and</strong> sector performance,<br />
changes in technology, <strong>and</strong> financing <strong>and</strong> operational cash flows.<br />
3.1.5 Impairment losses on loans <strong>and</strong> receivables<br />
In determining whether an impairment loss should be recorded in the income statement, the <strong>Group</strong> makes judgments as to<br />
whether there is any observable data indicating that there is a measurable decrease in estimated future cash flows. This<br />
evidence may include observable data indicating that there has been an adverse change in the payment status of borrowers<br />
in a group, or national or local economic conditions that correlate with defaults on assets in the group. Management uses<br />
estimates based on historical loss experience for assets with credit risk characteristics <strong>and</strong> objective evidence of impairment<br />
similar to that in the portfolio when scheduling its future cash flows. <strong>The</strong> methodology <strong>and</strong> assumptions used for estimating<br />
both the amount <strong>and</strong> timing of future cash flows are reviewed regularly to reduce any differences between loss estimates <strong>and</strong><br />
actual loss experience.<br />
3.1.6 Held-to-maturity investments<br />
<strong>The</strong> <strong>Group</strong> follows the guidance of IAS 39 when classifying non-derivative financial assets with fixed or determinable<br />
payments <strong>and</strong> fixed maturity as held to maturity. This classification requires significant judgement. In making this judgement,<br />
the <strong>Group</strong> evaluates its intention <strong>and</strong> ability to hold such investments to maturity. If the <strong>Group</strong> fails to keep these investments<br />
to maturity other than for specific circumstances – for example, selling an insignificant amount close to maturity – it will be<br />
required to reclassify the entire class as available for sale. <strong>The</strong> investments would therefore be measured at fair value <strong>and</strong> not<br />
at amortised cost.<br />
3.1.7 Employee benefits<br />
<strong>The</strong> employee benefits obligations (loyalty bonuses <strong>and</strong> retirement benefit bonuses) are measured using actuarial valuations;<br />
therefore, some actuarial estimates <strong>and</strong> assumptions are needed, such as rates of employee turnover, early retirement,<br />
discount rate <strong>and</strong> future salary levels.<br />
108
<strong>The</strong> <strong>Group</strong> <strong>KD</strong> <strong>Group</strong> Annual Report 2009<br />
Notes to Consolidated Financial Statements as at <strong>and</strong> for the year ended 31 December 2009<br />
3.1.8 Income taxes<br />
<strong>The</strong> <strong>Group</strong> is subject to income taxes in different jurisdictions. Some estimates are required in determining the amount of<br />
provisions for income taxes. <strong>The</strong>re are many transactions <strong>and</strong> calculations for which the ultimate tax determination is<br />
uncertain during the ordinary course of business. Due to changes in the future income tax rate, some estimates regarding the<br />
disposal of the available-for-sale portfolio have to be made by the management when calculating the deferred tax liability.<br />
A<strong>dd</strong>itionally, the management’s best estimates of future taxable profits are used for calculating the deferred tax assets<br />
regarding carry-forward tax losses.<br />
4. Comparatives<br />
During the review of the insurance company operating within the <strong>Group</strong>, which was performed by the Insurance Supervision<br />
Agency, it was found that some types of life insurance contracts <strong>and</strong> investment contracts were not kept in accordance with<br />
the policy’s terms <strong>and</strong> conditions regarding the participation of policyholders in the profits. <strong>The</strong> insurance company of the<br />
<strong>Group</strong> complied with the order <strong>and</strong> changed the methodology used for attributing profits, <strong>and</strong> restated all the amounts under<br />
the new methodology. A<strong>dd</strong>itional mathematical provisions were made for the attribution of profits for groups of contracts<br />
where the calculations under the new methodology were higher. <strong>The</strong> amount of these provisions as at 1 January 2009 stood<br />
at 1,824,016 euros. In 2009, the insurance company for the first time formed provisions resulting from guaranteed premium<br />
factors used to calculate the supplementary retirement pension. As at 1 January 2009, mathematical provisions for the<br />
entitlement total 261,323 euros.<br />
<strong>The</strong> insurance company made a<strong>dd</strong>itional provisions for investment contracts relating to attributed profits for groups of<br />
contracts where the calculations under the new methodology were higher. <strong>The</strong> amount of these provisions as at 1 January<br />
2009 amounted to 64,144 euros.<br />
In its financial statements, the <strong>KD</strong> <strong>Group</strong> eliminated the error by restating each individual category in the 2008 financial<br />
statements. Adjustments to the 2008 financial statements refer entirely to the reporting of life insurance segment, namely<br />
st<strong>and</strong>ard life insurances <strong>and</strong> investment insurances. In the process of eliminating the error, the amount of insurance technical<br />
provisions (mathematical provisions) <strong>and</strong> investment contracts for 2008 increased. <strong>The</strong> increase in mathematical provisions<br />
consequently resulted in reduction of retained earnings of 824,710 euros on the liabilities side, <strong>and</strong> increase of deferred tax<br />
assets of 219,227 euros on the assets side. <strong>The</strong> increase in investment contracts resulted in reduction of retained earnings of<br />
873,381 euros <strong>and</strong> increase in deferred tax assets of 232,165 euros.<br />
Given that the life insurance business at the end of 2008 showed a loss, this adjustment had no impact on the 2008 income<br />
statement, <strong>and</strong> the audited income statement for 2008 was not restated. However, the adjustment of the investment contracts<br />
for the past years did affect the 2008 income statement.<br />
Balance sheet<br />
2008 2008<br />
reported restatements- restated<br />
correction of<br />
(in EUR)<br />
past years<br />
Total assets 795,012,309 451,392 795,463,701<br />
Deferred income tax assets 20,207,937 219,227 20,427,164<br />
Income tax receivables 7,027,916 232,165 7,260,081<br />
Equity 193,945,385 (1,698,091) 192,247,294<br />
Retained earnings (8,597,223) (1,698,091) (10,295,314)<br />
Liabilities 294,044,113 2,149,483 296,193,596<br />
Insurance contracts 277,680,949 2,085,339 279,766,288<br />
Gross non-current insurance contracts with DPF 66,935,728 2,085,339 69,021,067<br />
Gross non current insurance contracts with DPF-math.prov.-guaranteed<br />
element 66,898,431 261,323 67,159,754<br />
Gross non-current insurance contracts with DPF-math.prov.-DPF element 37,297 1,824,016 1,861,313<br />
Investment contracts 16,330,164 64,144 16,394,308<br />
Investment contract with DPF 16,272,396 64,144 16,336,540<br />
Investment contracts with DPF-non-current-DPF element 11,857 64,144 76,001<br />
Total equity <strong>and</strong> liabilites 487,989,498 451,392 488,440,890<br />
109
<strong>The</strong> <strong>Group</strong> <strong>KD</strong> <strong>Group</strong> Annual Report 2009<br />
Notes to Consolidated Financial Statements as at <strong>and</strong> for the year ended 31 December 2009<br />
2007 2007<br />
reported restatement- restated<br />
correction of<br />
(in EUR)<br />
past years<br />
Total assets 956,047,402 232,165 956,279,567<br />
Income tax receivables 2,870,170 232,165 3,102,335<br />
Equity 340,264,367 (1,698,091) 338,566,276<br />
Retained earnings 58,565,835 (1,698,091) 56,867,744<br />
Liabilites 615,783,035 1,930,256 617,713,291<br />
Insurance contracts 255,943,534 2,085,339 258,028,873<br />
Gross non-current insurance contracts with DPF 62,547,906 2,085,339 64,633,245<br />
Gross non current insurance contracts with DPF-math.prov.-guaranteed<br />
element 61,340,938 261,323 61,602,261<br />
Gross non-current insurance contracts with DPF-math.prov.-DPF element 1,206,968 1,824,016 3,030,984<br />
Investment contracts 15,604,274 64,144 15,668,418<br />
Investment contract with DPF 15,512,160 64,144 15,576,304<br />
Investment contracts with DPF-non-current-DPF element 614,823 64,144 678,967<br />
Deferred tax 2,527,886 (219,227) 2,308,659<br />
Total equity <strong>and</strong> liabilities 487,989,498 232,165 488,221,663<br />
5. Risk management<br />
<strong>The</strong> <strong>Group</strong>’s activities expose it to a variety of risks: strategic risks, insurance <strong>and</strong> financial risks, operating risks <strong>and</strong> general<br />
business risks. Since the insurance represents a substantial part of the <strong>Group</strong>'s activities, the management of insurance<br />
risks is crucial for the <strong>Group</strong>.<br />
Strategic risks refer to the <strong>Group</strong>’s long-term development as much as to each of its subsidiaries. <strong>The</strong> management of the<br />
<strong>Group</strong> manages these risks, defining its vision <strong>and</strong> strategy <strong>and</strong> monitoring their appropriateness on a regular basis.<br />
According to the diversity of the <strong>Group</strong>’s activities, appropriate long-term investment decisions are the key factor when<br />
managing strategic risks. <strong>The</strong> corporate governance of the <strong>Group</strong> helps it to pursue long-term business development <strong>and</strong><br />
growth to achieve the required rate of return.<br />
<strong>The</strong> <strong>Group</strong> is exposed to financial risks through its financial assets <strong>and</strong> liabilities, reinsurance receivables <strong>and</strong> insurance<br />
liabilities. <strong>The</strong> principal financial risk is the possibility that the inflows from financial investments will not be sufficient to cover<br />
the outflows arising from insurance contracts. <strong>The</strong> most significant components of this risk are the risk of changes in interest<br />
rates <strong>and</strong> the prices of securities, currency risk <strong>and</strong> credit risk.<br />
<strong>The</strong> primary purpose of the financial risk management process is to maintain the stability of operations <strong>and</strong> reduce the<br />
exposure to individual risks to an acceptable level. Because of its highly diversified activities, the <strong>Group</strong> is mainly faced with<br />
insurance <strong>and</strong> financial risks.<br />
Risk management is a continuous cyclical process, which can be divided into three stages. In the first stage, potential risks<br />
are identified. In the second stage, individual risks are modelled <strong>and</strong> measured. <strong>The</strong>se models serve as a basis for measuring<br />
the level of exposure of individual companies in the <strong>Group</strong> <strong>and</strong> the <strong>Group</strong> itself to individual risks. On the basis of identification<br />
<strong>and</strong> measurement of risks in the <strong>Group</strong>, the management adopts adequate measures for reducing or controlling these risks<br />
(stage three). Measures used by the management vary <strong>and</strong> depend on the level of exposure <strong>and</strong> the type of risk.<br />
<strong>The</strong> management of the <strong>Group</strong> manages risks present in individual companies in the <strong>Group</strong> <strong>and</strong> at the level of the entire<br />
<strong>Group</strong>. It thereby sets guidelines concerning the balance between the risks, returns <strong>and</strong> capital, performs periodic controls,<br />
<strong>and</strong> sets guidelines for implementation of business policies <strong>and</strong> strategy for individual companies in the <strong>Group</strong>.<br />
Individual companies in the <strong>Group</strong> have established a system of reporting for the needs of the management that enables<br />
regular monitoring of risks to which they are exposed. <strong>The</strong> insurance companies in the <strong>Group</strong> have set up investment <strong>and</strong><br />
liquidity committees, which take care of the ALM function.<br />
110
<strong>The</strong> <strong>Group</strong> <strong>KD</strong> <strong>Group</strong> Annual Report 2009<br />
Notes to Consolidated Financial Statements as at <strong>and</strong> for the year ended 31 December 2009<br />
Types of risks<br />
5.1 Insurance risk<br />
Risk related to the insurance policy represents the possibility that the event insured against actually occurs <strong>and</strong> uncertainty in<br />
relation to the amount of the sum insured or indemnity. It is the nature of insurance contracts that insurance risks are<br />
incidental <strong>and</strong> unpredictable; however, the main risk for the insurer is the possibility that claims <strong>and</strong> benefits exceed the<br />
amount of insurance liabilities (technical provisions) created for a portfolio of insurance contracts using statistical methods.<br />
This may happen because of a change in the frequency of claims or their amount, which can be higher than expected.<br />
Insured events are incidental, which means that their number <strong>and</strong> amount vary in individual years <strong>and</strong> in relation to<br />
statistically established averages. Experience shows that the larger the portfolio of similar insurance contracts, the smaller the<br />
relative variability of the expected outcome will be. In a<strong>dd</strong>ition, a more diversified portfolio is less likely to be affected by a<br />
change in any subset of the portfolio.<br />
Insurance companies in the <strong>Group</strong> have developed their own policy of concluding insurance contracts with the aim of<br />
spreading the assumed risks <strong>and</strong> achieve, within each individual category, a sufficient amount of risk population to reduce the<br />
variability of expected results. <strong>The</strong> principal means for reducing insurance risks is reinsurance, i.e. the transfer of risks that<br />
exceed a predetermined amount to a reinsurance company.<br />
When developing a new insurance product, it is very important that the parameters defining the insurance premium are<br />
assessed adequately. <strong>The</strong> risk accepted by the <strong>Group</strong> at the inception of an insurance contract is reflected in the price, i.e.<br />
the insurance premium. If the parameters defining the insurance premium are not assessed adequately when developing a<br />
new insurance product, this is a risk for the <strong>Group</strong> to which it is exposed during the entire life cycle of the insurance product.<br />
In the context of insurance risk, the <strong>Group</strong> is exposed to underwriting process risk, product design risk, pricing risk, economic<br />
environment risk, policyholder behaviour risk, reserve risk <strong>and</strong> claims risk. Insurance risks are also managed with reinsurance<br />
protection.<br />
5.1.1 Description of risks<br />
Insurance activities are based on managing insurance risks. Insurance risks apply to risks accepted by the insurer from the<br />
policyholder. Insurance risks are r<strong>and</strong>om <strong>and</strong> unpredictable. At the signing of an insurance contract, the insurer accepts the<br />
risk to repay the insured the agreed contractual amount if an insured event occurs or if the contract expires, whereas when<br />
the insured event will occur is uncertain.<br />
Insurance cases are r<strong>and</strong>om; their number <strong>and</strong> amounts vary from year to year <strong>and</strong> deviate from statistical averages. <strong>The</strong><br />
<strong>Group</strong> is therefore engaged in diversifying <strong>and</strong> increasing its portfolio. This allows it to disperse the risk <strong>and</strong> lower the<br />
variability of expected events. An important instrument to lower insurance risks is reinsurance, i.e. the transfer of risks which<br />
exceed a predetermined amount to a reinsurer. <strong>The</strong> <strong>Group</strong> further manages insurance risks through the effective performance<br />
of internal controls, internal audits <strong>and</strong> forming appropriate insurance technical provisions to cover potential future liabilities<br />
stemming from existing insurance contracts.<br />
In the management’s opinion, the important risks faced by the <strong>Group</strong> in its operations are the following:<br />
- Underwriting process risk, the danger of misevaluation of accepted risk. This risk involves mistaken decisions to<br />
underwrite a risk regardless of the risk exposure of the insured, insurance on the basis of inaccurate <strong>and</strong> incomplete<br />
information on the insured, incorrect information about the amount of maximum potential claims, or potential inappropriate<br />
acquisition of reinsurance coverage by the reinsurer.<br />
<strong>The</strong> <strong>Group</strong> manages the aforementioned risk through providing guidelines for accepting insurance risks, using software for<br />
accepting insurance risks, <strong>and</strong> strict criteria <strong>and</strong> procedures for accepting insurance risks, especially for large insured sums<br />
<strong>and</strong> coverage. Also, the <strong>Group</strong> has concluded an obligatory reinsurance contract with its reinsurer, by which the reinsured<br />
risks over a certain contractually agreed insured sum are automatically reinsured. <strong>The</strong> <strong>Group</strong> also monitors claims outcome<br />
<strong>and</strong> analyses any worsening thereof.<br />
- <strong>The</strong> risk of inadequate assessment of liabilities stemming from insurance contracts (reserve risk) is the risk that these<br />
reserves will not be adequate to cover the liabilities stemming from accepted risks, or the risk that future claims payments will<br />
exceed the evaluated amount of liabilities.<br />
111
<strong>The</strong> <strong>Group</strong> <strong>KD</strong> <strong>Group</strong> Annual Report 2009<br />
Notes to Consolidated Financial Statements as at <strong>and</strong> for the year ended 31 December 2009<br />
<strong>The</strong> <strong>Group</strong> regularly checks the adequacy of liability calculations <strong>and</strong> the adequacy of assumptions used in the calculation of<br />
higher liabilities stemming from insurance contracts. <strong>The</strong> <strong>Group</strong> also carries out liability adequacy tests. If the liability<br />
adequacy test indicates that the liabilities are understated, they are increased.<br />
In the case of property insurance, an accurate estimate of the obligations of the reported <strong>and</strong> unreported claims is the most<br />
important factor, i.e. the assessment of liabilities assumed for any claims that are already registered, <strong>and</strong> obligations under<br />
insurance contracts for incurred but not reported claims (IBNR). Inaccurately estimated liabilities for reported claims also<br />
affect the calculation of IBNR. Contingencies may occur in the <strong>Group</strong> for which the obligations for claims were not designed<br />
(eg, in the past, asbestosis), or liability insurances, where there is a gap of a number of years between the conclusion of the<br />
insurance contract <strong>and</strong> the time when the claim is reported.<br />
For insurance contracts with DPF component <strong>and</strong> unit-linked insurance contracts, assumptions on future mortality, interest<br />
rates, contract terminations <strong>and</strong> administrative costs are applied. <strong>The</strong>se assumptions are used to determine liabilities<br />
stemming from the insurance contract. <strong>The</strong> assumptions also include a risk adjustment.<br />
For estimations on the mortality rate, mortality tables are used, as in the past the portfolio of insurance contracts has been too<br />
small for it to be able to rely on its own experience. Thus, for insurances for the event of death <strong>and</strong> insurances for the event of<br />
death <strong>and</strong> maturity, the <strong>Group</strong> uses Slovenian mortality tables made in 1990–1992, <strong>and</strong> for annuity insurance it uses Austrian<br />
annuity tables from the year 1996. In comparison with 2008, the <strong>Group</strong> has not changed its assumptions regarding population<br />
mortality. In the context of managing insurance risk, actuarial services are constantly checking the applied assumptions<br />
against the actual damage result, by individual insurance product.<br />
It is the management’s assessment that Slovenian mortality tables adequately reflect expectations with regard to the maturity<br />
<strong>and</strong> mortality rate of the Slovenian population.<br />
In its long-term insurance products, the <strong>Group</strong> uses interest rates spanning from 2.75% (new insurance products) to 4% (older<br />
products). <strong>The</strong> adequacy of returns on investments of insured liabilities in the future is checked on a regular basis.<br />
On each reporting date the assumptions are reset to reflect current assumptions <strong>and</strong> are used to check whether the liabilities<br />
have been adequately evaluated. If the liabilities are inadequate, the assumptions are changed to reflect the current state.<br />
Current assumptions do not contain a risk adjustment.<br />
<strong>The</strong> assumption on mortality is determined using the statistical mortality rate <strong>and</strong> analyses of actual mortality of the insurance<br />
portfolio in the past <strong>and</strong> current year. Also, in cases of disability, statistical tables <strong>and</strong> the insurer’s own experience are used.<br />
<strong>The</strong> <strong>Group</strong> also regularly analyses the duration of insurance contracts <strong>and</strong> monitors the movements of such durations over<br />
the period by main product <strong>and</strong>, as necessary, by sales channel if more significant deviations occur. <strong>The</strong>se analyses are used<br />
when estimating the duration of insurance contracts with a view to providing the best possible assessment of the insured’s<br />
behaviour.<br />
<strong>The</strong> return on investment affects the amount of future payouts from insurance contracts. When determining returns, the <strong>Group</strong><br />
considers government bonds as risk-free securities, <strong>and</strong> for other securities risk adjustments are applied. Considering this <strong>and</strong><br />
considering the structure of investments for covering liabilities, the expected returns of the investment portfolio are calculated.<br />
Future costs are determined on the basis of current costs. A<strong>dd</strong>itionally, the assumption of future inflation is also used, which is<br />
based on the EU’s long-term projections for the euro currency.<br />
- Pricing risk applies to the risk that the amount of the insurance premium is not adequate for covering the insurance<br />
liabilities stemming from claims <strong>and</strong> operating costs. <strong>The</strong> reasons can vary, e.g. unsuitable statistical data, inadequate<br />
assessment of claims events, low premium due to competition, unsuitable premium for new products, unsuitable mortality,<br />
annuity, morbidity tables, inadequate amount of expenses calculated into the price of the product. Furthermore, we can speak<br />
about the adequacy of the probability tables used, which further expose the <strong>Group</strong> to risks of natural death, longevity, critical<br />
illness <strong>and</strong> accident.<br />
Already in the new product planning stage, the <strong>Group</strong> diligently checks <strong>and</strong> acquires the necessary statistics to confirm the<br />
suitability of the assumptions used. In the case of high-risk products such as a<strong>dd</strong>itional coverage for critical illness, the<br />
<strong>Group</strong>’s general terms <strong>and</strong> conditions allow the possibility of subsequent changes in the amount of the insurance premium if<br />
new statistics or claims events indicate that the premium is too low. Similarly, the <strong>Group</strong> diligently monitors the amount of<br />
actual costs <strong>and</strong>, after analysing these costs, calculates the amount of costs to include in the price of individual products,<br />
112
<strong>The</strong> <strong>Group</strong> <strong>KD</strong> <strong>Group</strong> Annual Report 2009<br />
Notes to Consolidated Financial Statements as at <strong>and</strong> for the year ended 31 December 2009<br />
which depends on the type of product, special costs involved in the product, amount of commission to insurance agents <strong>and</strong><br />
other potential costs. <strong>The</strong> <strong>Group</strong> also measures <strong>and</strong> monitors the profitability of individual products.<br />
- Product design risk is the risk that, when calculating the insurance premium, the <strong>Group</strong> will be exposed to the danger of<br />
non-consideration of the potential for the occurrence of new diseases <strong>and</strong> accidents which could significantly affect the<br />
movement of future claims cases. This risk is important for life insurance.<br />
As previously mentioned in under-pricing risk, in certain higher-risk insurance products the <strong>Group</strong> does not guarantee the<br />
amount of the insurance premium during the insurance coverage period. In a<strong>dd</strong>ition to that, certain increases are used in the<br />
mortality <strong>and</strong> morbidity tables. <strong>The</strong> <strong>Group</strong> also follows mortality <strong>and</strong> morbidity trends. Certain modern illnesses are excluded<br />
from the insurance terms <strong>and</strong> conditions. In this context the <strong>Group</strong> has established cooperation with a reinsurer, which<br />
transfers certain knowledge <strong>and</strong> findings to the <strong>Group</strong>.<br />
- Cost risk is the risk for potential losses which could occur as the result of a misevaluation of costs when setting prices or a<br />
misevaluation of changed circumstances in the macroeconomic environment, which could cause excess growth in the<br />
<strong>Group</strong>’s operating costs.<br />
<strong>The</strong> procedures for managing risk related to unsuitable cost assessment are based on an established system of recording<br />
<strong>and</strong> allocating costs to cost centres <strong>and</strong> cost units, on constant monitoring of the movement of costs, <strong>and</strong> on adopting<br />
appropriate measures in case of unfavourable developments.<br />
- <strong>The</strong> risk that social circumstances will change so as to have an adverse effect on the <strong>Group</strong> can be classified under<br />
economic environment risk. Increase in the unemployment rate <strong>and</strong> reduction of purchasing power can cause more claims<br />
in credit insurance, fewer insurance contracts concluded, <strong>and</strong> more cancellations of life <strong>and</strong> pension insurance contracts. This<br />
group may also include the risk of changes in case law when adjudicating claims.<br />
- Policyholder behaviour risk – insurance fraud.<br />
- Claims risk involves the risk that claims will be higher than expected in number <strong>and</strong>/or amount, <strong>and</strong> the risk of an excessive<br />
portion of self-coverage due to inadequate reinsurance coverage, especially in cases of disasters.<br />
In life insurance contracts with coverage for the event of death, the number <strong>and</strong> amount of damages is most affected by<br />
epidemics <strong>and</strong> changes in lifestyle, such as a change in dietary habits, physical exercise or smoking. For life insurance<br />
contracts where the insured event is maturity, <strong>and</strong> for health insurance contracts, the greatest risk factor is the advancement<br />
of medicine <strong>and</strong> improvement of the population’s social status, increasing longevity.<br />
In property insurance a significant risk factor is climate change, which increases the frequency of extreme weather events<br />
(flooding, hail, etc.). For liability insurance characterised by lengthy procedures which can take several years for claims cases<br />
to be resolved, a significant risk factor is the increase of legal actions, especially involving non-material claims (coverage <strong>and</strong><br />
amount).<br />
In the interest of managing insurance risk, the <strong>Group</strong> has concluded reinsurance contracts whereby it transfers a portion of<br />
this risk to the reinsurer. Each financial year the management adopts a planned reinsurance programme, which includes<br />
calculations of all maximum own insurance shares by insurance category, as well as the maximum coverage table <strong>and</strong> certain<br />
procedures, bases <strong>and</strong> criteria for determining the maximum possible claims. <strong>The</strong> reinsurance programme consists of<br />
traditional proportional <strong>and</strong> non-proportional forms of reinsurance coverage, <strong>and</strong> it also includes a contract for the event of<br />
natural disasters.<br />
5.1.2. Frequency <strong>and</strong> amount of claims<br />
Concentration of insurance risk can stem from a single insurance contract or from a smaller number of contracts covering low<br />
probability events with high claims potential, such as insurance for earthquakes <strong>and</strong> other natural disasters.<br />
In insurance for the event of death, the greatest effects which can increase the frequency of claims are epidemics <strong>and</strong> lifestyle<br />
changes (e.g. changed dietary habits, exercise <strong>and</strong> smoking) which could lead to premature claims or greater claims than<br />
anticipated. For insurance contracts where the insured event is survival, the greatest risk factor is the advancement of<br />
medicine <strong>and</strong> improvement of the population’s social st<strong>and</strong>ard, increasing longevity.<br />
<strong>The</strong> insurance contract portfolio contains insurance contracts where the <strong>Group</strong> accepts the risk of coverage in the event of<br />
death. In cases of insurance coverage for the event of death, the <strong>Group</strong> guarantees coverage up to the insured sum during<br />
113
<strong>The</strong> <strong>Group</strong> <strong>KD</strong> <strong>Group</strong> Annual Report 2009<br />
Notes to Consolidated Financial Statements as at <strong>and</strong> for the year ended 31 December 2009<br />
the insurance coverage period. During the coverage period under a mixed life insurance contract, the <strong>Group</strong> guarantees the<br />
payment of the insured sum in the event of death or maturity.<br />
With a view towards managing the <strong>Group</strong>’s exposure to insurance risk, the management has concluded a reinsurance<br />
contract, transferring a part of the insurance risk onto the reinsurer.<br />
<strong>The</strong> following table represents the dispersal of the insurance portfolio <strong>and</strong> exposure to large insurers.<br />
Share of the largest insured in the joint insurance portfolio:<br />
(in EUR) 2009<br />
Total premium<br />
of the largest 10<br />
clients<br />
Share in total<br />
premium<br />
Total premium of<br />
the largest 100<br />
clients<br />
Share in total<br />
premium<br />
Life insurance 41,192 0.20% 211,265 1.02%<br />
Unit-linked insurance 630,256 0.61% 2,317,908 3.30%<br />
Property <strong>and</strong> health insurance 17,967,054 7.57% 31,457,854 13.26%<br />
Total 18,438,502 33,987,027<br />
(in EUR) 2008<br />
Total premium<br />
of the largest 10<br />
clients<br />
Share in total<br />
premium<br />
Total premium of<br />
the largest 100<br />
clients<br />
Share in total<br />
premium<br />
Life insurance 36,664 0.46% 194,245 2.44%<br />
Unit-linked insurance 343,860 0.56% 1,623,822 2.62%<br />
Property <strong>and</strong> health insurance 18,544,000 7.71% 32,118,000 13.36%<br />
Total 18,924,524 33,936,067<br />
Considering the fact that their share is relatively small in comparison with the overall portfolio, we can deduce that the <strong>Group</strong>’s<br />
portfolio is sufficiently diversified <strong>and</strong> that it is not overly exposed to a few large clients.<br />
In the property insurance segment, the risks to which the <strong>Group</strong> is exposed vary depending on the industry in which the<br />
insured is active. <strong>The</strong> table below shows the concentration of liabilities from property insurance by industry in which the<br />
insured is active. <strong>The</strong> maximum loss (maximum sum insured) shown is categorised by size into three categories.<br />
Concentration of the obligations arising from property insurance by industry at 31 December 2009<br />
2009 up to EUR 300,000 EUR 300,000 to EUR 1,000,000 more than EUR 1,000,000<br />
Without With Without With Without With<br />
reinsurance reinsurance reinsurance reinsurance reinsurance reinsurance<br />
Building risks 31,300,309 29,034,541 40,225,365 10,108,332 451,777,613 295,789,880<br />
Industrial risks 493,425,127 430,258,967 574,454,403 495,735,619 3,018,146,248 1,200,326,028<br />
Commercial risk 3,062,329,653 2,651,300,416 1,701,254,664 1,500,276,352 6,004,855,327 2,686,270,666<br />
Residential risks 5,881,968,324 5,383,250,336 459,985,246 411,253,262 2,657,343 1,080,000<br />
Total 9,469,023,413 8,493,844,259 2,775,919,677 2,417,373,563 9,477,436,531 4,183,466,574<br />
Concentration of the obligations arising from property insurance by industry at 31 December 2008<br />
2008 up to EUR 300,000 EUR 300,000 to EUR 1,000,000 more than EUR 1,000,000<br />
Without With Without With Without With<br />
reinsurance reinsurance reinsurance reinsurance reinsurance reinsurance<br />
Building risks 32,833 29,550 36,975 9,705 447,091 301,087<br />
Industrial risks 493,395 444,056 574,454 495,736 2,969,253 1,165,326<br />
Commercial risk 2,956,592 2,660,932 1,710,413 1,511,119 6,121,183 2,688,271<br />
Residential risks 5,930,560 5,337,504 455,885 406,375 2,657 1,080<br />
Total 9,413,380 8,472,042 2,777,728 2,422,934 9,540,185 4,155,764<br />
114
<strong>The</strong> <strong>Group</strong> <strong>KD</strong> <strong>Group</strong> Annual Report 2009<br />
Notes to Consolidated Financial Statements as at <strong>and</strong> for the year ended 31 December 2009<br />
In the life insurance segment, a potential concentration of insurance risk can be seen in contracts with extremely high sums<br />
insured.<br />
<strong>The</strong> table below indicates the concentration of insurance risk for life insurance, with the total sum insured risk categorised into<br />
four categories, depending on the amount of the insured sum involved in the individual insurance contract.<br />
Total sum insured risk of all contracts as at 31<br />
December 2009<br />
Without reinsurance With reinsurance<br />
EUR 0 – 9,999 424,310,970 417,283,571<br />
EUR 10,000 – 19,999 753,916,669 744,668,747<br />
EUR 20,000 – 29,000 520,037,388 508,974,241<br />
More than EUR 30,000 553,649,260 388,275,561<br />
Total 2,251,914,287 2,059,202,120<br />
Total sum insured risk of all contracts as at 31<br />
December 2008<br />
Without reinsurance With reinsurance<br />
EUR 0 – 9,999 507,089,621 501,727,298<br />
EUR 10,000 – 19,999 768,685,463 760,309,941<br />
EUR 20,000 – 29,000 477,139,967 467,031,052<br />
More than EUR 30,000 529,108,845 363,798,354<br />
Total 2,282,023,896 2,092,866,645<br />
For annuity insurance, we present risk concentration with total annual annuities classified into five categories, depending on<br />
the amount of the annual annuity per individual insured. As the annual annuity we consider the amount which the insured<br />
would receive if the contract was already due for payout.<br />
Structure of the amount of annual annuities<br />
(in EUR)<br />
Annual annuity per insured TOTAL ANNUAL ANNUITIES 2009 TOTAL ANNUAL ANNUITIES 2008<br />
on the final date of the year<br />
amount % amount %<br />
EUR 0 – 999<br />
810,094 14.66 794,917 14.71<br />
EUR 1,000 –1,999<br />
1,974,058 35.72 1,935,082 35.81<br />
EUR 2,000 – 2,999<br />
1,132,179 20.48 1,112,859 20.59<br />
EUR 3,000 – 3,999<br />
675,106 12.21 656,121 12.14<br />
More than EUR 4,000 935,550 16.93 904,941 16.75<br />
Total 5,526,987 100.00 5,403,920 100.00<br />
5.1.3 Property <strong>and</strong> health insurance contracts - assumptions <strong>and</strong> changes in assumptions<br />
a.) <strong>The</strong> process of determining assumptions<br />
<strong>The</strong> main assumptions which affect disclosure of liabilities stemming from property insurance contracts relate to establishing<br />
liabilities for claims. <strong>The</strong> overall calculation of reserves is based on estimates <strong>and</strong> assumptions by completing the<br />
development of incurred claims.<br />
115
<strong>The</strong> <strong>Group</strong> <strong>KD</strong> <strong>Group</strong> Annual Report 2009<br />
Notes to Consolidated Financial Statements as at <strong>and</strong> for the year ended 31 December 2009<br />
<strong>The</strong> calculation of provisions for claims is divided into two parts, considering the nature of individual claims:<br />
• Claims reported but not yet paid as at the balance sheet date<br />
On the basis of a review of all claims reported but not yet paid out as at the balance sheet date, an assessment is made on<br />
expected liabilities stemming from future payouts of individual claims. Larger cases of material claimsare appraised by inhouse<br />
appraisers, <strong>and</strong> non-material clams (e.g. liability claims) <strong>and</strong> claims in legal proceedings are assessed by in-house<br />
legal experts (lawyers). Liabilities from claims which are paid out in the form of annuities are assessed by the <strong>Group</strong> as the<br />
present value of future payouts, where a 2.6% discount factor is applied.<br />
• Claims incurred but not reported as at the balance sheet date (IBNR)<br />
IBNR liabilities are established on the level of insurance category using the triangle (chain la<strong>dd</strong>er) method or statistical<br />
method.<br />
<strong>The</strong> chain la<strong>dd</strong>er method can be based on recognised or accrued claims with monthly or annual development factors,<br />
depending on the characteristics of the incidence of loss <strong>and</strong> procedures for resolving claims. <strong>The</strong> claims are arranged in a<br />
triangle, where the rows represent the year the claims were incurred, <strong>and</strong> the columns represent the number of years from the<br />
time the clams were incurred to recognising or accrual of the claims. Prediction of final claims is based on the calculation of<br />
average annual development factors.<br />
<strong>The</strong> statistical method is based on reviewing past claims. <strong>The</strong> IBNR calculation is made on the level of individual insurance<br />
category as the mathematical product of the estimated number of IBNR damages <strong>and</strong> the estimated value of IBNR claims.<br />
<strong>The</strong> estimated number of IBNR claims reported after 1 January 2009 is calculated by multiplying the number of reported<br />
claims in 2008 by the average factor of claims reported later in relation to all reported claims over the past ten years. <strong>The</strong><br />
estimated value of IBNR claims equals the average value of IBNR claims in the past year or the average value of claims paid<br />
in the past year if there was a relatively small number of claims.<br />
b) Changes in assumptions<br />
<strong>The</strong>re were no changes in assumptions for insurance contracts in 2009 compared to 2008.<br />
c.) Development of claims<br />
<strong>The</strong> tables below show claims development for property insurance <strong>and</strong> extra accident insurance as part of life insurance<br />
policies.<br />
Property insurance (excluding voluntary health insurance) in EUR thous<strong>and</strong> for the year 2009<br />
Year in<br />
which<br />
claims<br />
were<br />
incurred<br />
Cumulative claim payments in relation to the number of years passed<br />
between the reporting date <strong>and</strong> date of payment<br />
0 1 2 3 4 5 6 7 8 9 10<br />
1999 29,121 41,968 45,344 47,052 48,042 48,690 49,363 49,705 50,006 50,185 50,472<br />
2000 30,890 45,437 48,806 50,788 51,569 52,024 52,538 52,897 53,220 53,509<br />
2001 33,180 50,050 54,080 56,386 57,373 57,930 58,636 59,178 59,606<br />
2002 33,403 51,210 54,992 57,189 57,811 58,524 59,181 59,509<br />
2003 38,141 58,733 64,094 66,976 68,168 69,026 69,902<br />
2004 47,218 69,325 73,273 75,673 77,070 77,991<br />
2005 47,541 69,220 74,561 77,632 79,124<br />
2006 46,268 73,223 78,161 81,129<br />
2007 61,395 86,894 93,231<br />
2008 66,077 98,471<br />
2009 62,421<br />
116
<strong>The</strong> <strong>Group</strong> <strong>KD</strong> <strong>Group</strong> Annual Report 2009<br />
Notes to Consolidated Financial Statements as at <strong>and</strong> for the year ended 31 December 2009<br />
Property insurance (excluding voluntary health insurance) in EUR thous<strong>and</strong> for the year 2008<br />
Year in<br />
which<br />
claims<br />
were<br />
incurred<br />
Cumulative claim payments in relation to the number of years passed between<br />
the reporting date <strong>and</strong> date of payment<br />
0 1 2 3 4 5 6 7 8 9<br />
1999 29,121 41,968 45,344 47,052 48,042 48,690 49,363 49,705 50,006 50,185<br />
2000 30,890 45,437 48,806 50,788 51,569 52,024 52,538 52,897 53,220<br />
2001 33,180 50,050 54,080 56,386 57,373 57,930 58,636 59,178<br />
2002 33,403 51,210 54,992 57,189 57,811 58,524 59,181<br />
2003 38,141 58,733 64,094 66,976 68,168 69,026<br />
2004 47,218 69,325 73,273 75,673 77,070<br />
2005 47,541 69,220 74,561 77,632<br />
2006 46,268 73,223 78,161<br />
2007 61,395 86,894<br />
2008 66,077<br />
Life insurance - extra accident insurance in EUR thous<strong>and</strong> for the year 2009<br />
Year in<br />
which<br />
claims<br />
were<br />
incurred<br />
Cumulative claim payments in relation to the number of years passed<br />
between the reporting date <strong>and</strong> date of payment<br />
0 1 2 3 4 5 6 7 8 9 10<br />
1999 294 516 556 598 624 625 625 625 626 626 626<br />
2000 284 473 540 558 558 558 568 568 568 568<br />
2001 242 477 552 602 610 615 619 619 619<br />
2002 233 432 492 520 531 538 538 538<br />
2003 151 246 300 319 324 325 325<br />
2004 182 293 319 330 331 332<br />
2005 196 396 462 483 517<br />
2006 278 552 636 675<br />
2007 302 534 655<br />
2008 336 673<br />
2009 294<br />
Life insurance - extra accident insurance in EUR thous<strong>and</strong> for the year 2008<br />
Year in<br />
which<br />
claims<br />
were<br />
incurred<br />
Cumulative claim payments in relation to the number of years passed between<br />
the reporting date <strong>and</strong> date of payment<br />
0 1 2 3 4 5 6 7 8 9<br />
1999 294 516 556 598 624 625 625 625 626 626<br />
2000 284 473 540 558 558 558 568 568 568<br />
2001 242 477 552 602 610 615 619 619<br />
2002 233 432 492 520 531 538 538<br />
2003 151 246 300 319 324 325<br />
2004 182 293 319 330 331<br />
2005 196 396 462 483<br />
2006 278 552 636<br />
2007 302 534<br />
2008 336<br />
117
<strong>The</strong> <strong>Group</strong> <strong>KD</strong> <strong>Group</strong> Annual Report 2009<br />
Notes to Consolidated Financial Statements as at <strong>and</strong> for the year ended 31 December 2009<br />
5.1.4. Long-term life insurance – assumptions, changes in assumptions <strong>and</strong> sensitivity<br />
a.) Procedure of establishing assumptions<br />
Liabilities from life insurance contracts with DPF were calculated using assumptions on future mortality from statistical tables.<br />
<strong>The</strong> portfolio of insurance contracts was too small in the past, so for the purpose of estimating mortality the following statistical<br />
tables are used:<br />
- for life insurance contracts with DPF, Slovenian morality tables from 1992 were used;<br />
- for annuity products, German mortality tables from 1987 were used<br />
- cancellations,<br />
- returns on investments (rate 2.6%-4%).<br />
<strong>The</strong>se assumptions are set at the time of concluding the contract <strong>and</strong> remain the same throughout the term of insurance, or<br />
safer assumptions are used in the calculation of liability to provide for the possibility of unfavourable deviation from<br />
expectations. An a<strong>dd</strong>itional adjustment is applied to these assumptions to account for risk <strong>and</strong> uncertainty.<br />
New estimates are made for each subsequent financial year for the purpose of checking the adequacy of liabilities determined<br />
in this manner. If it is determined that the established liabilities are adequate, assumptions remain unchanged. If the<br />
established liabilities prove to be inadequate, assumptions are revised to reflect new expectations. Consequently, the<br />
provisions are measured according to appropriate level.<br />
<strong>The</strong> assumptions used for insurance contracts described hereunder are as follows:<br />
• mortality<br />
Depending on the type of contract, the appropriate mortality table is chosen <strong>and</strong> adjusted to reflect actual mortality<br />
of the insurance portfolio in past years <strong>and</strong> the current period.<br />
• cancellations<br />
An analysis of the <strong>Group</strong>’s experience of the past three years is carried out by application of statistical methods, <strong>and</strong><br />
the appropriate cancellation percentage is determined. Cancellation percentages vary by type of product <strong>and</strong> term<br />
of the insurance period. <strong>The</strong> analysis is carried out in order to determine the best estimate of the policyholders’<br />
behaviour.<br />
• returns on investments<br />
<strong>The</strong> <strong>Group</strong> established assumptions for returns on investments by taking into account present returns on<br />
government-issued securities <strong>and</strong> other financial instruments on the market. In a<strong>dd</strong>ition to this, the structure of<br />
assets which are used to cover liabilities stemming from life insurance contracts (long-term business fund) is taken<br />
into consideration by determining weighted average returns.<br />
• costs<br />
Future costs are determined on the basis of current costs. <strong>The</strong> future inflation assumption was also applied.<br />
b.) Changes in assumptions<br />
In 2009 the <strong>Group</strong> made no changes in the assumptions used in the calculation of insurance contracts.<br />
118
<strong>The</strong> <strong>Group</strong> <strong>KD</strong> <strong>Group</strong> Annual Report 2009<br />
Notes to Consolidated Financial Statements as at <strong>and</strong> for the year ended 31 December 2009<br />
5.1.5. Sensitivity analysis<br />
<strong>The</strong> <strong>Group</strong> made a sensitivity analysis of net profits before taxes on the last day of the financial year, with consideration to<br />
various parameters.<br />
Sensitivity test – parameters<br />
Sensitivity factor<br />
Factor description<br />
Technical interest rate (insurance contracts only) Effect of a change of the technical interest rate by ±1%<br />
Effect on the increase/decrease of all costs except the costs of<br />
Costs <strong>and</strong> expenses<br />
acquisition by ±5%<br />
Mortality (life insurance only)<br />
Effect of a 5% increase in mortality<br />
Mortality in annuity insurance (pension <strong>and</strong> annuity<br />
insurance)<br />
Effect of a 5% decrease in mortality<br />
Claims ratio (property <strong>and</strong> health insurance only)<br />
Effect of a 5% increase in the claims ratio<br />
<strong>The</strong> above factors were used in actuarial <strong>and</strong> statistical models for calculating the changes of net profits of the <strong>Group</strong>. <strong>The</strong><br />
table below shows the effect of changes of key factors on the net earnings of the <strong>Group</strong> before taxes.<br />
Effect on the <strong>Group</strong>’s net profit before tax for 2009<br />
(in EUR)<br />
Life<br />
insurance<br />
policies<br />
with DPF<br />
Unit-linked<br />
life<br />
insurance<br />
policies<br />
Property<br />
insurance<br />
excluding<br />
health<br />
insurance<br />
policies<br />
Health<br />
insurance<br />
policies<br />
Financial<br />
contracts<br />
with DPF<br />
Factor<br />
Costs +5% (116,964) (58,598) (2,237,029) (820,820) (10,290) (3,243,701)<br />
Costs -5% 116,964 58,598 2,237,029 820,820 10,290 3,243,701<br />
Technical interest rate +1% 6,829,864 - - - 1,114,120 7,943,984<br />
Technical interest rate -1% (8,421,135) - - - (1,394,990) (9,816,125)<br />
Mortality +5% (198,153) - - - - (198,153)<br />
Mortality in annuity insurance -<br />
5% (166,036) - - - - (166,036)<br />
Claims ratio +5% (344,948) (315,484) (6,935,286) (5,006,688) (79,898) (12,682,304)<br />
Claims ratio -5% 344,948 315,484 6,935,286 5,006,688 79,898 12,682,304<br />
Effect on the <strong>Group</strong>’s net profit before tax for 2008<br />
(in EUR)<br />
Life<br />
insurance<br />
policies<br />
with DPF<br />
Unit-linked<br />
life<br />
insurance<br />
policies<br />
Property<br />
insurance<br />
excluding<br />
health<br />
insurance<br />
policies<br />
Health<br />
insurance<br />
policies<br />
Financial<br />
contracts<br />
with DPF<br />
Factor<br />
Costs +5% (131,030) (76,000) (2,156,000) (778,000) (10,000) (3,151,030)<br />
Costs -5% 131,030 76,000 2,156,000 778,000 10,000 3,151,030<br />
Technical interest rate +1% 7,712,010 - - - 1,213,000 8,925,010<br />
Technical interest rate -1% (9,439,010) - - - (1,528,000) (10,967,010)<br />
Mortality +5% (216,395) - - - - (216,395)<br />
Mortality in annuity insurance -<br />
5% 158,711 - - - - 158,711<br />
Claims ratio +5% (357,408) (357,000) (6,851,000) (4,755,000) (87,000) (12,407,408)<br />
Claims ratio -5% 357,408 357,000 6,851,000 4,755,000 87,000 12,407,408<br />
Total<br />
Total<br />
119
<strong>The</strong> <strong>Group</strong> <strong>KD</strong> <strong>Group</strong> Annual Report 2009<br />
Notes to Consolidated Financial Statements as at <strong>and</strong> for the year ended 31 December 2009<br />
5.1.6. Risk management in the area of reinsurance protection<br />
General description of the purpose <strong>and</strong> goals of reinsurance protection<br />
Reinsurance enables the <strong>Group</strong> to underwrite also insurance contracts that exceed <strong>Group</strong>'s own capacities, i.e. to take over<br />
risks above the <strong>Group</strong>s own retention <strong>and</strong> provide for solvency <strong>and</strong> liquidity of operations. Thus it represents a key element of<br />
risk management in insurance industry / business.<br />
<strong>The</strong> <strong>Group</strong> pursues the objective to achieve the optimum protection both against individual large claims <strong>and</strong> against the<br />
aggregate exposure of the <strong>Group</strong>'s insurance portfolio to natural <strong>and</strong> other insurance hazards.<br />
<strong>The</strong> <strong>Group</strong> decides on the form <strong>and</strong> structure of the reinsurance based on the level of retention of the insurer <strong>and</strong> the profiles<br />
of insurance portfolio.<br />
Contractual reinsurance ensures automatic cover of the vast majority of underwritten risks, even in the event of potential risk<br />
assessment errors.<br />
For exceptional risks which exceed the contractual reinsurance protection by scale or content of the cover provisions, the<br />
<strong>Group</strong> ensures a<strong>dd</strong>itional special facultative reinsurance protection. <strong>The</strong> program of planed reinsurance is composed of<br />
traditional proportional <strong>and</strong> non-proportional types of reinsurance protection, <strong>and</strong> is by structure <strong>and</strong> by extent of covers<br />
practically the same as in business year 2008. Through operational risks management the <strong>Group</strong> carefully monitors the<br />
frequency <strong>and</strong> the scale of the risks reinsured either under ordinary contractual provisions or under special facultative<br />
reinsurance provisions.<br />
Basic assumptions used in sensitivity tests<br />
We assume two types of reinsurance protection risks. <strong>The</strong> first risk is whether the structure <strong>and</strong> scale of protection have been<br />
adequately chosen, which can be checked by simulation of whether decreasing reinsurance protection would significantly<br />
decrease net profit or loss, which would consequently jeopardise the <strong>Group</strong>’s capital adequacy. <strong>The</strong> second risk is whether<br />
the profit or loss would worsen significantly if an above-average number of large-scale <strong>and</strong> mass losses (which would also<br />
involve above-average amounts) occurred in a given period.<br />
Two income sensitivity tests have been designed to assess reinsurance protection risk: first, the test of sensitivity to a<br />
decrease in reinsurance protection, <strong>and</strong> second, the test of sensitivity to above-average incidence of loss (for large-scale <strong>and</strong><br />
mass losses).<br />
Analysis of the group portfolio from the aspect of reinsurance risk<br />
In the largest group of other property insurance contracts, we analysed the sensitivity of individual portfolios of insurance<br />
categories/groups of insurance categories to large-scale <strong>and</strong> mass losses, with the aim of focusing the reinsurance risk<br />
management analysis on the most exposed insurance categories. This analysis showed that the reinsurance risk is most<br />
significantly affected, both in terms of the amount <strong>and</strong> number of potentially large-scale <strong>and</strong> mass losses, by the portfolio of<br />
auto liability insurance <strong>and</strong> the portfolio of fire <strong>and</strong> other damage insurance. <strong>The</strong>se portfolios also significantly affect the profit<br />
or loss; therefore the sensitivity analysis was made on the basis of these reinsurance contracts.<br />
120
<strong>The</strong> <strong>Group</strong> <strong>KD</strong> <strong>Group</strong> Annual Report 2009<br />
Notes to Consolidated Financial Statements as at <strong>and</strong> for the year ended 31 December 2009<br />
Concentration of reinsurance<br />
for 2009<br />
Contract year 2009<br />
Type of reinsurance<br />
Own share/<br />
priority in<br />
EUR<br />
Reinsurance<br />
premium<br />
Structure of<br />
the<br />
reinsurance<br />
premium<br />
Reinsurance<br />
commission<br />
Accrued<br />
reins.<br />
losses<br />
Reserved<br />
reins.<br />
losses<br />
(in EUR thous<strong>and</strong>)<br />
Effect of<br />
the reins.<br />
outcome<br />
on the<br />
profit<br />
Surplus reinsurance of fires 1,000,000 2,068 18.97% 310 2,045 5,104 5,391<br />
Quota share reinsurance of fires 900,000 833 7.64% 167 202 198 (266)<br />
Surplus reinsurance of technical<br />
reserves 400,000 643 5.90% 96 176 28 (343)<br />
Quota share reinsurance of<br />
technical reserves 360,000 713 6.54% 143 250 168 (152)<br />
Quota share reinsurance of<br />
earthquakes - 1,430 13.11% 357 - 1 (1,072)<br />
Risk XL reinsurance of fires 600,000 128 1.17% - - - (128)<br />
Risk XL technical reinsurance 120,000 63 0.58% - - - (63)<br />
Cat XL property reinsurance excl.<br />
vehicle insurance 1,000,000 845 7.75% - 318 48 (479)<br />
Cat XL reinsurance annual<br />
aggregate excl. vehicle insurance 2,000,000 149 1.37% - - 325 176<br />
Total fire <strong>and</strong> technical insurance 6,872 63.02% 1,073 2,991 5,872 3,064<br />
XL reinsurance of auto liability <strong>and</strong><br />
green card 300,000 926 8.49% - - 769 (157)<br />
XL reinsurance of comprehensive<br />
auto insurance 150,000 52 0.48% - - - (52)<br />
Cat XL property reinsurance -<br />
vehicle insurance 1,000,000 930 8.53% - 331 431 (168)<br />
Cat XL property reinsurance excl.<br />
vehicle insurance 2,000,000 358 3.28% - - 338 (20)<br />
Total auto insurance 2,266 20.78% - 331 1,538 (397)<br />
Other property insurance 1,085 9.95% 49 - - (1,036)<br />
Health insurance policies - 0,00% - - - -<br />
Life insurance 681 6.25% 103 186 54 (338)<br />
TOTAL CONTRACT YEAR 2009 10,904 100,00% 1,225 3,508 7,464 1,293<br />
121
<strong>The</strong> <strong>Group</strong> <strong>KD</strong> <strong>Group</strong> Annual Report 2009<br />
Notes to Consolidated Financial Statements as at <strong>and</strong> for the year ended 31 December 2009<br />
Concentration of reinsurance for 2008<br />
Contract year 2008<br />
Own share/<br />
priority in<br />
EUR<br />
Reinsurance<br />
premium<br />
Structure of<br />
the<br />
reinsurance<br />
premium<br />
Reinsurance<br />
commission<br />
Accrued<br />
reins.<br />
losses<br />
(in EUR thous<strong>and</strong>)<br />
Reserved<br />
reins.<br />
losses<br />
Effect of<br />
the reins.<br />
outcome<br />
on the<br />
profit<br />
Type of reinsurance<br />
Surplus reinsurance of fires 1,000,000 1,183 11.89% 260 809 467 353<br />
Quota share reinsurance of fires 900,000 763 7.67% 259 700 152 349<br />
Surplus reinsurance of technical<br />
reserves 400,000 418 4.20% 88 196 119 (15)<br />
Quota share reinsurance of technical<br />
reserves 360,000 646 6.49% 161 204 188 (92)<br />
Quota share reinsurance of<br />
earthquakes 10% 1,278 12.84% 320 - 5 (954)<br />
Risk XL reinsurance of fires 600,000 98 0.98% - - - (98)<br />
Risk XL technical reinsurance 120,000 117 1.18% - - - (117)<br />
Cat XL property reinsurance excl.<br />
vehicle insurance 600,000 1,098 11.04% - 4,619 2,057 5,579<br />
Total fire <strong>and</strong> technical insurance 5,601 56.29% 1,088 6,528 2,988 5,004<br />
XL reinsurance of auto liability <strong>and</strong><br />
green card 300,000 1,104 11.10% - - 678 (426)<br />
XL reinsurance of comprehensive<br />
auto insurance 150,000 50 0.50% - - - (50)<br />
Cat XL property reinsurance - vehicle<br />
insurance 600,000 1,156 11.62% - 2,141 3,717 (4,702)<br />
Total auto insurance 2,309 23.21% - 2,141 4,395 4,227<br />
Other property insurance 1,426 14.33% 25 - 881 (520)<br />
Health insurance policies - 0.0% - - - -<br />
Life insurance 614 6.17% 129 185 5 (295)<br />
TOTAL CONTRACT YEAR 2008 9,950 100.00% 1,242 8,854 8,269 8,416<br />
122
<strong>The</strong> <strong>Group</strong> <strong>KD</strong> <strong>Group</strong> Annual Report 2009<br />
Notes to Consolidated Financial Statements as at <strong>and</strong> for the year ended 31 December 2009<br />
Quantitative analysis of sensitivity test results<br />
In order to assess the consequences of lowering the reinsurance protection, two sensitivity tests were carried out, measuring<br />
the quantitative impact on the net profit or loss. In the sensitivity tests we used the most important reinsurance contracts<br />
covering groups of insurance categories which may potentially have the greatest impact on the <strong>Group</strong>’s profit or loss due to<br />
the portfolio size or potential for large-scale or mass losses.<br />
Test of sensitivity of the profit or loss to a decrease in reinsurance protection for 2009<br />
Change Change Change Effect of<br />
(in EUR thous<strong>and</strong>)<br />
Initial own<br />
share<br />
Increased<br />
own share<br />
in net<br />
premium<br />
in net<br />
losses<br />
in net<br />
reserves<br />
change to<br />
profit<br />
Total proportional reinsurance unchanged - - - -<br />
Risk XL reinsurance of fires 600 900 77 - - 600<br />
Risk XL technical reinsurance 120 200 - - - 120<br />
Cat XL property reinsurance excl. vehicle insurance 1,000 1,500 29 415 - 1,000<br />
Total fire <strong>and</strong> technical insurance 106 415 - 1,720<br />
XL reinsurance of auto liability <strong>and</strong> green card 300 400 112 - 154 300<br />
XL reinsurance of comprehensive auto insurance 150 150 - - - 150<br />
Cat XL property reinsurance - vehicle insurance 600 1000 86 585 - 600<br />
Total auto insurance 198 585 154 1,050<br />
TOTAL 304 1,000 154 2,770<br />
Test of sensitivity of the profit or loss to a decrease in reinsurance protection for 2008<br />
Change<br />
in net<br />
premium<br />
Change<br />
in net<br />
losses<br />
Change<br />
in net<br />
reserves<br />
Effect of<br />
change to<br />
profit<br />
(in EUR thous<strong>and</strong>)<br />
Initial own<br />
share<br />
Increased<br />
own share<br />
Total proportional reinsurance unchanged - - - -<br />
Risk XL reinsurance of fires 600 900 68 - - 68<br />
Risk XL technical reinsurance 120 120 - - - -<br />
Cat XL property reinsurance excl. vehicle insurance 600 1000 105 461 129 (485)<br />
Total fire <strong>and</strong> technical insurance 173 461 129 (417)<br />
XL reinsurance of auto liability <strong>and</strong> green card 300 400 301 - 200 101<br />
XL reinsurance of comprehensive auto insurance 150 150 - - - -<br />
Cat XL property reinsurance - vehicle insurance 600 1000 377 339 271 (233)<br />
Total auto insurance 678 339 471 (132)<br />
TOTAL 851 800 600 (549)<br />
We have illustrated in the tables the effect of the increase of the own share (own funding) on profit of the company when loss<br />
events remained largely unchanged in the contract years 2008 <strong>and</strong> 2009. <strong>The</strong> lower volume of the reinsurance protection was<br />
accompanied by the lower written reinsurance premium, as well as the lower volume of the written shares of the reinsurers in<br />
claims, which in turn is reflected on the positive change in the net premium <strong>and</strong> the negative change in the net claim.<br />
Despite the fact that the initial own shares in the contract year 2009 were slightly higher than those in the contract year 2008,<br />
the impact of the lowering of the reinsurance protection on the change in claims <strong>and</strong> in outst<strong>and</strong>ing claims provisions in both<br />
years does not differ much.<br />
<strong>The</strong> profit generated by the <strong>Group</strong> in both years was influenced by the change in net written premium. <strong>The</strong> base reinsurance<br />
premium was in the contract year 2008 slightly higher as a consequence of lower own shares in comparison with 2009; hence<br />
in the case of a decrease in the reinsurance protection in 2008, there would also be an increase in net written premium higher<br />
than the increase in net written premium in the contract year 2009.<br />
As a consequence of the developments described above, a comparable increase in the company’s own shares in both years<br />
would result in a decrease in the company’s profit in the amount of 851 thous<strong>and</strong> euros in the contract year 2008 <strong>and</strong> 850<br />
thous<strong>and</strong> euros in the contract year 2009.<br />
123
<strong>The</strong> <strong>Group</strong> <strong>KD</strong> <strong>Group</strong> Annual Report 2009<br />
Notes to Consolidated Financial Statements as at <strong>and</strong> for the year ended 31 December 2009<br />
Test of sensitivity of the profit or loss to an above-average number <strong>and</strong> amount of large-scale <strong>and</strong> mass losses for<br />
2008 <strong>and</strong> 2009<br />
Contract year 2009<br />
(in EUR thous<strong>and</strong>)<br />
Sum of simulated<br />
gross claims<br />
Change in<br />
net premium<br />
Change in<br />
net losses<br />
Change<br />
in net<br />
reserves<br />
Effect of change<br />
to profit<br />
Total proportional reinsurance - - 1,080 - (1,080)<br />
Risk XL reinsurance of fires - (31) (120) - 89<br />
Risk XL technical reinsurance - (58) (240) - 182<br />
Cat XL property reinsurance excl.<br />
vehicle insurance - (1,123) 836 - (1,960)<br />
Cat XL reinsurance annual agregate - - (1,000) - 1,000<br />
Total fire <strong>and</strong> technical insurance 15,761 (1,212) 556 - (1,769)<br />
XL reinsurance of auto liability <strong>and</strong><br />
green card - - 925 925 (1,850)<br />
XL reinsurance of comprehensive<br />
auto insurance - - - - -<br />
Cat XL property reinsurance - vehicle<br />
insurance - (221) 164 - (385)<br />
Total auto insurance 21,539 (221) 1,089 925 (2,235)<br />
Total 37,300 (1,433) 1,645 925 (3,995)<br />
Contract year 2008<br />
(in EUR thous<strong>and</strong>)<br />
Sum of simulated<br />
gross claims<br />
Change in<br />
net premium<br />
Change in<br />
net losses<br />
Change in<br />
net<br />
reserves<br />
Effect of change<br />
to profit<br />
Total proportional reinsurance - - 4,534 - (4,534)<br />
Risk XL reinsurance of fires - (27) (120) - 93<br />
Risk XL technical reinsurance - (117) (240) - 124<br />
Cat XL property reinsurance excl.<br />
vehicle insurance<br />
-<br />
(520) (2,959) - 2,439<br />
Total fire <strong>and</strong> technical insurance 11,718 (664) 1,215 - (1,879)<br />
XL reinsurance of auto liability <strong>and</strong><br />
green card<br />
-<br />
- 725 725 (1,450)<br />
XL reinsurance of comprehensive<br />
auto insurance<br />
-<br />
- - - -<br />
Cat XL property reinsurance -<br />
vehicle insurance<br />
-<br />
(111) 105 - (216)<br />
Total auto insurance 21,234 (111) 830 725 (1,666)<br />
Skupaj 32,952 (774) 2,045 725 (3,544)<br />
<strong>The</strong> two tables above show the effect of claims listed bellow, on the profit or loss reported in 2008 <strong>and</strong> 2009 having actual<br />
reinsurance protection in 2008 <strong>and</strong> 2009:<br />
- Fire loss in the amount of EUR 800,000, which was the subject of quota <strong>and</strong> Fire Risk XL reinsurance.<br />
- Installation loss in the amount of EUR 8,000,000, which was the subject of surplus (95.00%), quota <strong>and</strong> technical<br />
Risk XL reinsurance.<br />
- Loss as a result of storms in the amount of EUR 5,652,000 where the smaller portion was reinsured, while the<br />
remaining portion was covered under quota <strong>and</strong> property Cat XL reinsurance serving to provide coverage in case of<br />
catastrophic losses.<br />
- Claims from motor vehicle liability insurance in the amount of EUR 250,000, 750,000, 1,500,000, 3,000,000 <strong>and</strong><br />
15,000,000.<br />
Note: as regards losses under motor vehicle liability, the assumption made is to retain 50% of simulated losses in provisions<br />
for claims, whereas for all other simulated losses we have assumed making payments over the course of the year.<br />
124
<strong>The</strong> <strong>Group</strong> <strong>KD</strong> <strong>Group</strong> Annual Report 2009<br />
Notes to Consolidated Financial Statements as at <strong>and</strong> for the year ended 31 December 2009<br />
As already mentioned, in 2009 we increased our own shares for motor insurance <strong>and</strong> insurance against the risk of natural<br />
disasters, which directly affects the reduced volume of reinsurance coverage compared to the contract year 2008. Loss<br />
events in the two years are comparable since in both years we recorded more loss events due to storms <strong>and</strong> an equal<br />
number of major automobile liability claims. In contract year 2008, the above claims would cause decrease in the <strong>Group</strong>’s<br />
profit of EUR 3,679 thous<strong>and</strong>, <strong>and</strong> in 2009, EUR 4,003 thous<strong>and</strong>.<br />
5.2 Financial risks<br />
<strong>The</strong> <strong>Group</strong> is exposed to financial risks through its financial assets <strong>and</strong> liabilities, reinsurance receivables <strong>and</strong> insurance<br />
liabilities. Financial risks are risks that, due to changes in the capital markets <strong>and</strong> ratings of the <strong>Group</strong>’s clients, the inflows will<br />
not be sufficient to cover the outflows. <strong>The</strong> most significant components of this financial risk are liquidity risk, credit risk <strong>and</strong><br />
market risk; the <strong>Group</strong> is exposed to the risks of changes in interest rates, securities market prices <strong>and</strong> currency rates.<br />
Liquidity risk is the risk that the <strong>Group</strong> may be unable to repay all its liabilities, including potential liabilities, without threat to its<br />
normal activities. <strong>The</strong> <strong>Group</strong> maintains capital adequacy with an adequate amount of capital in order to be able to ensure<br />
liquidity at any moment <strong>and</strong> so that it is sustainably able to meet its obligations (solvency).<br />
<strong>The</strong> main source of credit risk for the <strong>Group</strong> stems from the insurance segment <strong>and</strong> involves investments <strong>and</strong> reinsurance<br />
risks. This involves the risk that the counterparty will be unable to pay the amounts due at maturity.<br />
Market risks arise particularly in the investment of assets, where there is the potential that expectations regarding the value of<br />
investments are not met or are not met entirely. <strong>The</strong> risk of unfavourable changes in investment values can be the<br />
consequence of foreign exchange rate changes, as well as changes in interest rates or securities prices.<br />
<strong>The</strong> <strong>Group</strong> manages <strong>and</strong> controls the risks to which it is exposed by constantly monitoring cash flows <strong>and</strong> ensuring that it<br />
always has enough liquid assets at its disposal to settle its liabilities, by investing its assets in a manner which ensures stable<br />
long-term returns which exceed the amount of returns on insurance liabilities, by matching the terms of financial assets<br />
against financial liabilities, <strong>and</strong> by ensuring the adequacy of financial assets.<br />
Currency risk is less important for the <strong>Group</strong> because of ERM2 <strong>and</strong> adoption of the euro in 2007.<br />
125
<strong>The</strong> <strong>Group</strong> <strong>KD</strong> <strong>Group</strong> Annual Report 2009<br />
Notes to Consolidated Financial Statements as at <strong>and</strong> for the year ended 31 December 2009<br />
Analysis of assets <strong>and</strong> liabilities for financial risk management<br />
Life insurance contracts with<br />
DPF<br />
Short-term Insurance contracts<br />
Life insurance<br />
contracts with<br />
DPF<br />
Financial life<br />
insurance<br />
contracts with<br />
DPF<br />
Property<br />
insurance<br />
contracts excl.<br />
health<br />
insurance<br />
contracts<br />
Health<br />
insurance<br />
contracts<br />
Other assets<br />
<strong>and</strong> liabilities<br />
(in EUR)<br />
Total<br />
ASSETS<br />
31.12.2009<br />
Debt securities 58,784,677 13,598,069 76,702,831 10,856,640 13,705,428 173,647,644<br />
At fair value through profit or loss: 2,893,956 1,011,598 13,643,600 716,489 5,443,843 23,709,486<br />
- listed 2,893,956 982,260 13,376,584 644,981 5,182,406 23,080,187<br />
- non-listed - - - - 261,437 261,437<br />
- government bonds - 29,338 267,016 71,508 - 367,862<br />
Available for sale 43,798,880 10,818,497 63,059,231 9,500,444 4,465,822 131,642,873<br />
- listed 5,444,197 1,162,138 24,124,443 219,436 3,713,867 34,664,081<br />
- non-listed 539,020 - - - - 539,020<br />
- government bonds 37,815,663 9,656,358 38,934,788 9,281,008 751,955 96,439,772<br />
Held to maturity 12,091,841 1,767,974 - 639,707 3,795,763 18,295,285<br />
- listed 5,269,304 262,356 - - 3,748,351 9,280,011<br />
- non-listed 417,720 - - - - 417,720<br />
- government bonds 6,404,817 1,505,618 - 639,707 47,412 8,597,554<br />
Equity securities 7,332,432 1,395,093 30,600,202 2,156,321 38,539,505 80,023,553<br />
At fair value through profit or loss: 2,625,977 340,631 7,535,539 29,766 3,487,232 14,019,145<br />
- listed 2,625,977 340,631 7,535,539 29,766 3,487,232 14,019,145<br />
- non-listed - - - - - -<br />
Available for sale 4,706,455 1,054,462 23,064,663 2,126,555 35,052,273 66,004,408<br />
- listed 3,413,169 711,132 19,198,800 2,029,231 17,318,012 42,670,344<br />
- non-listed 1,293,286 343,330 3,865,863 97,324 17,734,261 23,334,064<br />
Impairment of financial assets (1,135,123) (683) (2,344,019) - (8,245,862) (11,725,687)<br />
Investment in associates - - - - 52,308,751 52,308,751<br />
Loans <strong>and</strong> receivables 14,856,259 2,752,938 47,379,674 19,408,024 73,425,463 157,822,358<br />
Loans <strong>and</strong> deposits 10,484,706 1,651,268 9,540,870 1,829,181 67,055,722 90,561,747<br />
Insurance receivables 595,883 128,585 29,455,047 11,736,545 603,317 42,519,377<br />
Other receivables 3,775,669 973,086 8,383,757 5,842,298 5,766,424 24,741,234<br />
Investment properties 3,915,504 1,081,744 17,411,187 108,567 7,296,538 29,813,540<br />
Reinsurance assets 199,221 18,768 19,231,019 - - 19,449,008<br />
Cash <strong>and</strong> cash equivalents 1,709,807 292,344 12,736,818 831,703 24,732,502 40,303,174<br />
Other assets 366,577 37,933 24,980,961 950,993 123,731,268 150,067,732<br />
Total assets 86,029,354 19,176,205 226,698,673 34,312,248 325,493,593 691,710,073<br />
LIABILITIES<br />
Insurance contracts 8,604,775 - 194,962,683 16,400,337 - 219,967,795<br />
Non-current liabilities 2,231,432 - 71,881,134 145,177 - 74,257,743<br />
Current liabilities 6,373,343 - 123,081,549 16,255,160 - 145,710,052<br />
Insurance contracts with DPF 76,130,189 - - - - 76,130,189<br />
Non-current liabilities 76,130,189 - - - - 76,130,189<br />
Current liabilities - - - - - -<br />
Investment contracts with DPF - 17,703,254 - - - 17,703,254<br />
Non-current liabilities - 17,654,644 - - - 17,654,644<br />
Current liabilities - 48,610 - - - 48,610<br />
Borrowings - - - - 196,132,185 196,132,185<br />
Other liabilities 966,404 232,165 18,367,566 6,402,584 19,857,435 45,826,154<br />
Total liabilities 85,701,368 17,935,419 213,330,249 22,802,921 215,989,620 555,759,577<br />
126
<strong>The</strong> <strong>Group</strong> <strong>KD</strong> <strong>Group</strong> Annual Report 2009<br />
Notes to Consolidated Financial Statements as at <strong>and</strong> for the year ended 31 December 2009<br />
Life insurance contracts with<br />
DPF<br />
Short-term Insurance contracts<br />
Life insurance<br />
contracts with<br />
DPF<br />
Financial life<br />
insurance<br />
contracts with<br />
DPF<br />
Property<br />
insurance<br />
contracts excl.<br />
health<br />
insurance<br />
contracts<br />
Health<br />
insurance<br />
contracts<br />
Other assets<br />
<strong>and</strong> liabilities<br />
(in EUR)<br />
Total<br />
ASSETS<br />
31 December 2008<br />
Debt securities 47,427,174 13,018,327 79,035,741 6,471,557 2,190,106 148,142,905<br />
At fair value through profit or loss: 3,235,192 947,476 14,383,689 859,092 236,536 19,661,985<br />
- listed 3,235,192 911,209 14,016,581 762,310 - 18,925,292<br />
- non-listed - - - - 236,536 236,536<br />
- government bonds - 36,267 367,108 96,782 - 500,157<br />
Available for sale 37,276,479 12,070,851 64,652,052 5,612,465 1,024,365 120,636,211<br />
- listed 4,542,964 1,976,484 24,888,641 348,589 322,534 32,079,212<br />
- non-listed - - - - - -<br />
- government bonds 32,733,514 10,094,367 39,763,411 5,263,876 701,831 88,556,999<br />
Held to maturity 6,915,504 - - - 929,205 7,844,709<br />
- listed 5,380,629 - - - 889,937 6,270,566<br />
- non-listed 427,282 - - - - 427,282<br />
- government bonds 1,107,593 - - - 39,268 1,146,861<br />
Equity securities 12,423,520 2,778,667 50,604,549 2,545,354 41,966,984 110,319,073<br />
At fair value through profit or loss: 2,645,320 829,200 5,272,758 55,229 7,046,189 15,848,695<br />
- listed 2,645,320 829,200 5,272,758 55,229 7,046,189 15,848,695<br />
- non-listed - - - - - -<br />
Available for sale 9,778,200 1,949,467 45,331,791 2,490,125 34,920,795 94,470,378<br />
- listed 8,960,620 1,796,599 42,083,652 2,490,125 10,002,150 65,333,146<br />
- non-listed 817,580 152,868 3,248,139 - 24,918,645 29,137,232<br />
Impairment of financial assets (4,159,003) (839,478) (15,215,132) (173,525) (7,244,586) (27,631,724)<br />
Investment in associates - - - - 81,077,284 81,077,284<br />
Loans <strong>and</strong> receivables 10,049,123 1,308,200 57,024,063 18,835,288 82,855,467 170,072,141<br />
Loans <strong>and</strong> deposits 9,220,578 1,025,976 16,674,165 5,516,979 64,680,183 97,117,881<br />
Insurance receivables 565,197 135,015 32,567,063 11,497,024 48,430 44,812,729<br />
Other receivables 263,348 147,209 7,782,835 1,821,285 18,126,854 28,141,531<br />
Investment properties 3,818,485 1,281,091 17,474,217 - 6,133,794 28,707,587<br />
Reinsurance assets 152,256 21,726 17,188,721 - - 17,362,703<br />
Cash <strong>and</strong> cash equivalents 1,172,517 76,173 3,976,328 187,382 24,887,904 30,300,304<br />
Other assets 815,338 308,069 25,902,068 5,754,394 112,920,491 145,700,360<br />
Total assets 71,699,410 17,952,775 235,990,554 33,620,450 344,787,444 704,050,634<br />
LIABILITIES<br />
Insurance contracts 7,636,505 384,788 186,817,551 15,906,377 - 210,745,221<br />
Non-current liabilities 2,496,872 70,051 66,450,674 169,446 - 69,187,043<br />
Current liabilities 5,139,633 314,737 120,366,877 15,736,931 - 141,558,178<br />
Insurance contracts with DPF 57,640,231 9,295,497 - - - 66,935,728<br />
Non-current liabilities 57,640,231 9,295,497 - - - 66,935,728<br />
Current liabilities - - - - - -<br />
Investment contracts with DPF 9,295,051 7,035,113 - - - 16,330,164<br />
Non-current liabilities 9,252,317 7,020,079 - - - 16,272,396<br />
Current liabilities 42,735 15,033 - - - 57,768<br />
Borrowings - - 8,000,000 - 173,908,599 181,908,599<br />
Other liabilities 435,138 317,646 14,801,873 7,392,230 21,328,173 44,275,059<br />
Total liabilities 75,006,924 17,033,044 209,619,424 23,298,607 195,236,772 520,194,771<br />
127
<strong>The</strong> <strong>Group</strong> <strong>KD</strong> <strong>Group</strong> Annual Report 2009<br />
Notes to Consolidated Financial Statements as at <strong>and</strong> for the year ended 31 December 2009<br />
5.2.1 Liquidity risk<br />
Liquidity risk is the risk that cash may not be available to pay obligations due at a reasonable cost.<br />
<strong>The</strong> <strong>Group</strong> is exposed to liquidity risk in particular with regards to the insurance liabilities (claims) <strong>and</strong> the contractual<br />
obligations pertaining to the acquisition of financial instruments (notably the acquisitions of companies) <strong>and</strong> the servicing of<br />
current liabilities from financial instruments.<br />
<strong>The</strong> liquidity requirements in the field of financial intermediation are specifically regulated by the law, where the most<br />
important area for the <strong>Group</strong> is insurance where it strives to maintain the volume of liquidity in accordance with the regulatory<br />
requirements.<br />
Exposure to liquidity risk is reflected in the acceptance of insurance risk <strong>and</strong> the <strong>Group</strong>’s ability to meet its contractual<br />
obligations from existing insurance contracts <strong>and</strong> liabilities related to the insurer’s day-to-day operations.<br />
Liquidity risk stems from an imbalance in inflows <strong>and</strong> outflows <strong>and</strong> manifests itself in the potential that the <strong>Group</strong>, despite<br />
having adequate financial assets, would find itself in the position of having to cash in its investments under less favourable<br />
conditions (e.g. lower price, higher transaction costs) in order to meet its contractual obligations, which would result in a lower<br />
return on investments.<br />
<strong>The</strong> <strong>Group</strong> manages its liquidity risk through:<br />
• maintaining a suitable structure of investments;<br />
• diversifying the investment portfolio;<br />
• planning future cash flows, ensuring a suitable volume of cash flows from operating <strong>and</strong> investing activities (payout of<br />
interest <strong>and</strong> principal) to cover future foreseeable liabilities;<br />
• providing an adequate volume of high liquidity investments which are readily convertible without loss in order to cover<br />
future unforeseeable liabilities.<br />
<strong>The</strong> <strong>Group</strong> is exposed to interest rate risk via financial assets <strong>and</strong> liabilities, reinsured receivables <strong>and</strong> insured liabilities. Due<br />
to the nature of its investments <strong>and</strong> liabilities, the <strong>Group</strong> particularly faces the risk of changed interest rates.<br />
<strong>The</strong> overview of liquidity risk management is presented below, showing maturity of assets according to contractual cash flows,<br />
which are compared with the expected cash flows of insurance <strong>and</strong> financial contracts.<br />
Contractual cash flows for debt securities are calculated using the data of the issuers. <strong>The</strong> amortisation schedule <strong>and</strong> coupon<br />
rate at the date of calculation is used. For each time interval, the future cash flows (principal <strong>and</strong> coupon rate) are considered<br />
according to the situation of the debt securities portfolio.<br />
For the purpose of presenting cash flows of life insurance contracts with DPF <strong>and</strong> unit-linked life insurance, all the cash flows<br />
of future payments of claims <strong>and</strong> costs arising from life insurance contracts effective at 31 December 2009 were generated.<br />
For the purpose of presenting cash flows of financial contracts, all the cash flows of future payments of claims <strong>and</strong> costs<br />
arising from financial contracts effective at 31 December 2009 were generated..<br />
Expected cash flows of property insurance <strong>and</strong> health insurance represent an assessment of payments for claims (which<br />
have already been incurred), including costs <strong>and</strong> the release of liability from unearned premiums <strong>and</strong> provisions.<br />
Own assets of the <strong>Group</strong> are not intended for covering liabilities from insurance <strong>and</strong> financial contracts, <strong>and</strong> this is the reason<br />
the mean duration of assets is not presented.<br />
128
<strong>The</strong> <strong>Group</strong> <strong>KD</strong> <strong>Group</strong> Annual Report 2009<br />
Notes to Consolidated Financial Statements as at <strong>and</strong> for the year ended 31 December 2009<br />
Overview of maturity of insurance liabilities in 2009<br />
Carrying<br />
amount<br />
No stated<br />
maturity<br />
Expected cash flows (undiscounted)<br />
(in EUR) 0-1 year 1 – 5 years 5 - 10 years 10 - 15 years<br />
Liabilities<br />
More than 15<br />
years<br />
Insurance contracts 219,967,795 - 146,060,298 54,871,726 53,269,051 37,558,357 94,793,389<br />
Insurance contracts with DPF 76,130,189 - 6,659,497 30,419,358 40,167,394 31,899,258 68,674,106<br />
Investment contracts with DPF 17,703,254 - 1,542,269 7,157,261 10,365,688 9,489,577 27,521,996<br />
Debt securities (issued) - - - - - - -<br />
Total liabilities 313,801,238 - 154,262,064 92,448,345 103,802,133 78,947,192 190,989,491<br />
Overview of maturity of insurance liabilities in 2008<br />
Expected cash flows (undiscounted)<br />
(in EUR)<br />
Carrying<br />
amount<br />
No stated<br />
maturity 0-1 year 1 – 5 years 5 - 10 years 10 - 15 years<br />
Liabilities<br />
More than 15<br />
years<br />
Insurance contracts 210,745,221 - 137,836,517 49,476,994 18,052,930 5,378,780 -<br />
Insurance contracts with DPF 66,935,728 - 5,288,051 51,946,852 30,255,563 25,831,111 57,406,862<br />
Investment contracts with DPF 16,330,164 - 1,457,040 6,645,794 10,255,146 9,309,026 28,586,415<br />
Debt securities (issued) - - - - - - -<br />
Total liabilities 294,011,113 - 144,581,608 108,069,640 58,563,639 40,518,917 85,993,277<br />
Overview of maturity of liabilities related to own liabilities in 2009<br />
(in EUR)<br />
Liabilities<br />
Carrying<br />
amount<br />
No stated<br />
maturity<br />
Contractual cash flows (undiscounted)<br />
More than 5<br />
0-1 year 1-3 years 3-5 years years<br />
Debt securities (issued) 75,521,481 - 6,734,595 - - 68,856,966<br />
Borrowings 119,184,048 2,637,944 106,903,679 7,176,040 10,550,510 3,528,729<br />
Derivative financial instruments 1,426,656 - 279,981 1,146,675 - -<br />
Trade <strong>and</strong> other payables 19,857,435 2,051,446 16,721,623 572,758 21,287 750,408<br />
Total liabilities 215,989,620 4,689,390 130,639,878 8,895,473 10,571,797 73,136,103<br />
Overview of maturity of liabilities related to own liabilities in 2008<br />
(in EUR)<br />
Liabilities<br />
Carrying<br />
amount<br />
No stated<br />
maturity<br />
Contractual cash flows (undiscounted)<br />
More than 5<br />
0-1 year 1-3 years 3-5 years years<br />
Debt securities (issued) 75,449,991 - 5,353,312 12,362,816 8,240,000 67,331,028<br />
Borrowings 98,107,912 - 65,293,452 16,609,362 21,945,005 657,939<br />
Derivative financial instruments 350,696 - 350,696 - - -<br />
Trade <strong>and</strong> other payables 21,328,173 6,279,526 17,516,072 1,214,985 - 4,745<br />
Total liabilities 195,236,772 6,279,526 88,513,532 30,187,163 30,185,005 67,993,712<br />
129
<strong>The</strong> <strong>Group</strong> <strong>KD</strong> <strong>Group</strong> Annual Report 2009<br />
Notes to Consolidated Financial Statements as at <strong>and</strong> for the year ended 31 December 2009<br />
5.2.2 Credit risk<br />
Credit risk is the consequence of an inability on the part of a contracting party to fully repay its obligations or overdue debts. In<br />
terms of financial instruments included in investments, it is the risk that one party in a contract regulating the financial<br />
instrument will cause the other party to incur financial loss due to a default on obligations as a result of a difference between<br />
actual <strong>and</strong> contractually agreed fulfilment of obligations.<br />
<strong>The</strong> <strong>Group</strong> manages its credit risk exposure by introducing further limits on individual amounts <strong>and</strong> on already specified<br />
amounts of maximum exposure of individual securities. In order to minimise the risk exposure, the <strong>Group</strong> checks analyses<br />
<strong>and</strong> credit rating scores of issuers of securities. It also manages its credit risk exposure through investments in governmentissued<br />
securities, <strong>and</strong> low-risk securities. <strong>The</strong> procedures for checking the credit of foreign issuers of securities are based on<br />
acquiring credit rating information from international firms such as St<strong>and</strong>ard & Poor’s, Fitch-IBCA <strong>and</strong> Moody’s.<br />
Issuers of securities in Slovenia do not have ratings, but the insurance part of the <strong>Group</strong> has the highest concentration of<br />
investments in debt securities, bank <strong>and</strong> government bonds. <strong>The</strong> credit risk of investment coupons <strong>and</strong> equity securities is<br />
controlled by diversification of investments.<br />
Procedures of verifying credit ratings are based on obtaining <strong>and</strong> reviewing publicly accessible data on the current financial<br />
status of the issuer of financial instruments <strong>and</strong> its future solvency. <strong>The</strong> credit rating of domestic issuers of financial<br />
instruments is determined by the <strong>Group</strong> itself. In checking the issuer’s credit using its own sources, the <strong>Group</strong> checks future<br />
solvency <strong>and</strong> in particular the issuer’s adequacy of expected future cash flows from regular activities, offset against the<br />
outflows for settlement of future liabilities.<br />
In terms of of reinsurance, the same as for financial asset investment, credit risk management procedures relate to verifying<br />
the reinsurer’s credit rating. In accordance with the credit risk management strategy , reinsurance-related liabilities are<br />
reinsured by prime-grade reinsurers. This does not, however, discharge the <strong>Group</strong>’s liability as primary insurer. If a reinsurer<br />
fails to pay a claim for any reason, the <strong>Group</strong> remains liable for the payment to the policyholder. <strong>The</strong> creditworthiness of<br />
reinsurers is considered on an annual basis by reviewing their financial strength prior to finalisation of any contract.<br />
<strong>The</strong> <strong>Group</strong> restructures credit risk by establishing limits according to counterparty <strong>and</strong> also according to territory <strong>and</strong> industry.<br />
<strong>The</strong>se risks change regularly.<br />
Maximum credit risk at 31 December 2009 <strong>and</strong> 31 December 2008<br />
(in EUR) AAA-A BBB-B Without rating Total<br />
31.12.2009 31.12.2008 31.12.2009 31.12.2008 31.12.2009 31.12.2008 31.12.2009 31.12.2008<br />
Debt securities 115,475,032 104,386,884 19,168,798 6,556,381 43,083,795 37,199,640 177,727,625 148,142,905<br />
At fair value through profit or<br />
loss 816,754 1,399,763 3,576,692 1,000,419 19,316,040 17,261,803 23,709,486 19,661,985<br />
Available-for-sale 107,886,926 100,486,158 10,611,753 3,990,928 17,224,175 16,159,125 135,722,854 120,636,211<br />
Hel-to-maturity 6,771,352 2,500,963 4,980,353 1,565,034 6,543,580 3,778,712 18,295,285 7,844,709<br />
Loans <strong>and</strong> receivables 3,147,557 - 9,860,032 - 148,794,675 181,421,807 161,802,264 181,421,807<br />
Loans <strong>and</strong> deposits 3,147,557 - 9,860,032 - 79,010,288 97,783,106 92,017,877 97,783,106<br />
Insurance receivables - - - - 33,377,192 35,709,836 33,377,192 35,709,836<br />
Recourse receivables - - - - 10,713,323 11,768,663 10,713,323 11,768,663<br />
Other receivables - - - - 25,693,872 36,160,202 25,693,872 36,160,202<br />
Reinsurance assets - - - - 19,449,008 17,362,703 19,449,008 17,362,703<br />
Cash <strong>and</strong> cash equivalents 491,776 5,745 46,620 70,932 40,191,676 31,228,515 40,730,072 31,305,192<br />
Total assets 119,114,365 104,392,629 29,075,450 6,627,313 251,519,154 267,212,665 399,708,969 378,232,607<br />
130
<strong>The</strong> <strong>Group</strong> <strong>KD</strong> <strong>Group</strong> Annual Report 2009<br />
Notes to Consolidated Financial Statements as at <strong>and</strong> for the year ended 31 December 2009<br />
Recourse receivables – recourse claims <strong>and</strong> assets acquired in the course of settlement of claims<br />
<strong>The</strong> <strong>Group</strong> may sell items damaged in insurance cases, which it acquires in the course of resolving claims. <strong>The</strong> net<br />
recoverable value of damaged items in claims which the <strong>Group</strong> manages to sell is recognised as revenue on the transaction<br />
date (sale of the damaged item).<br />
With the payment of claims, the rights in relation to those responsible for the damage are also transferred from the<br />
policyholder to the <strong>Group</strong> (subrogation). <strong>The</strong> <strong>Group</strong> exercises that right through a recourse claim of partial or entire payment<br />
of the insurance amount. In the event the insured person of compulsory liability insurance loses his or her rights (intoxication,<br />
etc.) the <strong>Group</strong> dem<strong>and</strong>s recourse from the policyholder or the person responsible for the damage of the entire or partial<br />
amount of the paid claims. Exercised recourse claims are recognised as insurance revenue. Expected recourse amounts are<br />
also included in the calculation of liabilities for claims.<br />
Recourse receivables are recorded separately, as exercised <strong>and</strong> unexercised, whereas the unexercised recourse receivables<br />
are kept in off-balance sheet records <strong>and</strong> no impairment is recognised with regard to them.<br />
Exercised recourse receivables are recorded separately as receivables insured by mortgage <strong>and</strong> other recourse receivables,<br />
which is the basis for impairment calculation. Impairment of exercised recourse receivables <strong>and</strong> receivables on redemption is<br />
based on individual estimation of the financial situation <strong>and</strong> liquidity of the insurance policyholder. Liquidity of debtors <strong>and</strong><br />
other receivables, except deferred tax receivables, are assessed individually; the same is true for impairment calculation.<br />
Loans<br />
<strong>The</strong> <strong>Group</strong> approves loans to its subsidiaries <strong>and</strong> associates in order to take advantage of synergy effects. <strong>The</strong> <strong>Group</strong> can<br />
raise loans under more advantageous conditions than subsidiaries <strong>and</strong> associates because of its financial power <strong>and</strong><br />
intensive cooperation with financial institutions. Loans are approved at the rate of interest prescried for loans to related<br />
parties. Loans are not insured.<br />
In some cases, loans are also approved to companies outside the <strong>Group</strong> if there exists a mutual interest for business<br />
cooperation. <strong>The</strong>se loans are not insured, <strong>and</strong> the interest rate is higher.<br />
131
<strong>The</strong> <strong>Group</strong> <strong>KD</strong> <strong>Group</strong> Annual Report 2009<br />
Notes to Consolidated Financial Statements as at <strong>and</strong> for the year ended 31 December 2009<br />
Credit risk: Impairment of financial assets<br />
Assets (in EUR)<br />
Neither past<br />
due nor<br />
impaired<br />
Up to 30<br />
days<br />
Past due but not impaired<br />
31-90 days<br />
91-270<br />
days<br />
More than<br />
271 days<br />
Gross<br />
value<br />
Past due <strong>and</strong> impaired<br />
Individually<br />
Collective<br />
Impairment<br />
Gross<br />
value<br />
Impairment<br />
Total<br />
carrying<br />
amount<br />
31 December 2009<br />
Debt securities 177,727,625 - - - - - - - - 177,727,625<br />
Loans 80,337,544 - 463,004 - 11,283 335,222 (147,885) 11,046,488 (27,779) 92,017,877<br />
Receivables 34,824,419 2,953,412 357,452 1,748,162 2,317,194 47,565,866 (35,109,703) 34,636,113 (19,508,528) 69,784,387<br />
- insurance receivables 13,476,583 2,730,548 131,399 1,338,207 2,070,055 5,290,140 (4,312,420) 27,901,144 (15,248,464) 33,377,192<br />
- recourse receivables - - - - - 24,403,068 (15,653,623) 5,302,790 (3,338,912) 10,713,323<br />
- other receivables 21,347,836 222,864 226,053 409,955 247,139 17,872,658 (15,143,660) 1,432,179 (921,152) 25,693,872<br />
Reinsurance assets 19,449,008 - - - - - - - - 19,449,008<br />
TOTAL 312,338,596 2,953,412 820,456 1,748,162 2,328,477 47,901,088 (35,257,588) 45,682,601 (19,536,307) 358,978,897<br />
31 December 2008<br />
Debt securities 148,142,905 - - - - - - - - 148,142,905<br />
Loans 84,695,005 2,992,383 1,029,788 8,911,613 154,317 431,757 (431,757) - - 97,783,106<br />
Receivables 40,591,075 2,222,501 2,339,094 1,825,122 1,159,400 19,381,299 (15,772,647) 64,954,003 (33,061,146) 83,638,701<br />
- insurance receivables 14,987,319 257,165 261,441 585,918 40,848 2,093,044 (1,472,304) 32,614,344 (13,657,939) 35,709,836<br />
- recourse receivables - - - - - - - 29,639,895 (17,871,232) 11,768,663<br />
- other receivables 25,603,756 1,965,336 2,077,653 1,239,204 1,118,552 17,288,255 (14,300,343) 2,699,764 (1,531,975) 36,160,202<br />
Reinsurance assets 17,278,319 - - - - - - - - 17,362,703<br />
TOTAL 290,707,304 5,214,884 3,368,882 10,736,735 1,398,101 19,813,056 (16,204,404) 64,954,003 (33,061,146) 346,927,415<br />
<strong>The</strong> table also includes investments contracts.<br />
132
<strong>The</strong> <strong>Group</strong> <strong>KD</strong> <strong>Group</strong> Annual Report 2009<br />
Notes to Consolidated Financial Statements as at <strong>and</strong> for the year ended 31 December 2009<br />
5.2.3 Sensitivity analysis<br />
Sensitivity analysis – parameters<br />
Methods <strong>and</strong> assumptions used in preparing the sensitivity analysis for the types of market risks, which the <strong>Group</strong> is exposed.<br />
Sensitivity factor<br />
Changes in interest rates<br />
Changes in share prices<br />
Changes in commissions<br />
Description of sensitivity factor applied<br />
<strong>The</strong> impact of a change in market interest rates of ± 50 bp (i.e.: what is the impact<br />
on profit <strong>and</strong> equity if the market interest rate changes by the 50 basis points). A<br />
change of ± 50 bp represents a change of more than 1%, according to the change<br />
in interest rates in the past year.<br />
<strong>The</strong> impact of changes in market prices of financial assets are reflected in a<br />
change in share price, the price of ID-share prices of structured securities <strong>and</strong> the<br />
price of mutual funds at 31 December 2008 of ± 15%.<br />
<strong>The</strong> impact of changes in revenue from commissions from a decrease of<br />
investments of 15%.<br />
<strong>The</strong> table below summarises the results of the sensitivity analysis of a change in interest rates, a change in prices of equity<br />
securities <strong>and</strong> changes in the level of commission for the management of which the impact on equity excludes the impact on<br />
the profit <strong>and</strong> loss account. Because of changes in financial markets in the past year, the <strong>Group</strong> has changed the<br />
assumptions of sensitivity analysis to reflect the changes in market conditions.<br />
2009<br />
(in EUR) Impact on profit before tax Impact on equity<br />
Change in interest rate by +50 bp (513,171) (3,005,506)<br />
Change in interest rate by -50 bp 530,451 3,350,363<br />
+15% change in the price of shares 2,154,583 9,230,139<br />
-15% change in the price of shares (2,154,583) (9,230,139)<br />
Change in commissions (investment +15%) 1,627,363 -<br />
Change in commissions (investment -15%) (1,627,363) -<br />
(in EUR) Impact on profit before tax Impact on equity<br />
Change in interest rate by +50 bp (925,475) (6,071,260)<br />
Change in interest rate by -50 bp 954,195 6,642,070<br />
2008<br />
+15% change in the price of shares 3,962,174 21,546,416<br />
-15% change in the price of shares (3,962,174) (21,546,416)<br />
Change in commissions (investment +15%) 3,602,703 -<br />
Change in commissions (investment -15%) (3,602,703) -<br />
133
<strong>The</strong> <strong>Group</strong> <strong>KD</strong> <strong>Group</strong> Annual Report 2009<br />
Notes to Consolidated Financial Statements as at <strong>and</strong> for the year ended 31 December 2009<br />
5.2.4 Currency risk<br />
<strong>The</strong> <strong>Group</strong>’s currency risk is not considered to be significant due to the fact that Slovenia is in the ERM2 system with fixed<br />
foreign currency rates, <strong>and</strong> the euro was introduced in Slovenia on 1 January 2007.<br />
<strong>The</strong> table below summarises the <strong>Group</strong>’s exposure to foreign currency exchange rate risk at 31 December. Included in the<br />
table are the <strong>Group</strong>’s financial assets <strong>and</strong> financial <strong>and</strong> insurance liabilities at carrying amounts, categorised by currency.<br />
31.12.2009<br />
(in EUR) EUR Other Total<br />
Assets<br />
Financial assets at fair value through profit or loss 35,655,676 2,417,696 38,073,372<br />
- Equity securities 13,118,979 1,244,907 14,363,886<br />
- Debt securities 22,536,697 1,172,789 23,709,486<br />
Available for sale 179,454,315 10,606,908 190,061,223<br />
- Equity securities 44,402,232 9,936,137 54,338,369<br />
- Debt securities 135,052,083 670,771 135,722,854<br />
Held to maturity 17,286,402 1,008,883 18,295,285<br />
- Debt securities 17,286,402 1,008,883 18,295,285<br />
Investment property 29,813,540 - 29,813,540<br />
Loans <strong>and</strong> receivables 153,711,798 8,090,466 161,802,264<br />
Investments in loans <strong>and</strong> other financial receivables 87,312,526 4,706,468 92,018,994<br />
Insurance receivables <strong>and</strong> other receivables 56,292,858 1,588,751 57,881,609<br />
Accruals <strong>and</strong> DAC 10,106,414 1,795,247 11,901,661<br />
Reinsurance assets 19,427,641 21,367 19,449,008<br />
Cash <strong>and</strong> cash equivalents 30,509,894 10,220,178 40,730,072<br />
Total assets 465,859,266 32,365,498 498,224,764<br />
Liabilities<br />
Debt securities (issued) 75,521,481 - 75,521,481<br />
Loans 118,904,123 279,925 119,184,048<br />
Derivative financial instruments 1,426,656 - 1,426,656<br />
Insurance contracts 212,991,566 6,976,229 219,967,795<br />
Insurance contracts with DPF 76,059,996 70,193 76,130,189<br />
Investment contracts with DPF 17,692,461 10,793 17,703,254<br />
Total liabilities 502,596,283 7,337,140 509,933,423<br />
134
<strong>The</strong> <strong>Group</strong> <strong>KD</strong> <strong>Group</strong> Annual Report 2009<br />
Notes to Consolidated Financial Statements as at <strong>and</strong> for the year ended 31 December 2009<br />
31.12.2008<br />
(in EUR) EUR Other Total<br />
Assets<br />
Financial assets at fair value through profit or loss 31,509,851 4,000,829 35,510,680<br />
- Equity securities 11,847,866 4,000,829 15,848,695<br />
- Debt securities 19,661,985 - 19,661,985<br />
Available for sale 183,734,682 3,740,183 187,474,865<br />
- Equity securities 64,006,977 2,831,677 66,838,654<br />
- Debt securities 119,727,705 908,506 120,636,211<br />
Held to maturity 6,996,697 848,012 7,844,709<br />
- Debt securities 6,996,697 848,012 7,844,709<br />
Investment property 28,707,587 - 28,707,587<br />
Loans <strong>and</strong> receivables 166,429,798 14,992,009 181,421,807<br />
Investments in loans <strong>and</strong> other financial receivables 86,251,324 11,534,356 97,785,680<br />
Insurance receivables <strong>and</strong> other receivables 66,661,969 3,186,158 69,848,127<br />
Accruals <strong>and</strong> DAC 13,516,505 271,495 13,788,000<br />
Reinsurance assets 17,360,568 2,135 17,362,703<br />
Cash <strong>and</strong> cash equivalents 26,061,591 5,243,601 31,305,192<br />
Total assets 460,800,774 28,826,769 489,627,543<br />
Liabilities<br />
Debt securities (issued) 75,449,991 - 75,449,991<br />
Borrowings 106,027,899 80,013 106,107,912<br />
Derivative financial instruments 350,696 - 350,696<br />
Insurance contracts 207,727,450 3,017,771 210,745,221<br />
Insurance contracts with DPF 66,899,135 36,593 66,935,728<br />
Investment contracts with DPF 16,330,164 - 16,330,164<br />
Total liabilities 472,785,335 3,134,377 475,919,712<br />
5.3 Operational risk<br />
Operational risks are risks related to errors in the functioning of business processes, information technology, organisation <strong>and</strong><br />
similar areas.<br />
<strong>The</strong> operational risks of the <strong>Group</strong> are managed in the subsidiaries by monitoring the weaknesses <strong>and</strong> opportunities of their<br />
businesses <strong>and</strong> by controlling the business processes. <strong>The</strong> operational risk management is based on the <strong>Group</strong>’s strategic<br />
<strong>and</strong> companies’ operational objectives.<br />
<strong>The</strong> <strong>Group</strong> manages operational risks by introducing ISO st<strong>and</strong>ards at the level of the <strong>Group</strong> <strong>and</strong> at its individual members, by<br />
which the <strong>Group</strong> wants to st<strong>and</strong>ardise the business processes. <strong>The</strong> <strong>Group</strong> uses st<strong>and</strong>ardised <strong>and</strong> uniform software in the<br />
area of accounting <strong>and</strong> investments. Operational risks are reduced also with uniform system of annual planning <strong>and</strong> interim<br />
<strong>and</strong> annual reporting.<br />
5.4 General business risk<br />
General business risks are related to the <strong>Group</strong>’s operations in the environment, such as the economic environment,<br />
legislation <strong>and</strong> similar, on which the <strong>Group</strong> has no direct impact.<br />
Such risks are quite difficult to measure or model. In order to manage such risks, the <strong>Group</strong> regularly monitors legislation<br />
through its technical services, as well as developments on the capital market <strong>and</strong> macroeconomic parameters of the markets<br />
in which it is present.<br />
135
<strong>The</strong> <strong>Group</strong> <strong>KD</strong> <strong>Group</strong> Annual Report 2009<br />
Notes to Consolidated Financial Statements as at <strong>and</strong> for the year ended 31 December 2009<br />
5.5 Capital management<br />
Board of Directors takes a decision on maintenance of significant (large) capital scope to ensure the confidence of all<br />
participants <strong>and</strong> development of <strong>KD</strong> <strong>Group</strong>. As one of the strategic indicators, the <strong>Group</strong> defines return on equity as the ratio<br />
between net profit for the year of the majority owner <strong>and</strong> the average value of the majority owner’s equity. <strong>The</strong> <strong>Group</strong> seeks to<br />
keep a balance between large returns which can be reached by higher indebtedness, <strong>and</strong> the advantages <strong>and</strong> safety of a<br />
powerful capital structure. Return on equity is one of the strategic indicators of the <strong>Group</strong>'s annual plan, which is adopted on<br />
the basis of monitoring developments in the environment <strong>and</strong> on maintaining an optimal capital structure. Return on equity is<br />
calculated as the ratio between net profit / loss generated <strong>and</strong> the average value of the total equity, less the value of earnings.<br />
Pursuant to the decision of the General Meeting of Shareholders, the parent company <strong>KD</strong> <strong>Group</strong> d. d. has established its own<br />
share fund. On 31 December 2009 there were 62,201 ordinary shares <strong>KD</strong>HR, which accounts for 2.11% of issued capital <strong>and</strong><br />
51,306 preference shares <strong>KD</strong>HP, which represents 1.74% of issued capital.<br />
<strong>The</strong> investment plan, optimal capital structure policy, expectations <strong>and</strong> interests of shareholders are the basis for<br />
development of the dividend policy. <strong>The</strong> entity distributes dividends once a year. <strong>The</strong> Board of Directors of the parent<br />
company takes a decision about the amount of proposed dividends. Dividends are distributed from the retained earnings of<br />
the parent company, which is regulated in compliance with valid regulations in Slovenia; the decision about dividend<br />
distribution is taken by the General Meeting of Shareholders.<br />
<strong>KD</strong> <strong>Group</strong> d. d. has no specific aims about ownership by employees <strong>and</strong> has no share option programme. In the <strong>Group</strong> there<br />
were no changes in the management of capital in 2009.<br />
<strong>The</strong> parent company is not subject to capital requirements which could be set by the regulatory authority.<br />
For an entity that has subsidiaries in the financial <strong>and</strong> insurance segment, capital requirements are provided by the regulatory<br />
authority. <strong>The</strong> management of the entities provides the proper amount of capital (capital adequacy) according to the scope<br />
<strong>and</strong> type of operations which are managed by the management <strong>and</strong> according to the risks to which they are exposed.<br />
5.6 Fair value of financial assets <strong>and</strong> liabilities<br />
Fair value is the amount for which an asset could be exchanged or a liability settled between knowledgeable, willing parties in<br />
an arm’s length transaction.<br />
<strong>The</strong> <strong>Group</strong> establishes the fair value of financial assets in the following way:<br />
- <strong>The</strong> fair value of investments in equity instruments that have a quoted market price on an active market is determined as<br />
the product of the number of units of the instrument <strong>and</strong> its quoted market price.<br />
- If there is no active market for the financial instruments, methods of assessing the fair value of a financial instrument are<br />
used. Valuation techniques include using recent arm’s length market transactions between knowledgeable, willing<br />
parties, if available, reference to the current fair value of another instrument that is substantially the same, <strong>and</strong><br />
discounted cash flow analysis. <strong>The</strong> <strong>Group</strong> has developed a model for assessing the fair value of non-listed equity<br />
instruments; its appropriateness was assessed by an independent qualified expert. Using this model, the fair values of<br />
significant financial investments in non-listed companies are estimated once a year on the basis of data available.<br />
- <strong>The</strong> fair value of loans <strong>and</strong> deposits represents the discounted amount of estimated future cash flows expected to be<br />
received. Expected cash flows are discounted at current market rates to determine fair value.<br />
- <strong>The</strong> estimated fair value of borrowings not quoted on an active market is based on discounted cash flows using current<br />
market rates. <strong>The</strong> aggregate fair value of quoted debt securities is calculated based on quoted market prices.<br />
- For current receivables <strong>and</strong> liabilities, it is assumed their carrying value reflects their fair value.<br />
- For a contract containing a discretionary participation feature, the fair value cannot be measured reliably.<br />
<strong>The</strong> following table summarises the carrying amounts <strong>and</strong> fair values of those financial assets <strong>and</strong> liabilities not presented on<br />
the <strong>Group</strong>’s balance sheet at their fair value. Bid prices are used to estimate fair values of assets, whereas offer prices are<br />
applied to liabilities.<br />
136
<strong>The</strong> <strong>Group</strong> <strong>KD</strong> <strong>Group</strong> Annual Report 2009<br />
Notes to Consolidated Financial Statements as at <strong>and</strong> for the year ended 31 December 2009<br />
(in EUR) Carrying value Fair value<br />
31. 12. 2009 31. 12. 2008 31. 12. 2009 31. 12. 2008<br />
Financial assets<br />
Investment securities (held to maturity) 18,295,285 7,844,709 18,295,285 7,844,709<br />
Loans <strong>and</strong> bank deposits 92,017,877 97,785,680 92,048,655 97,748,361<br />
110,313,162 105,630,389 110,343,340 105,593,070<br />
Financial liabilities<br />
Borrowings 101,642,448 106,107,912 101,491,404 106,977,118<br />
Bonds issued 75,521,481 75,449,991 72,623,944 74,573,007<br />
177,163,929 181,557,903 174,115,348 181,550,125<br />
Fair value hierarchy<br />
In 2009, the disclosures of financial assets <strong>and</strong> liabilities measured at fair value were amended by disclosures serving to<br />
disclose the financial assets <strong>and</strong> financial liabilities measured at fair value also by the source of valuation by applying a threelevel<br />
hierarchy for each <strong>and</strong> every type of financial instruments. <strong>The</strong> hierarchy is divided into three levels <strong>and</strong> the fair value of<br />
financial assets is shown below:<br />
- Level 1 includes the assets where fair value is determined entirely on the basis of prices quoted on an active market<br />
for similar instruments.<br />
- Level 2 includes the assets where fair value is determined on the basis of the valuation models where the inputs are<br />
obtained from publicly accessible market data (e.g.: market interest rates).<br />
- Level 3 includes the assets where fair value is determined on the basis of the valuation models where inputs that<br />
cannot be based on observable market are taken into account.<br />
Financial assets <strong>and</strong> liabilities by fair value hierarchy in 2009<br />
(in EUR)<br />
Total fair<br />
value Level 1 Level 2 Level 3<br />
Assets measured at fair value<br />
Financial assets at fair value through profit or loss<br />
Equity securities 14,363,886 13,274,974 1,088,912 -<br />
Debt securities 23,709,486 23,709,486 - -<br />
Financial assets, available for sale<br />
Equity securities 50,395,798 42,670,344 4,470,831 3,254,623<br />
Debt securities 135,722,854 134,916,334 806,520 -<br />
Derivative financial instruments<br />
Derivative financial instruments for trading 1,146,675 - 1,146,675 -<br />
Liabilities measured at fair value<br />
Derivative financial instruments<br />
Derivative financial instruments for hedge accounting 1,426,656 - 1,426,656 -<br />
<strong>The</strong> valuation of the investments made in equity securities classified at Level 3 was carried out on the basis of the<br />
assessment made for all equity capital <strong>and</strong> by using the discounted future net cash flows method . <strong>The</strong> method was based on<br />
the key assumptions set forth below:<br />
− <strong>The</strong> estimated free cash flows until 2018,<br />
− <strong>The</strong> leverage rate of the insurance company, <strong>and</strong><br />
− <strong>The</strong> discount for the lack of marketability.<br />
<strong>The</strong> effect of the modified assumptions would not have any material effect on the financial statements.<br />
137
<strong>The</strong> <strong>Group</strong> <strong>KD</strong> <strong>Group</strong> Annual Report 2008<br />
Notes to Consolidated Financial Statements as at <strong>and</strong> for the year ended 31 December 2008<br />
Changes in Level 3 Instruments for the year ended 31. 12. 2009<br />
Assets measured at fair value<br />
At 1<br />
January<br />
2009<br />
Total realised<br />
gains / (loss) in<br />
income statement<br />
Total unrealised<br />
gains / (loss) in<br />
income statement<br />
Total gains /<br />
(loss) recorded in<br />
other<br />
comprehensive<br />
income Purchases Sales<br />
Transfers from<br />
level 1 <strong>and</strong><br />
level 2<br />
At 31<br />
December<br />
2009<br />
Total gains or losses<br />
for the period included<br />
in profit or loss for<br />
assets / liabilities held<br />
at 31 December 2009<br />
Financial assets, available for sale<br />
Equity securities 1,324,996 - - (111,446) 2,041,073 - - 3,254,623 (111,446)<br />
Gains or losses (realised <strong>and</strong> unrealised) included in profit or loss for the period are presented in the consolidated income statement as follows:<br />
2009<br />
(in EUR)<br />
Realised gains<br />
Fair values gains <strong>and</strong><br />
losses<br />
Total<br />
Total gains or losses included in profit or loss for the<br />
period - - -<br />
Total gains or losses included in profit <strong>and</strong> loss for the<br />
period for assets held at the end of the reporting period - (111,446) (111,446)<br />
<strong>The</strong>re have been no transfers from Level 2 to Level 1 in 2009.<br />
138
<strong>The</strong> <strong>Group</strong> <strong>KD</strong> <strong>Group</strong> Annual Report 2009<br />
Notes to Consolidated Financial Statements as at <strong>and</strong> for the year ended 31 December 2009<br />
6. Segment reporting<br />
<strong>The</strong> <strong>Group</strong>’s main activities, i.e. business segments, are the following:<br />
- Property insurance<br />
- Life insurance<br />
- Health insurance<br />
- Financial operations (asset management <strong>and</strong> other financial operations)<br />
- Banking<br />
- Other (real estate/immoveable property, publishing, etc.)<br />
As at 31 December 2009, the <strong>Group</strong> operated in Slovenia <strong>and</strong> the following other countries: Bosnia <strong>and</strong> Herzegovina,<br />
Bulgaria, Croatia, Cyprus, Netherl<strong>and</strong>s, Slovakia, Romania, Serbia, Ukraine, Uzbekistan <strong>and</strong> United States.<br />
6.1. Primary reporting format – business segments<br />
6.1.1 Performance by business segment<br />
<strong>The</strong> segment results for the year ended 31 December 2009 are as follows:<br />
(in EUR) 2009<br />
Property<br />
insurance Life insurance<br />
Health<br />
insurance<br />
Financial<br />
operations Banking Other <strong>Group</strong><br />
Total gross segment<br />
sales 143,882,060 99,053,668 100,150,423 11,672,110 1,384,704 8,108,462 364,251,427<br />
Inter-segment sales (1,146,097) (8,978,712) - (290,641) (698,467) (537,010) (11,650,927)<br />
Sales 142,735,963 90,074,956 100,150,423 11,381,469 686,237 7,571,452 352,600,500<br />
Interest income 6,061,771 4,518,695 907,032 1,797,346 893,823 73,063 14,251,730<br />
Operating profit/segment<br />
result 3,747,551 (8,363,340) 4,792,700 (13,852,708) (3,678,134) (1,078,554) (18,432,485)<br />
Finance costs – net 10,177 (1,949,083) (1,146) (7,245,351) (275,565) (102,946) (9,563,914)<br />
Share of profit of<br />
associates - - - (23,426,946) - - (23,426,946)<br />
Profit before income tax 3,757,728 (10,312,423) 4,791,554 (44,525,005) (3,953,699) (1,181,500) (51,423,345)<br />
Income tax expense (1,577,759) (116,929) (983,534) 9,528,853 535,654 (186,378) 7,199,907<br />
Profit or loss for the<br />
year 2,179,969 (10,429,352) 3,808,020 (34,996,152) (3,418,045) (1,367,878) (44,223,438)<br />
In Finance costs – net are included also net foreign exchange differences.<br />
139
<strong>The</strong> <strong>Group</strong> <strong>KD</strong> <strong>Group</strong> Annual Report 2009<br />
Notes to Consolidated Financial Statements as at <strong>and</strong> for the year ended 31 December 2009<br />
<strong>The</strong> segment results for the year ended 31 December 2008 are as follows:<br />
(in EUR) 2008<br />
Property<br />
insurance Life insurance<br />
Health<br />
insurance<br />
Financial<br />
operations Banking Other <strong>Group</strong><br />
Total gross segment<br />
l<br />
138,623,094 105,493,633 97,661,626 17,949,301 13,351,149 8,302,783 381,381,586<br />
Inter-segment sales (791,412) (15,984,763) (1,700,416) (1,855,199) (1,223,646) (509,399) (22,064,835)<br />
Sales 137,831,682 89,508,870 95,961,210 16,094,102 12,127,503 7,793,384 359,316,751<br />
Interest income 6,593,723 4,749,744 784,529 2,553,466 27,722 115,211 14,824,395<br />
Operating<br />
profit/segment result (14,203,819) (21,231,013) 2,051,933 (17,917,372) 1,590,701 (149,818) (49,859,388)<br />
Finance costs – net (638,797) 549,213 (453) (6,352,067) (1,202,716) (378,646) (8,023,466)<br />
Share of profit of<br />
associates (3,060,764) (1,043,773) - (23,302,843) - 351 (27,407,029)<br />
Profit before income<br />
tax (17,903,380) (21,725,573) 2,051,480 (47,572,281) 387,985 (528,113) (85,289,882)<br />
Income tax expense 4,188,301 764,399 (383,029) 4,176,332 (498,048) 37,944 8,285,899<br />
Profit or loss for the<br />
year (13,715,079) (20,961,174) 1,668,451 (43,395,949) (110,063) (490,169) (77,003,983)<br />
<strong>The</strong> costs are allocated to segments as they originally occur in the operations of each business segment <strong>and</strong> as they are<br />
reported by the subsidiaries which are included in the relevant segment.<br />
Other segment items included in the income statement for the year ended 31 December 2009 are as follows:<br />
(in EUR) 2009<br />
Property<br />
insurance<br />
Life<br />
insurance<br />
Health<br />
insurance<br />
Financial<br />
operations<br />
Banking Other <strong>Group</strong><br />
Depreciation <strong>and</strong> amortisation (1.935.032) (1.379.119) (725.141) (1.334.244) (394.924) (305.027) (6.073.487)<br />
Impairment of trade receivables (3.590.270) (299.753) (578.575) (28.897) - (30.909) (4.528.404)<br />
Other segment items included in the income statement for the year ended 31 December 2008 are as follows:<br />
(in EUR) 2008<br />
Property<br />
insurance<br />
Life<br />
insurance<br />
Health<br />
insurance<br />
Financial<br />
operations<br />
Cinematography<br />
Other<br />
<strong>Group</strong><br />
Depreciation <strong>and</strong> amortisation (1,716,312) (1,222,365) (760,886) (1,221,236) (2,744,043) (258,530) (7,923,372)<br />
Impairment of trade receivables (1,413,107) (542,711) (715,208) (39,165) - (35,652) (2,745,843)<br />
Inter-segment transfers or transactions are entered into under the normal commercial terms <strong>and</strong> conditions that would also be<br />
available to unrelated third parties.<br />
140
<strong>The</strong> <strong>Group</strong> <strong>KD</strong> <strong>Group</strong> Annual Report 2009<br />
Notes to Consolidated Financial Statements as at <strong>and</strong> for the year ended 31 December 2009<br />
<strong>The</strong> segment assets <strong>and</strong> liabilities at 31 December 2009 <strong>and</strong> for the year then ended are as follows:<br />
(in EUR) 31.12.2009<br />
Property<br />
insurance<br />
Life insurance<br />
Health insurance<br />
Financial<br />
operations Banking Other <strong>Group</strong><br />
Assets 241,077,576 291,570,746 39,973,724 161,513,881 46,751,286 14,588,780 795,475,993<br />
Associates 2,718,849 599,722 - 47,953,517 342 1,036,321 52,308,751<br />
Total assets 243,796,425 292,170,468 39,973,724 209,467,398 46,751,628 15,625,101 847,784,744<br />
Liabilities 221,693,367 270,013,578 26,550,416 146,556,087 29,209,967 2,156,310 696,179,725<br />
Financial liabilities 4,006,656 12,306,805 - 142,220,619 27,857,428 8,314,021 194,705,529<br />
Capital expenditure 2,131,186 1,830,445 - 4,242,402 2,087,758 1,728,294 12,020,085<br />
<strong>The</strong> segment assets <strong>and</strong> liabilities at 31 December 2008 <strong>and</strong> for the year then ended are as follows:<br />
(in EUR) 31.12.2008<br />
Property<br />
insurance<br />
Life<br />
insurance<br />
Health<br />
insurance<br />
Financial<br />
operations<br />
Cinematography<br />
Other<br />
<strong>Group</strong><br />
Assets 236,687,187 217,968,350 38,227,230 205,654,926 - 15,397,332 713,935,025<br />
Associates 2,746,728 599,722 - 76,765,206 - 965,628 81,077,284<br />
Total assets 239,433,915 218,568,072 38,227,230 282,420,132 - 16,362,960 795,012,309<br />
Liabilities 218,849,191 190,222,994 28,755,316 157,264,233 - 5,975,190 601,066,924<br />
Financial liabilities 12,016,352 9,848,863 - 152,059,632 - 7,633,056 181,557,903<br />
Capital expenditure<br />
2,855,958 3,750,267 69,634 15,709,725 - 618,275 23,003,859<br />
Segment assets consist primarily of property, plant <strong>and</strong> equipment, intangible assets, inventories, financial assets, cash, <strong>and</strong><br />
operating <strong>and</strong> other receivables.<br />
Segment liabilities comprise financial <strong>and</strong> operating liabilities. Internal transactions <strong>and</strong> balances with particular business<br />
segments have been eliminated from the above amounts.<br />
141
<strong>The</strong> <strong>Group</strong> <strong>KD</strong> <strong>Group</strong> Annual Report 2009<br />
Notes to Consolidated Financial Statements as at <strong>and</strong> for the year ended 31 December 2009<br />
6.2 Secondary reporting format - geographical segments<br />
6.2.1 Performance by geographical segment<br />
<strong>The</strong> <strong>Group</strong>’s business segments operate in three main geographical areas, even though they are managed on a worldwide<br />
basis. <strong>The</strong> home country of the <strong>Group</strong> is Slovenia. <strong>The</strong> areas of operation are principally property insurance, life insurance,<br />
health insurance, financial services (asset management <strong>and</strong> other financial operations), banking <strong>and</strong> other (real estate,<br />
publishing, etc.).<br />
<strong>The</strong> <strong>Group</strong> particularly operates in Slovenia, in EU countries <strong>and</strong> other countries of South Eastern Europe.<br />
(in EUR) 2009 2008<br />
Sales<br />
Slovenia 339,558,426 351,113,529<br />
Euro area 4,521,620 5,494,951<br />
Other countries 8,520,454 2,708,271<br />
352,600,500 359,316,751<br />
(in EUR) 2009 2008<br />
Total assets<br />
Slovenia 715,832,730 665,026,087<br />
Euro area 97,634,794 72,741,414<br />
Other countries 34,317,220 57,244,808<br />
847,784,744 795,012,309<br />
(in EUR) 2009 2008<br />
Associates<br />
Slovenia 50,407,259 62,552,159<br />
Euro area 1,028,403 2,266,559<br />
Other countries 873,089 16,258,567<br />
52,308,751 81,077,285<br />
(in EUR) 2009 2008<br />
Capital expenditure<br />
Slovenia 11,105,850 13,604,941<br />
Euro area 135,198 520,036<br />
Other countries 779,037 10,531,904<br />
12,020,085 24,656,881<br />
(in EUR) 2009 2008<br />
Analysis of sales by category<br />
Revenue from the sales of goods 3,959,957 4,481,153<br />
Revenue from services 348,640,543 365,725,185<br />
352,600,500 370,206,338<br />
142
<strong>The</strong> <strong>Group</strong> <strong>KD</strong> <strong>Group</strong> Annual Report 2009<br />
Notes to Consolidated Financial Statements as at <strong>and</strong> for the year ended 31 December 2009<br />
7. Property, plant <strong>and</strong> equipment<br />
(in EUR)<br />
L<strong>and</strong> &<br />
buildings<br />
Vehicles &<br />
machinery<br />
Furniture,<br />
fittings &<br />
equipment<br />
As at 1 January 2008<br />
Cost 65,186,188 20,032,673 34,571,658 119,790,519<br />
Accumulated depreciation (13,344,007) (11,173,011) (11,406,491) (35,923,509)<br />
Carrying amount 51,842,181 8,859,662 23,165,167 83,867,010<br />
Year 2008<br />
Opening carrying amount 51,842,181 8,859,662 23,165,167 83,867,010<br />
Exchange differences (161,735) 408,345 (39,681) 206,929<br />
Acquisition of subsidiary (Note 32) - 465 - 465<br />
Disposal of subsidiary (Note 32) (10,059,739) (8,829,634) (13,926,064) (32,815,437)<br />
A<strong>dd</strong>itions 1,278,336 14,705,637 1,745,332 17,729,305<br />
Disposals (6,187,361) (109,245) (414,285) (6,710,891)<br />
Depreciation charge (895,166) (2,219,225) (2,657,317) (5,771,708)<br />
Transfer to investment property (20,202,004) (20,202,004)<br />
Closing carrying amount 15,614,512 12,816,005 7,873,152 36,303,669<br />
As at 31 December 2008<br />
Cost 18,956,006 18,959,446 16,088,552 54,004,004<br />
Accumulated depreciation (3,341,494) (6,143,441) (8,215,400) (17,700,335)<br />
Carrying amount 15,614,512 12,816,005 7,873,152 36,303,669<br />
Year 2009<br />
Opening carrying amount 15,614,512 12,816,005 7,873,152 36,303,669<br />
Exchange differences (124,395) (33,525) (351,282) (509,202)<br />
Acquisition of subsidiary (Note 32)<br />
Total<br />
339,521 13,096 45,134 397,751<br />
Disposal of subsidiary (Note 32)<br />
(160,540) (6,867) (55,282) (222,689)<br />
A<strong>dd</strong>itions 2,189,000 1,599,308 856,194 4,644,503<br />
Disposals (820,525) (432,351) (638,442) (1,891,318)<br />
Depreciation charge (221,427) (2,096,253) (1,279,621) (3,597,301)<br />
Transfer to investment property - - - -<br />
Closing carrying amount 16,816,146 11,859,413 6,449,853 35,125,413<br />
As at 31 December 2009<br />
Cost 21,261,685 18,800,467 15,167,259 55,229,411<br />
Accumulated depreciation (4,445,539) (6,941,054) (8,717,406) (20,103,999)<br />
Carrying amount 16,816,146 11,859,413 6,449,853 35,125,412<br />
Bank borrowings are collateralised by l<strong>and</strong> <strong>and</strong> buildings with a carrying amount of EUR 2,073,430 (2008: EUR 2,668,982).<br />
<strong>The</strong> value of property, plant <strong>and</strong> equipment under construction as at 31 December 2009 was EUR 394,145 (2008: EUR<br />
382,037).<br />
143
<strong>The</strong> <strong>Group</strong> <strong>KD</strong> <strong>Group</strong> Annual Report 2009<br />
Notes to Consolidated Financial Statements as at <strong>and</strong> for the year ended 31 December 2009<br />
8. Investment property<br />
(in EUR) 31.12.2009 31.12.2008<br />
As at 1 January<br />
Cost 32,693,964 24,058,580<br />
Accumulated depreciation (3,986,377) (3,457,059)<br />
Carrying amount 28,707,587 20,601,521<br />
Year ended 31 December<br />
Opening carrying amount 28,707,587 20,601,521<br />
Acquisition of subsidiary - -<br />
Disposal of subsidiary - (12,566,563)<br />
A<strong>dd</strong>itions 2,688,537 1,649,333<br />
Transfer from property, plan <strong>and</strong> equipment - 20,202,004<br />
Disposals (1,051,007) (536,071)<br />
Depreciation charge (531,577) (642,637)<br />
Closing carrying amount 29,813,540 28,707,587<br />
As at 31 December<br />
Cost 34,292,196 32,693,964<br />
Accumulated depreciation (4,478,656) (3,986,377)<br />
Carrying amount 29,813,540 28,707,587<br />
In 2009 the <strong>Group</strong> increased their share of investment properties owned by the <strong>Group</strong>. Consequently, this resulted in an<br />
increase in the investment property recognised in the consolidated financial statements <strong>and</strong> a reduction in the value of<br />
property, plant <strong>and</strong> equipment.<br />
<strong>The</strong> following amounts have been recognised in the income statement:<br />
(in EUR) 2009 2008<br />
Rental income 3,212,082 1,141,511<br />
Direct operating expenses arising from investment properties that generate rental income 723,642 956,250<br />
<strong>The</strong> <strong>Group</strong> does not have any investment properties that do not generate rental income. Lease agreements are short-term<br />
<strong>and</strong> cancellable.<br />
Investments in l<strong>and</strong> <strong>and</strong> buildings are initially measured at acquisition price, including all costs of the transaction. After initial<br />
recognition, they are disclosed at acquisition price, decreased by the depreciation charge <strong>and</strong> accrued loss attributable to<br />
impairment (cost model) - much like intangible assets.<br />
<strong>The</strong> <strong>Group</strong> assesses the need for impairment of investment property based on valuations of a licensed real estate appraiser,<br />
material changes in real estate prices, <strong>and</strong> under normal market conditions, on a three to five-year basis.<br />
144
<strong>The</strong> <strong>Group</strong> <strong>KD</strong> <strong>Group</strong> Annual Report 2009<br />
Notes to Consolidated Financial Statements as at <strong>and</strong> for the year ended 31 December 2009<br />
9. Intangible assets<br />
(in EUR)<br />
As at 1 January 2008<br />
Goodwill<br />
Licences<br />
Computer<br />
software<br />
Cost 84,228,319 2,005,457 12,463,933 98,697,709<br />
Accumulated amortisation <strong>and</strong> impairment (1,569,005) (630,546) (8,601,517) (10,801,068)<br />
Carrying amount 82,659,314 1,374,911 3,862,416 87,896,641<br />
Year 2008<br />
Opening carrying amount 82,659,314 1,374,911 3,862,416 87,896,641<br />
Exchange differences (4,235) (27,406) (31,641)<br />
A<strong>dd</strong>itions 4,530,347 141,112 5,212,817 9,884,276<br />
Acquisition of subsidiary 127,058 - - 127,058<br />
Increase in equity share of subsidiaries - - - -<br />
Disposals - (26,908) - (26,908)<br />
Disposal of subsidiary (1,017,744) (124,702) (1,247,151) (2,389,597)<br />
Amortisation charge (65,347) (1,443,679) (1,509,026)<br />
Impairment charge (25,722,775) - - (25,722,775)<br />
Closing carrying amount 60,576,200 1,294,831 6,356,997 68,228,028<br />
As at 31 December 2008<br />
Cost 87,867,980 1,362,505 15,102,612 104,333,097<br />
Accumulated amortisation <strong>and</strong> impairment (27,291,780) (67,674) (8,745,615) (36,105,069)<br />
Carrying amount 60,576,200 1,294,831 6,356,997 68,228,028<br />
Year 2009<br />
Opening carrying amount 60,576,200 1,294,831 6,356,997 68,228,028<br />
Exchange differences - (2,694) (18,507) (21,201)<br />
A<strong>dd</strong>itions 429,604 223,416 6,722,562 7,375,582<br />
Acquisition of subsidiary 4,814,498 - - 4,814,498<br />
Increase in equity share of subsidiaries - - - -<br />
Disposals - (28,204) (1,045,444) (1,073,648)<br />
Disposal of subsidiary (Pojasnilo 32) - - (147,962) (147,962)<br />
Amortisation charge<br />
- (65,073) (1,879,536) (1,944,609)<br />
Impairment charge<br />
(5,904,886) - - (5,904,886)<br />
Transfer to intangible assets - (1,202,547) 1,202,547 -<br />
Closing carrying amount<br />
59,915,416 219,729 11,190,657 71,325,802<br />
As at 31 December 2009<br />
Cost<br />
Accumulated amortisation <strong>and</strong> impairment<br />
Carrying amount<br />
Total<br />
93,112,082 384,198 20,651,778 114,148,058<br />
(33,196,666) (164,469) (9,461,121) (42,822,256)<br />
59,915,416 219,729 11,190,657 71,325,802<br />
<strong>The</strong> value of intangible assets under construction as at 31 December 2009 was EUR 2,459,922 (2008: EUR 1,977,890).<br />
145
<strong>The</strong> <strong>Group</strong> <strong>KD</strong> <strong>Group</strong> Annual Report 2009<br />
Notes to Consolidated Financial Statements as at <strong>and</strong> for the year ended 31 December 2009<br />
<strong>The</strong> segment-level summary of the goodwill allocation is presented below:<br />
(in EUR)<br />
Property<br />
insurance<br />
Financial<br />
Life<br />
operations Banking insurance Other <strong>Group</strong><br />
Slovenia 24,441,425 28,677,000 - 2,855,310 728,690 56,702,425<br />
Euro area - 440,656 - - - 440,656<br />
Other countries - 2,395,201 - - 377,134 2,772,335<br />
Total at 31 December 2009 24,441,425 31,512,857 - 2,855,310 1,105,824 59,915,416<br />
Slovenia 24,441,425 28,677,000 - 2,855,310 299,008 56,272,743<br />
Euro area - 641,376 - 83,382 - 724,757<br />
Other countries - 3,578,705 - - - 3,578,705<br />
Total at 31 December 2008 24,441,425 32,897,081 - 2,938,692 299,008 60,576,204<br />
Goodwill is allocated mainly to the property insurance <strong>and</strong> financial operations segments <strong>and</strong> is assessed annually for<br />
impairment.<br />
<strong>The</strong> impairment charge of goodwill in the financial operations segment in 2009 was EUR 5,904,886 (in 2008 EUR<br />
25,722,755).<br />
Impairment of goodwill is recognised in other expenses (Note 23).<br />
<strong>The</strong> goodwill of the financial operations segment was assessed by an independent qualified expert using the following key<br />
assumptions in 2009:<br />
- present value of future cash-flows without indebtedness;<br />
- estimation was based on analysis of past operations <strong>and</strong> estimation of future business opportunities;<br />
- cash return was discounted with the appropriate weighted arithmetic average of return rate of debt <strong>and</strong> equity<br />
securities;<br />
- the CAMP model was used, modified for each country;<br />
- assumptions: 4% expected rate of return on non-risk investments, 7% premium for capital risk, 1.05% for systematic<br />
risk, 1% premium for particular risk, 20% discount for illiquidity, political risk factor between 1.05 <strong>and</strong> 1.15, 2%<br />
premium of investment in small companies;<br />
- return on equity between 12.6% <strong>and</strong> 16.1%;<br />
- profitability between 22.2% <strong>and</strong> 30% (depending on individual market saturation);<br />
- growth between 3.6% <strong>and</strong> 30% (depending on individual market saturation).<br />
-<br />
<strong>The</strong> goodwill of the financial operations segment was assessed by an independent qualified expert using the following key<br />
assumptions in 2008:<br />
- present value of future cash-flows without indebtedness;<br />
- estimation was based on analysis of past operations <strong>and</strong> estimation of future business opportunities;<br />
- cash return was discounted with the appropriate weighted arithmetic average of return rate of debt <strong>and</strong> equity<br />
securities;<br />
- the CAMP model was used, modified to each country;<br />
- assumptions: 4% expected rate of return on non-risk investments, 7% premium for capital risk, 1.05% for systematic<br />
risk, 1% premium for particular risk, 25% discount for illiquidity;<br />
- return on equity between 12.6% <strong>and</strong> 16.1%.<br />
In 2009, the appraisal of the property insurance segment was verified using an internal method of evaluation.<br />
146
<strong>The</strong> <strong>Group</strong> <strong>KD</strong> <strong>Group</strong> Annual Report 2009<br />
Notes to Consolidated Financial Statements as at <strong>and</strong> for the year ended 31 December 2009<br />
Key assumptions used in 2009 for the property insurance segment are:<br />
- the income approach (discounted cash flows) <strong>and</strong> market approach methods were used to calculate a range of<br />
values for the property insurance business;<br />
- the best management projections <strong>and</strong> estimates regarding the future premium were used for the period 2009-2014.<br />
For the following years, decreasing growth rates consistent with market growth were used. <strong>The</strong> forecasted growth of<br />
Slovenian general insurance market is approximately 7% annually;<br />
- unearned premium reserve projection is based on the premium earning patterns applied to the gross premium<br />
amount for each calendar year <strong>and</strong> line of business separately;<br />
- ceded premium assumptions range from 0% to 35% of the gross earned premium depending on the line of<br />
business. Ceded claims assumptions range from 0% to 50% of the gross claims incurred depending on the line of<br />
business;<br />
- ultimate loss ratio assumptions for future accident years range from 35% to 110% depending on the line on<br />
business;<br />
- <strong>The</strong> risk discount rate of 12.6% was derived based on CAPM ("Capital Asset Pricing Model").<br />
Based on the results of the valuation, which was performed by an independent qualified expert, the <strong>Group</strong> assessed that the<br />
goodwill related to the property insurance segment does not require impairment. Even if there was a change (within<br />
reasonable limits) in the assumprions, impairment would not be required.<br />
<strong>The</strong> goodwill was assessed using an internal method of evaluation. Goodwill does not require impairment according to this<br />
assessment.<br />
10. Investments in associates<br />
(in EUR) 2009 2008<br />
Balance at 1 January 81,077,285 71,687,821<br />
Acquisitions 4,018,887 14,571,598<br />
Disposals (21,601,237) (3,060,605)<br />
Increase in stake from associate to subsidiary (51,872) -<br />
Increase in stake from AFS investment to associate - 31,288,510<br />
Share of profit <strong>and</strong> revaluation (11,621,213) (27,407,028)<br />
Other revaluation 548,374 (128,586)<br />
Dividends (61,473) (5,874,425)<br />
Exchange differences - -<br />
Impairment - -<br />
Balance at 31 December 52,308,751 81,077,285<br />
In December 2009 the <strong>Group</strong> disposed ofan associated company BIG. <strong>The</strong> largest part of the loss on disposal was realised<br />
by the sale of BIG in the amount EUR 10,634,685, which is recognised in the income statement under financial expenses<br />
from shares in associated companies. Also, the <strong>Group</strong> recognised the largest part of losses attributed to BIG in the amount<br />
EUR 13,539,434.<br />
In July 2009 the <strong>Group</strong> partially disposed of its investment in associate MIG (26.48%), reducing its stake to only 3.73%, which<br />
means that MIG is no longer an associated comapny. <strong>The</strong> <strong>Group</strong> realised EUR 172,003 of gains on dispoal of MIG, which is<br />
recognised in the income statement under financial revenues from shares in associated companies.<br />
<strong>The</strong> <strong>Group</strong> in 2009 recognised profit from its share in <strong>KD</strong> ID in the amount EUR 1,357,457.<br />
In 2009, the <strong>Group</strong> invested EUR 1,625,698 in <strong>KD</strong> <strong>Group</strong> mutual funds, <strong>and</strong> sold EUR 3,187,210 of mutual funds.<br />
<strong>The</strong> <strong>Group</strong> increased the capital of <strong>KD</strong> Private Equity Netherl<strong>and</strong>s in November 2009 in the amount of EUR 481,790 the<br />
<strong>Group</strong>’s equity share in this company has not changed.<br />
147
<strong>The</strong> <strong>Group</strong> <strong>KD</strong> <strong>Group</strong> Annual Report 2009<br />
Notes to Consolidated Financial Statements as at <strong>and</strong> for the year ended 31 December 2009<br />
Information on associates of the <strong>Group</strong>:<br />
(in EUR) 2009<br />
Share of interest<br />
Associates<br />
Registered<br />
office<br />
Associates<br />
Designated<br />
at fair value<br />
through P/L<br />
Total Assets Liabilities Revenue<br />
Profit (loss) –<br />
pro rata share<br />
Concorde PS d.o.o. Slovenia 50.00% - 50.00% 686,618 151,668 695,460 (68,716)<br />
Seaway <strong>Group</strong> d.o.o. Slovenia 45.00% - 45.00% 37,818,585 25,948,653 30,797,223 438,762<br />
Seaway Skupina d.o.o. Slovenia 48.65% - 48.65% 22,016,584 22,023,416 28,790 (3,056)<br />
Seaway Technologies Italy 48.65% - 48.65% 29,862,847 27,731,419 5,026,335 58,388<br />
Žičnice Vogel Bohinj d.d. Slovenia 21.76% - 21.76% 13,690,318 8,325,251 2,652,322 (37,104)<br />
Deželna banka Slovenije d.d. Slovenia 35.62% - 35.62% 955,005,000 876,562,000 51,233,000 137,502<br />
<strong>KD</strong> ID d.d.* Slovenia 11.34% - 11.34% 67,946,778 1,896,101 19,297,429 1,357,457<br />
Semenarna Ljubljana Slovenia 29.90% - 29.90% 57,741,425 44,241,396 46,653,423 71,525<br />
Nama d.d. Slovenia 48.46% - 48.46% 15,469,752 5,262,199 17,161,869 275,857<br />
<strong>KD</strong> Private Equity b.v. Netherl<strong>and</strong>s 48.21% - 48.21% 221,774 26,986 950 (437,202)<br />
Zellner Holdings Limited, Cyprus Cyprus 48.65% - 48.65% 190,143 901,475 - (25,344)<br />
1,200,649,824 1,013,070,564 173,546,801 1,768,069<br />
*together with the parent company <strong>KD</strong> d. d. over 20%<br />
(in EUR) 2008<br />
Share of interest<br />
Associates Registered office Associates<br />
Designated at<br />
fair value<br />
through P/L<br />
Total Assets Liabilities Revenue<br />
Profit (loss) –<br />
pro rata share<br />
Concorde PS d.o.o. Slovenia 50.00% - 50.00% 842,293 153,972 1,036,703 6,093<br />
Seaway <strong>Group</strong> d.o.o. Slovenia 45.00% - 45.00% 42,852,865 31,956,898 38,243,950 855,363<br />
Seaway Skupina d.o.o. Slovenia 48.65% - 48.65% 79,613,155 68,779,774 37,630,193 (3,170)<br />
Seaway Technologies Italy 48.65% - 48.65% 15,799,527 13,950,072 857,774 (78,792)<br />
Žičnice Vogel Bohinj d.d. Slovenia 21.76% - 21.76% 14,485,722 8,950,126 2,821,861 (57,855)<br />
Radio Kranj d.o.o. Slovenia 20.00% - 20.00% 847,952 133,983 739,042 8,981<br />
Deželna banka Slovenije d.d. Slovenia 35.62% - 35.62% 882,385,000 805,505,000 59,923,000 419,568<br />
<strong>KD</strong> ID d.d.* Slovenia 9.93% - 9.93% 56,042,001 1,964,484 18,877,587 (8,717,081)<br />
Semenarna Ljubljana Slovenia 29.90% - 29.90% 57,435,471 43,951,378 54,227,298 (102,554)<br />
Nama d.d. Slovenia 48.46% - 48.46% 17,042,486 7,598,577 18,600,783 231,104<br />
<strong>KD</strong> Private Equity b.v. Netherl<strong>and</strong>s 48.21% - 48.21% 451,172 347,746 13,864 (390,538)<br />
Zellner Holdings Limited, Cyprus 48.65% - 48.65% 185,657 844,894 - (402,425)<br />
C MIG Montenegro 30.21% - 30.21% 16,284,774 2,459,095 215,497 (7,504,207)<br />
BIG FBIH 21.25% - 21.25% 130,922,407 91,019 1,146,547 (3,729,352)<br />
World Life <strong>Group</strong> LLC Cyprus 35.00% - 35.00% 1,012,317 3,434,723 - (847,842)<br />
EU Life <strong>Group</strong> LLC** Ukraine 35.00% - 35.00% 1,386,106 490,037 5,395,217 112,306<br />
EU Life Services LLC** Ukrajina 35.00% - 35.00% 8,850 1,348 130,085 212<br />
*together with the parent company <strong>KD</strong> d. d. over 20%<br />
**effective part<br />
1,361,001,588 1,026,110,318 283,263,234 (20,200,189)<br />
148
<strong>The</strong> <strong>Group</strong> <strong>KD</strong> <strong>Group</strong> Annual Report 2009<br />
Notes to Consolidated Financial Statements as at <strong>and</strong> for the year ended 31 December 2009<br />
11. Financial assets<br />
(in EUR) 31.12.2009 31.12.2008<br />
At fair value through profit or loss<br />
Current<br />
Held for trading 18,301,847 15,387,151<br />
Initially recognised through profit or loss 19,735,404 20,123,529<br />
Non-Current<br />
Held for trading - -<br />
Initially recognised through profit or loss 36,121 -<br />
38,073,372 35,510,680<br />
Held to maturity<br />
Non-current 18,223,586 7,517,833<br />
Current 71,699 326,876<br />
18,295,285 7,844,709<br />
Available for sale<br />
Non-current 165,587,808 157,742,638<br />
Current 24,473,415 29,732,227<br />
190,061,223 187,474,865<br />
Loans <strong>and</strong> receivables<br />
Non-current 11,493,386 7,961,005<br />
Current 80,525,608 89,824,675<br />
92,018,994 97,785,680<br />
Derivative financial instruments 1,146,675 -<br />
Total 339,595,549 328,615,934<br />
<strong>The</strong> value of securities pledged as collateral for liabilities in 2009 amounted to EUR 1,134,280 (2008: EUR 11,407,847).<br />
11.1 Financial assets at fair value through profit or loss – held for trading<br />
(in EUR) 31. 12. 2009 31. 12. 2008<br />
Equity securities<br />
Listed securities 11,058,431 13,265,871<br />
Debt securities<br />
Listed securities:<br />
Fixed interest rate 6,699,642 1,573,405<br />
Variable interest rate 543,774 547,875<br />
7,243,416 2,121,280<br />
Government bonds - -<br />
Total 18,301,847 15,387,151<br />
149
<strong>The</strong> <strong>Group</strong> <strong>KD</strong> <strong>Group</strong> Annual Report 2009<br />
Notes to Consolidated Financial Statements as at <strong>and</strong> for the year ended 31 December 2009<br />
11.2 Financial assets at fair value through profit or loss – other assets<br />
(in EUR) 31. 12. 2009 31. 12. 2008<br />
Equity securities<br />
Listed securities 3,305,455 2,582,824<br />
Debt securities<br />
Listed securities<br />
Fixed interest rate 15,836,767 16,804,008<br />
Variable interest rate - -<br />
15,836,767 16,804,008<br />
Non-listed securities<br />
Fixed interest rate 261,437 236,536<br />
Government bonds 367,866 500,161<br />
Total 19,771,525 20,123,529<br />
11.3 Investments held to maturity<br />
(in EUR) 31. 12. 2009 31. 12. 2008<br />
Debt securities<br />
Listed securities<br />
Fixed interest rate 9,070,816 6,061,421<br />
Variable interest rate 209,195 209,145<br />
9,280,011 6,270,566<br />
Non-listed securities<br />
Fixed interest rate 417,720 427,282<br />
Government bonds 8,597,554 1,146,861<br />
Total 18,295,285 7,844,709<br />
11.4 Financial assets available for sale<br />
(in EUR) 31. 12. 2009 31. 12. 2008<br />
Equity securities<br />
Listed securities 42,670,344 65,333,146<br />
Non-listed securities 11,668,025 1,505,508<br />
54,338,369 66,838,654<br />
Debt securities<br />
Listed securities<br />
Fixed interest rate 34,163,236 30,543,147<br />
Variable interest rate 1,478,407 1,536,065<br />
35,641,643 32,079,212<br />
Non-listed securities<br />
Fixed interest rate 539,020 -<br />
Government bonds 99,542,191 88,556,999<br />
Total 190,061,223 187,474,865<br />
150
<strong>The</strong> <strong>Group</strong> <strong>KD</strong> <strong>Group</strong> Annual Report 2009<br />
Notes to Consolidated Financial Statements as at <strong>and</strong> for the year ended 31 December 2009<br />
11.5 Investments in loans <strong>and</strong> other financial receivables<br />
(in EUR) 31. 12. 2009 31. 12. 2008<br />
Loans to individuals<br />
Non-current 5,770,983 526,970<br />
Current 1,065,418 3,070,884<br />
Loans to corporate entities<br />
Non-current 3,077,240 4,585,241<br />
Current 21,796,127 29,979,899<br />
Loans to related parties<br />
Non-current - -<br />
Current 14,594,479 14,038,840<br />
Bank deposits<br />
Non-current 5,899,160 2,946,609<br />
Current 26,281,159 42,969,280<br />
Total loans 78,484,566 98,117,723<br />
Dividend receivables<br />
1,117 2,574<br />
Less: allowance for losses on loans <strong>and</strong> advances<br />
Non-current (80,846) (100,933)<br />
Current (5,392,621) (233,684)<br />
(5,473,467) (334,617)<br />
Total other loans <strong>and</strong> receivables 73,012,216 97,785,680<br />
Loans to banks 4,896,696 -<br />
Loans to non-banking clients 14,110,082 -<br />
19,006,778 -<br />
Total 92,018,994 97,785,680<br />
Investments in loans include also investment contracts assets.<br />
Current bank deposits are not accounted for as as cash <strong>and</strong> cash equivalents, as the insurance undertakings in the <strong>Group</strong><br />
recognise these as investments.<br />
Movement in allowance for losses on loans:<br />
(in EUR) 2009 2008<br />
Balance as at 1 January 334,717 1,349,910<br />
Impairment during the year 5,164,971 7,608<br />
Disposal of subsidiaries - (860,052)<br />
Reversal of impairment during the year (26,121) (162,849)<br />
Balance as at 31 December 5,473,467 334,717<br />
151
<strong>The</strong> <strong>Group</strong> <strong>KD</strong> <strong>Group</strong> Annual Report 2009<br />
Notes to Consolidated Financial Statements as at <strong>and</strong> for the year ended 31 December 2009<br />
<strong>The</strong> effective interest rates on loans <strong>and</strong> deposits were as follows:<br />
2009 2008<br />
Non-current loans 2.50% – 8.00% 6.57% – 8.00%<br />
Current loans 2.24% – 9.00% 6.00% – 10.00%<br />
Loans to related parties 2.24% – 8.00% 4.92% – 8.00%<br />
Short-term bank deposits 1.40% – 1.80% 2.80% – 4.85%<br />
11.6 Movements in financial assets<br />
(in EUR)<br />
Fair value through<br />
profit or loss –<br />
trading<br />
Fair value through<br />
profit or loss –<br />
other<br />
Available for<br />
sale<br />
Held to<br />
maturity<br />
Total<br />
As at 1 January 2009 15,387,151 20,123,529 187,474,865 7,844,709 230,830,254<br />
Exchange differences on monetary<br />
assets (45,846) (17,705) (133,183) (127,111) (323,845)<br />
A<strong>dd</strong>itions 143,874,647 4,178,281 84,017,582 12,729,475 244,799,985<br />
Acquisition of subsidiaries - - 3,476,199 - 3,476,199<br />
Disposal of subsidiaries (15,803) - (751,996) - (767,799)<br />
Disposals (sale <strong>and</strong> redemption) (141,068,581) (4,273,705) (83,789,308) (2,151,788*) (231,283,382)<br />
Impairment of available-for-sale equity<br />
securities - - (2,927,247) - (2,927,247)<br />
Reversal of impairment - - 183,890 - 183,890<br />
Net fair value gains – excluding net<br />
realised gains 170,279 (238,875) 2,510,421 - 2,441,825<br />
As at 31 December 2009 18,301,847 19,771,525 190,061,223 18,295,285 246,429,880<br />
As at 1 January 2008 42,508,318 20,935,380 317,214,328 7,590,164 388,248,190<br />
Exchange differences on monetary<br />
assets 45,197 (41,106) (70,152) (95,184) (161,245)<br />
A<strong>dd</strong>itions 17,011,892 27,039,659 55,237,993 1,709,961 100,999,505<br />
Acquisition of subsidiaries - - - - -<br />
Disposal of subsidiaries - (20,504,515) (3,164) - (20,507,679)<br />
Disposals (sale <strong>and</strong> redemption) (20,523,380) (6,489,301) (100,645,184) (1,360,232*) (129,018,097)<br />
Impairment of available-for-sale equity<br />
securities - - (24,846,256) -<br />
(24,846,256)<br />
Net fair value gains – excluding net<br />
realised gains (23,654,876) (816,588) (59,412,700) - (83,884,164)<br />
As at 31 December 2008 15,387,151 20,123,529 187,474,865 7,844,709 230,830,254<br />
* only redemption<br />
Investments in loans include also investment contracts assets.<br />
Impairment of available-for-sale non-listed equity securities is recognised either on the basis of external independent<br />
valuations, using the discounted future cash flow method, or on the basis of an internal model whose appropriateness has<br />
been assessed by an independent qualified expert.<br />
152
<strong>The</strong> <strong>Group</strong> <strong>KD</strong> <strong>Group</strong> Annual Report 2009<br />
Notes to Consolidated Financial Statements as at <strong>and</strong> for the year ended 31 December 2009<br />
According to valuations performed in 2009, an impairment of EUR 2,927,247(2008: EUR 24,846,256) was recognised. <strong>The</strong><br />
following key assumptions were used in these valuations:<br />
- the method of discounted cash flows was used;<br />
- projections were made for minority shareholders;<br />
- cash flow projections for the period of 5 years were prepared;<br />
- the revenue growth rates range up to 5% per year;<br />
- the growth of employee costs was 3% per year;<br />
- the discount rates range up to 11.6% per year.<br />
<strong>The</strong> effective interest rates on debt securities were as follows:<br />
2009 2008<br />
Debt securities:<br />
– held-to-maturity financial assets 5.07% 5.10%<br />
– available-for-sale financial assets 4.67% - 4.95% 4.36% – 4.96%<br />
12. Receivables<br />
Insurance receivables <strong>and</strong> other receivables<br />
(in EUR) 31. 12. 2009 31. 12. 2008<br />
Trade receivables<br />
Current 15,737,152 23,753,580<br />
Less: provision for impairment of receivables (2,429,575) (2,773,538)<br />
Trade receivables – net 13,307,577 20,980,042<br />
Receivables arising from insurance <strong>and</strong> reinsurance contracts:<br />
Due from contract holders 47,685,958 46,108,340<br />
Less: provision for impairment of receivables from contract holders (20,652,127) (17,092,336)<br />
Due from agents, brokers <strong>and</strong> intermediaries 31,493,129 31,434,550<br />
Less: provision for impairment of receivables from agents, brokers <strong>and</strong><br />
intermediaries (19,078,828) (18,008,367)<br />
Due from reinsurers 4,645,559 5,037,942<br />
Less: provision for impairment of receivables from reinsurers (3,176) (1,630)<br />
Receivables arising from insurance <strong>and</strong> reinsurance contracts – net 44,090,515 47,478,499<br />
Prepayments 483,518 555,200<br />
Receivables from related parties - 834,386<br />
483,518 1,389,586<br />
Total 57,881,610 69,848,127<br />
153
<strong>The</strong> <strong>Group</strong> <strong>KD</strong> <strong>Group</strong> Annual Report 2009<br />
Notes to Consolidated Financial Statements as at <strong>and</strong> for the year ended 31 December 2009<br />
Deferred acquisition costs (DAC) <strong>and</strong> deferred expenses <strong>and</strong> accrued revenue<br />
(in EUR) 31. 12. 2009 31. 12. 2008<br />
Deferred acquisition costs (DAC) 8,103,645 11,566,010<br />
Deferred expenses <strong>and</strong> accrued revenue 3,798,016 2,221,991<br />
Total 11,901,661 13,788,001<br />
Trade receivables of EUR 3,583,141(2008: EUR 19,036,829) are classified as current assets based on the normal operating<br />
cycle, but are expected to be settled more than 12 months after the balance sheet date.<br />
Movement in allowance for losses on trade <strong>and</strong> other receivables:<br />
(in EUR) 2009 2008<br />
Balance as at 1 January 37,825,871 35,383,057<br />
Provision for receivable impairment 8,270,730 8,360,265<br />
Receivables written off during the year as uncollectible (143,249) 318,020<br />
Acquisition of subsidiary 19,646 -<br />
Exit from the <strong>Group</strong> (63,410) (590,542)<br />
Amounts recovered during the year (3,745,882) (5,644,929)<br />
As at 31 December 42,163,706 37,825,871<br />
13. Inventories<br />
(in EUR) 31. 12. 2009 31. 12. 2008<br />
Property intended for sale in the ordinary course of business 11,845,796 12,653,557<br />
Other 1,597,263 1,279,251<br />
Total 13,443,059 13,932,808<br />
Property intended for sale consists of the commercial-residential building Šumi. Other inventories consist of material <strong>and</strong> raw<br />
material (books <strong>and</strong> publications). Inventories are not pledged as collateral for liabilities.<br />
14. Cash <strong>and</strong> cash equivalents<br />
(in EUR) 31. 12. 2009 31. 12. 2008<br />
Cash at bank <strong>and</strong> in h<strong>and</strong> 13,378,915 9,500,699<br />
Call deposits 27,351,157 21,804,493<br />
Total 40,730,072 31,305,192<br />
<strong>The</strong> effective interest rate on call deposits with banks is 1.6% (2008: between 3.00% <strong>and</strong> 4.10%).<br />
<strong>The</strong> <strong>Group</strong> has open end credit lines in the amount EUR 200,000 <strong>and</strong> overdrafts on accounts at banks in the amount EUR<br />
125,000.<br />
154
<strong>The</strong> <strong>Group</strong> <strong>KD</strong> <strong>Group</strong> Annual Report 2009<br />
Notes to Consolidated Financial Statements as at <strong>and</strong> for the year ended 31 December 2009<br />
15. Equity<br />
Share capital<br />
No. of shares Ordinary Preference Share Treasury<br />
(in EUR) Ordinary Preference shares shares premium shares Total<br />
Balance as at 1 January 2008 2,613,439 215,107 89,321,983 8,893,774 104,395,312 (3,852,955) 198,758,114<br />
Purchase of treasury shares - - - - - - -<br />
Disposal of treasury shares - - - - - - -<br />
Balance as at 31 December 2008 2,613,439 215,107 89,321,983 8,893,774 104,395,312 (3,852,955) 198,758,114<br />
Balance as at 1 January 2009 2,613,439 215,107 89,321,983 8,893,774 104,395,312 (3,852,955) 198,758,114<br />
Purchase of treasury shares - - - - - - -<br />
Disposal of treasury shares - - - - - - -<br />
Balance as at 31 December 2009 2,613,439 215,107 89,321,983 8,893,774 104,395,312 (3,852,955) 198,758,114<br />
<strong>The</strong> total number of shares, including treasury shares, is:<br />
- ordinary shares issued 2,675,640 (2008: 2,675,640),<br />
- preference shares issued 266,413 (2008: 266,413).<br />
Share premium in the amount of EUR 104,395,312 includes:<br />
- Share premium in the amount of EUR 45,177,164,<br />
- Revaluation reserves in the amount of EUR 59,218,148.<br />
<strong>The</strong> ordinary shares have been traded on the organised market of the Ljubljana Stock Exchange since 2001 <strong>and</strong> give the<br />
shareholders the voting rights <strong>and</strong> the entitlement to dividends.<br />
Preference shares carry no voting rights but provide their holder with the following rights:<br />
- Preference right to a dividend payment in the amount of EUR 1.67 before dividend payments to ordinary<br />
shareholders; in cumulative period of 5 years.<br />
- In the event of a dividend payout to ordinary shareholders, the right to an a<strong>dd</strong>itional dividend payment in the amount<br />
of EUR 1.67, for a maximum preference dividend payment of EUR 3.34;<br />
- In the event of liquidation of the company, the right of preferential treatment compared to ordinary shareholders,<br />
providing a payout of the remaining assets after liquidation in the amount of EUR 33.38.<br />
At the 9 th General Meeting of Shareholders of <strong>KD</strong> <strong>Group</strong> d. d. held on 30 August 2006, the shareholders adopted a resolution<br />
by which each share carrying a nominal value of SIT 8,000 was replaced by one non-par value share. <strong>The</strong> share capital <strong>and</strong><br />
the number of shares issued remained unchanged.<br />
Treasury shares<br />
(in EUR) 2009 2008<br />
Carrying Purchase Carrying Share (%) Carrying Purchase Carrying Share (%)<br />
value value value in capital value value value in capital<br />
1 Jan 31 Dec 1 Jan 31 Dec<br />
<strong>KD</strong>HR* 2,424,829 - 2,424,829 2.11 2,424,829 - 2,424,829 2.11<br />
<strong>KD</strong>HP** 1,428,126 - 1,428,126 1.74 1,428,126 - 1,428,126 1.74<br />
Total: 3,852,955 - 3,852,955 3.85 3,852,955 - 3,852,955 3.85<br />
* ordinary shares<br />
**preference shares<br />
155
<strong>The</strong> <strong>Group</strong> <strong>KD</strong> <strong>Group</strong> Annual Report 2009<br />
Notes to Consolidated Financial Statements as at <strong>and</strong> for the year ended 31 December 2009<br />
2009 2008<br />
Number Number Number Number<br />
1 Jan Purchase 31 Dec 1 Jan Disposal 31 Dec<br />
Number of shares<br />
<strong>KD</strong>HR 62,201 - 62,201 62,201 - 62,201<br />
<strong>KD</strong>HP 51,306 - 51,306 51,306 - 51,306<br />
Total 113,507 - 113,507 113,507 - 113,507<br />
Accumulated profit of <strong>KD</strong> <strong>Group</strong> d. d.<br />
In accordance with the decision of the Management Board as at 31 December 2009, the net loss incurred in 2009 of EUR<br />
52,827,433.37 is covered as follows:<br />
- EUR 8,152,469.82 from the remaining retained earnings after creating reserves for treasury shares<br />
- EUR 44,674,963.55 from capital surplus.<br />
16. Other reserves <strong>and</strong> retained earnings<br />
(in EUR) 31. 12. 2009 31. 12. 2008<br />
Consolidation adjustment (4,390,329) (4,320,061)<br />
Revaluation reserve– AFS financial assets 5,470,089 (430,319)<br />
Revaluation of derivative financial instruments (294,121) (350,697)<br />
Retained earnings (6,543,389) (4,549,122)<br />
Total (5,757,750) (9,650,199)<br />
(in EUR)<br />
Revaluation<br />
reserve – AFS<br />
Cash flow<br />
hedge reserve<br />
Foreign<br />
currency<br />
translation<br />
reserve<br />
Retained<br />
earnings<br />
Total<br />
Balance as at 1 January 2008 55,574,797 (33,272) (1,463,252) 76,416,444 130,494,717<br />
Revaluation – gross (59,412,700) - - - (59,412,700)<br />
Revaluation – tax 9,484,742 - - - 9,484,742<br />
Net gains transferred to net profit – gross (33,393,801) - - - (33,393,801)<br />
Net gains transferred to net profit – tax (Note<br />
21) 3,619,691 - - - 3,619,691<br />
Impairment – gross 24,846,254 - - - 24,846,254<br />
Impairment – tax (1,453,605) - - - (1,453,605)<br />
Share increase of associates - - - 14,329,037 14,329,037<br />
Currency translation differences: - - - - -<br />
- <strong>Group</strong> - - (2,856,809) - (2,856,809)<br />
- Associates - - - - -<br />
Revaluation – derivative instrument - (317,425) - - (317,425)<br />
Other increases (Note 4) - - - 1,667,880 1,667,880<br />
Profit for the year - - - (77,217,976) (77,217,976)<br />
Dividends - - - (19,744,507) (19,744,507)<br />
Minority interest 304,303 - - - 304,303<br />
Balance as at 31 December 2008 (430,319) (350,697) (4,320,061) (4,549,122) (9,650,199)<br />
156
<strong>The</strong> <strong>Group</strong> <strong>KD</strong> <strong>Group</strong> Annual Report 2009<br />
Notes to Consolidated Financial Statements as at <strong>and</strong> for the year ended 31 December 2009<br />
(in EUR)<br />
Revaluation<br />
reserve – AFS<br />
Cash flow<br />
hedge reserve<br />
Foreign<br />
currency<br />
translation<br />
reserve<br />
Retained<br />
earnings<br />
Total<br />
Balance as at 1 January 2009 (430,319) (350,697) (4,320,061) (4,549,122) (9,650,199)<br />
Revaluation – gross 3,381,477 - - - 3,381,477<br />
Revaluation – tax (898,121) - - - (898,121)<br />
Net gains transferred to net profit – gross 556,530 - - - 556,530<br />
Net gains transferred to net profit – tax (Note<br />
21) 81,418 - - - 81,418<br />
Impairment – gross 4,194,794 - - - 4,194,794<br />
Impairment – tax (838,959) - - - (838,959)<br />
Revaluation - associates - - - - -<br />
Revaluation – derivative instrument - gross - 70,716 - - 70,716<br />
Revaluation – derivative instrument - tax - (14,140) - - (14,140)<br />
Currency translation differences: - - - - -<br />
- <strong>Group</strong> - - (74,229) - (74,229)<br />
- Associates - - - - -<br />
Other increases - - - (166,251) (166,251)<br />
Other decreases (Note 4) - - - (1,698,091) (1,698,091)<br />
Profit for the year - - - (43,887,570) (43,887,570)<br />
Dividends - - - (166,630) (166,630)<br />
Decrease of capital reserve - - - 43,924,275 43,924,275<br />
Minority interest (576,731) - 3,961 - (572,770)<br />
Balance as at 31 December 2009 5,470,089 (294,121) (4,390,329) (6,543,389) (5,757,750)<br />
17. Borrowings<br />
(in EUR) 31. 12. 2009 31. 12. 2008<br />
Non-current<br />
Bank borrowings<br />
In Slovenia 11,889,561 41,506,759<br />
Current portion (6,875,318) (6,570,735)<br />
Other borrowings 2,272,404 333,489<br />
Current portion (2,139,339) (122,315)<br />
Bonds issued 75,521,481 75,449,991<br />
Current portion (1,422,394) (1,435,142)<br />
Time deposits<br />
Current portion 15,530,894 -<br />
94,777,289 109,162,047<br />
Current<br />
Bank borrowings<br />
In Slovenia 65,000,952 63,916,996<br />
Other borrowings 24,490,237 350,668<br />
Current portion of non-current borrowings 10,437,051 8,128,192<br />
99,928,240 72,395,856<br />
Total 194,705,529 181,557,903<br />
157
<strong>The</strong> <strong>Group</strong> <strong>KD</strong> <strong>Group</strong> Annual Report 2009<br />
Notes to Consolidated Financial Statements as at <strong>and</strong> for the year ended 31 December 2009<br />
Total borrowings include borrowings which are collateralised with pledged assets <strong>and</strong> guarantees in the amount of EUR<br />
93,138,121 (2008 EUR 86,673,238). Bank borrowings are collateralised by the pledged property of the <strong>Group</strong> (Note 7).<br />
<strong>The</strong> effective interest rates on borrowings were as follows:<br />
2009 2008<br />
Non-current borrowings 2.33% – 3.77% 5.23% – 5.99%<br />
Current borrowings 2.02% – 7.00% 4.45% –7.63%<br />
18. Insurance contracts liabilities<br />
Insurance liabilities <strong>and</strong> reinsurance assets<br />
(in EUR) 31.12.2009 31.12.2008<br />
Insurance contracts<br />
Property insurance contracts <strong>and</strong> health insurance contracts – gross:<br />
- claims reported <strong>and</strong> loss adjustment expenses 66,135,589 68,641,921<br />
- claims incurred but not reported 75,255,446 61,752,371<br />
- unearned premiums 66,068,628 67,247,245<br />
- provisions for bonuses, rebates <strong>and</strong> lapses 333,937 194,834<br />
- mathematical provisions (for health insurance) 145,177 169,446<br />
- other technical provisions (unexpired risk provisions included) 3,424,248 4,718,116<br />
211,363,025 202,723,933<br />
Life insurance contracts – gross<br />
- claims reported <strong>and</strong> loss adjustment expenses 2,705,468 2,317,863<br />
- claims incurred but not reported 3,482,512 2,829,771<br />
- unearned premiums 875,448 2,722,850<br />
- provisions for bonuses, rebates <strong>and</strong> lapses 126,971 11,100<br />
- mathematical provisions (for life insurance) 1,412,912 132,816<br />
- other technical provisions (unexpired risk provisions included) 1,459 6,888<br />
8,604,770 8,021,288<br />
Long-term insurance contracts<br />
- with DPF 76,130,189 66,935,728<br />
- without fixed terms – unit-linked 140,108,844 79,308,743<br />
216,239,033 146,244,471<br />
Total insurance liabilities, gross 436,206,828 356,989,692<br />
Receivables from reinsurers<br />
Property insurance contracts:<br />
- claims reported <strong>and</strong> loss adjustment expenses 17,251,633 15,320,171<br />
- claims incurred but not reported 1,131,099 803,147<br />
- unearned premiums 847,474 1,064,654<br />
- provisions for bonuses, rebates 813 749<br />
19,231,019 17,188,721<br />
Life insurance contracts<br />
- claims reported <strong>and</strong> loss adjustment expenses 162,746 119,552<br />
- claims incurred but not reported 1,072 256<br />
- unearned premiums 52,961 53,633<br />
216,779 173,441<br />
158
<strong>The</strong> <strong>Group</strong> <strong>KD</strong> <strong>Group</strong> Annual Report 2009<br />
Notes to Consolidated Financial Statements as at <strong>and</strong> for the year ended 31 December 2009<br />
(in EUR) 31.12.2009 31.12.2008<br />
Long-term insurance contracts<br />
- with DPF 1,210 541<br />
1,210 541<br />
Total reinsurers receivables 19,449,008 17,362,703<br />
Property insurance contracts <strong>and</strong> health insurance contracts – net:<br />
- claims reported <strong>and</strong> loss adjustment expenses 48,883,956 53,321,750<br />
- claims incurred but not reported 74,124,347 60,949,224<br />
- unearned premiums 65,221,154 66,182,591<br />
- provisions for bonuses, rebates 333,124 194,085<br />
- mathematical provision (for health insurance) 145,177 169,446<br />
- other technical provisions (unexpired risk provisions included) 3,424,248 4,718,116<br />
192,132,006 185,535,212<br />
Life insurance contracts–net<br />
- claims reported <strong>and</strong> loss adjustment expenses 2,542,722 2,198,311<br />
- claims incurred but not reported 3,481,440 2,829,515<br />
- unearned premiums 822,487 2,669,217<br />
- provisions for bonuses, rebates 126,971 11,100<br />
- mathematical provision (for life insurance) 1,412,912 132,816<br />
- other technical provisions (unexpired risk provisions included) 1,459 6,888<br />
8,387,991 7,847,847<br />
Long-term insurance contracts<br />
- with DPF 76,128,979 66,935,187<br />
- without fixed terms – unit-linked 140,108,844 79,308,743<br />
216,237,823 146,243,930<br />
Total 416,757,820 339,626,989<br />
Movements in insurance liabilities <strong>and</strong> reinsurance assets<br />
a) Claims <strong>and</strong> loss adjustment expenses<br />
(in EUR) 2009 2008<br />
Gross Reinsurance Net Gross Reinsurance Net<br />
Reported claims 70,959,781 (15,439,722) 55,520,059 61,129,663 (8,975,642) 52,154,021<br />
Incurred but not reported 64,582,146 (803,404) 63,778,742 58,645,436 (912,813) 57,732,623<br />
Total at the beginning of the year 135,541,927 (16,243,126) 119,298,801 119,775,099 (9,888,455) 109,886,644<br />
Cash paid for claims settled in the year (53,423,474) 7,995,283 (45,428,191) (44,238,193) 2,563,134 (41,675,059)<br />
Increase in liabilities<br />
- arising from current year claims 65,846,870 (7,514,522) 58,332,348 62,381,142 (8,336,224) 54,044,918<br />
- arising from prior year claims (379,792) (2,408,184) (2,787,976) (2,376,121) (581,582) (2,957,703)<br />
Total at the end of the year 147,585,531 (18,170,549) 129,414,982 135,541,927 (16,243,127) 119,298,800<br />
Reported claims 68,841,054 (17,414,379) 51,426,675 70,959,784 (15,439,723) 55,520,061<br />
Incurred but not reported 78,737,961 (1,132,171) 77,605,790 64,582,143 (803,404) 63,778,739<br />
Total at the end of the year 147,579,015 (18,546,550) 129,032,465 135,541,927 (16,243,127) 119,298,800<br />
159
<strong>The</strong> <strong>Group</strong> <strong>KD</strong> <strong>Group</strong> Annual Report 2009<br />
Notes to Consolidated Financial Statements as at <strong>and</strong> for the year ended 31 December 2009<br />
b) Unearned premiums<br />
(in EUR) 2009 2008<br />
Gross Reinsurance Net Gross Reinsurance Net<br />
Total at the beginning of the<br />
year 69,970,095 (1,118,287) 68,851,808 69,855,397 (1,115,962) 68,739,435<br />
Increase in liabilities 62,980,118 (894,163) 62,085,955 65,217,263 (1,115,190) 64,102,073<br />
Decrease in liabilities (65,751,419) 1,111,783 (64,639,636) (64,765,565) 1,112,439 (63,653,126)<br />
Currency differences – net (254,718) 232 (254,486) (337,000) 426 (336,574)<br />
Total at the end of the year 66,944,076 (900,435) 66,043,641 69,970,095 (1,118,287) 68,851,808<br />
c) Unit-linked contracts<br />
(in EUR) 2009 2008<br />
Gross Reinsurance Net Gross Reinsurance Net<br />
Total at the beginning of the year 79,308,743 - 79,308,743 112,978,279 - 112,978,279<br />
Increase in liabilities 65,140,958 - 65,140,958 1,565,897 - 1,565,897<br />
Decrease in liabilities (4,321,164) - (4,321,164) (35,191,467) - (35,191,467)<br />
Currency differences – net (19,693) - (19,693) (43,966) - (43,966)<br />
Total at the end of the year 140,108,844 - 140,108,844 79,308,743 - 79,308,743<br />
d) Long-term insurance contracts with DPF<br />
(in EUR) 2009 2008<br />
Gross Reinsurance Net Gross Reinsurance Net<br />
Total at the beginning of the year 66,935,728 (541) 66,935,187 62,548,026 - 62,548,026<br />
Increase linked to premium<br />
payments 10,283,906 (696) 10,283,210 7,410,525 (591) 7,409,934<br />
Decrease linked to payouts (1,722,974) - (1,722,974) (3,033,256) - (3,033,256)<br />
Increase by the DPF portion for the<br />
current period 635,343 - 635,343 13,943 - 13,943<br />
Currency differences – net (1,814) 27 (1,787) (3,510) 50 (3,460)<br />
Total at the end of the year 76,130,189 (1,210) 76,128,979 66,935,728 (541) 66,935,187<br />
e) Other insurance contracts<br />
(in EUR) 2009 2008<br />
Gross Reinsurance Net Gross Reinsurance Net<br />
Total at the beginning of the<br />
year<br />
5,233,200 (749) 5,232,451 3,765,012 (407) 3,764,605<br />
Increase in liabilities 4,495,901 (813) 4,495,088 4,027,659 (749) 4,026,910<br />
Decrease in liabilities (4,145,148) 749 (4,144,399) (2,528,470) 407 (2,528,063)<br />
Currency differences – net (139,249) - (139,249) (31,001) - (31,001)<br />
Total at the end of the year 5,444,704 (813) 5,443,891 5,233,200 (749) 5,232,451<br />
160
<strong>The</strong> <strong>Group</strong> <strong>KD</strong> <strong>Group</strong> Annual Report 2009<br />
Notes to Consolidated Financial Statements as at <strong>and</strong> for the year ended 31 December 2009<br />
19. Derivative financial instruments<br />
<strong>The</strong> <strong>Group</strong> has an interest swap in the amount of EUR 11,000,000 to reduce the exposure of cash flows for interest on loans<br />
(cash flow hedge) in 2007. <strong>The</strong> fair value of the interest swap on 31 December 2009 was negative in the amount of EUR<br />
279,981. <strong>The</strong> effect of hedge instruments valuation is recognised in comprehensive income.<br />
At the end of 2009 the Company entered into a futures transaction for the purchase <strong>and</strong> sale of securities. <strong>The</strong> fair value of<br />
the receivables <strong>and</strong> liabilities is equal to EUR 1,146,675; the net effect in the income statement equals zero.<br />
20. Trade <strong>and</strong> other payables<br />
(in EUR) 31. 12. 2009 31. 12. 2008<br />
Trade payables 13,597,467 10,570,410<br />
Other provisions <strong>and</strong> long-term accruals 2,607,327 2,862,590<br />
Income tax liabilities 1,528,147 350,717<br />
Deferred income tax liabilities 1,418,370 -<br />
Amounts due to related parties 126,429 97,617<br />
Payables – state (without income tax) 1,436,755 1,289,075<br />
Salaries 3,436,014 4,209,570<br />
Accrued expenses <strong>and</strong> deferred income 8,387,081 7,562,401<br />
Dividends payables 686,098 1,435,220<br />
Other insurance payables 12,913,770 17,460,867<br />
Total 46,137,458 45,838,467<br />
21. Deferred tax<br />
Deferred taxes are the result of accounting for current <strong>and</strong> future tax consequences, namely, the future recovery (settlement) of<br />
the book value of assets (liabilities) recognised in the balance sheet, as well as transactions <strong>and</strong> other events during the<br />
period, which are offset within the same tax jurisdiction <strong>and</strong> recognised in the financial statements of the <strong>Group</strong>.<br />
<strong>The</strong> offset amounts are as follows:<br />
(in EUR) 31.12.2009 31. 12. 2008<br />
Deferred tax assets<br />
– Deferred tax assets to be recovered after more than 12 months 29,682,588 20,315,147<br />
29,682,588 20,315,147<br />
Deferred tax liabilities<br />
– Deferred tax liabilities to be recovered after more than 12 months (1,418,370) (107,210)<br />
(1,418,370) (107,210)<br />
28,264,218 20,207,937<br />
(in EUR) 2009 2008<br />
<strong>The</strong> gross movement in the deferred tax account is as follows<br />
Beginning of the year 20,207,757 (2,527,886)<br />
Exchange differences (30,078) (60,644)<br />
Acquisition of subsidiaries (33,920) -<br />
Disposal of subsidiaries (8,004) (74,532)<br />
Income statement charge (Note 28) 9,795,691 11,219,991<br />
Tax charged/(credited) to equity (Note 17) (1,669,802) 11,650,828<br />
At the end of the year 28,264,218 20,207,757<br />
161
<strong>The</strong> <strong>Group</strong> <strong>KD</strong> <strong>Group</strong> Annual Report 2009<br />
Notes to Consolidated Financial Statements as at <strong>and</strong> for the year ended 31 December 2009<br />
<strong>The</strong> movement in deferred tax assets <strong>and</strong> liabilities during the year, without taking into consideration the offsetting of balances<br />
within the same tax jurisdiction, was as follows:<br />
Deferred tax liabilities<br />
(in EUR)<br />
Fair value<br />
gains Other Total<br />
As at 1 January 2008 11,400,456 65,800 11,466,256<br />
Charged/(credited) to the income statement 347,199 (55,991) 291,208<br />
Charged to equity (8,031,137) - (8,031,137)<br />
Charged to equity – transfer to net profit (Note 16) (3,619,691) - (3,619,691)<br />
Acquisition of subsidiaries - - -<br />
Exchange differences 421 153 574<br />
As at 31 December 2008 97,248 9,962 107,210<br />
Charged /(credited) to the income statement (391,248) - (391,248)<br />
Charged to equity – fair value reassessment 1,749,976 1,244 1,751,220<br />
Charged to equity – transfer to net profit (Note 16) (75,305) (6,113) (81,418)<br />
Acquisition of subsidiaries 32,633 - 32,633<br />
Disposal of subsidiaries (27) - (27)<br />
Exchange differences - - -<br />
As at 31 December 2009 1,413,277 5,093 1,418,370<br />
Deferred tax assets<br />
(in EUR)<br />
Employee<br />
benefits<br />
Impairment<br />
losses Tax losses Other Total<br />
As at 1 January 2008 614,959 4,251,798 4,062,197 9,416 8,938,370<br />
Charged/(credited) to the income<br />
statement (195,723) 8,130,829 3,515,832 60,261 11,511,199<br />
Disposal of subsidiaries (7,726) (66,806) - - (74,532)<br />
Exchange differences 1,164 15,868 (77,102) (60,070)<br />
As at 31 December 2008 412,674 12,331,689 7,500,927 69,677 20,314,967<br />
Charged/(credited) to the income<br />
statement (153,072) (1,150,136) 10,735,085 (27,434) 9,404,443<br />
Acquisition of subsidiaries 1,287 - - - 1,287<br />
Disposal of subsidiaries - (8,031) - - (8,031)<br />
Exchange differences - - (30,078) - (30,078)<br />
As at 31 December 2009 260,889 11,173,522 18,205,934 42,243 29,682,588<br />
<strong>The</strong> deferred tax charged to components of other comprehensive income during the year:<br />
(in EUR) 31. 12. 2009 31. 12. 2008<br />
Fair value reserves in shareholders’ equity<br />
– Available-for-sale financial assets (1,655,662) 12,046,306<br />
– Derivative financial instruments (14,140) -<br />
(1,669,802) 12,046,306<br />
162
<strong>The</strong> <strong>Group</strong> <strong>KD</strong> <strong>Group</strong> Annual Report 2009<br />
Notes to Consolidated Financial Statements as at <strong>and</strong> for the year ended 31 December 2009<br />
Deferred tax assets are recognised for tax loss carry-forwards to the extent that realisation of the related tax benefit through<br />
the future taxable profits is probable. All tax losses can be utilised over an unlimited period of time.<br />
<strong>The</strong> <strong>Group</strong> did not recognise deferred tax assets of EUR 1,729,912 (2008 EUR 278,368) in respect of losses amounting to<br />
EUR 8,649,560 (2008 EUR 1,325,563) that can be carried forward against future taxable income. <strong>The</strong>se losses were<br />
generated by subsidiaries of the <strong>Group</strong> with a history of loss-making.<br />
Unrecognised potential deferred tax assets:<br />
(in EUR) 31. 12. 2009 31. 12. 2008<br />
Deductible temporary differences - -<br />
Unrecognised tax loss carry-forwards 8,649,560 1,325,563<br />
Unrecognised tax credits - 23,584<br />
Total 8,649,560 1,349,147<br />
22. Revenue<br />
22.1. Net earned premiums on insurance contracts<br />
(in EUR) 2009 2008<br />
Long-term insurance contracts with DPF 7,077,204 7,634,679<br />
Long-term insurance contracts without fixed terms – unit-linked 68,029,056 82,719,783<br />
Financial contracts with DPF<br />
- Premium receivables 1,449,422 1,704,633<br />
- Change in unearned premium provisions 9,007 34,497<br />
76,564,689 92,093,592<br />
Property insurance contracts <strong>and</strong> health insurance contracts<br />
- Premium receivables 263,935,937 240,766,222<br />
- Change in unearned premium provisions 1,616,189 (322,049)<br />
265,552,126 240,444,173<br />
Premium income arising from insurance contracts issued 342,116,815 332,537,765<br />
Short-term reinsurance contracts<br />
- Premium payables (11,898,976) (11,420,813)<br />
- Change in unearned premium provisions (218,412) 7,992<br />
Long-term reinsurance contracts 130,950 157,751<br />
Premium revenue ceded to reinsurers on insurance contracts issued (11,986,438) (11,255,070)<br />
Net premiums 330,130,377 321,282,695<br />
163
<strong>The</strong> <strong>Group</strong> <strong>KD</strong> <strong>Group</strong> Annual Report 2009<br />
Notes to Consolidated Financial Statements as at <strong>and</strong> for the year ended 31 December 2009<br />
22.2. Revenue <strong>and</strong> other operating income (excluding net earned premiums on insurance contracts)<br />
(in EUR) 2009 2008<br />
Sales of goods 3,959,957 4,481,153<br />
Fees <strong>and</strong> commissions income 10,849,086 14,410,812<br />
Sales of services 7,661,080 19,142,091<br />
22,470,123 38,034,056<br />
Other operating income:<br />
Other insurance income 3,934,975 5,660,327<br />
Other operating income 11,761,118 12,516,507<br />
Excess on acquisition of a subsidiary (Note 32) 192,776 31,536<br />
Excess on acquisition of associates (Note 10) - 5,130,921<br />
Excess on disposal of a subsidiary (Note 32) (620,680) 8,963,368<br />
Gain from increase in the share capital of a subsidiary - -<br />
15,268,189 32,302,659<br />
Total 37,738,312 70,336,715<br />
<strong>The</strong> <strong>Group</strong> disposed of entities from the financial, life insurance <strong>and</strong> health insurance segments <strong>and</strong> recorded a loss of EUR<br />
620,680.<br />
23. Expenses<br />
23.1. Gross benefits <strong>and</strong> claims paid<br />
2009<br />
(in EUR) Gross Reinsurance Net<br />
Long-term insurance contracts with DPF<br />
- death, maturity <strong>and</strong> surrender benefits 3,340,155 73,087 3,413,242<br />
- increase of liabilities - - -<br />
Long-term insurance contracts without fixed terms (unit-linked)<br />
- death, maturity <strong>and</strong> surrender benefits 612,431 - 612,431<br />
- increase of liabilities 66,141,341 - 66,141,341<br />
Net mathematical provisions – insurance contracts with DPF<br />
- death, maturity <strong>and</strong> surrender benefits 1,317,953 - 1,317,953<br />
- increase of liabilities 3,195,917 - 3,195,917<br />
Property insurance <strong>and</strong> health insurance<br />
- claims <strong>and</strong> loss adjustment expenses 199,842,859 (12,126,184) 187,716,675<br />
- increase of liabilities 9,078,171 - 9,078,171<br />
Total cost of policyholder benefits, claims <strong>and</strong> loss 283,528,827 (12,053,097) 271,475,730<br />
164
<strong>The</strong> <strong>Group</strong> <strong>KD</strong> <strong>Group</strong> Annual Report 2009<br />
Notes to Consolidated Financial Statements as at <strong>and</strong> for the year ended 31 December 2009<br />
2008<br />
(in EUR) Gross Reinsurance Net<br />
Long-term insurance contracts with DPF<br />
- death, maturity <strong>and</strong> surrender benefits 7,104,737 183,737 7,288,474<br />
- increase of liabilities - - -<br />
Long-term insurance contracts without fixed terms (unit-linked)<br />
- death, maturity <strong>and</strong> surrender benefits 3,547,698 - 3,547,698<br />
- increase of liabilities (33,625,570) - (33,625,570)<br />
Net mathematical provisions – insurance contracts with DPF<br />
- death, maturity <strong>and</strong> surrender benefits 760,388 - 760,388<br />
- increase of liabilities (4,390,624) - (4,390,624)<br />
Property insurance <strong>and</strong> health insurance<br />
- claims <strong>and</strong> loss adjustment expenses 175,157,414 (12,356,648) 162,800,766<br />
- increase of liabilities 20,460,490 - 20,460,490<br />
Total cost of policyholder benefits, claims <strong>and</strong> loss 169,014,533 (12,172,911) 156,841,622<br />
23.2. Expenses by nature (excluding insurance contract benefits [net] <strong>and</strong> claims)<br />
(in EUR) 2009 2008<br />
Cost of services 68,689,724 75,690,259<br />
Labour costs<br />
Wages <strong>and</strong> salaries 43,817,255 48,271,640<br />
Cost of Salaries - pension insurance 4,103,843 4,242,131<br />
Cost of Salaries - social insurance 3,182,529 4,218,087<br />
Other costs of employees 6,259,155 6,960,509<br />
Other long-term <strong>and</strong> post-employment benefits 214,040 713,301<br />
57,576,822 64,405,668<br />
Total 126,266,546 140,095,927<br />
Number of employees 1,860 1,984<br />
Iinsurance acquisition costs of EUR 22,179,325 are included in the costs of services (in 2008: EUR 17,897,626).<br />
23.3. Other expenses<br />
(in EUR) 2009 2008<br />
Raw materials <strong>and</strong> consumables used 4,345,613 6,713,694<br />
Depreciation, amortisation <strong>and</strong> impairment 6,073,487 7,923,372<br />
Other insurance expenses 3,457,514 9,551,654<br />
Other expenses 19,780,439 33,085,695<br />
Total 33,657,053 57,274,415<br />
Impairment of goodwill recognised in 2009 in the amount of EUR 5,904,886 is included in other expenses (in 2008: EUR<br />
25,722,755).<br />
165
<strong>The</strong> <strong>Group</strong> <strong>KD</strong> <strong>Group</strong> Annual Report 2009<br />
Notes to Consolidated Financial Statements as at <strong>and</strong> for the year ended 31 December 2009<br />
23.4. Audit fees<br />
(in EUR) 2009 2008<br />
Expenses (VAT included):<br />
- Audit of the financial statements 473,238 546,872<br />
a- Audit services 1,029 11,677<br />
- Tax advisory 9,708 34,734<br />
- Other non-audit services 1,492 -<br />
Total 485,467 593,283<br />
24. Investment income<br />
(in EUR) 2009 2008<br />
Available for sale<br />
dividend income 1,909,599 6,914,290<br />
- interest income, exchange differences 5,761,002 5,244,897<br />
7,670,601 12,159,187<br />
Held to maturity<br />
interest income 766,274 393,763<br />
Financial assets at fair value through profit or loss<br />
dividend income 408,630 956,236<br />
interest income, exchange differences 689,187 1,782,954<br />
1,097,817 2,739,190<br />
Cash <strong>and</strong> cash equivalents, loans, deposits <strong>and</strong> receivables<br />
interest income 7,035,267 7,402,781<br />
Total 16,569,959 22,694,921<br />
25. Net realised gains on financial assets available for sale<br />
(in EUR) 2009 2008<br />
Realised gains on financial assets – available for sale 14,265,857 12,072,649<br />
Realised losses on financial assets – available for sale (9,843,946) (2,075,008)<br />
4,421,911 9,997,641<br />
Impairment of financial assets (2,927,247) (24,846,254)<br />
Reversal od impairment 890 -<br />
Total 1,495,554 (14,848,613)<br />
166
<strong>The</strong> <strong>Group</strong> <strong>KD</strong> <strong>Group</strong> Annual Report 2009<br />
Notes to Consolidated Financial Statements as at <strong>and</strong> for the year ended 31 December 2009<br />
26. Net fair value gains on assets at fair value through profit or loss<br />
(in EUR) 2009 2008<br />
Changes in fair value of financial assets<br />
- held for trading 170,279 (24,317,453)<br />
- initial recognition 22,063,796 (77,403,222)<br />
22,234,075 (101,720,675)<br />
Net fair value gains on financial assets at fair value through profit or loss<br />
- held for trading 2,546,383 233,098<br />
- initial recognition 2,574,316 55,064<br />
5,120,699 288,162<br />
Changes in fair value of derivatives (322,132) 6,319,371<br />
Total 27,032,642 (95,113,142)<br />
27. Operating loss before interests, tax, exchange differences <strong>and</strong> influence of associates<br />
<strong>The</strong> <strong>Group</strong> incurred the operating loss of EUR 18,432,485 in 2009 (in 2008, the <strong>Group</strong> incurred the operating loss of EUR<br />
49,859,388).<br />
28. Finance costs<br />
(in EUR) 2009 2008<br />
Interest expense:<br />
Bank borrowings (3,990,195) (5,743,009)<br />
Bonds (3,956,773) (4,124,643)<br />
Other (314,499) (298,067)<br />
Net foreign exchange differences (1,302,447) 2,142,253<br />
Total (9,563,914) (8,023,466)<br />
29. Income tax expense<br />
(in EUR) 2009 2008<br />
Current tax (2,595,784) (2,934,092)<br />
Deferred tax 9,795,691 11,219,991<br />
Total 7,199,907 8,285,899<br />
167
<strong>The</strong> <strong>Group</strong> <strong>KD</strong> <strong>Group</strong> Annual Report 2009<br />
Notes to Consolidated Financial Statements as at <strong>and</strong> for the year ended 31 December 2009<br />
<strong>The</strong> actual amount of income tax expense of the <strong>Group</strong> differs from the notional amount that would arise using the weighted<br />
average tax rate applicable to profits of the consolidated companies as follows:<br />
(in EUR) 2009 2008<br />
Profit before tax (43,887,570) (77,217,976)<br />
Tax calculated at domestic tax rates applicable to profits in the respective countries 9,745,306 18,793,634<br />
Income not subject to tax 8,411,643 13,929,188<br />
Non-deductible expenses (13,571,533) (19,987,207)<br />
Utilisation of previously unrecognised tax losses 329,128 (237,893)<br />
Tax losses for which no deferred tax assets were recognised 2,285,363 (4,211,823)<br />
Tax charge 7,199,907 8,285,899<br />
Effective tax rate 16.41% 10.73%<br />
<strong>The</strong> applicable corporate income tax rates in Slovenia for 2009 <strong>and</strong> 2010 are 21% <strong>and</strong> 20%, respectively.<br />
<strong>The</strong> tax authorities may at any time inspect the books <strong>and</strong> records within five years subsequent to the reported tax year, <strong>and</strong><br />
may impose a<strong>dd</strong>itional tax assessments <strong>and</strong> penalties. Some of the subsidiaries have been the subject of tax inspection in<br />
recent years, but the parent company has not been inspected by the tax authorities since its establishemtn in 2001. <strong>The</strong><br />
<strong>Group</strong>’s management is not aware of any circumstances which may give rise to a potential material liability in this respect.<br />
30. Earnings per share<br />
Basic earnings per share attributable to holders of ordinary shares of the controlling entity are calculated by dividing the profit<br />
attributable to equity holders of the <strong>Group</strong>, (net profit of the majiortiy owners adjusted for the amount of preference dividends,<br />
by the weighted average number of ordinary shares in issue during the year.<br />
(in EUR) 2009 2008<br />
Basic<br />
Profit attributable to equity holders of the parent (44,246,799) (76,858,747)<br />
Weighted average number of ordinary shares in issue 2,613,439 2,613,439<br />
Basic <strong>and</strong> diluted earnings per share (EUR per share) (16.93) (29.41)<br />
Earnings per share <strong>and</strong> restated earnings per share are equal.<br />
31. Dividends per share<br />
According to the decision of the General Meeting of Shareholders concerning profit distribution, no dividends were paid either<br />
on preference shares or ordinary shareso. For the year 2009 the Board of Directors proposed no dividend payment.<br />
32. Acquisitions <strong>and</strong> disposals of subsidiaries<br />
32.1. Acquisition<br />
In 2009, the <strong>Group</strong> acquired a more than 50% share in the following companies:<br />
- FM-NET d.o.o., Ljubljana – 31 January 2009<br />
- Radio Kranj d.o.o., Kranj – 31 January 2009<br />
- World Life group Ltd., Limassol – 30 June 2009<br />
- Vitavizia d.o.o., Ljubljana – 30 June 2009<br />
- <strong>KD</strong> Financial point EOOD, Sofia – 1. January 2009<br />
168
<strong>The</strong> <strong>Group</strong> <strong>KD</strong> <strong>Group</strong> Annual Report 2009<br />
Notes to Consolidated Financial Statements as at <strong>and</strong> for the year ended 31 December 2009<br />
- OOO Sarbon Invest, Taškent – 30 June 2009<br />
Pursuant to the business combination with FM-NET d.o.o., World Life <strong>Group</strong> ltd., Vitavizia d.o.o., EOOD <strong>KD</strong> Financial point<br />
Bulgaria <strong>and</strong> OOO Sarbon Invest, the <strong>Group</strong> recognised goodwill totalling EUR 4,814,498; in the other business combination<br />
with Radio Kranj d.o.o., the <strong>Group</strong> recognised surplus in the amount of EUR 192,776.<br />
If the above entities were included in the <strong>Group</strong> from 1 January 2009, the <strong>Group</strong>'s revenues would be higher by EUR 188,541<br />
resulting in a total loss of EUR 1,406,321.<br />
Details of net assets acquired <strong>and</strong> excess on the acquisition are as follows:<br />
(in EUR) 2009 2008<br />
Purchase consideration:<br />
– cash paid 4,534,146 37,500<br />
– direct costs relating to the acquisition - -<br />
Total purchase consideration 4,534,146 37,500<br />
Fair value of net assets acquired (87,577) 153,708<br />
Goodwill (Note 9) 4,814,498 127,058<br />
Excess (Note 22.2) (192,776) (31,536)<br />
<strong>The</strong> assets <strong>and</strong> liabilities arising from the acquisition are as follows:<br />
(in EUR)<br />
Fair value<br />
Carrying value<br />
Cash <strong>and</strong> cash equivalents 301.024 301.024<br />
Property, plant <strong>and</strong> equipment 397.751 397.751<br />
Investments in subsidiaries 535.376 535.376<br />
Investments in associates 42.826 42.826<br />
Financial assets 3.476.199 3.476.199<br />
Loans <strong>and</strong> receivables 546.518 546.518<br />
Other assets 3.201 2.994<br />
Financial liabilities (4.826.716) (4.826.716)<br />
Payables (1.559.556) (1.559.556)<br />
Net assets (1.083.377) (1.083.584)<br />
Non-controlling interests 339.520 339.520<br />
Net assets acquired: (1.083.377) (1.083.377)<br />
- in the previous years 278.819 278.819<br />
- in the current year (231.067) (231.067)<br />
Cash <strong>and</strong> cash equivalents in subsidiary acquired<br />
- in previous years - -<br />
- in the current year 4.534.146 4.534.146<br />
Cash <strong>and</strong> cash equivalents in subsidiary acquired (301.024) (301.024)<br />
Cash outflow on acquisition 4.233.122 4.233.122<br />
169
<strong>The</strong> <strong>Group</strong> <strong>KD</strong> <strong>Group</strong> Annual Report 2009<br />
Notes to Consolidated Financial Statements as at <strong>and</strong> for the year ended 31 December 2009<br />
32.2. Disposal<br />
In 2009, the <strong>Group</strong> concluded contracts with Assistance Coris d.o.o., <strong>KD</strong> Vifin s.r.o., <strong>KD</strong> Mont a.d., <strong>KD</strong> Life s.r.o. Czech, <strong>and</strong><br />
<strong>KD</strong> Investments a.s. Slovakia for disposal of share capital, realising loss on disposal of EUR 620,680.<br />
<strong>The</strong> <strong>Group</strong> disposed of the share capital of the following companies in 2009:<br />
Assistance Coris d.o.o., Ljubljana<br />
<strong>KD</strong> Vifin s.r.o. Bratisava<br />
<strong>KD</strong> Mont a.d., Podgorica<br />
<strong>KD</strong> Life s.r.o. Prague<br />
<strong>KD</strong> Investments a.s. Bratislava<br />
Assets <strong>and</strong> liabilities at disposal:<br />
(in EUR)<br />
Carrying value<br />
Cash <strong>and</strong> cash equivalents 507,952<br />
Property, plant <strong>and</strong> equipment 222,689<br />
Financial assets 767,799<br />
Loans <strong>and</strong> receivables 3,774,333<br />
Other assets 147,962<br />
Financial liabilities -<br />
Payables (1,483,175)<br />
Net assets 3,937,560<br />
Goodwill -<br />
Non-controlling interests 1,222,855<br />
Cash <strong>and</strong> cash equivalents for disposal of net assets 2,094,025<br />
Cash <strong>and</strong> cash equivalents in disposed companies (507,952)<br />
Cash from company disposal 1,586,073<br />
33. Related-party transactions<br />
<strong>The</strong> <strong>Group</strong> is controlled by <strong>KD</strong> d. d., Ljubljana (incorporated in Slovenia), which owns 63.20% of the <strong>Group</strong>’s shares. <strong>The</strong><br />
remaining 36.80% of the shares are widely held.<br />
<strong>The</strong> following transactions were carried out with related parties:<br />
(in EUR) 2009 2008<br />
Sales of goods <strong>and</strong> services<br />
– Associates 937,532 1,697,212<br />
– <strong>KD</strong> d. d. 45,847 18,018<br />
– Other <strong>KD</strong> d. d. related parties - -<br />
Total: 983,379 1,715,230<br />
Goods <strong>and</strong> services are sold on the basis of the price lists in force for both related <strong>and</strong> unrelated parties.<br />
170
<strong>The</strong> <strong>Group</strong> <strong>KD</strong> <strong>Group</strong> Annual Report 2009<br />
Notes to Consolidated Financial Statements as at <strong>and</strong> for the year ended 31 December 2009<br />
(in EUR) 2009 2008<br />
Purchases of goods <strong>and</strong> services<br />
– Associates 750,030 784,814<br />
– <strong>KD</strong> d. d. 5,600 18,666<br />
– Other <strong>KD</strong> d. d. related parties 104,317 -<br />
Total: 859,947 803,480<br />
(in EUR) 2009 2008<br />
Year-end balances arising from sales/purchases of goods/services<br />
Receivables from related parties:<br />
– Associates 18,729 832,353<br />
– <strong>KD</strong> d. d. 7,565 2,033<br />
– Other <strong>KD</strong> d. d. related parties - -<br />
Total 26,294 834,384<br />
Payables to related parties:<br />
– Associates 70,790 76,549<br />
– <strong>KD</strong> d. d. 3,517 18,902<br />
– Other <strong>KD</strong> d. d. related parties 52,122 2,166<br />
Total 126,429 97,617<br />
(in EUR) 2009 2008<br />
Key management personnel remuneration<br />
Members of Board of Directors – salaries (gross), bonuses 3,125,144 3,126,288<br />
Supervisory Board – remuneration 200,813 442,632<br />
Salaries for employees with individual employment contracts 8,170,875 10,815,498<br />
Total 11,496,832 14,384,418<br />
<strong>The</strong> <strong>Group</strong> had received guarantees from members of Board of Directors, the Supervisory Board <strong>and</strong> employees with<br />
individual contracts in the amount of EUR 5,333,333 as at 31 December 2009 (in 2008: EUR 16,934,049).<br />
(in EUR) 2009 2008<br />
Loans to members of Board of Directors, the Supervisory Board <strong>and</strong> employees<br />
Loans to the members of Board of Directors - 12,241<br />
Loans to the Supervisory Board - 2,064,713<br />
Loans to employees 70,476 70,474<br />
Total 70,476 2,147,428<br />
(in EUR) 2009 2008<br />
Loans <strong>and</strong> deposits to associates<br />
Beginning of the year 2,143,779 1,141,589<br />
Loans advanced during the year 146,649 5,270,000<br />
Loan repayments received (1,900,104) (4,268,000)<br />
Interest charged 24,828 31,785<br />
Interest received (24,832) (31,595)<br />
Total 390,320 2,143,779<br />
171
<strong>The</strong> <strong>Group</strong> <strong>KD</strong> <strong>Group</strong> Annual Report 2009<br />
Notes to Consolidated Financial Statements as at <strong>and</strong> for the year ended 31 December 2009<br />
(in EUR) 2009 2008<br />
Loans to <strong>KD</strong> d. d.<br />
Beginning of the year 14,038,840 10,728,111<br />
Loans advanced during the year 6,978,057 14,712,870<br />
Loan repayments received (6,610,994) (11,533,545)<br />
Interest charged 595,178 491,650<br />
Interest received (380,612) (360,246)<br />
End of the year 14,620,469 14,038,840<br />
(in EUR) 2009 2008<br />
Borrowings <strong>and</strong> deposits from associates - -<br />
Beginning of the year - -<br />
Borrowings received during the year - -<br />
Borrowings repayments - -<br />
Interest charged - -<br />
Interest paid - -<br />
Total - -<br />
For loans approved to associates in 2009 <strong>and</strong> 2008, the <strong>Group</strong> charged no costs associated with the approval process.<br />
(in EUR) 2009 2008<br />
Other related-party transactions<br />
Beginning of the year 34.968.796 10.760.414<br />
Loans advanced during the year 2.848.735 32.699.823<br />
Loan repayments received (13.739.073) (9.514.924)<br />
Impairment (4.468.763) -<br />
Interest accrued 1.416.372 1.023.482<br />
Total 21.026.067 34.968.796<br />
Loans are collateralised by the securities received as collateral <strong>and</strong> establishing usufruct of securities in the amount of EUR<br />
14,125,337 (EUR 2008:12.576.276).<br />
Interest rate for loans range from 3M EURIBOR+ 1.75% to 9%.<br />
34. Events after the balance sheet date<br />
<strong>The</strong> Supervisory Board of <strong>KD</strong> Life Življenje d.d. at its meeting on 1 March 2010, adopted the proposal to convene the General<br />
Meeting of Shareholders <strong>and</strong> replace a member of the Supervisory Board. Mr. Sergej Racman, member <strong>and</strong> Deputy<br />
Chairman of the Supervisory Board, will be replaced by Draško Veselinovič, PhD. At the same meeting the Supervisory<br />
Board also gave its consent to the company´s business plan for the financial year 2010.<br />
Following the review of operations of <strong>KD</strong> Življenje d. d. which by the Insurance Supervision Agency (the Agency) in 2007, an<br />
Order for the elimination of violation No. 40105-381/08-27 dated 14 April 2008 was issued to <strong>KD</strong> Življenje stating that the<br />
company did not set aside insurance technical provisions for minimum guaranteed payments on life insurance with DPF of<br />
Asia Garant <strong>and</strong> Asia Garant plus, which should have been done in accordance with the Insurance Act. Since <strong>KD</strong> Življenje<br />
submitted an incomplete report on<br />
the elimination of violations, the Agency issued another Order No. 40105-789/08-27 of 19 June 2008 for updated report.<br />
172
<strong>The</strong> <strong>Group</strong> <strong>KD</strong> <strong>Group</strong> Annual Report 2009<br />
Notes to Consolidated Financial Statements as at <strong>and</strong> for the year ended 31 December 2009<br />
Following the annulment of the above Order for updated report, the Agency issued a new Order for updated report No..<br />
40105-2559/08-27 of 17 December 2008, which is, based on the legal action brought by the insurance company on 5 January<br />
2010, again under judicial review. <strong>The</strong> lawsuit is currently in progress. Since instituting proceedings against the Order for<br />
updated report <strong>and</strong> the Decision of the Agency No. 40109-221/09-27 of 11 February 2009, by which the Agency decided on<br />
objection to the Order for the updated report does not stay the execution thereof, the insurance company on 26 January 2010<br />
reconciled insurance technical provisions <strong>and</strong> investments in accordance with the Order for updated report <strong>and</strong> the Decision.<br />
As at 31 January 2010 the insurance company formed insurance technical provisions for guaranteed minimum payment of<br />
endowment on the life insurance assets covering mathematical provisions in the amount of EUR 6,127,227. <strong>The</strong> difference to<br />
the full amount of insurance technical provisions arising from the value of units in structured debt securities of Asia Garant<br />
<strong>and</strong> Asia Garant + was recognised within unit-linked assets in the amount of EUR 305,014.<br />
On 20 January 2010 legal action was brought to the court against the Decision of the Ministry of Finance, Directorate for the<br />
System of Tax, Customs <strong>and</strong> Other Public Revenues, Division for Administrative Procedure at II. Degree in Tax <strong>and</strong> Customs<br />
Matters No. DT-499-02-32/2007 of 10 December 2009, rejecting the company's appeal against first instance decision of the<br />
Ministry of Finance, Tax Administration of the Republic of Slovenia, the Special Tax Office, No. DT 0610-11/2007 0203 10 of<br />
19 June 2007. Taxes <strong>and</strong> fees the payment of which was required in the said decision were paid already in 2007.<br />
On 12 January 2010 at the time when the preparation of these financial statements was drawing to its end, the inspectors of<br />
the Tax Administration of the Republic of Slovenia began the examination of the corporate income tax for the year 2008. <strong>The</strong><br />
tax inspection is expected take three months; hence by the time the annual report <strong>and</strong> accounts for 2009 drawn up by the<br />
reporting entity were completed, no decision has been issued by the tax authorities.<br />
On 10 February 2010, the Supervisory Board of Adriatic Slovenica deliberating on the basis of the notice given by Mr. Marko<br />
Rems resigning his position of a member of the Management Board dated 25 November 2009 relieved him of his duty. Until<br />
the appointment of a new member of the Management Board, the insurance company Adriatic Slovenicaa will be run by the<br />
two-memebr Management Board composed of two members.<br />
On 19 March 2010, a report about the measures taken to remedy the infringement specified in the decision issued by the<br />
Insurance Supervision Agency was sent to the Slovenian supervisory authority. By the time of the publication of this Annual<br />
Report for 2009, the insurance company has not received any feedback.<br />
<strong>The</strong> following companies are in the process of winding up:<br />
<strong>KD</strong> Asset Management b.v., the Netherl<strong>and</strong>s<br />
<strong>KD</strong> Investment Belgrade<br />
<strong>KD</strong> Private Equity Belgrade<br />
<strong>KD</strong> Securities EAD Sofia, Bulgaria<br />
R.E.Invest d.o.o., Slovenia<br />
<strong>The</strong> companies SC <strong>KD</strong> Fond de Pensii s.a., Romania <strong>and</strong> <strong>KD</strong> Capital Management, Romania are currently in the process of<br />
being sold.<br />
173