Annual Planning Report 2012 - Transpower
Annual Planning Report 2012 - Transpower
Annual Planning Report 2012 - Transpower

Create successful ePaper yourself
Turn your PDF publications into a flip-book with our unique Google optimized e-Paper software.
ForewordForeword to the <strong>Annual</strong> <strong>Planning</strong> <strong>Report</strong> <strong>2012</strong>I am pleased to introduce this seventh <strong>Transpower</strong> <strong>Annual</strong><strong>Planning</strong> <strong>Report</strong> (APR).<strong>Transpower</strong> is the owner, operator and planner of the NationalGrid. The National Grid comprises the high voltage electricaltransmission system that stretches across both North and SouthIslands, connecting generation sources to local substations servingrural and urban customers. Importantly, it also facilitates thecompetitive wholesale electricity market which underpins thepricing of electricity to all New Zealanders.The APR is one of our initiatives to make our planning processesmore transparent for all interested parties. <strong>Transpower</strong> is adopting an ‘open book’approach to transmission planning. We think this is appropriate for a regulated entity withsuch an important role to play in the economic and social wellbeing of New Zealanders.When we first started publishing the APR in 2006, we were at the start of a significantcapital reinvestment programme – a hurdle we needed to climb to ensure NewZealanders continued to enjoy the benefits of a reliable and secure transmission network.Six years later, our capital investments are peaking – all our major projects are targetingcompletion over the next two years.For the future, we put our stake in the ground with release of Transmission Tomorrow, Itrecognises that new build is only part of the answer, and we can and must do more tooptimise our investment in the existing network. Already, we are trialling variable lineratings on some core transmission lines, and we’re also promoting the use of demandsidemanagement as a means of deferring transmission investment.The APR continues to identify issues on the investment horizon that may ultimatelyrequire a transmission solution. As in previous years, we have worked to improve thequality and layout of the information provided to be more intuitive for the reader.We continue to look for ways of enhancing the value of the APR to all our stakeholders.We will also make greater use of information from customers to form our views ondemand foreacast and generation possibilities to ensure the APR is the primary gridplanning document for the industry.Dr Patrick StrangeChief ExecutiveMarch <strong>2012</strong><strong>2012</strong> <strong>Annual</strong> <strong>Planning</strong> <strong>Report</strong> © <strong>Transpower</strong> New Zealand Limited <strong>2012</strong>. All rights reserved. i
Executive SummaryKey proposed developmentsA number of the major projects signalled in previous years are now well underwayincluding the North Island Grid Upgrade project (targeting <strong>2012</strong>), North Auckland andNorthland Upgrade project (targeting 2013) and the HVDC Pole 3 project (targeting2013).In other areas and in the regional networks particularly, smaller upgrade projectsproviding incremental changes to existing capacity continue to be needed. In theseregions, where there is less certainty over future transmission capacity, investment innewer technologies is helping to get the most out of what we have now. Recent projectsinclude New Zealand’s first deployment of series compensation (now approved for theLower South Island Reliability Project), and deployment of further static synchronouscompensators at Penrose and Marsden.As well as looking at future demand, we also have projects underway to help facilitatethe connection of more generation. The replacement Wairakei to Whakamaru C lineproject to accommodate greater generation in the Wairakei region is expected to breakground shortly. In the South Island, the Clutha to Upper Waitaki Lines project has beenrecently reviewed. Recognising that generation development has not happened to theextent envisaged, we are holding back on those parts of the project that weregeneration-enabling only.Completed projects for 2011Summary Table 1 lists the projects completed since the 2011 <strong>Annual</strong> <strong>Planning</strong> <strong>Report</strong>.Summary Table 1: Projects completed since the 2011 <strong>Annual</strong> <strong>Planning</strong> <strong>Report</strong>Project nameIslington reactive power controllerNorth Island grid upgrade project:convert the existing 110 kV Pakuranga substation to 220 kVconvert the existing 110 kV Otahuhu–Pakuranga line to 220 kVPakuranga 220/33 kV supply transformerBombay 110 kV bus security upgradeRedclyffe 110 kV bus security upgradeWest Coast Grid Upgrade project:Inangahua–Reefton 2 circuit extension to DobsonDobson interconnecting transformerWoodville supply transformer replacement and a second supply transformerWaverley supply transformer replacement110 kV Hawera–Stratford reconductoring110 kV Wanganui–Waverley reconductoringCommitted and proposed projects for <strong>2012</strong>Summary Figure 1 and Summary Figure 2 provide a summary of all projects eithercommitted or proposed in this APR 3 . Detail around any particular project can be foundin the relevant regional or grid backbone chapter.23<strong>Transpower</strong> is unable to comment on supply side issues (e.g. beyond the grid exit point) other thanthrough the impact of the generation scenarios.Refer to Chapter 1, Section 1.4 for definitions of “committed” and “proposed”.iv<strong>2012</strong> <strong>Annual</strong> <strong>Planning</strong> <strong>Report</strong> © <strong>Transpower</strong> New Zealand Limited 2011. All rights reserved.
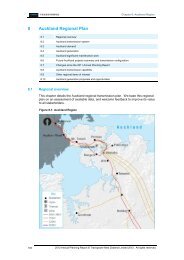
Executive SummarySummary Figure 1: <strong>Transpower</strong>’s committed or proposed projects – North IslandAuckland Regional ProjectsNew 220 kV connection betweenPakuranga and PenroseNew cross harbour 220 kVconnection between Penrose andAlbanyNew grid exit point at Hobson StreetNew STATCOM at PenroseNorthland Regional ProjectsNew STATCOM at MarsdenNew grid exit point at Wairau RoadWaikato Regional ProjectsNew grid exit point at PiakoTaranaki Regional ProjectsReplacement conductor on the110 kV Stratford–Wanganuitransmission lineReplacement conductor on the110 kV Opunake–Stratfordtransmission lineBay of Plenty Regional ProjectsBay of Plenty InterconnectionUpgrade including:converting the Kaitimako toTarukenga circuits to 220 kVinstalling 220 kVinterconnecting transformersat KaitimakoKawerau 220/110 kVtransformer T12 replacementTarukenga interconnectingtransformer replacementWellington Regional ProjectsReplacement supply transformersat MastertonNorth Island Grid Backbone ProjectsNorth Island Grid Upgrade Projectconstruct a new substation at Whakamaru (WhakamaruB) and a transition station at Brownhillnew 220/400 kV double circuit transmission line(partially underground cables) from Whakamaru toPakurangaNew 220 kV Wairakei–Whakamaru C transmission lineNational Auto-Synchronisation Points ProjectBunnythorpe–Haywards 220 kV A and B line conductorreplacement<strong>2012</strong> <strong>Annual</strong> <strong>Planning</strong> <strong>Report</strong> © <strong>Transpower</strong> New Zealand Limited <strong>2012</strong>. All rights reserved. v
Executive SummarySummary Figure 2: <strong>Transpower</strong>’s committed or proposed projects – South IslandNelson-Marlborough projectsReplacement supplytransformers at StokeCanterbury projectsA third 220/66 kV interconnectingtransformer at BromleyOtago-Southland Regional ProjectsLower South Island Reliability Projectincluding:new 220/110 kV interconnectionat Gore and 220 kV lineconnecting Gore to the NorthMakarewa–Three Mile Hill linereplacement transformers atRoxburgh and Invercargillnew capacitors at Balcluthaseries compensation at ThreeMile HillSouth Island Grid Backbone ProjectsClutha–Upper Waitaki Lines ProjectHVDC Grid Backbone ProjectsHVDC Pole 3 ProjectHVDC control system replacementvi<strong>2012</strong> <strong>Annual</strong> <strong>Planning</strong> <strong>Report</strong> © <strong>Transpower</strong> New Zealand Limited <strong>2012</strong>. All rights reserved.
Executive SummaryFeedbackWe will be using this document as a basis for discussions with our customers andother stakeholders by way of regional forums and other meetings. Feedbackreceived will be used to improve subsequent releases of the <strong>Annual</strong> <strong>Planning</strong> <strong>Report</strong>.If you are unable to attend a regional forum in your area, but have feedback on howthis document might be improved, please address to:Grid Development<strong>Transpower</strong> New Zealand LtdPO Box 1021Wellingtongridinvestmentprojects@transpower.co.nz<strong>2012</strong> <strong>Annual</strong> <strong>Planning</strong> <strong>Report</strong> © <strong>Transpower</strong> New Zealand Limited <strong>2012</strong>. All rights reserved. vii
Executive Summary[This page intentionally blank]viii<strong>2012</strong> <strong>Annual</strong> <strong>Planning</strong> <strong>Report</strong> © <strong>Transpower</strong> New Zealand Limited <strong>2012</strong>. All rights reserved.
Table of contents<strong>2012</strong> <strong>Annual</strong> <strong>Planning</strong> <strong>Report</strong> © <strong>Transpower</strong> New Zealand Limited <strong>2012</strong>. All rights reserved. ix
Table of Contents1 INTRODUCTION ..............................................................................................................112 FACILITATING NEW ZEALAND’S ENERGY FUTURE ..................................................163 EXISTING NATIONAL GRID ...........................................................................................234 DEMAND ASSUMPTIONS ..............................................................................................315 GENERATION ASSUMPTIONS ......................................................................................356 GRID BACKBONE ...........................................................................................................407 NORTHLAND REGIONAL PLAN ....................................................................................858 AUCKLAND REGIONAL PLAN ....................................................................................1069 WAIKATO REGIONAL PLAN ........................................................................................12710 BAY OF PLENTY REGIONAL PLAN ............................................................................14911 CENTRAL NORTH ISLAND REGIONAL PLAN ...........................................................17212 TARANAKI REGIONAL PLAN ......................................................................................18813 HAWKE’S BAY REGIONAL PLAN ...............................................................................20314 WELLINGTON REGIONAL PLAN .................................................................................21915 NELSON-MARLBOROUGH REGIONAL PLAN ...........................................................23716 WEST COAST REGIONAL PLAN .................................................................................24917 CANTERBURY REGIONAL PLAN ................................................................................26118 SOUTH CANTERBURY REGIONAL PLAN ..................................................................27619 OTAGO-SOUTHLAND REGIONAL PLAN ....................................................................294APPENDIX A GRID RELIABILITY REPORT .................................................................314APPENDIX B GRID ECONOMIC INVESTMENT REPORT ...........................................346APPENDIX C FAULT LEVELS.......................................................................................348APPENDIX D PROJECT CALENDAR ...........................................................................362APPENDIX E TRANSPOWER’S INVESTMENT APPROVALS PROCESS (IAP)........372APPENDIX F GRID SUPPORT CONTRACTS ..............................................................374APPENDIX G GENERATION SCENARIOS ...................................................................379APPENDIX H TRANSPOWER PROJECT NAMING .....................................................393APPENDIX I GLOSSARY .............................................................................................395APPENDIX J GRID EXIT AND INJECTION POINTS ....................................................400x<strong>2012</strong> <strong>Annual</strong> <strong>Planning</strong> <strong>Report</strong> © <strong>Transpower</strong> New Zealand Limited <strong>2012</strong>. All rights reserved.
Chapter 1: Introduction1 Introduction1.1 Purpose of the <strong>Annual</strong> <strong>Planning</strong> <strong>Report</strong>1.2 The regulatory framework and the APR’s context1.3 The planning approach1.4 Project classification1.5 Project references1.6 Cost bands<strong>Transpower</strong> owns, maintains, operates and develops New Zealand’s high voltagetransmission network (the National Grid).The <strong>Annual</strong> <strong>Planning</strong> <strong>Report</strong> (APR) provides details of potential transmissioninvestment over the next 15 years. This includes:the forecast of demand and generation at each grid exit point and grid injectionpoint, respectively, over the next 15 yearsinformation about the existing transmission networkanticipated system constraints and issues over the next 15 yearsa summary of potential transmission investment to alleviate the anticipatedsystem constraints and issues, andother issues impacting on transmission investment.The information in this APR is based on the New Zealand transmission network as at28 February <strong>2012</strong>.1.1 Purpose of the <strong>Annual</strong> <strong>Planning</strong> <strong>Report</strong>We produce the APR to:provide an indication of the National Grid’s ability to meet forecast demand andgeneration development over the next 15 yearscommunicate the potential transmission investment required to alleviateanticipated system constraints and issues to industry regulators and interestedpartiesprovide transparency in terms of the current transmission network developmentoptions, andencourage an efficient investment market via the timely disclosure of griddevelopment options.This APR is based on a full assessment of the forecast transmission issues, andrepresents our view of how the National Grid can be developed over the next 15years in order to provide both reliability of supply and a competitive electricity market.To achieve this, the APR:presents a grid development plan, which includes possible transmissioninvestments based on preliminary assessments only 4 - detailed analysis occurswhen preparing a Major Capex Proposal (MCP) (see Appendix E for moreinformation), andaims to provide information to enable interested parties to:understand the transmission network’s ability to supply their needsprovide input into our transmission network development plans4This plan does not imply that we have formed a view about a particular transmission investment, orthat a transmission (versus a transmission alternative) investment is the most efficient solution.<strong>2012</strong> <strong>Annual</strong> <strong>Planning</strong> <strong>Report</strong> © <strong>Transpower</strong> New Zealand Limited <strong>2012</strong>. All rights reserved. 11
Chapter 1: IntroductionMajor Capex ProposalsInvestment proposals that are expected to cost more than $5 million must besubmitted to the Commerce Commission as a Major Capex Proposal. This processreplaces the previous approval process whereby we submitted Grid Upgrade Plans tothe Electricity Commission.System Security Forecast (SSF)As the System Operator, we also publish the SSF. The SSF assesses the NationalGrid’s capability to meet demand as required under Part 7 of the Code, and generallycovers a shorter term and operational focus. The latest SSF is available from ourSystem Operator website. 5Transmission CodeWe have recently published our Transmission Code which codifies moretransparently a set of technical planning requirements that we will apply to ensure theNational Grid remains resilient and fit for purpose, and consistent with good industrypractice. More information on the Transmission Code can be found on our Grid NewZealand website. 61.3 The planning approachOur long-term strategic view is outlined in Chapter 2 ‘Facilitating New Zealand’sEnergy Future’. <strong>Planning</strong> is framed by the long-term view to ensure the appropriateselection of investment for the maintenance of a reliable and secure electricity supply,under a range of system and environmental conditions.1.4 Project classificationThe APR refers to a large number of transmission and generation projects bothpotential and under way. This section explains how we present projects in the APR inthe context of their state of completion, regulatory status, identification references andcosts.1.4.1 State of completionWe classify transmission network development projects by their state of completion.Table 1-1 lists the completion states by project type and definition.Table 1-1: State of completion classificationsStatusCompletedCommittedProposedPreferredPossibleDefinitionProjects that have recently been completed and are commissioned and operating.Projects that are currently underway for which either:the investment has obtained regulatory approval, or<strong>Transpower</strong> has entered into a new investment contract with a specificcustomer or customers.Projects that <strong>Transpower</strong> has proposed, either:to the Commission via a Major Capex Proposal, oras part of our Base Capex funding, orto specific customer or customers for their agreement.Projects for which <strong>Transpower</strong> has undertaken detailed analysis and identified apreferred transmission or non-transmission solution.Projects identified as possible options for future grid upgrade, subject to further56http://www.systemoperator.co.nz/publications#cs-85812http://www.gridnewzealand.co.nz/transmission-code<strong>2012</strong> <strong>Annual</strong> <strong>Planning</strong> <strong>Report</strong> © <strong>Transpower</strong> New Zealand Limited <strong>2012</strong>. All rights reserved. 13
Chapter 1: IntroductionStatusBase CapexInformation onlyDefinitionanalysis.Development projects forecast to cost less than $5 million, or projects that arereplacement or refurbishment on existing assets. These proposed projects arefunded under approved Base Capex allowance.Descriptions of issues that are likely to be managed operationally or by customerdriven investment. Specific projects are not formulated either because it is tooearly to do so, or because alternative low-cost options are evident.1.4.2 Investment purposeWe classify transmission network development projects by their investment purpose,consistent with our capital expenditure regulatory framework, the Capital ExpenditureInput Methodology (Capex IM). Table 1-2 lists the development projectclassifications.Table 1-2: Regulatory investment typeInvestment purposeDefinitionTo meet Grid ReliabilityStandard (core grid/notcore grid)To provide net marketbenefitCustomer-specificMinor enhancementReplacementThe Grid Reliability Standard (GRS) is an n-1 standard for assets listed on theCore Grid (Schedule 12.3 of Electricity Industry Participation Code).For all other assets, the GRS is an economic standard which mustdemonstrate the proposed investment returns benefits greater than theforecast cost of the investment.Projects that must demonstrate market benefits greater than costs.Enhancement projects on assets specific to a customer or group of customerswhich are agreed and paid for under a new investment contract between<strong>Transpower</strong> and the customer/group of customers.Projects that are less than $5 million and are not Customer-specific.Replacement projects on assets driven by condition assessment.All investments greater than $5 million are subject to the Investment Test of theCapex Input Methodology. Base Capex investments greater than $20 million(replacements) must also be based on economic analysis which is consistent with theInvestment Test.1.4.3 Generation proposalsTable 1-3 summarises the generation proposal classifications used throughout theAPR.Table 1-3: Generation proposals classificationsStatus Definition Consideration in APRCommittedLikely toproceedProjects for which:land for the project has beenacquiredresource consents have beenobtained, andbusiness approval has beenobtained.Projects for which the following areunder way or close to beingobtained:procuring land for the projectapplication for resource consent,andbusiness approval.The project will be:considered explicitly in <strong>Transpower</strong>’sassessment of transmission issues anddevelopment options, anddescribed in the main body of the text.The project will be considered as:part of the generation scenarios described inChapter 5, ora sensitivity assessment, if it does not fit withinany of the generation scenarios described inChapter 5. In this case, the APR will describethe project in a separate section under theregional plans, including its possible impact onthe transmission network and development14<strong>2012</strong> <strong>Annual</strong> <strong>Planning</strong> <strong>Report</strong> © <strong>Transpower</strong> New Zealand Limited <strong>2012</strong>. All rights reserved.
Chapter 2: Facilitating New Zealand’s Energy Future2 Facilitating New Zealand’s Energy Future2.1 Introduction2.2 Transmission Tomorrow – a progress report2.3 Generation and grid compatibility2.4 When do we invest?2.1 IntroductionThe transmission network is central to the delivery of least cost electricity to NewZealand’s homes and industry. The transmission network enables the economicdispatch of least cost electricity through the electricity market from diverse generationsources. The transmission network also enables a greater range of ancillary servicessuch as frequency keeping, spinning reserve and interruptible load to provide thesupport needed to keep the network secure.The requirements placed on the transmission network evolve over time. The assetsand operation of the power system of the 1950s is different to today. Therequirements of the transmission grid will continue to evolve in ways that we can notforesee today:the historic link between load growth and GDP may be changing, creatinguncertainty over how much electricity use will grow;the nature of demand for electricity will change, particularly the shape of thedemand curve on a daily and annual basis;how and where electricity is generated will change, both to replace retiringgeneration and to meet load growth; and;new technologies will change how electricity is generated, transmitted and used.We are investing in long-term strategies, platforms and technologies to guide andinform our transmission planning. The future is inherently uncertain. Our planningmust reflect this and position us to be able to meet all possible eventualities. This willallow us to make best use of our existing assets and provide better options when newassets are needed. This will reduce the cost and footprint of the grid for futuregenerations while providing a grid that is fit for purpose.In early 2011, we launched Transmission Tomorrow, which describes the strategies,platforms and technology we use now and will require in the future. Where relevantto the <strong>Annual</strong> <strong>Planning</strong> <strong>Report</strong>, their effect is reflected in Chapter 6 for the gridbackbone and Chapters 7-19 for the regional grids.In this chapter:Section 2.2 is a progress report on Transmission TomorrowSection 2.3 describes emerging and potentially significant interactions betweengeneration technology and the grid.Section 2.4 concludes with when we invest.2.2 Transmission Tomorrow – a progress reportSince releasing Transmission Tomorrow, we have made progress on the strategicinitiatives. Several initiatives are summarised below.16<strong>2012</strong> <strong>Annual</strong> <strong>Planning</strong> <strong>Report</strong> © <strong>Transpower</strong> New Zealand Limited <strong>2012</strong>. All rights reserved.
Chapter 3: Facilitating New Zealand’s Energy Future2.2.1 Variable line ratings - operating assets to ratingsThe initiativeMost of our transmission lines are operated to pre-calculated, seasonal ratings.Pre-calculated ratings are design ratings which reflect a least favourable combinationof operating conditions (such as ambient temperature and wind) for that season. Ifthe ambient conditions at a point in time are more favourable than assumed for thedesign ratings, then transmission lines can carry more power than the design rating.In November 2011 (a month ahead of schedule), we implemented interim variableline ratings (iVLR) on six transmission circuits. The use of iVLR provides the circuitswith up to 84 different ratings at different times of day and month in the year. Theambient conditions are determined for a 500 metre grid along the line using historicweather data from NIWA. The ratings are then determined from the maximum designoperating conditions and line ground clearances measured from aerial laser surveys.iVLR provides an average capacity gain for each circuit of between 8% and 16%.The trial is expected to continue for at least two years, with the experience helping toframe the rollout of variable line ratings across the entire transmission network. Weexpect to roll out variable line ratings for all lines in conjunction with the next majorupgrade of the System Operator’s software tools, within the planning period. Theambient conditions used to calculate these ratings will be based on shorter periodsand actual regional data and forecasts.Operating experienceThe following circuits presently have VLR applied:Clyde–Roxburgh 1 and 2 – part of the 220 kV grid in the Otago-Southland areaWairakei–Ohakuri and Atiamuri–Ohakuri – part of the 220 kV “Wairakei Ring”northwest of Taupo, andOtahuhu–Whakamaru 1 and 2 – part of the 220 kV grid into Auckland.VLR assists in management of the low hydro generation in the Otago-Southland areaby increasing the average transmission capacity from the Waitaki Valley to the Otago-Southland area during the time before the capacity of the Clyde–Roxburgh 1 and 2circuits is increased through the installation of duplex conductors.The Wairakei Ring area has significant hydro and geothermal generation, with moregeothermal generation under construction or planned. VLR allows more flexibledispatch of generation with the existing transmission system, applying downwardpressure on energy prices. There is an approved project to increase transmissioncapacity by building a higher capacity transmission line in the Wairakei ring. VLR onthe Wairakei–Ohakuri and Atiamuri–Ohakuri circuits will enable additional capacityand better utilisation of these existing lines. VLR will also further increase the overalltransmission capacity through the Wairakei ring.VLR on the Otahuhu–Whakamaru 1 and 2 circuits is primarily intended to provideincreased transmission capacity during maintenance outages of other 220 kV circuitssupplying Auckland.<strong>Planning</strong> experienceVLR also requires a change in transmission line rating methodology. The change inrating methodology increases the average capacity of a transmission circuit, but mayalso decrease the rating of some circuits for certain periods during the day and timesof the year. The new rating methodology is yet to be applied to transimission circuitsthat are not part of our iVLR work.<strong>2012</strong> <strong>Annual</strong> <strong>Planning</strong> <strong>Report</strong> © <strong>Transpower</strong> New Zealand Limited <strong>2012</strong>. All rights reserved. 17
Chapter 2: Facilitating New Zealand’s Energy FutureThe future full adoption of VLR is not expected to be an issue for the grid backbone,as most circuits gain capacity and the effects of any decrease will be limited tochanges in generation dispatch.VLR may reduce the capacity at certain times of some radial circuits which supplyload. Typically, VLR will increase capacity during winter morning and evening peaks,deferring investment to meet those peaks. However, in some cases, the circuit ratingmay decrease during summer mornings when air temperatures and solar radiationare higher and wind speeds are lower. This could bring forward the the need forinvestment in transmission or non-transmission options to securely supply the load.2.2.2 Demand-side response – enabling consumer responseThe initiativeDemand-side response is a framework where loads can be reduced (eitherindividually or as part of an aggregated group) to the extent and times required by thegrid. The magnitude and duration of any load reduction is to pre-agreed contractualterms.Wide adoption of demand-side response will reduce growth in transmission peaks,delaying the need for transmission upgrades. It may also be very useful to manageoutages for maintenance, either maintaining security during the outage or avoidingthe need for additional investment to allow maintenance outages.Progress to dateUpper South Island distribution companies worked with us to collaboratively manageregional demand to reduce system peaks. This initiative has reduced the peakdemand in the region by 3 percent, deferring the need for grid upgrades by at leasttwo years.As part of the Upper North Island Reactive Support Project (see Section 6.4.1) weissued a Request For Proposals for demand-side response. The proposals receivedwere all uneconomic, which was an unexpected result. Part of the problem was thecontractual framework and the platform to implement demand-side response.For demand-side response to be effective and economic, it needs to be establishedas a sustained programme and not as a reactive “just-in-time” measure. Requiringproponents to provide adequate and verifiable demand-side response within acondensed timeframe and for relatively short contract periods results in prices beingdriven upwards.To support the development of demand-side response in New Zealand, we arecurrently developing a Demand Response Management pilot system, which isplanned to be ready for testing in July <strong>2012</strong>. Along with a common customerinterface, it will assist in the calling and coordination of demand-side response. Whileinitially for the Upper North Island, the technology provides for a platform from whichwe can support and enable future demand-side initiatives in all parts of New Zealand.2.2.3 Corridor management of transmission routes – secure long term access totransmission routesThe initiativeNational and local policy-makers recognise the need to plan long-term forinfrastructure 7 . Local authorities are now considering utility corridors in theirlong-term plans. This provides a mechanism by which transmission line corridors canbe managed so that only compatible developments are built under and adjacent to7 The 2008 introduction of the National Policy Statement on Electricity Transmission (NPSET) providesincreased protection against activities incompatible with transmission lines, such as underbuild.18<strong>2012</strong> <strong>Annual</strong> <strong>Planning</strong> <strong>Report</strong> © <strong>Transpower</strong> New Zealand Limited <strong>2012</strong>. All rights reserved.
Chapter 3: Facilitating New Zealand’s Energy Futureexisting transmission lines. This will preserve our ability to operate, maintain andupgrade our transmission lines 8 , which are irreplaceable assets.Progress to dateAs indicated in Transmission Tomorrow, we are developing a companion documentfor the APR that sets out our long term corridor management strategy fortransmission line routes. We focussed our efforts initially on the Auckland region tocoincide with our involvement in the development of the Auckland Council’s spatialplan. We will publish the first edition of the companion document later this year.2.2.4 Voltage support - maximising capability of transmission routesThe initiativeOn longer circuits, the full thermal capability of transmission lines cannot be used dueto voltage issues. Using reactive compensation to address voltage issues allowslines to operate closer to their thermal rating.Voltage stability is a significant issue for the Upper North Island and the Upper SouthIsland (refer to Section 6.4.1 and Section 6.6.1 respectively). To address the voltageissues we have static reactive support from switched capacitors and dynamic reactivesupport from devices such as synchronous condensers, static var compensators(SVCs) and STATCOMS at several substations within an area. Coordinating thereactive devices is not straight forward and must be managed carefully and safely.This requires automatic control via area wide reactive power controllers (RPCs).Progress to dateLate last year, we commissioned our first area wide RPC, for the Christchurch area.We will also commission a similar area wide RPC for the Auckland area in 2014. Thiswill help the system operator to better manage area wide voltage, eliminating theneed for manual switching and thus enabling greater use of reactive compensationand higher loading on lines.2.2.5 Other initiativesResilience of the gridGrid reliability is inherent in much of what we do; however, maintaining and improvingresilience in a more highly loaded grid requires special attention, especially for HighImpact Low Probability (HILP) events.Initiatives in the last year which increase the resilience of the grid include thefollowing:The protection and control systems at Penrose substation in Auckland are beingseparated into two different buildings to guard against the loss of all systems atthis critical site. This is a low cost improvement as it is being done in conjunctionwith work required as part of the North Auckland and Northland (NAaN) project.An investigation is presently underway to improve security of the Wilton 110 kVbus. This bus is the “hub” for the supply to Wellington city. The investigation isbeing done in conjunction with the need to modify the bus to allow easier andsafer maintenance and equipment replacement due to condition assessment.A HILP study was completed for Islington substation, which is a critical node forsupply to the Upper South Island. The study highlighted cost effectiveinvestments which improve the resilence of the transmission network to HILPevents. These improvements will be included in the Upper South Island Stability8 About 95% of our line corridors are controlled by the Electricity Act 1992 Part 3. About 5% of our newline corridors are controlled by ownership or easements by <strong>Transpower</strong>.<strong>2012</strong> <strong>Annual</strong> <strong>Planning</strong> <strong>Report</strong> © <strong>Transpower</strong> New Zealand Limited <strong>2012</strong>. All rights reserved. 19
Chapter 3: Facilitating New Zealand’s Energy FutureHigh TOV can cause generating units to trip to protect themselves from damage. Thetripping of the HVDC link can cause high TOV in the lower North Island (up toBunnythorpe and Stratford substations, and other substations in the area) which cancause regional generation to trip. This has not been a concern in the past as therewas relatively little generation in the Wellington region. The connection of wind farmsnear Wellington and the proposals for more wind farms in Wellington and theWairarapa make TOV considerations more important for the future.The loss of the HVDC link at high north transfer can result in not only the loss ofHVDC transfer but potentially significant generation in the Wellington region. Such arisk is managed through the procurement of sufficient instantaneous reserves tocover the loss of the HVDC link and generation or by reducing HVDC transfer andgeneration in the Wellington. These measures can have high market costs. HighTOV can also be mitigated by investment in transmission assets which will haveconsiderable costs. A more cost effective measure for New Zealand may be to havegeneration plant located in regions with high TOV being capable of remainingconnected during and after the TOV event and providing support during the event toreduce the extent of the high TOV.2.3.2 Recovery following a faultFaults are a normal and expected part of operating the power system. Generationplays an important part in assisting the power system in recovering from faults. Onetype of fault is the loss of generation infeed. This could be caused by the loss of agenerating unit, a bus with generating units connected, or transmission circuit(s)carrying power from an area with nett generation export to an area of nett load. Theimmediate effect following the loss of generation infeed is a fall in frequency.Generation that remains connected to the grid has an important role in arrestingfrequency fall and restoring frequency.The System Operator ensures that there are sufficient instantaneous reserves (IR)(partially loaded generating units and interuptible load) available to halt the fall infrequency caused by loss of certain amounts of generation or transmission infeed.The amount of IR required mainly depends on the size of the largest risk. In theNorth Island, the largest risk is usually the sudden loss of a large thermal generatingunit (up to 400 MW).Other factors such as governor action on generating units and system inertia are alsoimportant. Hydro and fossil fuelled generation will automatically use more ‘fuel’ andincrease output during falls in frequency as a result of free governor action. Systeminertia (the ability of the system to resist or slow down the fall in frequency) affects theamount of reserves required. Falls in frequency following the loss of generation arefaster with lower system inertia. Halting the fall then requires more fast acting IR.The changing nature of the generation fleet in the future will affect the amount ofrequired instantaneous reserves:The displacement of large thermal generating units by renewable generation willtend to reduce the size of the risk of a generating unit trip and hence reduce therequired IR over time. However, the IR required to cover the tripping of a bus ortransmission circuits may not reduce significantly. The largest individualgenerating units using renewable ‘fuel’ tend to be smaller compared with thelargest generating units which are fossil fuelled (up to about 80 MW (SouthIsland) and 400 MW (North Island)).Increased amounts of renewable generation with less ability to provide supportduring falls in frequency will increase the need for instantaneous reserves in thefuture. Geothermal, wind and in the future marine energy and photovoltaiccannot increase output as the frequency falls. This is because usually all their‘fuel’ input is being used to generate electricity and there is no additional ‘fuelreserve’ for sustained additional generation to provide instantaneous reserve.<strong>2012</strong> <strong>Annual</strong> <strong>Planning</strong> <strong>Report</strong> © <strong>Transpower</strong> New Zealand Limited <strong>2012</strong>. All rights reserved. 21
Chapter 2: Facilitating New Zealand’s Energy FutureSome forms of renewable generation have less than the hydro or thermal plantwhich they displace. This reduction in system inertia will increase the need forinstantaneous reserves.Wind and other forms of renewable generation could also provide instantaneousreserves if they ‘spill’ some of their ‘fuel’, so an instantaneous increase in generationoutput is possible (up to the maximum level of ‘fuel’ input) if required. The ‘fuel spill’comes at a cost of decreased efficiency, but this may be more than balanced by theinstantaneous reserve costs. Similarly, wind and other forms of renewablegeneration can provide “pseudo interia”. This is achieved by allowing the windturbines to slow down or speed up during changes in power system frequency.It is possible that there will be an economic imperative for wind farms and otherrenewable generation sources to provide instantaneous reserves and pseudo interiain future. This is especially likely if enough new geothermal and wind farm generatingstations are built so that during low load periods most hydro and fossil fuelled powerstations are off.2.3.3 Balancing generationThe power system must be continuously operated to balance supply and demand forelectrical energy. However, wind and some other forms of renewable generation areintermittent or cannot have their outputs readily controlled. This places extrademands on the real-time operation of the power system, as some overseas utilitiesare experiencing with wind generation supplying close to all overnight load.One strategy to manage the diverse characteristics of generation is to implementAutomatic Generation Control (AGC). AGC, already used outside New Zealand, is awide-area control to change generation output on a near continuous basis. One useof AGC is to balance the output from variable generation by changing the output fromdispatchable generation.It is also expected that more use will be made of demand-side response to balancegeneration. This will develop as technology advances and markets mature.2.4 When do we invest?The underlying principle for transmission investment in New Zealand is that thetransmission investment should provide the best net benefit.Transmission Tomorrow identified existing and future drivers, including technology,which may or will shape the grid of the future. These technologies increase theoptions available for enhancing the grid where necessary.Demand-side response may be particularly useful for reducing the cost of newinvestment. Many projects are commissioned ‘early’ to account for the year-to-yearvariability in peak load growth and the risk of project delays. Demand-side responsehas the potential to cover this uncertainty, allowing new investment to be deferred fora few years.Demand-side response may also be very useful to manage outages for maintenance,either maintaining security during the outage or avoiding the need for additionalinvestment to allow maintenance outages.It is important that we maintain options like using demand-side response to deal withthe unexpected. Transmission planning is often said to be about minimising themistakes from being wrong about the future. Developing our options whether by wayof technology, future corridor protection or demand-side initiatives will help ensurethat tomorrow’s consumers will have a fit-for-purpose transmission grid at the leastpossible cost.22<strong>2012</strong> <strong>Annual</strong> <strong>Planning</strong> <strong>Report</strong> © <strong>Transpower</strong> New Zealand Limited <strong>2012</strong>. All rights reserved.
Chapter 3: Existing National Grid3 Existing National Grid3.1 Introduction3.2 Load and generation3.1 IntroductionThis chapter provides an overview of New Zealand’s existing National Grid as at 28February <strong>2012</strong> with respect to load and generation. New Zealand’s National Gridconsists of the:HVAC transmission network, andan inter-island HVDC link.3.1.1 The AC transmission networkNew Zealand’s HVAC transmission network supplies most of the major load centres,and consists of a grid backbone of 220 kV transmission lines stretching nearly the fulllength of each island.There is also a network of 110 kV lines that run roughly parallel to the 220 kV system.The 110 kV system was the original grid backbone, largely superseded by theintroduction of the 220 kV grid from the 1950s onwards. The 110 kV system is nowprimarily used for transmission to some regions that do not have 220 kV, or for subtransmissionto substations within a region.Figure 3-1 and Figure 3-2 show maps of the transmission network for both the Northand South Islands.<strong>2012</strong> <strong>Annual</strong> <strong>Planning</strong> <strong>Report</strong> © <strong>Transpower</strong> New Zealand Limited <strong>2012</strong>. All rights reserved. 23
Chapter 3: Existing National GridFigure 3-1: New Zealand’s North Island transmission network24<strong>2012</strong> <strong>Annual</strong> <strong>Planning</strong> <strong>Report</strong> © <strong>Transpower</strong> New Zealand Limited <strong>2012</strong>. All rights reserved.
Chapter 3: Existing National GridFigure 3-2: New Zealand’s South Island transmission network<strong>2012</strong> <strong>Annual</strong> <strong>Planning</strong> <strong>Report</strong> © <strong>Transpower</strong> New Zealand Limited <strong>2012</strong>. All rights reserved. 25
Chapter 3: Existing National Grid3.1.2 The HVDC LinkThe HVDC link connects the North and South Island transmission networks.This bi-directional link runs from Benmore, in the South Island, where there is anAC/DC converter station. There is a 534 km transmission line between Benmore andFighting Bay (Marlborough), a 40 km submarine cable between Fighting Bay andOteranga Bay across the Cook Strait, and a further 37 km transmission line intoHaywards substation north of Wellington. At Haywards substation, there is anotherAC/DC converter station.HVDC power flow is predominantly from the South Island to the North Island. Powerflow is from north to south when it is necessary to conserve South Island hydroresources as part of an efficient generation process, or to supply South Islanddemand during dry South Island periods.The HVDC link now consists of one permanently operating pole: Pole 2(commissioned in 1991) operating at 350 kV, which uses thyristor conversiontechnology. An older technology (mercury arc valve) pole (Pole 1), operating at270 kV, was stood down in September 2007, with half being totally decommissioned,and the remaining half pole to operate on a limited basis. 10 We are also mid-waythrough construction of a $672 million project to replace Pole 1 by <strong>2012</strong> with a newpole (the HVDC Inter-island Link Project).Table 3-1 lists the pole capacities for converting power from AC to DC and from DCto AC for both poles. Total pole capacity equates to the total capacity of the link.Table 3-1: Converter ratings and pole capacitiesPole Commissioned Converter type TransmissioncapacityOperationPole 1 (half pole) 1965 Mercury arc valves 270 MW 1 Available for limitedpeak operation onlyPole 2 1991 Thyristor valves 700 MW 2 FullTotal possible transmission capacityNotes:970 MW1. In December 2007, <strong>Transpower</strong> announced it would decommission half of Pole 1, after standingdown the full Pole 1 in September 2007.2. In November 2007, <strong>Transpower</strong> reconfigured the three operational undersea cables of the HVDC linkto increase the capacity of the south to north transfer of Pole 2 to 700 MW.3.1.3 Transmission network asset profileTable 3-2 provides a summary of the transmission network’s assets.Table 3-2: Transmission network assetsAsset descriptionDetailLength of HVAC and HVDC transmission line11,730 route kmNumber of substations (including HVDC) 178HVAC transmission line voltages220, 110, 66, 50 kVHVDC transmission line voltages350, 270 kVHVDC link capacity 700 MW 110The remaining half of Pole 1 is available under limited conditions: for normal operation, in responseto Grid emergencies, and for testing. The conditions include north transfer between 130 MW and200 MW, with automatic controls unavailable (except frequency modulation). Other conditionsinclude a limit on the number of starts, minimum operating time per start and cumulative operatingtime.26<strong>2012</strong> <strong>Annual</strong> <strong>Planning</strong> <strong>Report</strong> © <strong>Transpower</strong> New Zealand Limited <strong>2012</strong>. All rights reserved.
Chapter 3: Existing National GridAsset descriptionDetailCapacitor banks 69Transformers (banks) 360Synchronous condensers 10Static Var Compensators/STATCOMS 4Notes:1. Pole 1 was stood down from operation in September 2007. One half of this Pole will be madeavailable for limited use to supply peak load periods. Approximately 270 MW additional will be madeavailable by this action.3.1.4 Recently completed transmission upgrade projectsTable 3-3 lists the transmission upgrade projects completed since the last <strong>Annual</strong><strong>Planning</strong> <strong>Report</strong> (31 March 2011).Table 3-3: Projects completed since the 2011 <strong>Annual</strong> <strong>Planning</strong> <strong>Report</strong>Project nameIslington reactive power controllerNorth Island Grid Upgrade project:convert the existing 110 kV Pakuranga substation to 220 kVconvert the existing 110 kV Otahuhu–Pakuranga line to 220 kVPakuranga 220/33 kV supply transformerBombay 110 kV bus security upgradeRedclyffe 110 kV bus security upgradeWest Coast Grid Upgrade project:Inangahua–Reefton 2 circuit extension to DobsonDobson interconnecting transformerWoodville supply transformer replacement and a second supply transformerWaverley supply transformer replacement110 kV Hawera–Stratford reconductoring110 kV Wanganui–Waverley reconductoringTable 3-4 lists the transmission upgrade projects that have commenced but are notyet commissioned.Table 3-4: Projects commenced (not yet commissioned)Project nameNorth Island Grid Upgrade project – new 220/400 kV double circuit transmissionline (partially underground cables) from Whakamaru to PakurangaBay of Plenty Interconnection Upgrade project including:New 220/110 kV transformers at KaitimakoConverting the Hairini–Tarukenga line to 220 kV operationExpectedcompletion date<strong>2012</strong><strong>2012</strong><strong>2012</strong>110 kV Hawera–Waverley reconductoring <strong>2012</strong>North Auckland and Northland grid upgrade project including:new 220 kV underground cable between Pakuranga and Penrosenew 220 kV underground cable between Penrose and Albany20132013Replacement of 220 kV Wairakei–Whakamaru transmission line 2013HVDC Pole 3Stage 1Stage 2<strong>2012</strong>2014Upper North Island Dynamic Reactive Support Project 2013-14<strong>2012</strong> <strong>Annual</strong> <strong>Planning</strong> <strong>Report</strong> © <strong>Transpower</strong> New Zealand Limited <strong>2012</strong>. All rights reserved. 27
Chapter 3: Existing National GridProject nameExpectedcompletion dateLower South Island Reliability Project <strong>2012</strong>-17Clutha–Upper Waitaki Lines Project 12013-TBCMasterton supply transformer replacement <strong>2012</strong>Tarukenga interconnecting transformer replacement 2013A third 220/66 kV transformer at Bromley 2013Opunake–Stratford A reconductoring 2013New grid exit point at Piako 2013New grid exit point at Hobson Street 2013New grid exit point at Wairau Road 2013Stoke supply transformer replacement 2014Notes1. Some components of this project will be subject to review by June 20133.2 Load and generationNew Zealand’s transmission network is regarded as narrow and longitudinal, withareas of demand (load) commonly some distance from the areas of significantgeneration. Consequently, the transmission network is essential in complementinggeneration to bring the power to where it is needed.A particular feature of the National Grid, and a key benefit for a sustainable NewZealand, is its ability to provide New Zealanders with access to renewablegeneration. Typically, the remote areas of generation connected by the National Gridare renewable (e.g. hydro in the Waitaki Valley, wind in the Tararuas, and hydro andgeothermal in the Central North Island).Figure 3-3 shows a simplified map of load, generation, and the transmissionnetwork’s grid backbone. For more information see Chapter 4 for the demandassumptions, Chapter 5 for the generation assumptions and Chapter 6 for thetransmission backbone.28<strong>2012</strong> <strong>Annual</strong> <strong>Planning</strong> <strong>Report</strong> © <strong>Transpower</strong> New Zealand Limited <strong>2012</strong>. All rights reserved.
Chapter 3: Existing National GridFigure 3-3: Load, Generation and the Grid BackboneMany of New Zealand’s larger population centres are located in the North Island,while a significant amount of hydro generation is located in the South Island.Power flow tends to be from south to north during normal rainfall years, deliveringpower from the hydro generation in the South Island to the North Island through theHVDC link, which also balances demand between the islands. North to southtransfers have been occurring for longer periods in recent years. They occur morefrequently during dry years where hydro generators in the South Island try toconserve water.Figure 3-4 shows New Zealand’s electricity demand as seen at grid exit points (i.e.this includes distribution network losses but not demand supplied by generationembedded within these networks). Demand has been flat over the last 7 yearsparticularly when compared with the strong growth seen in earlier decades. In recentyears demand has been affected by the ongoing impacts of the global recession, thewinter savings campaign in 2007, a reduction in demand at Tiwai Aluminium Smelterin 2008 and the impact of the Christchurch earthquakes.<strong>2012</strong> <strong>Annual</strong> <strong>Planning</strong> <strong>Report</strong> © <strong>Transpower</strong> New Zealand Limited <strong>2012</strong>. All rights reserved. 29
Chapter 3: Existing National GridFigure 3-4: New Zealand energy use for last seven years30<strong>2012</strong> <strong>Annual</strong> <strong>Planning</strong> <strong>Report</strong> © <strong>Transpower</strong> New Zealand Limited <strong>2012</strong>. All rights reserved.
Chapter 4: Demand Assumptions4 Demand assumptions4.1 Introduction4.2 Energy use versus peak demand4.3 Peak demand forecast methodology4.4 Comparison with the 2010 and 2011 APR demand forecast4.1 IntroductionThis chapter provides an overview of the grid exit point demand forecasts used in theplanning studies for this report.Consideration of the National Grid’s future adequacy requires a view of futureelectricity demand. In line with international Good Electricity Industry Practice (GEIP)and to ensure the timely construction of new transmission, we use a prudent demandforecast for our planning.For this publication of the <strong>Annual</strong> <strong>Planning</strong> <strong>Report</strong> we have employed a newapproach to derive our forecasts. The new approach takes account of more recentinformation and builds on the work of the now disestablished Electricity Commission.We consulted on our new approach in May 2011 and relevant discussion anddocumentation can be found at http://www.gridnewzealand.co.nz/project-inputs.Our prudent peak forecasts can be interpreted as representing a 10% probability ofexceedance (POE) forecast for the first 5 years of the forecast period (until 2017). Inother words, until 2017 one would expect actual demand to exceed the forecast inone year out of ten. Post 2017 we assume an expected (or mean) rate of growthsuch that the probability of exceedance increases over time. We consider this is anappropriate basis on which to conduct our planning.Both the <strong>Annual</strong> <strong>Planning</strong> <strong>Report</strong> (APR) and Grid Reliability <strong>Report</strong> (GRR) require agrid adequacy assessment at the grid exit point level.This is in accordance with Rule 12.76, Part 12 of the Electricity Industry ParticipationCode, which states:Part 12 Grid reliability reporting12.76 <strong>Transpower</strong> to publish grid reliability report12.76(1) <strong>Transpower</strong> must publish a grid reliability reportsetting out:12.76(1)(a) a forecast of demand at each grid exitpoint over the next 10 years12.76(1)(b) a forecast of supply at each grid injectionpoint over the next 10 years12.76(1)(c) whether the power system is reasonablyexpected to meet the N-1 criterion, including inparticular whether the power system would be in asecure state at each grid exit point, at all times overthe next 10 year, and12.76(1)(d) proposals for addressing any mattersidentified in accordance with rule 12.76(1)(c).12.76(2) <strong>Transpower</strong> must publish a grid reliability report nolater than 2 years after the date on which it published the<strong>2012</strong> <strong>Annual</strong> <strong>Planning</strong> <strong>Report</strong> © <strong>Transpower</strong> New Zealand Limited <strong>2012</strong>. All rights reserved. 31
MW00:0001:0002:0003:0004:0005:0006:0007:0008:0009:0010:0011:0012:0013:0014:0015:0016:0017:0018:0019:0020:0021:0022:0023:00Chapter 4: Demand Assumptionsprevious grid reliability report, or such other date as determinedby the Electricity Authority.12.76(3) If there is a material change in the forecast demand ata grid exit point or in the forecast supply at a grid injection pointin the period to which the most recent grid reliability reportrelates, <strong>Transpower</strong> must publish a revised grid reliabilityreport as soon as reasonably practicable after the materialchange.Appendix A contains the detailed prudent peak load forecasts by region and grid exitpoint.4.2 Energy use versus peak demandThe demand for electrical energy in New Zealand varies from month-to-month, dayto-day,and from hour-to-hour. For example, residentially, much more energy isconsumed between the hours of 7:00 – 9:00 am and 5:00 – 8:00 pm than at othertimes of the day, due to heavier domestic appliance use. The demand at peak timesof the day can be up to twice the lowest demand during the day.Figure 4-1 shows a typical graph (load profile) of daily energy use.Figure 4-1: Typical pattern of daily energy useTypical Daily Load ProfileTime of DayBecause electricity cannot be stored practically in the quantities required, meetingelectricity demand means having sufficient capacity in the electricity supply system(generation, transmission and distribution) to meet the highest (peak) demand.Peak demand is expressed in instantaneous MW, whereas energy is described asconsumption over time, in MWh. Transmission planning requires an analysis of thetransmission network’s adequacy in terms of meeting a forecast of peak demand,rather than energy.4.3 Peak demand forecast methodologyOur new approach to demand forecasting uses both top-down modelling of nationaland regional peak and energy demand, and bottom-up modelling of grid exit point32<strong>2012</strong> <strong>Annual</strong> <strong>Planning</strong> <strong>Report</strong> © <strong>Transpower</strong> New Zealand Limited <strong>2012</strong>. All rights reserved.
Chapter 4: Demand Assumptionspeak demand. The top-down models employ a suite of models and use Monte Carlotechniques to randomly vary components of the models to assess the variability thatcan be expected in future peak demand. More details are available athttp://www.gridnewzealand.co.nz/project-inputs.At grid exit point level we have employed simpler regression techniques on historicalgrid exit point demand data to project expected and prudent peaks. We have alsosought customer views on grid exit point demand and in many cases modified ourforecasts to include specific load information from our customers. See the relevantregion’s chapter for more information about specific amendments (Chapters 7-19).Our forecasting structure also allows us to project each grid exit point contribution toregional and island peak demand. These will typically be less than grid exit point peakdemand and are calibrated to sum to the regional and island peak demands producedby our top-down models.4.3.1 Customer consultationWe believe customers are best placed to provide information about future demand intheir transmission networks. To this end, we issued a prudent forecast for commentto our customers in August 2011, inviting comments and adjustments whereapplicable. Around 25 responses were received. Additional comments had beenobtained in 2010 during the consultation for the 2011 APR forecast (thirty tworesponses were received). We have endeavoured, where reasonable and practical, toincorporate this feedback.We are committed to further consultation with customers with regard to our peak loadforecasts and we welcome ongoing dialogue on the nature and timing of changes togrid exit point demand.4.4 Comparison with the 2010 and 2011 APR demand forecastFigure 4-2 shows a comparison of the <strong>2012</strong> APR peak demand forecasts with thosefrom the previous two years.Figure 4-2: Comparison of <strong>2012</strong> APR prudent peak demand forecast with two previousAPRsLoad (MW)11,000New Zealand Prudent Peak Electricity Demand Forecast10,0009,0008,0007,0006,0005,0001995 2000 2005 2010 2015 2020 2025SOO 2010 APR 2010 APR 2011 APR <strong>2012</strong> ActualAt a national level, the <strong>2012</strong> prudent forecast is significantly lower than the 2011 and2010 forecasts. Our <strong>2012</strong> forecast starts at a lower level, which mostly results fromthe lower growth seen from 2006 but is also influenced by changes in our forecast<strong>2012</strong> <strong>Annual</strong> <strong>Planning</strong> <strong>Report</strong> © <strong>Transpower</strong> New Zealand Limited <strong>2012</strong>. All rights reserved. 33
Chapter 4: Demand Assumptionsmethodology. The forecast now grows at an average rate of 1.7% per annum from<strong>2012</strong> to 2027.The demand seen in recent years has been affected by a range of factors. The firstpart of 2008 was affected by dry weather, resulting in higher market prices and aconservation campaign, which both reduced demand. In 2009, demand was lowcompared with 2006 and 2007 due in part to reduced Tiwai production. Later, thefinancial crisis reduced economic activity affecting commercial/industrial demand.This impact has continued into 2009 and 2010.In 2011, we have seen a higher national peak recorded. This occurred during theunusual polar weather event that affected the whole country in mid-August. Heavysnow fell over much of the country and numerous new August low temperatureextremes were observed driving higher household heating demand. At a regionallevel there are also differences in our prudent forecasts when compared to last year.See the relevant regions’ chapters for more information.34<strong>2012</strong> <strong>Annual</strong> <strong>Planning</strong> <strong>Report</strong> © <strong>Transpower</strong> New Zealand Limited <strong>2012</strong>. All rights reserved.
Chapter 5: Generation Assumptions5 Generation assumptions5.1 Introduction5.2 Generation capacity assumptions5.3 Use of the generation capacity assumptions5.1 IntroductionThis chapter sets out the planning assumptions used to forecast future electricitygeneration at each grid injection point.<strong>Transpower</strong> undertakes grid planning to ensure that:electricity demand is met reliablythe generation investment market is efficient for all market participants, andthe energy market is competitive for all consumers.As a result, consideration of the National Grid’s future adequacy requires a view ofnot only future electricity demand – a requirement of both the <strong>Annual</strong> <strong>Planning</strong> <strong>Report</strong>(APR) and the Grid Reliability <strong>Report</strong> (GRR) – but also future electricity generation ateach grid injection point.Future generation will comprise a mix of existing generation (adjusted fordecommissioning), new committed generation, and other potential generationdevelopments. The uncertainty surrounding future generation requires theconsideration of several possible generation scenarios.We have considered five scenarios that are essentially an updated version of thescenarios in the Electricity Commission’s 2010 Statement of Opportunities (SOO).5.2 Generation capacity assumptionsGeneration capacity assumptions derive from a combination of:existing grid connected generation, (assumed to be available, at its existingcapacity, for the duration of the planning period)committed new generation, (new generation that is assumed to be committed,which is included from its publicly notified commissioning date, at its publiclynotified capacity, for the duration of the planning period from commissioning andincludes expansions of existing grid-connected generation)committed decommissioned generation, (existing generation that we have beennotified will be decommissioned, which is excluded from its publicly notifieddecommissioning date, for the balance of the planning period), andnew generation forecasts, (forecast new generation, which is included from theassumed commissioning date, at assumed capacities, for the duration of theplanning period from commissioning. Decommissioning may occur as well).5.2.1 Existing grid connected generationTable 5-1 lists the operating capacities of existing grid-connected generation.Installed capacities may differ in some cases.<strong>2012</strong> <strong>Annual</strong> <strong>Planning</strong> <strong>Report</strong> © <strong>Transpower</strong> New Zealand Limited <strong>2012</strong>. All rights reserved. 35
Chapter 5: Generation AssumptionsTable 5-1: Existing grid-connected generationGeneration plant Region Type Operatingcapacity inMWGrid injectionpointGlenbrook 1 Auckland Cogen 74 GlenbrookOtahuhu B Auckland Gas - CCGT 380 OtahuhuSouthdown Auckland Cogen 170 SouthdownKawerau Bay of Plenty Geothermal 105 KawerauKinleith Bay of Plenty Cogen 28 KinleithMatahina Bay of Plenty Hydro 72 MatahinaWheao/Flaxy Bay of Plenty Hydro 24 RotoruaAratiatia Central North Island Hydro 78 AratiatiaMangahao Central North Island Hydro 37 MangahaoOhaaki Central North Island Geothermal 46 OhaakiPoihipi Central North Island Geothermal 51 PoihipiRangipo Central North Island Hydro 120 RangipoTararua III 2 Central North Island Wind 93 BunnythorpeTe Apiti Central North Island Wind 90 WoodvilleTokaanu Central North Island Hydro 240 TokaanuWairakei Central North Island Geothermal 161 WairakeiNga Awa Purua Central North Island Geothermal 140 Nga Awa PuruaKaitawa Hawkes Bay Hydro 36 TuaiPiripaua Hawkes Bay Hydro 42 TuaiTuai Hawkes Bay Hydro 60 TuaiWhirinaki Hawkes Bay Diesel 155 WhirinakiKapuni Taranaki Cogen 25 KapuniKiwi Dairy Taranaki Cogen 70 HaweraPatea Taranaki Hydro 31 HaweraTaranaki CC Taranaki Gas - CCGT 385 StratfordStratford Peaker Taranaki Gas - CCGT 200 StratfordArapuni Waikato Hydro 197 ArapuniAtiamuri Waikato Hydro 84 AtiamuriHuntly Waikato Coal 1000 HuntlyHuntly e3P Waikato Gas - CCGT 385 HuntlyHuntly P40 Waikato Gas - OCGT 50 HuntlyKarapiro Waikato Hydro 90 KarapiroMaraetai Waikato Hydro 360 MaraetaiMokai Waikato Geothermal 112 WhakamaruOhakuri Waikato Hydro 112 OhakuriWaipapa Waikato Hydro 51 MaraetaiWhakamaru Waikato Hydro 100 WhakamaruWest Wind Wellington Wind 143 West WindArgyle/Wairau Nelson/Marlborough Hydro 11 ArgyleCobb Nelson/Marlborough Hydro 32 CobbColeridge Canterbury Hydro 45 ColeridgeAviemore South Canterbury Hydro 220 Aviemore36<strong>2012</strong> <strong>Annual</strong> <strong>Planning</strong> <strong>Report</strong> © <strong>Transpower</strong> New Zealand Limited <strong>2012</strong>. All rights reserved.
Chapter 5: Generation AssumptionsGeneration plant Region Type Operatingcapacity inMWGrid injectionpointBenmore South Canterbury Hydro 540 BenmoreOhau A South Canterbury Hydro 264 Ohau AOhau B South Canterbury Hydro 212 Ohau BOhau C South Canterbury Hydro 212 Ohau CTekapo A South Canterbury Hydro 25 Tekapo ATekapo B South Canterbury Hydro 160 Tekapo BWaitaki South Canterbury Hydro 105 WaitakiClyde Otago/Southland Hydro 432 ClydeManapouri Otago/Southland Hydro 840 ManapouriRoxburgh Otago/Southland Hydro 320 RoxburghWaipori 3 Otago/Southland Hydro 84 Halfway Bush1. Another 38 MW cogen unit at the location is embedded generation.2. Tararua stages I and II are both embedded generation.3. Partly embedded.5.2.2 Committed new generationCommitted projects are those which are reasonably likely to proceed and where thefollowing are satisfied:all necessary resource and construction consents have been obtainedconstruction has commenced, or a firm date setarrangements for securing the required land are in placesupply and construction contracts have been executed, andfinancing arrangements are in place.Table 5-2 lists committed grid-connected generation projects.Table 5-2: Committed new generationGeneration plant Region Type Operatingcapacityin MWGrid injectionpointWaitara McKee peaker Taranaki Gas-fired OCGT 100 Motunui DeviationKawerau Norske Skog Bay of Plenty Geothermal 25 KawerauNgatamariki Central North Island Geothermal 82 Nga Awa PuruaTe Mihi Central North Island Geothermal 166 Te Mihi5.2.3 Decommissioned generationGeneration forecasts must also account for decommissioned generation. There hasbeen no decommissioning of generation in 2011.5.2.4 New generation forecastsThis year’s APR uses a new set of scenarios, which are an updated version of thescenarios in the Electricity Commission’s 2010 Statement of Opportunities (SOO).What are generation scenarios?Generation scenarios represent possible future generation outcomes, resulting frommaking specific assumptions about future fuel availability and environmental policy.They enable the assessment of transmission needs.<strong>2012</strong> <strong>Annual</strong> <strong>Planning</strong> <strong>Report</strong> © <strong>Transpower</strong> New Zealand Limited <strong>2012</strong>. All rights reserved. 37
Chapter 5: Generation Assumptions<strong>Transpower</strong>’s scenarios are based on the five generation scenarios in the 2010 SOO:Scenario 1: Sustainable PathScenario 2: South Island WindScenario 3: Medium RenewablesScenario 4: CoalScenario 5: High Gas DiscoveryScenario 1 – Sustainable PathNew Zealand embarks on a path of sustainable electricity development and sectoralemissions reduction. Major development of renewable generation takes place in boththe North and South Islands – mainly hydro, geothermal, and wind, but tidal and waveenergy, solar power and biomass cogeneration also feature. Renewable energyproduction exceeds 90% of total generation from 2020 onwards. Baseload thermalgeneration is largely phased out, but new thermal peakers are required. The demandside also has an important role to play in balancing intermittent generation andmeeting peak demand.Scenario 2 – South Island WindThere is extensive wind and hydro generation development, with a focus on theSouth Island and lower North Island. Geothermal resources in the central NorthIsland are developed more slowly than in the other scenarios. Renewable energyproduction exceeds 85% of total generation (on average) from 2020 onwards.Baseload thermal generation is considerably reduced, but there is substantialinvestment in thermal peaking generation and demand-side participation.Scenario 3 – Medium RenewablesA ‘middle-of-the-road’ scenario. There is moderate geothermal and winddevelopment, mainly in the North Island, but little new hydro generation. Baseloadthermal generation is considerably reduced, but new thermal peakers are required.The demand side contributes less than in the other scenarios. The NZAS aluminiumsmelter is progressively phased out between 2022 and 2027 – no new generationbuild is required over the phase-out period.Scenario 4 – CoalThis is the scenario with the lowest carbon prices, which makes investment in newcoal-fired power stations economic. An efficient new coal-fired power station iscommissioned in 2022; a second, burning Southland lignite, in 2025. Most existingbaseload thermal generation remains online. There is also some renewabledevelopment – but some existing hydro schemes have to reduce their output, owingto difficulty in securing water rights. Intermittent generation is supported by thermalpeaking generation and demand-side response.Scenario 5 – High Gas DiscoveryMajor new gas discoveries keep gas prices low over the entire time horizon. Someexisting thermal power stations are replaced by new, more efficient, gas-fired plants.A 200 MW combined cycle gas turbine (CCGT) is installed in Taranaki in 2015, a240 MW CCGT in Northland in 2017, and 400 MW CCGTs in Auckland in 2020 and2025. New gas-fired peakers and gas cogeneration are also constructed. There issome geothermal and wind development but little new hydro generation.Scenario development approachThe Electricity Commission’s scenarios from the 2010 SOO were produced using theGeneration Expansion Model (GEM), which creates a least cost schedule of new38<strong>2012</strong> <strong>Annual</strong> <strong>Planning</strong> <strong>Report</strong> © <strong>Transpower</strong> New Zealand Limited <strong>2012</strong>. All rights reserved.
Chapter 5: Generation Assumptionsgeneration capacity required to meet forecast demand. See the Electricity Authority’swebsite for more information about GEM. 11The new scenarios described in this document are based on the 2010 SOO scenariosand have been produced using a similar version of GEM with many of the same inputassumptions (including capital and maintenance costs, fuel costs and carbon prices).<strong>Transpower</strong> revised some assumptions to bring the scenarios up to date with currentinformation, and to reflect our views about plausible generation and demand-sidedevelopment. Key changes include:updating the lists of existing, committed and potential generationusing the APR <strong>2012</strong> demand forecast (as described in Chapter 4)relaxing the GEM security constraints (the original constraints tended to producescenarios with an implausibly high amount of North Island peaking capacity)setting exchange rates to what we would regard as a plausible long-term averagereviewing the potential contribution of demand-side alternatives to managingsystem peaksreviewing the range of possible Huntly decommissioning schedules.GEM data files and code are available on request.The scenarios produced by GEM were manually edited so as to increase the diversityof outcomes in some regions (which is important for assessing the range of possibletransmission flows).While we attempted to incorporate the most up to date information about futuregeneration projects, new information is always coming to light. For example, at thetime of constructing these scenarios it was understood Meridian Energy were stillpursuing resource consents for their Project Hayes wind project, and it wasconsidered plausible that stage 1 of this project could be built by 2017, as in Scenario2. Since this date Meridian has announced it is withdrawing its application forresource consents such that this now appears very unlikely. While we acknowledgeaspects of the scenarios may change we believe the scenarios are still appropriatefor identifying issues on the grid that may require further investigation.5.3 Use of the generation capacity assumptions5.3.1 Use of generation scenarios in the APRThe generation scenarios are used to assess the effect of generation on the NationalGrid backbone. The generation output is varied to test the transmission capability.Issues that have already been noted are considered again to determine what effect, ifany, the forecast generation will have.5.3.2 Grid Injection Point injection forecast assumptionsGrid Injection Point injection forecasts, (required for the GRR), are based on eachgenerator’s operating capacity. For the purposes of assessing local grid injectionpoint adequacy, we base our assessment on ensuring there is adequate transmissioncapacity to fully dispatch each generator rather than making assumptions about howmuch each generator may actually generate in the future.11http://www.ea.govt.nz/industry/modelling/in-house-models/gem/<strong>2012</strong> <strong>Annual</strong> <strong>Planning</strong> <strong>Report</strong> © <strong>Transpower</strong> New Zealand Limited <strong>2012</strong>. All rights reserved. 39
Chapter 6: Grid Backbone6 Grid backbone6.1 Introduction6.2 Changes since the 2011 <strong>Annual</strong> <strong>Planning</strong> <strong>Report</strong>6.3 North Island grid backbone overview6.4 North Island grid backbone issues and project options6.5 South Island grid backbone overview6.6 South Island grid backbone issues and project options6.7 HVDC link overview6.8 HVDC link issues and project options6.1 IntroductionThis chapter describes the adequacy of New Zealand’s grid backbone to meetforecast demand and anticipated generation development, approved developmentplans, and further development options for the next 15 years.The grid backbone (see Chapter 3 for more information) provides the connectionbetween the regions. The regions are described in Chapters 7 to 19.Prudent transmission network planning considers a range of generation scenarios tomeet the forecast growth in demand (see Chapters 4 and 5 for more information) todetermine the development option and timing for grid upgrades.Transmission needs for the grid backbone are identified after the commissioning ofcommitted projects. The identification of transmission needs is indicative only, basedon a limited number of load and generation dispatch scenarios, along with the impactof future new generation scenarios. They indicate the possible need for a fullerinvestigation within the forecast period, with the timing and scope of the investigationdetermined by new generation developments and demand growth.The resolving projects to meet the transmission needs are an indicative list only,being possible solutions that will be subject to the Investment Test. They will bedeveloped through the grid planning process as investments to meet the GridReliability Standard and/or to provide net market benefit.For the North Island, the existing and possible future grid backbones are described inSection 6.3, with issues and possible grid upgrades described in Section 6.4.For the South Island, the existing and possible future grid backbones are described inSection 6.5, with issues and possible grid upgrades described in Section 6.6.The HVDC link is described in Sections 6.7 and 6.8. The <strong>Annual</strong> <strong>Planning</strong> <strong>Report</strong>(APR) assumed that the High Voltage Direct Current (HVDC) Pole 1 is replaced byPole 3 in <strong>2012</strong>/13.6.2 Changes since the 2011 <strong>Annual</strong> <strong>Planning</strong> <strong>Report</strong>Table 6-1 lists the specific issues and projects that are either new or no longerrelevant within the forecast period when compared to last year's report.Table 6-1: Changes since 2011Issues/projectsNo new issues or projects completed since 2011ChangeNo change40<strong>2012</strong> <strong>Annual</strong> <strong>Planning</strong> <strong>Report</strong> © <strong>Transpower</strong> New Zealand Limited <strong>2012</strong>. All rights reserved.
Chapter 6: Grid Backbone6.3 North Island grid backbone overview6.3.1 Existing North Island transmission configurationThe North Island grid backbone comprises the:220 kV circuits from Wellington to Auckland located along the Central NorthIsland corridor220 kV Wairakei Ring circuits (220 kV circuits between Wairakei andWhakamaru) connecting the major hydro and geothermal generation in theCentral North Island to the transmission network, and220 kV circuits from Bunnythorpe to Huntly through Stratford connecting Taranakigeneration to the transmission network.Power flows either north or south on the inter-island HVDC link, depending on thetime of day or year. During daylight periods and normal rainfall patterns in the SouthIsland, power tends to flow north. In non-peak periods (late evenings and earlymornings) and years of low South Island rainfall, power tends to flow south.Figure 6-1 shows a simplified schematic of the existing North Island grid backbone.<strong>2012</strong> <strong>Annual</strong> <strong>Planning</strong> <strong>Report</strong> © <strong>Transpower</strong> New Zealand Limited <strong>2012</strong>. All rights reserved. 41
Chapter 6: Grid BackboneFigure 6-1: North Island grid backbone schematicOtahuhuTakaniniGlenbrookDruryHuntlyOhinewaiHamiltonTe KowhaiWhakamaruAtiamuriOhakuriTaumarunuiPoihipiTokaanuWairakeiRangipoStratfordTangiwaiBrunswickBunnythorpeLintonKEY220 kV CIRCUIT220 kV SUBSTATION BUSHaywardsGENERATORCAPACITORTEE POINTWilton42<strong>2012</strong> <strong>Annual</strong> <strong>Planning</strong> <strong>Report</strong> © <strong>Transpower</strong> New Zealand Limited <strong>2012</strong>. All rights reserved.
Chapter 6: Grid Backbone6.3.2 Future North Island grid backboneFigure 6-2 and Figure 6-3 provide an indication of the North Island transmissionbackbone development in the medium term (the next 15 years), and longer term(beyond 2027), respectively.We are building a new double-circuit transmission link from Whakamaru to Auckland,and a new double-circuit transmission line between Wairakei and Whakamaru.We have submitted an Investment Proposal to the Commerce Commission to replaceconductor on the existing 220 kV transmission lines between Bunnythorpe andHaywards. A consequence of the replacement will be to increase capacity on theselines.We will also investigate an increase in transmission capacity north of Bunnythorpe,either through the Central North Island to Whakamaru, and/or through the Taranakiregion and a new line to Whakamaru.In the longer term, we may increase the transmission capacity through the NorthIsland by increasing the operating voltage on the new overhead transmission line intoAuckland to 400 kV. Ultimately we may build a new transmission line connectingBunnythorpe, Whakamaru, and Auckland, but this is highly dependent on future loadand generation growth, and the viability of alternatives.We will also be looking to provide substation diversity at some critical transmissionnodes and strengthen resilience to high impact low probability events.Voltage stability in the Upper North Island is an ongoing issue. We will continue tostudy the additional reactive support requirements to maintain Upper North Islandvoltage stability as regional load continues to grow.<strong>2012</strong> <strong>Annual</strong> <strong>Planning</strong> <strong>Report</strong> © <strong>Transpower</strong> New Zealand Limited <strong>2012</strong>. All rights reserved. 43
Chapter 6: Grid BackboneFigure 6-2: Indicative North Island grid backbone schematic to 2027OtahuhuPakurangaGlenbrookTakaniniDruryBrownhill** new double circuit transmission line constructed for400 kV operation but initially operated at 220 kV.OhinewaiHuntlyHamiltonTe KowhaiWhakamaru BAtiamuriOhakuriTaumarunuiTokaanuWhakamaru ATe MihiPoihipiWairakeiRangipoStratfordTangiwaiBrunswickBunnythorpeLintonKEYNEW ASSETSUPGRADED ASSETSHaywardsWilton44<strong>2012</strong> <strong>Annual</strong> <strong>Planning</strong> <strong>Report</strong> © <strong>Transpower</strong> New Zealand Limited <strong>2012</strong>. All rights reserved.
Chapter 6: Grid BackboneFigure 6-3: Longer term indicative North Island grid backbone schematicOtahuhuPakuranga400 kVTakanini220 kVBrownhill**GlenbrookDrury***400 kVAlthough this diagram shows a fewpossible development paths for thefuture North Island grid backbonetransmission system, it is not intendedto indicate a preference. Any optionwill be finalised closer to the date thattransmission reinforcement is needed.OhinewaiHuntlyHamilton400 kV* Another possible option is a newHVDC link into Auckland.** New grid exit point(s) south ofOtahuhu, possibly:- north of Drury, and/or- at Brownhill Road by extending the220 kV bus.Te KowhaiWhakamaru BAtiamuriOhakuriTaumarunuiWhakamaru ATokaanuTe MihiPoihipiWairakeiRangipoStratfordTangiwaiBrunswickBunnythorpeKEYLintonNEW ASSETSUPGRADED ASSETSHaywardsWilton6.4 North Island grid backbone issues and project optionsThe North Island grid backbone comprises five areas indicated in Figure 6-4. Table6-2 summarises issues involving the grid backbone for the next 15 years. For moreinformation about a particular issue, refer to the listed section number in Table 6-2.<strong>2012</strong> <strong>Annual</strong> <strong>Planning</strong> <strong>Report</strong> © <strong>Transpower</strong> New Zealand Limited <strong>2012</strong>. All rights reserved. 45
Chapter 6: Grid BackboneFigure 6-4: North Island grid backbone areaUpper NorthIsland areaWairakei Ring areaTaranaki areaCentral NorthIsland areaWellington areaTable 6-2: Grid backbone transmission issuesSectionnumberIssue6.4.1 Upper North Island voltage stability6.4.2 Transmission capacity into Auckland and Northland6.4.3 Wairakei Ring transmission capacity6.4.4 Taranaki transmission capacity6.4.5 Central North Island transmission capacity6.4.6 Wellington area transmission capacity6.4.1 Upper North Island voltage stabilityOverviewThe Upper North Island covers the geographical area north of Huntly, includingGlenbrook, Takanini, Auckland, and the North Isthmus.The transmission capability to supply the Upper North Island load is limited by voltagestability, which in turn is influenced by:generation in Auckland and at Huntlythe reactive power losses due to the transmission system within the Upper NorthIslandthe reactive power losses due to the transmission system supplying the UpperNorth Island area, andthe reactive power demand due to the composition of the load in the area (inparticular the proportion and type of motor load).There are several generator and circuit contingencies that can cause voltage controlproblems. The worst contingencies include the loss of the:46<strong>2012</strong> <strong>Annual</strong> <strong>Planning</strong> <strong>Report</strong> © <strong>Transpower</strong> New Zealand Limited <strong>2012</strong>. All rights reserved.
Chapter 6: Grid BackboneOtahuhu combined-cycle gas turbine generatorHuntly E3P generator (Unit 5)220 kV Huntly–Otahuhu 2 circuit, or220 kV Drury–Huntly 1 circuit.The Upper North Island load includes a significant proportion of motor load. Thebehaviour of this load during and following faults influences the regional transmissionvoltage performance. During a severe fault, motors will decelerate and some canstall. The motors will then draw large currents which in turn delay the voltagerecovery after a fault. We have identified that voltage recovery is most at risk in latesummer between mid-January and mid-March, when the greatest amount of motorload is connected.Reactive losses on heavily loaded transmission lines are significant, especiallyfollowing a circuit tripping when the loading of parallel circuits increases.The Upper North Island has an enduring need for voltage support because of itsreliance on long transmission lines from the south for much of its power. Investmentis required every two or three years for voltage support in the Upper North Island.Some component of reactive power support in the Auckland region must be dynamicto avoid the need for shunt capacitor switching after a transmission or generatorcontingency. The dynamic reactive support may be provided by generators,synchronous condensers, static var compensators (SVCs) or static synchronouscompensators (STATCOMs).Approved projectsInvestments in previous years include an SVC at Albany, binary switched capacitorsat Kaitaia, ten capacitor banks totalling 600 Mvar at four substations 12 , and ashort-term contract for reactive support from condensers at Otahuhu 13 . Sixcapacitors are, or soon will be, decommissioned 14 based on condition assessment.We have installed power system monitoring equipment to improve our understandingof the Upper North Island power system, specifically load composition and responseto transient events.Projects approved in 2010 by the Electricity Commission under Part F of theElectricity Governance Rules include:a STATCOM at Penrose, scheduled for commissioning in 2013two STATCOMs at Marsden, scheduled for commissioning in 2014a Reactive Power Controller (RPC) to co-ordinate the various dynamic and staticdevices in the Upper North Island. This work is scheduled to begin in <strong>2012</strong>, forcommissioning in 2014/2015, anddemand-side participation.We issued a Request For Proposals for demand-side participation, but the proposalsreceived were all uneconomic. This was an unexpected result, and the demand-sideparticipation framework is being further developed to unlock its potential (see Section2.2 for more information).Other approved projects also have a beneficial effect on voltage stability in the UpperNorth Island by reducing the reactive power losses in the transmission system.121314Capacitors installed in previous years are: Albany 1 x 100 Mvar, Hepburn Road 3 x 50 Mvar,Penrose 4 x 50 Mvar, Otahuhu 2 x 100 Mvar.The condensers belong to Contact Energy, and were once operated as gas turbine generators, Thecontract for the condensers expires in 2013 and will not be renewed, as it is more economic to installother reactive support such as STATCOMs.Capacitors that are, or soon will be, decommissioned are: Albany 2 x 30 Mvar, Henderson1 x 30 Mvar, and Otahuhu 3 x 30 Mvar.<strong>2012</strong> <strong>Annual</strong> <strong>Planning</strong> <strong>Report</strong> © <strong>Transpower</strong> New Zealand Limited <strong>2012</strong>. All rights reserved. 47
Chapter 6: Grid BackboneThe North Auckland and Northland (NAaN) project that increases thetransmission capacity in the Auckland and Northland regions (see Chapter 7,Section 7.8.4 for more information).The North Island Grid Upgrade (NIGU) project that increases the transmissioncapacity into the Auckland and Northland regions (see Section 6.4.2 for moreinformation).Even with these approved projects, voltage stability will be an ongoing issue.Resolving projectsWe have commenced an investigation to determine the amount of additional reactivesupport required to relieve the Upper North Island voltage stability issue beyond thecompletion of the NAaN and NIGU projects.Additional reactive support will be required about every two-three years. This will bea mixture of capacitors and dynamic support such as STATCOMs. The benefits ofadvancing series compensation on the new transmission link between Whakamaruand Pakuranga will be evaluated also.The project cost falls within band E. This is a possible investment project to meet theGrid Reliability Standard and we anticipate seeking approval from the Commission inthe second half of <strong>2012</strong>.6.4.2 Transmission capacity into Auckland and NorthlandOverviewPower transfer to the Upper North Island is dependent on:the generation from Huntly, and the transmission capacity between Huntly andOtahuhu, andgeneration from Whakamaru and south of Whakamaru, and the transmissioncapacity between Whakamaru and Otahuhu.For the existing system, issues that may arise during periods of high demand and lowgeneration in the Auckland area include:an outage of a Huntly–Otahuhu circuit may overload the other Huntly–Otahuhucircuit.an outage of a Huntly–Ohinewai circuit may overload the other Huntly–Ohinewaicircuit.the two 220 kV Otahuhu–Whakamaru circuits may overload during a contingency.an outage of the Hamilton–Whakamaru circuit may overload the two 110 kVArapuni–Hamilton regional circuits.an outage of the Hamilton–Ohinewai circuit may cause low voltage at theHamilton 220 kV bus.Approved projectsThe above issues will be addressed by the North Island Grid Upgrade (NIGU). NIGUincludes a number of projects which will:increase the power transfer capacity into Aucklandreduce the loading on the existing 220 kV Otahuhu–Whakamaru and Huntly–Otahuhu circuits, andreduce the reactive support needed in the Upper North Island (see Section 6.4.1).48<strong>2012</strong> <strong>Annual</strong> <strong>Planning</strong> <strong>Report</strong> © <strong>Transpower</strong> New Zealand Limited <strong>2012</strong>. All rights reserved.
Chapter 6: Grid BackboneAs part of NIGU, we have just completed conversion of the existing 110 kVPakuranga substation to 220 kV, and the existing Otahuhu–Pakuranga line from110 kV to 220 kV operation 15 .The remaining NIGU projects include:a new substation, Whakamaru B (near the existing Whakamaru substation) and atransition station at Brownhilla double-circuit overhead transmission line approximately 190 km fromWhakamaru B substation to a transition station at Brownhill, which will:• initially operate at 220 kV, and• be capable of 400 kV operation in future.two 220 kV underground cables from the transition station at Brownhill toPakuranga substation, rated at 851/890 MVA summer/winter per cable circuit.After the commissioning of the NIGU projects, eight 220 kV circuits from the south willprimarily supply the Upper North Island, with three diverse routes, comprising:two circuits from Huntly to Otahuhu (the western path)four circuits from Whakamaru to Otahuhu (the central path), andtwo circuits from Whakamaru to Pakuranga (the eastern path).There are also two circuits between Huntly and Ohinewai connecting the western andcentral paths.There is a 220 kV connection between Otahuhu and Pakuranga within the Aucklandregion. The North Auckland and Northland (NAaN) project makes use of thetransmission capacity and diversity provided by Pakuranga to increase the capacityand security within the Auckland and Northland regions (see Chapter 7, Section7.8.4).The Auckland region is also connected by two smaller 110 kV regional circuits fromArapuni via Hamilton, Bombay, and Wiri to Otahuhu, though their contribution isminor compared to the 220 kV circuits.Figure 6-5 shows the grid backbone circuits supplying the Upper North Island area.15The Otahuhu–Pakuranga line was constructed at 220 kV, but operated initially at 110 kV.<strong>2012</strong> <strong>Annual</strong> <strong>Planning</strong> <strong>Report</strong> © <strong>Transpower</strong> New Zealand Limited <strong>2012</strong>. All rights reserved. 49
Chapter 6: Grid BackboneFigure 6-5: 220 kV Upper North Island grid backbone circuitsOtahuhuPakurangaGlenbrookTakaniniDruryBrownhill** new double circuittransmission line constructedfor 400 kV operation butinitially operated at 220 kV.OhinewaiCircuitDrury–Huntly 1Drury–Glenbrook 1 and 2Drury–Takanini–Otahuhu 1Huntly–Ohinewai 1 and 2Huntly–Takanini 2Hamilton–Ohinewai 1Hamilton–Whakamaru 1Ohinewai–Otahuhu 1 and 2Ohinewai–Whakamaru 1Otahuhu–Whakamaru 1 and 2Otahuhu–Takanini 2Pakuranga–Whakamaru North 1 and 2HuntlyHamiltonSummer/Winterrating694/764 MVA694/762 MVA1123/1200 MVA694/764 MVA694/764 MVA615/671 MVA615/671 MVA615/671 MVA615/671 MVA293/323 MVA678/724 MVA851/890 MVAWhakamaru BWhakamaru AThe following sections assess the transmission capability of the circuits into theAuckland and Northland regions following the committed NIGU projects. Theassessment is based on representative system conditions, to determine how differentgeneration development scenarios interact with the circuits into Auckland andNorthland.System condition 1 (normal summer’s day demand)This system condition tests a low generation scenario in the Auckland and Northlandregion during a normal demand period:normal summer’s day load in the North Island (approximately 85% of summerpeak load)no thermal generation in Auckland and Northland in servicelow renewable generation in Auckland and Northland, andmedium to high generation elsewhere.The circuits into the Auckland and Northland regions have sufficient capacity during anormal demand period and low generation in the Auckland and Northland regions forthe duration of the forecast period.System condition 2 (peak demand)This system condition tests a high demand period in the Auckland and Northlandregions along with the outage of the biggest generator:island peak load in the North Islandhigh generation in the North Islandthe biggest generator in Auckland is out of service, i.e. Otahuhu C or Huntly E3P,and50<strong>2012</strong> <strong>Annual</strong> <strong>Planning</strong> <strong>Report</strong> © <strong>Transpower</strong> New Zealand Limited <strong>2012</strong>. All rights reserved.
Chapter 6: Grid Backboneall other thermal generation in Auckland, Northland and Huntly 16 is in service.Through this it was identified that the Hamilton bus voltage may fall below 0.9 p.u. forthe loss of the Hamilton–Ohinewai circuit towards the end of the forecast period.Impact of generation scenariosThe five generation scenarios described in Chapter 5 have the following impacts onthe circuits into Auckland and Northland.For system condition 1, all the generation scenarios have minimal impact within theforecast period.For system condition 2, a low Hamilton bus voltage is seen towards the end of theforecast period in generation scenarios 1 (‘sustainable path’) and 2 (‘South Islandwind’). This is because compared to the other generation scenarios, a lower amountof generation is commissioned in the Northland, Auckland and Waikato regions inthese scenarios.OutagesAn outage of one of the circuits into Auckland and an outage of the biggest generatorin Auckland still maintains n-1 security into Auckland and Northland.Resolving projectsWe will investigate options to resolve the Hamilton bus voltage issue closer to thetime it occurs (see Chapter 9, Section 9.9.2 for more information).Beyond 15 years, the double-circuit line from Whakamaru B to Brownhill will beconverted from 220 kV to its construction voltage of 400 kV. This will also require:220/400 kV transformers and associated works at Whakamaru B substation tointerconnect with the existing 220 kV systema switchyard in the vicinity of the transition station at Brownhill with 220/400 kVtransformers and associated works220 kV underground cables to the Otahuhu substation, andextensions to the Otahuhu switchyard(s).6.4.3 Wairakei Ring transmission capacityOverviewThe Wairakei Ring circuits:connect the major hydro and geothermal generation stations in the North Islandto the grid backbone, andsupply the Bay of Plenty region from Atiamuri and Ohakuri.In addition, a new geothermal power station is being built at Te Mihi, and a number ofother generation stations which connect directly or indirectly to the Wairakei Ring arein the planning or consent stage.For the existing system, as this generation develops, an outage of one of theWairakei Ring circuits may begin to constrain north power flows. Specifically, anoutage of the:Whakamaru–Poihipi–Wairakei circuit may overload the Wairakei–Ohakuri–Atiamuri circuits16At Huntly, all generator units are in service except E3P is placed out of service for the study. In the 5generation scenarios, there are new generation connected at Huntly and some units aredecommissioned. It ranges from 630 MW to 1,295 MW in 2027 across the 5 generation scenarios.<strong>2012</strong> <strong>Annual</strong> <strong>Planning</strong> <strong>Report</strong> © <strong>Transpower</strong> New Zealand Limited <strong>2012</strong>. All rights reserved. 51
Chapter 6: Grid BackboneWairakei–Ohakuri–Atiamuri circuits may overload the Whakamaru–Poihipi–Wairakei circuit.Approved projectsTo address the above issues, we are building a 220 kV double-circuit line betweenWairakei and Whakamaru, to replace the existing single-circuit Wairakei–WhakamaruB line. The line is scheduled for commissioning in 2013, and will increase the powerflow capacity through the Wairakei Ring.Figure 6-6 shows the grid backbone circuits in the Wairakei Ring area after thecommissioning of the Wairakei Ring project.Figure 6-6: 220 kV Wairakei Ring circuitsWhakamaru BAtiamuriCircuitOhakuri–Wairakei 1Atiamuri–Ohakuri 1Atiamuri–Whakamaru 1Wairakei–Whakamaru 1Wairakei–Te Mihi–Whakamaru 1OhakuriSummer/Winterrating333/358 MVA333/358 MVA333/358 MVA903/994 MVA903/994 MVAWhakamaru ATe MihiPoihipiWairakeiThe following sections assess the Wairakei Ring transmission capability following thecommitted Wairakei to Whakamaru Replacement Line Project. The assessment isbased on representative system conditions, to determine how different generationdevelopment scenarios interact with the Wairakei Ring.System condition 1 (north flow)This system condition tests power flowing north through the circuits in the WairakeiRing towards the Upper North Island:island peak load in the North Islandhigh geothermal generation in the Wairakei Ring areamedium to high generation (including peakers) elsewhere to balance generationwith demand, andHVDC north transfer between 380 MW and, but not exceeding, 1,400 MW.The following issues were identified:The Atiamuri–Ohakuri and Ohakuri–Wairakei circuits may overload for an outageof either the new Te Mihi–Whakamaru or Wairakei–Whakamaru circuits.High generation at Kawerau and low demand in the Bay of Plenty may causehigher circuit loading on the Atiamuri–Ohakuri circuit especially during high northflow through the Wairakei Ring circuits. In this scenario, the Atiamuri–Ohakuricircuit may also overload for an outage of the Edgecumbe–Kawerau circuit.System condition 2 (south flow)This system condition tests power flowing south through the circuits in the WairakeiRing towards the Wellington region and the South Island via the HVDC link:52<strong>2012</strong> <strong>Annual</strong> <strong>Planning</strong> <strong>Report</strong> © <strong>Transpower</strong> New Zealand Limited <strong>2012</strong>. All rights reserved.
Chapter 6: Grid Backbonelow North Island load (approximately 45% of peak load)high geothermal generation in the Wairakei Ring areamedium to low generation elsewhere, andHVDC south transfer but not exceeding 950 MW.The Wairakei Ring circuits have sufficient capacity for south power flows for theduration of the forecast period. However, there may be transmission constraintssouth of the Wairakei Ring (see Section 6.4.5).System condition 3 (east flow)This system condition tests the ability of the Wairakei Ring circuits to supply the Bayof Plenty region during high demand and medium generation in that region:island peak load in North Islandhigh geothermal generation in the Wairakei Ring areamedium generation in the Bay of Plenty region with the biggest generator in theregion out of service (Kawerau geothermal generator is out of service).medium to high generation (including peakers) elsewhere to balance generationwith demand, andHVDC north transfer but not exceeding 1,400 MW.The following circuits may overload for this system condition.The Ohakuri–Wairakei circuit overloads for an outage of the Atiamuri–Whakamaru, Te Mihi–Whakamaru or Wairakei–Whakamaru circuits.The Atiamuri–Ohakuri circuit overloads for an outage of the Atiamuri–Whakamaru, Te Mihi–Whakamaru or Wairakei–Whakamaru circuits.The Atiamuri–Whakamaru circuit overloads for an outage of the Ohakuri–Wairakei circuit.Impact of generation scenariosThe five generation scenarios described in Chapter 5 have the following impacts onthe circuits in the Wairakei Ring.For system condition 1 (north power flow through the Wairakei Ring circuits to supplythe Upper North Island), only generation scenarios 1 (‘sustainable path’) and 3(‘medium renewables’) have a significant impact. These generation scenarios havethe lowest net increase in the Upper North Island generation compared to the othergeneration scenarios. Therefore, there are higher levels of power flow through theWairakei Ring to supply the Upper North Island load, which may overload theAtiamuri–Ohakuri and Ohakuri–Wairakei circuits.Generation scenario 1 (‘sustainable path’) has the highest net increase in generationin the Bay of Plenty region compared to the other generation scenarios. Highgeneration and low demand in the Bay of Plenty region may cause the Atiamuri–Ohakuri circuit to overload in a contingent event.For system condition 2 (south power flow through the Wairakei Ring circuits), all thegeneration scenarios have minimal impact on the Wairakei Ring circuits within theforecast period.For system condition 3 (east power flow through the Wairakei Ring), generationscenarios 2 (‘South Island wind’) and 5 (‘high gas discovery’) have the highest impacton circuits supplying the Bay of Plenty region. These generation scenarios have thelowest net increase in generation in the Bay of Plenty region. Therefore, there arehigher levels of power flow through the Wairakei Ring to supply the Bay of Plenty,which may overload the Wairakei–Ohakuri–Atiamuri–Whakamaru circuits.<strong>2012</strong> <strong>Annual</strong> <strong>Planning</strong> <strong>Report</strong> © <strong>Transpower</strong> New Zealand Limited <strong>2012</strong>. All rights reserved. 53
Chapter 6: Grid BackboneOutagesThe main connection to the Bay of Plenty region is through the Wairakei–Ohakuri andAtiamuri–Whakamaru circuits. An outage of either of these circuits puts the wholeBay of Plenty region on n security.All outages within the Wairakei Ring may also cause generation constraints, whichrequire replacement generation in other areas such as the Auckland region.Resolving projectsDuring peak demand periods in the Bay of Plenty region, generation must run in theregion to prevent overloading of the Wairakei–Ohakuri–Atiamuri–Whakamaru circuits.Historically, generation in the Bay of Plenty region has been available during peakperiods, and we expect this will continue in the short term. However, in the longerterm, the region’s dependence on local hydro generation may expose it to insufficienttransmission capacity within the Wairakei Ring in dry years.Transmission solutions to prevent overloading of the Wairakei–Ohakuri–Atiamuri–Whakamaru circuits include:variable line ratings, which will alleviate some of the overloads in the short termreconductoring the Wairakei–Ohakuri–Atiamuri circuits, followed by the Atiamuri–Whakamaru circuit, if required, ora new 220 kV Wairakei–Atiamuri circuit (bypassing Ohakuri), followed by asecond Atiamuri–Whakamaru circuit, if required.The Wairakei–Ohakuri–Atiamuri–Whakamaru circuits have already been thermallyupgraded, and a further thermal upgrade is not technically feasible. A secondWairakei–Atiamuri circuit is one option which keeps the Bay of Plenty region on n-1security during outages of the Wairakei–Ohakuri or Atiamuri–Whakamaru circuits. Itis unlikely that security to the Bay of Plenty during outages will by itself providesufficient benefit to justify the second circuit.We will monitor the generation developments in the Wairakei Ring area and the Bayof Plenty region, to determine if a transmission upgrade investigation is required.6.4.4 Taranaki transmission capacityOverviewTaranaki generation is connected to the North Island grid backbone via Stratford withtwo 220 kV circuits north to Huntly and two circuits south to Bunnythorpe.Figure 6-7 shows the grid backbone circuits for the Taranaki area betweenBunnythorpe and Huntly.54<strong>2012</strong> <strong>Annual</strong> <strong>Planning</strong> <strong>Report</strong> © <strong>Transpower</strong> New Zealand Limited <strong>2012</strong>. All rights reserved.
Chapter 6: Grid BackboneFigure 6-7: 220 kV circuits between Bunnythorpe and HuntlyHuntlyTe KowhaiStratfordTaumarunuiCircuitSummer/WinterratingBunnythorpe–Brunswick 1 and 2 695/712 MVA 1Brunswick–Stratford 1 and 3239/292 MVABrunswick–Stratford 2232/287 MVAHuntly–Stratford 1 354/354 MVA 1Stratford–Taumarunui 1 (from Stratford) 455/455 MVA 2Stratford–Taumarunui 1 (from Taumarunui) 343/343 MVA 2Taumarunui–Te Kowhai 1469/492 MVAHuntly–Te Kowhai 1 (from Huntly) 301/301 MVA 2Huntly–Te Kowhai (from Te Kowhai) 469/492 MVA 21. This rating is due to a component other than the conductor.2. The circuit rating depends on the direction of power flow. This is due toprotection settings.BrunswickBunnythorpeApproved projectsThere are no approved grid backbone projects in the Taranaki area.The following sections assess the Taranaki transmission capability following thecommitted upgrades in the North Island. The assessment is based on representativesystem conditions, to determine how different generation development scenariosinteract with the circuits out of Taranaki.System condition 1 (north flow)This system condition tests power flowing north through the circuits between Stratfordand Huntly to Auckland and Northland:island peak load in the North Islandhigh generation in Taranakithe biggest generator in Auckland is out of service i.e. Otahuhu Cmedium to high generation elsewhere to balance generation with demand, andHVDC north transfer varies between 380 MW and 1,400 MW depending ongeneration and demand in the North Island.For this system condition, an outage of one of the Huntly–Stratford circuits may causethe other circuit to overload especially during high Taranaki generation and lowAuckland generation. Also, an outage of one of the Huntly–Stratford circuits maylead to dynamic and transient instability during high Taranaki generation.<strong>2012</strong> <strong>Annual</strong> <strong>Planning</strong> <strong>Report</strong> © <strong>Transpower</strong> New Zealand Limited <strong>2012</strong>. All rights reserved. 55
Chapter 6: Grid BackboneFor high levels of generation in the Taranaki area, power also flows to Bunnythorpebefore flowing north through the Central North Island grid backbone 17 .System condition 2 (south flow)This system condition tests power flowing mainly south through the circuits betweenStratford and Bunnythorpe to the HVDC link:low North Island load (approximately 45% of peak load)high generation in Taranakimedium to low generation elsewhere to balance generation with demand, andHVDC varies between 120 MW north transfer and 950 MW south transferdepending on generation and demand in the North Island.For this system condition, an outage of one of the Brunswick–Stratford circuits mayoverload the remaining two Brunswick–Stratford circuits 18 and the parallel 110 kVcircuits between Stratford and Bunnythorpe.The 110 kV circuits that overload are mainly the Hawera–Stratford andWanganui–Waverly circuits, which have been upgraded to a higher rated conductorbut the ratings are still limited by substation equipment.Impact of generation scenariosThe five generation scenarios described in Chapter 5 have the following impacts onthe circuits out of Taranaki.For system condition 1 (north power flow from Stratford to Huntly), generationscenario 3 (‘medium renewables’) has the highest impact at the end of the forecastperiod, as it has the lowest net increase in generation in the Auckland and Northlandarea compared to the other generation scenarios. The significant overloads on theHuntly–Stratford circuits are dependent on:Auckland and Northland loadAuckland and Northland generation, andTaranaki generation.For system condition 2 (south power flow from Stratford to Bunnythorpe), all thegeneration scenarios have minimal impact within the forecast period on the Taranakitransmission capacity except for generation scenario 5 (‘high gas discovery’).Generation scenarios 1 to 4 include the decommissioning of the Taranaki combinedcyclegas turbine while generation scenario 5 does not. This scenario has a netincrease of up to 460 MW of new gas-fired peakers and combined-cycle gas turbines.OutagesAn outage of any of the circuits out of Taranaki i.e. between Stratford and Huntly orbetween Stratford and Bunnythorpe, may cause generation constraints, which requirereplacement generation in other areas.Resolving projectsTo prevent overloads on the circuits out of Taranaki during HVDC north and southflow, the Taranaki generation can be constrained. Alternatively, transmissionsolutions could include:1718Central North Island 220 kV circuits such as Tokaanu–Whakamaru may overload during highTaranaki generation and HVDC north flow. See Section 6.4.5 for more information about this issue.Central North Island 220 kV circuits such as Bunnythorpe–Tokaanu and Bunnythorpe–Tangiwai mayoverload before the Brunswick–Stratford circuits overload for high HVDC south flow. See Section6.4.5 for more information about this issue.56<strong>2012</strong> <strong>Annual</strong> <strong>Planning</strong> <strong>Report</strong> © <strong>Transpower</strong> New Zealand Limited <strong>2012</strong>. All rights reserved.
Chapter 6: Grid Backbonethermally upgrade and/or reconductor the Brunswick–Stratford circuitsreconductor the Huntly–Stratford circuits 19 , ora new transmission line between Taumarunui and Whakamaru.To resolve the overloads on the 110 kV circuits, Wanganui and Waverly substationequipment is committed for upgrade to allow a higher rating on the 110 kV Hawera–Stratford and Wanganui–Waverly circuits. Upgrade of the Hawera substationequipment is still being investigated and is part of a separate project.Also, re-tuning of the generator excitation systems and/or installation of power systemstabilisers can enhance transient and dynamic stability to transfer power out ofTaranaki between Stratford and Huntly.6.4.5 Central North Island transmission capacityOverviewThe circuits between Bunnythorpe and Whakamaru/Wairakei comprise the:two Bunnythorpe–Tokaanu–Whakamaru circuits, andBunnythorpe–Tangiwai–Rangipo–Wairakei circuits.Figure 6-8 shows the grid backbone circuits in the Central North Island area.Figure 6-8: 220 kV Central North Island circuitsWhakamaru ATokaanuWairakeiRangipoTangiwaiCircuitBunnythorpe–Tokaanu 1 and 2Bunnythorpe–Tangiwai 1Rangipo–Tangiwai 1Rangipo–WairakeiTokaanu–Whakamaru 1 and 2Summer/Winterrating307/335 MVA239/291 MVA239/291 MVA364/396 MVA307/335 MVABunnythorpeApproved projectsThere are no grid backbone approved projects in the Central North Island area.The following sections assess the transmission capability of the Central North Islandgrid backbone following the committed upgrades in the North Island. Theassessment is based on representative system conditions, to determine how differentgeneration development scenarios interact with the circuits in the Central NorthIsland.19The Huntly–Stratford circuits have a maximum operating temperature of 120°C, which is themaximum practical operating temperature. Therefore, a thermal upgrade is not possible.<strong>2012</strong> <strong>Annual</strong> <strong>Planning</strong> <strong>Report</strong> © <strong>Transpower</strong> New Zealand Limited <strong>2012</strong>. All rights reserved. 57
Chapter 6: Grid BackboneSystem condition 1 (north flow)This system condition tests power flowing north through the circuits in the CentralNorth Island towards Whakamaru or Wairakei:island peak load in the North Islandhigh renewable generation including wind, wave, tidal, and solarmedium to high generation (including peakers) elsewhere to balance generationwith demand, andHVDC north transfer varies between 50 MW and 1,400 MW depending on NorthIsland generation and demand.For high generation in the Taranaki area, some of the Taranaki generation flows intoBunnythorpe. This can cause an overload on the Central North Island circuits.The following circuits may overload for this system condition.A Tokaanu–Whakamaru circuit may overload for an outage of the otherTokaanu–Whakamaru circuit, any of the Bunnythorpe–Tangiwai–Rangipo–Wairakei circuits, or one of the circuits between Stratford and Huntly.A Bunnythorpe–Tokaanu circuit may overload for an outage of the otherBunnythorpe–Tokaanu circuit, any section of the Bunnythorpe–Tangiwai–Rangipo–Wairakei circuit, or one of the circuits between Stratford and Huntly.The Bunnythorpe–Tangiwai–Rangipo–Wairakei circuits may overload for anoutage of one of the Bunnythorpe–Tokaanu–Whakamaru circuits or one of thecircuits between Stratford and Huntly.There is a regional 110 kV single circuit between Bunnythorpe and Arapuni (viaMataroa, Ohakune, and Ongarue) which may also overload and constrain northtransfer.System condition 2 (south flow)This system condition tests power flowing south through the circuits in the CentralNorth Island towards Bunnythorpe:low North Island load (approximately 45% of peak load)low renewable generation including wind, wave, tidal, and solarhigh geothermal generation in the Wairakei Ring arealow to medium generation elsewhere to balance generation with demand, andHVDC south transfer varies between 580 MW and 950 MW depending on NorthIsland generation and demand.The following circuits may overload for this system condition.A Bunnythorpe–Tokaanu circuit may overload for an outage of the otherBunnythorpe–Tokaanu circuit or any section of the Bunnythorpe–Tangiwai–Rangipo–Wairakei circuit.A Tokaanu–Whakamaru circuit may overload for an outage of the otherTokaanu–Whakamaru circuit, any section of the Bunnythorpe–Tangiwai–Rangipo–Wairakei circuits, or one of the circuits between Stratford and Huntly.The Bunnythorpe–Tangiwai–Rangipo–Wairakei circuit may overload for outagesof a Bunnythorpe–Tokaanu–Whakamaru circuit or one of the circuits betweenStratford and Huntly.There is also low voltage at Bunnythorpe, Tangiwai, and Tokaanu for high HVDCsouth transfer and low generation in the Lower North Island.The regional 110 kV circuit between Bunnythorpe and Arapuni (via Mataroa,Ohakune, and Ongarue) may also overload and constrain HVDC south transfer.58<strong>2012</strong> <strong>Annual</strong> <strong>Planning</strong> <strong>Report</strong> © <strong>Transpower</strong> New Zealand Limited <strong>2012</strong>. All rights reserved.
Chapter 6: Grid BackboneImpact of generation scenariosThe five generation scenarios described in Chapter 5 have the following impacts onthe Central North Island circuits.For system condition 1 (north power flow from Bunnythorpe to Whakamaru/Wairakei),generation scenario 3 (‘medium renewables’) has the highest impact on the circuits inthe Central North Island, as it has the lowest net increase in generation in theAuckland and Northland area compared to the other generation scenarios.For system condition 2 (south power flow from Whakamaru/Wairakei to Bunnythorpe),generation scenarios 4 (‘coal’) and 5 (‘high gas discovery’) have the highest impacton the circuits in the Central North Island, as they have the lowest net increase ingeneration in the Wellington area. With a lower amount of new generation in theWellington area, more power is required to flow through the circuits betweenWhakamaru/Wairakei and Bunnythorpe to supply the demand in the Wellington areaand the South Island via the HVDC link. Low voltage at Bunnythorpe, Tangiwai, andTokaanu only occurs for generation scenario 4, which has the lowest net increase ingeneration in the Lower North Island.OutagesAn outage of any of the Central North Island circuits may cause generationconstraints, which require replacement generation in other areas.Resolving projectsFor the circuits between Whakamaru and Bunnythorpe, the requirement to upgrade islargely dictated by generation development in the area. The upgrade options can beseparated into two tranches depending on the amount of new generation.In tranche 1, the range of options includes:limit the power flow on 110 kV regional network between Mataroa and Ohakunethrough a Special Protection Scheme (SPS), series reactor, phase shiftingtransformer or a permanent system split (putting four regional grid exit points on nsecurity)reconductor the Tokaanu–Whakamaru circuits, andthermally upgrade or reconductor the Bunnythorpe–Tangiwai–Rangipo circuit.Tranche 1 options may enable up to 500 MW of new generation connected at or nearto Bunnythorpe. The project cost falls within band F.In tranche 2, the range of options will enable more generation beyond the options fortranche 1. The range of options includes:reconductor the Bunnythorpe–Tokaanu circuitsprovide new transmission capacity between Bunnythorpe and Whakamaru:• reuse the existing 220 kV single circuit line route between Bunnythorpe andWairakei for a replacement double-circuit• a new double-circuit 220 kV or 400 kV circuit between Bunnythorpe andWhakamaru, or• HVDC light between Bunnythorpe and Whakamaru.a new line in the Taranaki area, from Taumarunui to Whakamaru (to divert powerflow from the Central North Island grid backbone), andLower North Island-wide System Protection Scheme to enable new generation.The details and range of options in tranche 2 are still being investigated.<strong>2012</strong> <strong>Annual</strong> <strong>Planning</strong> <strong>Report</strong> © <strong>Transpower</strong> New Zealand Limited <strong>2012</strong>. All rights reserved. 59
Chapter 6: Grid BackboneWe will monitor generation developments in the Central North Island area, todetermine the level of transmission upgrades required including the need for reactivedevices to alleviate the low voltage issues.6.4.6 Wellington area transmission capacityOverviewThe 220 kV circuits in the Wellington area between Bunnythorpe and Wellingtoncomprise:two circuits connecting directly between Haywards and Bunnythorpeone Haywards–Linton–Bunnythorpe circuit, with Tararua Wind Central connectedoff the Linton–Bunnythorpe section of the circuit, andone Wilton–Linton–Bunnythorpe circuit.Figure 6-9 shows the grid backbone circuits in the Wellington area.Figure 6-9: 220 kV circuits in the Wellington areaBunnythorpeLintonHaywardsCircuitBunnythorpe–Haywards 1 and 2Bunnythorpe–Linton–Wilton 1Bunnythorpe–Tararua Wind Central–Linton 1Haywards–Linton 1Haywards–Wilton 1Summer/Winterrating307/335 MVA694/764 MVA694/764 MVA694/762 MVA694/739 MVAWiltonApproved projectsThere are no approved grid backbone projects for the Wellington area.We submitted an Investment Proposal to the Commerce Commission in December2011 to reconductor the two direct Bunnythorpe–Haywards circuits because ofcondition assessment. The replacement conductor will also provide a small increasein the circuits’ rating (from 307/335 MVA to 355/370 MVA). A decision from theCommerce Commission is expected in the second quarter of <strong>2012</strong>.The project cost falls within band F and construction is expected to be completed bythe fourth quarter of 2018.The following sections assess the Wellington area’s transmission capability followingthe committed upgrades in the North Island. The assessment is based onrepresentative system conditions, to determine how different generation developmentscenarios interact with the circuits in the Wellington area.System condition 1 (HVDC north flow)This system condition tests power flowing north through the circuits in the Wellingtonarea towards Bunnythorpe:island peak load in the North Islandhigh renewable generation including wind, wave, tidal, and solarmedium to high generation (including peakers) elsewhere to balance generationwith demand, and60<strong>2012</strong> <strong>Annual</strong> <strong>Planning</strong> <strong>Report</strong> © <strong>Transpower</strong> New Zealand Limited <strong>2012</strong>. All rights reserved.
Chapter 6: Grid BackboneHVDC north transfer varies between 50 MW and 1,400 MW depending on NorthIsland generation and demand.The following circuits may overload for this system condition.The two Bunnythorpe–Haywards circuits may overload for outages of theHaywards–Linton–Bunnythorpe circuit (with Tararua Wind Central tee connected)or the Wilton–Linton–Bunnythorpe circuit.The Linton–Bunnythorpe circuit (with Tararua Wind Central tee connected) mayoverload for outages of the Haywards–Wilton circuit or the Wilton–Linton–Bunnythorpe circuit.The Haywards–Linton circuit may overload for an outage of the Linton–Bunnythorpe circuit (with Tararua Wind Central tee connected) under certaingeneration scenarios.The Wilton–Linton–Bunnythorpe circuit may overload for an outage of theHaywards–Wilton circuit under certain generation scenarios.System condition 2 (HVDC south flow)This system condition tests power flowing south through the circuits in the Wellingtonarea towards Haywards and Wilton:low North Island load (approximately 45% of peak load)low renewable generation including wind, wave, tidal, and solarhigh geothermal generation in the Wairakei Ring areamedium to low generation elsewhere, andHVDC south varies between 580 MW and 950 MW depending on North Islandgeneration and demand.For this system condition, the two Bunnythorpe–Haywards circuits may overload foroutages of the Haywards–Linton–Bunnythorpe circuit (with Tararua Wind Central teeconnected) or the Wilton–Linton–Bunnythorpe circuit.Some regional 110 kV circuits may also overload and constrain HVDC south transfer.These are the circuit between Bunnythorpe and Arapuni (via Mataroa, Ohakune, andOngarue) and the two Bunnythorpe–Woodville circuits.There are also voltage issues for the loss of a 220 kV circuit between Bunnythorpeand Wellington during high HVDC south transfer and low generation in the Wellingtonarea.Impact of generation scenariosThe five generation scenarios described in Chapter 5 have the following impacts onthe circuits in the Wellington area.For system condition 1 (north power flow from Wellington to Bunnythorpe), generationscenario 3 (‘medium renewables’) has the highest impact on the circuits in theWellington area, as it has the lowest net increase in generation in the Auckland andNorthland area compared to the other generation scenarios. Generation scenarios 1(‘sustainable path’) and 2 (‘South Island wind’) have high wind generation at theLinton bus and may cause the Haywards–Linton circuit to overload for outages of theLinton–Bunnythorpe circuit, Haywards–Wilton circuit or the Wilton–Linton–Bunnythorpe circuit. The Wilton–Linton–Bunnythorpe circuits may also overload dueto high generation at the Linton bus for an outage of the Haywards–Wilton circuit.For system condition 2 (south power flow from Bunnythorpe to Wellington),generation scenarios 4 (‘coal’) and 5 (‘high gas discovery’) have the highest impacton the circuits in the Wellington area, as they have the lowest net increase ingeneration in the Wellington area. With a lower amount of new generation inWellington, more power is required to flow through the circuits between Bunnythorpe<strong>2012</strong> <strong>Annual</strong> <strong>Planning</strong> <strong>Report</strong> © <strong>Transpower</strong> New Zealand Limited <strong>2012</strong>. All rights reserved. 61
Chapter 6: Grid Backboneand Wellington to supply Wellington area demand and the South Island via the HVDClink. Low voltages at Bunnythorpe and Linton occur only in generation scenario 4,which has the lowest net increase in generation in the Wellington area.OutagesAn outage of any of the 220 kV circuits in the Wellington area during HVDC north orsouth flow may cause generation constraints, which require replacement generationin other areas.Resolving projectsFor the two direct circuits between Bunnythorpe and Haywards, we believe that it isuneconomic to increase their rating to increase the transmission capacity (other thanthe small increase in rating following reconductoring – refer to Approved projectsabove). However, a higher amount of power transfer between Bunnythorpe andHaywards is possible with a Special Protection Scheme (SPS). The SPS willautomatically reduce the power flowing on the HVDC link (after Pole 3 iscommissioned) if the two direct Bunnythorpe–Haywards circuits overload, subject toother constraints within the power system. We will monitor the level of constraintcaused by these circuits to determine when an investigation to implement an SPS isrequired.The overloads on the two circuits between Bunnythorpe and Linton are driven by theamount of generation connected at Linton. We will monitor the amount of generationbeing connected at Linton to determine if a transmission upgrade investigation isrequired.For the two regional 110 kV Bunnythorpe–Woodville circuits, we have a committedproject to install an SPS to increase south flow transmission capacity. We willmonitor new generation connections to determine if an investigation to re-conductorthe circuits to a higher rating is required.There is significant potential wind generation in the Wairarapa. One option toconnect this generation is to build a new 220 kV transmission line from the Wairarapato Bunnythorpe or Linton.62<strong>2012</strong> <strong>Annual</strong> <strong>Planning</strong> <strong>Report</strong> © <strong>Transpower</strong> New Zealand Limited <strong>2012</strong>. All rights reserved.
Chapter 6: Grid Backbone6.5 South Island grid backbone overview6.5.1 Existing South Island transmission configurationThe South Island grid backbone comprises 220 kV circuits with:three circuits from Islington to Kikiwafour circuits from Twizel and Livingstone in the Waitaki Valley area to Islingtoncircuits within the Waitaki Valley, between Twizel and Livingstone, which connectsix large hydro power stations and the HVDC linkthree circuits from Roxburgh to Twizel and Livingstone in the Waitaki Valley area,andfour circuits from Roxburgh to Invercargill/North Makarewa (two via Three MileHill) and nine circuits within the Southland area.Power flows either north or south on the inter-island HVDC link, depending on thetime of day or year. During daylight periods, power tends to flow north to meet peakdemand. However, during light load periods, power can flow south to conserve thelevel of South Island hydro storage, especially during periods of low hydro inflow.Figure 6-10 shows a simplified schematic of the existing South Island grid backbone.<strong>2012</strong> <strong>Annual</strong> <strong>Planning</strong> <strong>Report</strong> © <strong>Transpower</strong> New Zealand Limited <strong>2012</strong>. All rights reserved. 63
Chapter 6: Grid BackboneFigure 6-10: South Island grid backbone schematicKikiwaSTC-2CulverdenWaiparaBromleyIslingtonSVC-3SVC-9220 kVAshburtonTekapo BTimaruTwizelOhau AOhau BOhau CBenmoreWaitakiAviemoreLivingstoneCromwellClydeNasebyManapouriRoxburghThree Mile HillKEY220 kV CIRCUITNorth MakarewaInvercargillSVC220 kV SUBSTATION BUSGENERATORSTATIC VAR COMPENSATORSTCSTATIC SYNCHRONOUS COMPENSATORTiwaiCAPACITOR64<strong>2012</strong> <strong>Annual</strong> <strong>Planning</strong> <strong>Report</strong> © <strong>Transpower</strong> New Zealand Limited <strong>2012</strong>. All rights reserved.
Chapter 6: Grid Backbone6.5.2 Future South Island grid backboneFigure 6-10 and Figure 6-11 provide an indication of the South Island transmissionbackbone development in the medium term (the next 15 years), and longer term(beyond 2027), respectively.We will install an additional bus coupler circuit breaker at Islington, to improve voltagestability for the Upper South Island following a bus fault and to increase security.Further investments in the Upper South Island to maintain voltage stability to meetload growth will also be required. Presently we are consulting on two options:increasing the dynamic reactive support at and around the Islington 220 kV bus,andbussing all four 220 kV circuits into the Upper South Island at Geraldine.In the longer term, further upgrades for the Upper South Island may be required forvoltage stability or thermal capacity reasons. Options include:extending the 220 kV grid from Kikiwa to Inangahua in the West Coast region 20 ,to improve voltage stabilitybussing all three circuits north of Islington with an HVDC tap-off near Waipara,anda second Islington–Twizel circuit providing a fifth circuit into the Upper SouthIsland.The Upper South Island voltage stability is an ongoing issue. We will continue tostudy the additional reactive support requirements to maintain Upper South Islandvoltage stability as regional load continues to grow.Within the Waitaki Valley area, there is an approved project to increase thetransmission capacity of the Aviemore–Waitaki–Livingstone circuits. There is also anapproved project to increase the capacity of the Aviemore–Benmore circuits, whichwill be reviewed in 2013 to optimise its implementation date.Between Roxburgh and the Waitaki Valley, there is an approved project to increasethe transmission capacity of the Roxburgh–Clyde circuits. There is also an approvedproject to increase the capacity of the other circuits, which will be reviewed in 2013 tooptimise an implementation date.For the area below Roxburgh, the 110 kV regional network limits the capacity of the220 kV grid backbone. There is an approved project to remove this regional gridconstraint. There is also an approved project to further increase the grid backbonecapacity by installing a series capacitor on the North Makarewa–Three Mile Hillcircuit, which will be reviewed in 2013 to optimise an implementation date.We will also look to provide substation diversity at critical transmission nodes tostrengthen resilience for high impact low probability events.20There is a 220 kV double-circuit transmission line between Inangahua and Kikiwa, which at presenthas a circuit on one side only and is operated at 110 kV.<strong>2012</strong> <strong>Annual</strong> <strong>Planning</strong> <strong>Report</strong> © <strong>Transpower</strong> New Zealand Limited <strong>2012</strong>. All rights reserved. 65
Chapter 6: Grid BackboneFigure 6-11: Indicative South Island grid backbone schematic to 2027KikiwaSTC-2* Although this diagram shows newdynamic and static reactive supportsinstalled at Islington, and a newswitching station at Geraldine, this isindicative only as options are stillbeing investigated.*IslingtonSVCSVC-3SVC-9CulverdenWaiparaBromley*AshburtonTekapo BTwizelTimaru*GeraldineOhau AOhau BOhau CBenmoreAviemoreWaitakiCromwellNasebyLivingstoneClydeManapouriRoxburghKEYNEW ASSETSUPGRADED ASSETS220 kVThree Mile HillGoreNorth MakarewaInvercargillTiwai66<strong>2012</strong> <strong>Annual</strong> <strong>Planning</strong> <strong>Report</strong> © <strong>Transpower</strong> New Zealand Limited <strong>2012</strong>. All rights reserved.
Chapter 6: Grid BackboneFigure 6-12: Longer term indicative South Island grid backbone schematicHaywardsKikiwaSTC-2InangahuaWaiparaCulverden*350 kVIslington* Although this diagram shows a few development pathsfor the future South Island grid backbone transmissionsystem, it is not intended to indicate a preference. Optionwill be finalised closer to the date that transmissionreinforcement is needed.STCSVCSVC-3SVC-9**BromleySVCAshburtonTekapo B*GeraldineOhau ATwizelTimaruOhau BOhau CBenmoreAviemoreWaitakiCromwellNasebyLivingstoneClydeManapouriRoxburghKEYNEW ASSETSUPGRADED ASSETSThree Mile HillGoreNorth MakarewaInvercargillTiwai6.6 South Island grid backbone issues and project optionsThe South Island grid backbone comprises four areas indicated in Figure 6-13. Table6-3 summarises issues involving the South Island grid backbone for the next 15years. For more information about a particular issue, refer to the listed sectionnumber.<strong>2012</strong> <strong>Annual</strong> <strong>Planning</strong> <strong>Report</strong> © <strong>Transpower</strong> New Zealand Limited <strong>2012</strong>. All rights reserved. 67
Chapter 6: Grid BackboneTable 6-3: South Island grid backbone transmission issuesSectionnumberIssue6.6.1 Upper South Island voltage stability6.6.2 Upper South Island transmission capacity6.6.3 Transmission capacity north of Roxburgh and within the Waitaki Valley6.6.4 Transmission capacity south of RoxburghFigure 6-13: South Island grid backbone areaUpper SouthIsland areaWaitaki Valley areaNorth of Roxburgh areaSouth of Roxburgh areaSouthland area6.6.1 Upper South Island voltage stabilityOverviewMost of the Upper South Island load is supplied through four 220 kV circuits from theWaitaki Valley. The Upper South Island area has relatively little generation comparedwith load. The generation is connected to the regional grid or embedded within thedistribution networks.The transmission capacity to supply the Upper South Island is limited by voltagestability. Voltage stability within this area is influenced by:the reactive power losses due to the transmission system within the areathe reactive power demand due to load composition in the area (in particular theproportion and type of motor load), andgeneration in the areaReactive support for the Upper South Island is provided by:synchronous condensers and SVCs at Islingtona STATCOM at Kikiwa, andcapacitor banks at Islington on the grid backbone and, within the regional gridscapacitor banks at Islington, Bromley, Southbrook, Blenheim, Stoke, Greymouth,and Hokitika.68<strong>2012</strong> <strong>Annual</strong> <strong>Planning</strong> <strong>Report</strong> © <strong>Transpower</strong> New Zealand Limited <strong>2012</strong>. All rights reserved.
Chapter 6: Grid BackboneThe contingencies which may cause a voltage stability issue are:from winter 2016, an outage of an Islington bus section which disconnects anumber of transmission elements 21 , increasing the reactive power that will beabsorbed by the remaining in-service circuits and transformersfrom winter 2017, an outage of the Islington–Tekapo B circuit, andfrom 2017, an outage of an Ashburton bus section.Approved projectsWe regularly invest in grid upgrades to raise the voltage stability limit, to match loadgrowth. Recent investments include a second SVC at Islington and a STATCOM atKikiwa. Most recently, we installed a Reactive Power Controller (RPC) at Islington toco-ordinate various dynamic and static devices in the Upper South Island.We intend to install an additional bus coupler circuit breaker at Islington to addressUpper South Island voltage stability up to 2017.Voltage stability will be an ongoing issue which will require regular investments tomatch load growth.Impact of generation scenariosThe five generation scenarios described in Chapter 5 have the following impacts onthe Upper South Island backbone grid.All generation scenarios have new generation or demand side reduction within theUpper South Island. This will improve voltage stability, which may defer or replacethe need for transmission investment. Generation scenarios 1 (‘sustainable path’), 2(‘South Island wind’) and 3 (‘medium renewables’) have the highest amount of newgeneration. Generation scenarios 4 (‘coal’) and 5 (‘high gas discovery’) have theleast new generation over the next five years, and would be insufficient to defertransmission investment.OutagesAn outage of a circuit or other transmission element for maintenance will increase thereactive power losses of the transmission system. This requires maintenance to bescheduled for a low load period, load reduction, generation to be constrained on,and/or additional investment in reactive support.Resolving projectsWe will install a sixth bus coupler at Islington to create an additional bus zone tominimise the equipment tripping following a bus fault, and so improve voltagestability.We have also commenced an investigation to determine the amount of additionalreactive support required in the next tranche of investments to relieve the UpperSouth Island voltage stability issue. Transmission options include:a combination of static and dynamic reactive support around Islington andBromley, and/orsectionalising the 220 kV circuits from the Waitaki Valley to Islington by bussingthem at a new switching station near Geraldine; this also requires a short sectionof new transmission line to bring all circuits to Geraldine.In the longer-term, transmission options include:about 350 Mvar of additional reactive support may be required by 2027, and21The critical Islington bus section outage disconnects: Islington–Tekapo B, Islington–Waipara–Culverden–Kikiwa 2, a capacitor bank, and T7 (220/66 kV transformer).<strong>2012</strong> <strong>Annual</strong> <strong>Planning</strong> <strong>Report</strong> © <strong>Transpower</strong> New Zealand Limited <strong>2012</strong>. All rights reserved. 69
Chapter 6: Grid Backbonereinforcing the Upper South Island transmission capacity (see Section 6.6.2),which also addresses the voltage stability issue.6.6.2 Upper South Island transmission capacityOverviewPower transfer to the Upper South Island is through four 220 kV circuits from theWaitaki Valley.The Islington 220 kV bus is a single major node, supplying a large proportion of theload in Christchurch (along with Bromley), Nelson-Marlborough and the West Coast.There is a risk that high impact low probability single events at Islington can cause asignificant or total loss of supply, either with all equipment in service or duringmaintenance outages.Approved projectsThere are no approved grid backbone projects in the Upper South Island area fortransmission capacity.System condition (north flow)The Upper South Island has relatively little generation compared with the load, evenat minimum load. Therefore, power always flows from the Waitaki Valley northwards.The n-1 transmission (thermal) limit for the Upper South Island area is forecast tobind towards the end or just beyond the forecast period (2027).Impact of generation scenariosThe five generation scenarios described in chapter 5 all have new generation north ofIslington, or demand response to reduce peak demand. More generation or demandresponse defers the onset of the n-1 transmission limit.Outages“Outage windows” are required so a circuit can be taken out of service formaintenance while managing the grid to provide n-1 security. The number andduration of outage windows available for maintenance depends on the load, loadmanagement, and generation within the area. It is possible that insufficient outagewindows will be available within the forecast period to enable the requiredmaintenance, or for upgrading circuits.Resolving projectsOptions to address the n-1 transmission capacity towards the end of the forecastperiod include:an HVDC tap-off from the existing HVDC line north of Christchurcha new transmission line to Ashburton or Islington.These resolving projects may need to be brought forward a few years to ensure thereare enough opportunities to take equipment out of service for maintenance.We will monitor the loading on the Upper South Island circuits to determine when atransmission upgrade investigation is required.70<strong>2012</strong> <strong>Annual</strong> <strong>Planning</strong> <strong>Report</strong> © <strong>Transpower</strong> New Zealand Limited <strong>2012</strong>. All rights reserved.
Chapter 6: Grid Backbone6.6.3 Transmission capacity north of Roxburgh and within the Waitaki ValleyOverviewTwo sub-areas make up the grid backbone in the area: within the Waitaki Valley, andfrom Roxburgh to the Waitaki Valley.The grid backbone within the Waitaki Valley connects:the Upper South Island area, at Twizel and Livingstonethe Waitaki Valley hydro generators 22 at six substationsthe inter-island HVDC link at Benmore, andthe transmission system to Roxburgh, from Twizel and Livingstone.The direction and amount of power flowing through the circuits within the WaitakiValley depends on the load in the Upper South Island, the generation in the area, theamount and direction of HVDC transfer, and the net Otago-Southland load.The grid backbone from Roxburgh to the Waitaki Valley provides throughtransmissionto the Otago/Southland area. The direction of the power flow may benorth or south, depending on the generation and load in the Otago-Southland area.The power flow within the sub-area is also significantly influenced by the generationat Clyde and, to a lesser extent, by the load off-take at Cromwell and Naseby.Approved projectsThe Clutha–Upper Waitaki Lines Project (CUWLP) is an approved suite of projects 23to increase transmission capacity for:low generation in the Otago-Southland area, which causes high ‘south’ powerflows from within the Waitaki Valley to Roxburgh, andhigh generation in the Otago-Southland area, which causes high ‘north’ powerflows from Roxburgh to the Waitaki Valley.The first tranche of projects is to increase the transmission capacity to address highsouth power flows. We will:duplex the Clyde–Roxburgh 1 and 2 circuits in 2013, andduplex the Aviemore–Waitaki–Livingstone circuits in 2014.Duplexing these circuits approximately doubles the south transmission thermalcapacity 24 to export power from the Waitaki Valley to Roxburgh, (from 250-280 MW to560-590 MW) 25 . There is no significant change in the north transmission thermalcapacity.The second tranche of projects is to:duplex the Roxburgh–Naseby–Livingstone circuitsduplex the Aviemore–Benmore 1 and 2 circuits, andthermally upgrade Cromwell–Twizel 1 and 2 circuits.22232425The six hydro power stations that connect to the grid backbone in the Waitaki Valley are: Ohau A,Ohau B, Ohau C, Benmore, Aviemore, Waitaki.The Clutha–Upper Waitaki Lines Project (CUWLP) was previously referred to as the Lower SouthIsland Renewables Grid Upgrade Project, approved by the Electricity Commission in August 2010.The increase in south transmission capacity occurs only after all the referenced circuits areduplexed; there is no significant increase in south transmission capacity with only some of thecircuits duplexed.The amount of power that can be exported from the Waitaki Valley to Roxburgh varies withgeneration, particularly generation at Clyde power station, and varies to a lesser extent with load.The limits are measured across the Livingstone–Naseby and Cromwell–Twizel 1 and 2 circuits in theRoxburgh–Waitaki Valley area.<strong>2012</strong> <strong>Annual</strong> <strong>Planning</strong> <strong>Report</strong> © <strong>Transpower</strong> New Zealand Limited <strong>2012</strong>. All rights reserved. 71
Chapter 6: Grid BackboneThe primary benefit of the second tranche of projects is to increase the northtransmission thermal capacity. When there is high generation in the Otago-Southlandarea, and at Roxburgh and Clyde, power is exported to the Upper South Island areaand/or the HVDC link at Benmore. The increase in transmission thermal capacity isprogressive, with increased transmission capacity available at the completion of eachupgrade. The north transmission thermal capacity increases from its existing level of200-590 MW to 790-1,260 MW 26 once all the upgrades are completed.The justification for increasing the north transmission thermal capacity is twofold, to:enable full output from existing generators at Clyde, Roxburgh and theOtago/Southland area, andenable new generation projects in the Otago/Southland area. We will review thesecond tranche of projects in 2013, to optimise the timing of the upgrades.The second tranche also significantly increases the south transmission thermalcapacity, to 560–590 MW. However, it is expected that most of this southtransmission capacity will not be required.Figure 6-14 shows the circuits in the Waitaki Valley after the upgrades.Figure 6-14: 220 kV circuits between Roxburgh and Twizel after CUWLP upgradeTwizelOhau BOhau CAviemoreCromwellClydeBenmoreWaitakiNaseby LivingstoneCircuitSummer/WinterratingAviemore–Benmore 1 and 2 609/671 MVA 1Aviemore–Waitaki 1609/671 MVALivingstone–Waitaki 1609/671 MVALivingstone–Naseby 1 609/671 MVA 1Naseby–Roxburgh 1 609/671 MVA 1Clyde–Cromwell–Twizel 1 and 2 561/617 MVA 1Clyde–Roxburgh 1 and 2 347/382 MVABenmore–Twizel 1404/493 MVABenmore–Ohau B 1561/617 MVAOhau B–Twizel 3694/760 MVABenmore–Ohau C 2561/617 MVAOhau C–Twizel 4694/764 MVA1 The timing to upgrade these circuits will bereviewed in 2013. The summer/winter rating forthese circuits prior to upgrade is:202/246 MVA for Aviemore–Benmore 1 and 2,Roxburgh–Naseby–Livingstone 1, and385/470 MVA for Cromwell–Twizel 1 and 2.RoxburghThe following sections assess the transmission capability following the CUWLPupgrade. The assessment is based on representative system conditions, todetermine how different generation development scenarios interact with the WaitakiValley area.System condition 1 (north flow)This system condition tests power flowing from the Lower South Island to theupgraded HVDC link:maximum South Island generation26The amount of power that can be sent from Roxburgh to the Waitaki Valley varies with generationand load. The large range for north transmission capacity is mainly due to the effect of generationat Clyde, ranging from full output of 432 MW to 0 MW. The limits are measured across the Naseby–Roxburgh and Clyde–Roxburgh 1 and 2 circuits.72<strong>2012</strong> <strong>Annual</strong> <strong>Planning</strong> <strong>Report</strong> © <strong>Transpower</strong> New Zealand Limited <strong>2012</strong>. All rights reserved.
Chapter 6: Grid Backboneoff peak South Island load (approximately 62% of island peak)maximum HVDC north transfer of 1,400 MWThere were no issues with transmission capacity for north flow for the forecast period.System condition 2 (south flow)This system condition tests power flowing south of Roxburgh/Clyde during a period ofextremely low southern generation fully utilising the upgraded HVDC links south flowcapacity. To avoid overloading the grid backbone (after the CUWLP projects arecompleted):in 2018, a minimum total of about 362 MW of generation is required atManapouri, Roxburgh and Clyde power stationsin 2027, a minimum total of about 670 MW is required at Manapouri, Roxburghand Clyde power stations.Impact of generation scenariosThe five generation scenarios described in Chapter 5 have the following impacts onthe circuits within the Waitaki Valley area.There were no issues with transmission capacity for north flow for all generationscenarios.High levels of power flow south towards Roxburgh, with high levels of HVDC southflow, overloaded the Benmore–Twizel circuit.As noted in the previous section for system condition 2 (south flow), minimum levelsof generation are required south of Roxburgh/Clyde. Any new generation south ofRoxburgh increases the options for providing the minimum generation requirements,assisting in the management of the power system.OutagesThe transmission capacity is reduced during outages, which may require generationin the Waitaki Valley or Lower South Island area to be constrained.Resolving projectsFor very high power flows from the Waitaki Valley to the Lower South Island, theBenmore–Twizel circuit capacity will need to be increased. Transmission solutions toprevent overloading of the Benmore–Twizel circuit include 27 :variable line ratings to alleviate some overloads in the short term, andthermally upgrading and/or reconductoring the Benmore–Twizel circuit.We will monitor the loading of the Benmore–Twizel circuit to determine if atransmission upgrade investigation is required.Any further increase in south transmission capacity beyond that provided by the suiteof projects provided by CUWLP will require a new transmission line. We will monitorthe load and minimum generation levels required to determine if a new lineinvestigation is required. The present load forecasts do not indicate the need for anew transmission line.27We believe that only a relatively small increase in the rating of the Benmore–Twizel circuit is required(about 20%), and that reconductoring the circuit is not required.<strong>2012</strong> <strong>Annual</strong> <strong>Planning</strong> <strong>Report</strong> © <strong>Transpower</strong> New Zealand Limited <strong>2012</strong>. All rights reserved. 73
Chapter 6: Grid Backbone6.6.4 Transmission capacity south of RoxburghOverviewThe grid backbone south of Roxburgh is primarily a six circuit “triangle” betweenRoxburgh, Three Mile Hill and Invercargill/North Makarewa. There are also ninecircuits connecting Invercargill, North Makarewa, Manapouri and Tiwai.There is a low capacity 110 kV regional network which operates in parallel with thegrid backbone between Roxburgh, Halfway Bush and Invercargill (see Chapter 19).The capacity of this regional network limits the capacity of the grid backbone.The magnitude and direction of power flows on the grid backbone are dominated bythe large hydro generator at Manapouri and the large load at Tiwai.Presently, the main concern for the grid backbone in this area is the transmissioncapacity supplying the regional load when Manapouri generation is low andSouthland demand is high. An outage of one of the two Invercargill–Roxburghcircuits may result in:overloading of the other Invercargill–Roxburgh circuitlow voltages in Southland, andoverloading of the regional 110 kV network between Gore and Roxburgh and theRoxburgh 220/110 kV transformer (see Chapter 19 for more information).These issues are presently managed by constraining on minimum levels ofgeneration and voltage support at Manapouri.Figure 6-15 shows the 220 kV grid backbone circuits south of Roxburgh.Figure 6-15: Grid backbone circuits south of RoxburghManapouriNorth MakarewaTiwaiRoxburgh Circuit Summer/WinterratingInvercargill–Roxburgh 1 and 2347/382 MVAInvercargill–Manapouri 2311/380 MVAInvercargill–North Makarewa 1 404/457 MVA 1Three Manapouri–North Makarewa 1, 2 and 3 311/380 MVAInvercargill–Tiwai 1 and 2 385/457 MVAMile HillGoreNorth Makarewa–Tiwai 1 and 2 385/470 MVARoxburgh–Three Mile Hill 1 and 2 385/470 MVAInvercargillNorth Makarewa–Three Mile Hill 1 and 2 347/382 MVA1. The winter rating is presently limited by a substation componentlimit; with this limit resolved, the winter rating will be 493 MVA.2. The winter rating is presently limited by a substation componentlimit; with this limit resolved, the winter rating will be 470 MVA.Approved projectsThe Lower South Island Reliability Grid Upgrade Plan is a suite of projects toincrease the grid backbone transmission capacity for power flow south fromRoxburgh.Projects to remove the constraint on the grid backbone caused by the regional110 kV grid include (see Chapter 19 for more information):replacing the Roxburgh 220/110 kV transformer with a higher rated transformer inNovember <strong>2012</strong> (this will slightly ease, but not remove, the existing constraints),andproviding a 220/110 kV connection at Gore, and reconfigure the 110 kV networkin 2014 (this will provide a measureable increase in south transmission capacity).There is also an approved project to further increase the south transmission capacityby installing a series capacitor on one of the two North Makarewa–Three Mile Hill74<strong>2012</strong> <strong>Annual</strong> <strong>Planning</strong> <strong>Report</strong> © <strong>Transpower</strong> New Zealand Limited <strong>2012</strong>. All rights reserved.
Chapter 6: Grid Backbonecircuits. The timing for this series capacitor will be reviewed in 2013, to optimise thetiming of the upgrade.System condition 1 (north flow)This system condition tests power flowing north to Roxburgh:maximum South Island generationoff peak South Island load (approximately 62% of island peak)maximum HVDC north transfer of 1,400 MWThere are no issues with the transmission capacity south of Roxburgh during northpower flow for the forecast period.System condition 2 (south flow)This system condition tests power flowing south of Roxburgh during periods of lowgeneration, particularly at Manapouri. To avoid overloading of the grid backbone(after the Lower South Island Reliability upgrades are completed) requires increasedminimum generation in the Southland area as the load in the area increases. In2027, approximately 350 MW of generation is required (principally from Manapouri) toavoid overloading of the grid backbone circuits supplying the Southland load.Impact of Generation scenariosThe five generation scenarios described in Chapter 5 have the following impacts onthe circuits south of Roxburgh.Generation scenario 4 (‘coal’) connects new generation at North Makarewa (240 MWwind in 2018, 400 MW peak thermal in 2025). This will cause the Invercargill–NorthMakarewa circuit to overload, even with all circuits in service.Connecting new generation to a North Makarewa–Gore–Three Mile Hill circuit maycause the circuit to overload.There are no other grid backbone issues with additional generation (although allgeneration scenarios have 110 kV regional grid issues, see Chapter 19).Any additional generation will assist in managing the power system during periods oflow generation.OutagesThe transmission capacity is reduced during outages, which will constrain theminimum and maximum generation in the Otago-Southland area.Resolving projectsThe above issues are emerging late in the forecast period.Transmission solutions to prevent overloading of the Invercargill–North Makarewacircuit include a combination of:reconfiguring the grid by bussing the Invercargill–Manapouri circuit at NorthMakarewathermally upgrading the Invercargill–North Makarewa circuit(s), possiblycombined with variable line ratings, and/orreconductoring the Invercargill–North Makarewa circuits.Transmission solutions to prevent overloading of the North Makarewa–Gore–ThreeMile Hill circuit include:a protection scheme to automatically reduce generation if the circuit overloads<strong>2012</strong> <strong>Annual</strong> <strong>Planning</strong> <strong>Report</strong> © <strong>Transpower</strong> New Zealand Limited <strong>2012</strong>. All rights reserved. 75
Chapter 6: Grid Backbonea thermal upgrade of the circuits, combined with variable line rating and/ora reconductor of (part of) the circuit.Any further increase in south transmission capacity following completion of the LowerSouth Island Reliability projects will require a new transmission line. The presentload forecasts do not indicate the need for a new transmission line.The low voltage during high levels of south transmission can be addressed by:increasing the rating of the existing North Makarewa capacitors from 50 Mvar to75 Mvar 28additional capacitorsoperating Manapouri generators at 0 MW to provide voltage support.28The two existing 50 Mvar capacitors at North Makarewa are designed to be easily upgraded to75 Mvar.76<strong>2012</strong> <strong>Annual</strong> <strong>Planning</strong> <strong>Report</strong> © <strong>Transpower</strong> New Zealand Limited <strong>2012</strong>. All rights reserved.
Chapter 6: Grid Backbone6.7 HVDC link overviewThe High Voltage Direct Current (HVDC) link connects the North and South Islands.For the North Island, the HVDC link provides access to the South Island’s large hydrogeneration capacity, which may be important for the North Island in peak winterperiods. For the South Island, the HVDC link provides access to the North Island’sgas and coal generation, which is important for the South Island during dry periods.Without the HVDC link, more generation in both the North and South Islands wouldbe needed. In addition, the HVDC link is essential for the electricity market as itallows generators in the North and South Islands to compete, putting downwardpressure on prices and minimising the need to invest in expensive new generatingstations. The HVDC link also plays an important part in allowing renewable energysources to be managed between the two islands.6.7.1 Existing HVDC link configurationFigure 6-16 shows a simplified schematic of the existing HVDC link, which comprises:a mercury arc converter (Pole 1), with a converter station at Benmore in theSouth Island and Haywards in the North Islanda thyristor converter (Pole 2), with a converter station at Benmore in the SouthIsland and Haywards in the North Islandprotection and control systems at Benmore and Haywardsa 350 kV bipolar transmission line, 534 km long from Benmore to Fighting Bay onthe shore of Cook Strait in the South Island and 37 km long from Haywards toOteranga Bay on the shore of Cook Strait in the North Islandthree 350 kV undersea 40 km cables, with cable terminal stations at Fighting Bayand Oteranga Bay, anda land electrode at Bog Roy near Benmore in the South Island and a shoreelectrode at Te Hikowhenua near Haywards in the North Island.Figure 6-16: Existing HVDC linkC7HAYWARDS110 kVF147.5 MvarF247.5 MvarT1HAYWARDS220 kVBENMORE220 kVT2F150.5 MvarBENMORE16 kVVG1P1AVG2+ 270 kV535 km DC linesection – SouthIslandCable 6Pole 1 assetsPole 2 assets35 km DC linesectionNorth IslandVG4P1BVG3C8C10C9C160 MvarC2R140 MvarT260 MvarT5Ground (Earth/Sea) Return Current modeF379.3 MvarF479.3 MvarPole 2(existing thyristorConverters 700 MW)- 350 kV40 km Cook StraitCablesCable 5Cable 4C3 C435 MvareachF3106.3 MvarF4106.3 MvarR540 Mvar6.7.2 Future HVDC link configurationFigure 6-17 shows a simplified schematic of the HVDC link as it will be following thecompletion of the Pole 3 project in <strong>2012</strong>/13. The Pole 3 project will replace the Pole 1mercury arc converters with new converters similar to the existing Pole 2 converters,and connected to the 220 kV buses at Haywards and Benmore. The work includes:<strong>2012</strong> <strong>Annual</strong> <strong>Planning</strong> <strong>Report</strong> © <strong>Transpower</strong> New Zealand Limited <strong>2012</strong>. All rights reserved. 77
Chapter 6: Grid Backbonenew thyristor based converters at Benmore and Haywards, including theassociated converter transformers and DC smoothing reactorsnew 220 kV AC filters at Benmore and Haywardsreplacement of the existing 110 kV AC filters at Haywardsrefurbishment of all synchronous condensers at Haywards and new 110/11 kVtransformers for four of the condensers, andreplacement of HVDC protection and controls.Figure 6-17: Pole 2/Pole 3 HVDC linkCable 5+ 350 kVCable 6New 220 kV Filter/sNew 220 kVFilter/sPole 3Thyristorconverters(700 MW)New StatcomT1C7ExistingC8Stage 1 – 1000 MWStage 2 – 1200 MWC160 MvarR140 MvarT2C9C10BENMORE220kVF379.3 MvarF479.3 Mvar- 350 kV535 km DCline sectionSouth IslandCable 440 km Cook StraitCablesPole 2existingThyristorconverters(700 MW)35 km DC linesection NorthIslandF3106. 3 MvarF4106. 3 MvarC2HAYWARDS220kVC3 C435 Mvareach60 MvarT5R540 MvarHAYWARDS110kVC7-C1065 MvareachNew5 th /7 thFilter/sFigure 6-18 shows a simplified diagram for a possible further expansion of the HVDClink to 1,400 MW north capacity following completion of the Pole 3 project. Thiswould involve the installation of:one additional submarine cableadditional filters at both Benmore and Haywards, andadditional dynamic reactive support at Haywards.Figure 6-18: Possible future HVDC linkCable 5+ 350 kVCable 6220 kV Filter/sStatcom220 kVFilter/sPole 3Thyristorconverters(700 MW)New 220 kV Filter/sNew StatcomT1C7New 220 kVFilter/sExisting aftercompletion of Stage 2Stage 3 – 1400 MWC160 MvarR140 MvarT2C8C9C10BENMORE220kVF379.3 MvarF479.3 Mvar- 350 kV535 km DCline sectionSouth IslandCable 7Cable 440 km Cook StraitCablesPole 2Thyristorconverters(700 MW)35 km DC linesection NorthIslandF3106. 3 MvarF4106. 3 MvarC2HAYWARDS220kVC3 C435 Mvareach60 MvarT5R540 MvarHAYWARDS110kVC7-C1065 Mvareach5 th /7 thFilter/s78<strong>2012</strong> <strong>Annual</strong> <strong>Planning</strong> <strong>Report</strong> © <strong>Transpower</strong> New Zealand Limited <strong>2012</strong>. All rights reserved.
Chapter 6: Grid Backbone6.8 HVDC link issues and project options6.8.1 HVDC link capacityIn 1992, the HVDC link capacity was 1,240 MW, with a Pole 1 capacity of 640 MWand a Pole 2 capacity of 700 MW.The HVDC link capacity is now significantly lower. Pole 1 is available for only limitedoperation, including north transfer only of between 130 MW and 200 MW. Pole 2 isnormally available, with a maximum transfer of 700 MW. However, with only Pole 2 inoperation, the HVDC link transfer is dependent on the reserve cover available, whichsignificantly reduces the maximum practical transfer limit.It is economic to restore the HVDC link capacity.The Pole 3 project, to replace Pole 1, will provide an HVDC link capacity of 1,000 MW(north and south power flow), with a possible increase to 1,200 MW in 2014. It willnot always be possible to use the full capacity of the HVDC link. Power transferbetween the North and South Islands may be limited by the availability ofinstantaneous reserves and the capacity of the North and South Island transmissionnetworks (refer to Sections 6.4 and 6.6 respectively).The other sections of the <strong>Annual</strong> <strong>Planning</strong> <strong>Report</strong> assume that the Pole 3 project toreplace Pole 1 is completed in <strong>2012</strong>/13.6.8.2 State of existing equipmentPole 1Pole 1 was commissioned in 1965. Half of the original Pole 1 was decommissionedin December 2009.The remaining half of Pole 1 is available under limited conditions: for normaloperation, in response to Grid emergencies, and for testing. The conditions includenorth transfer between 130 MW and 200 MW, with automatic controls unavailable(except frequency modulation). Other conditions include a limit on the number ofstarts, minimum operating time per start and cumulative operating time 29 .When Pole 1 is not operating, HVDC bipole operation is not available. Without bipoleoperation, the HVDC is in monopolar operation, which results in:reduced HVDC capacity (one pole rather than two poles in operation)increased reserve cover from generation and load required for a Pole trip, andground (sea/earth) return current.With regard to the reserve cover required, in bipole operation should one pole failthen the remaining pole can increase its power transfer, which provides some selfcover. This could be partial or full load cover depending on pre-fault power flow ofthe remaining pole. There is no self cover possible in monopolar operation with onlyHVDC Pole 2 in service.The maximum possible transfer with only Pole 2 in service is 700 MW. However, thenormal link transfer is dependent on the reserve cover available. This significantlyreduces the practical transfer limit at most times.Also, a planned or unplanned outage under monopolar operation decouples the twoislands, reducing the generation available to both islands and introducing priceseparation (or reduced competition).29For further details of the HVDC Pole 1 offer, see http://www.transpower.co.nz/grid-owner-notices.<strong>2012</strong> <strong>Annual</strong> <strong>Planning</strong> <strong>Report</strong> © <strong>Transpower</strong> New Zealand Limited <strong>2012</strong>. All rights reserved. 79
Chapter 6: Grid BackboneWith regard to ground (sea/earth) return current, in monopolar operation all of theHVDC current flows in the ground. 30 To date, we have not had any problems withground return current, other than wear on the sea/earth electrodes.The effect of the restricted operating conditions for Pole 1 highlights the need for itsreplacement.Pole 2Pole 2 was commissioned in 1991, with a design life of 35 years for the main circuitequipment, although most of the equipment is expected to last longer. Some maincircuit equipment is also common to Pole 1 and Pole 2 (neutral bus and electrode lineequipment), which was also installed in the early 1990s.The nominal rating of Pole 2 is 560 MW, with a continuous overload of 700 MW. Thecontinuous overload has proved very beneficial for limiting reserve requirements andmanaging emergency conditions.HVDC controlsAll the HVDC Pole 1 and bipole controls and protections date from when Pole 2 wasinstalled in the early 1990’s. These digital control systems face obsolescencebecause the lifetime of control systems (about 15-20 years) is shorter than that of themain circuit equipment, thus requiring at least one full replacement within the lifetimeof the HVDC converter equipment.HVDC transmission linesThe transmission line was originally built for +/- 250 kV 1200 A operation (600 MWbipole operation). During the hybrid link upgrade, the line was re-insulated to operateat 350 kV and thermally upgraded for maximum continuous current of 2000 A.Therefore, the line is capable of 700 MW per pole or 1,400 MW bipole operation.Most of the conductor on the line in the North Island is nearing the end of itsserviceable life, based on condition assessment. Most of the conductor in the SouthIsland is expected to have a remaining service life of several decades.About 100 of the 1,530 towers in the South Island need to be replaced to correct anumber of conductor clearance and tower strength issues as part of the linemaintenance work.HVDC submarine cablesThree cables (each rated 500 MW at 350 kV) were installed as part of the Hybrid DClink upgrade project in the early 1990s.Between 1991 and 2004, the three cables had performed well with no major issues orfailures. In October 2004, a cable failed and was out of service for six months whilerepairs were carried out. It was fortunate that this fault was in shallow water inOteranga Bay so it could be repaired using a locally available barge, with sufficienttime to mobilise a repair before the limited weather window in February/March ended.While the cause of failure is difficult to establish, and the balance of probabilitiesindicates that it is likely to be a localised problem, it is also possible that there is alatent design weakness or manufacturing defect which could result in another fault inthe cable, or even one of the other cables.30In balanced bipole operation, the dc current in both poles is equal and opposite (within an accuracyof about 4 amps). Thus the current in one Pole returns through the other Pole, and the 4 amps ofunbalanced current flows in the ground (sea/earth) electrode.80<strong>2012</strong> <strong>Annual</strong> <strong>Planning</strong> <strong>Report</strong> © <strong>Transpower</strong> New Zealand Limited <strong>2012</strong>. All rights reserved.
Chapter 6: Grid BackboneThere is a Cable Protection Zone (CPZ) to exclude external activities which mightdamage the cables. These cables are also under constant marine patrol preventingfishing and trawling activities within the CPZ. Regular Remote Operated Vehicle(ROV) surveys are also undertaken to monitor the external condition of the cable andthe environmental factors affecting the cables.The cables’ design and the CPZ help ensure the cables will achieve their 40 yeardesign life. However, sea conditions and seabed movement makes Cook Strait oneof the most aggressive locations for submarine cables in the world. The abrasioncorrosionconditions in Cook Strait are understood and mechanical deterioration islikely to be the determinant factor in determining the life expectancy of the cables.HVDC electrodesA bipolar HVDC link operating with balanced current in both poles has only a smallamount of residual ground current. In unbalanced bipolar operation, or in monopolaroperation, a return current path needs to be provided.The return current path is via the earth (ground), which requires a land electrode atBog Roy, for Benmore, and a shore electrode at Te Hikowhenua, for Haywardsstation. These electrodes are designed for continuous operation at 2000 amps. Thiscorresponds to 700 MW monopolar operation at 350 kV DC. It is capable ofoperating at 2400 A for intermittent (few hours at a time) operation.Monopolar operation depends on the availability and integrity of the electrodes toensure safe operation of the link. The long term impact of operating in continuousmonopolar operation at high power levels is not readily available. Since the partialdecommissioning and restricted operation of Pole 1, monopolar operation of theHVDC link has been its normal operating mode. We and our contractors carry outregular maintenance work to ensure the integrity of these electrodes, and theelectrodes remain within their design limits.Synchronous condensersThere are eight synchronous condensers at Haywards, providing reactive supportand improving system strength to enable stable operation of the HVDC link. Thenumber of synchronous condensers that need to be in service depends on the HVDCbipole power transfer, if all other system conditions are equal.Four condensers are connected to the tertiary windings of the 220/110/11 kVinterconnecting transformers. Two condensers are connected through recentlyinstalled new 110/11 kV transformers. The other two condensers are connected tothe tertiary windings of the Pole 1 converter transformers. The Pole 1 transformersare nearing the end of their reliable economic life.The condensers were installed between 1955 and 1965 and are of very robust designand construction. Good international practice is for major overhaul and invasivemaintenance every 15-20 years, which was last done in 1989-1992. In addition,much of the auxiliary equipment either no longer meets modern practice or is nearingthe end of its reliable economic life.6.8.3 Approved HVDC link projects (Stage 1 and 2)The HVDC Pole 3 project is an approved project, presently under construction, toincrease the HVDC link capacity (refer to Section 6.8.1) and address equipmentissues (refer to section 6.8.2). The Pole 3 project is in two stages:Stage 1 provides an HVDC link capacity of 1,000 MW, andStage 2 provides an HVDC link capacity of 1,200 MW.Figure 6-17 (in Section 6.7.2) shows a simplified diagram for the two stages.<strong>2012</strong> <strong>Annual</strong> <strong>Planning</strong> <strong>Report</strong> © <strong>Transpower</strong> New Zealand Limited <strong>2012</strong>. All rights reserved. 81
Chapter 6: Grid BackboneThe connection and commissioning of Pole 3 has the potential to significantly affectthe operation of the power system and the electricity market. An industry group hasbeen established to coordinate outage and commissioning activities to minimisethese impacts.HVDC converters (Stage 1 – 1,000 MW)Pole 3 will have a nominal operating DC voltage of 350 kV and a continuous currentrating of 2000 A, to give a 700 MW converter. The upper limit on the voltage is set bythe existing line design and cable ratings. The maximum nominal current is limited bythe line rating and the continuous rating of the new Pole 3 equipment.A 30 minute overload capacity of 1,000 MW for Pole 3 reduces the overall systemreserve requirements.HVDC transfer north up to 1,000 MW in balanced 500/500 MW bipole operation ispossible.Only three cables are available, which limits the self cover of the HVDC for a pole trip:Pole 3 will have two cables connected, so the short-term 1,000 MW capacity ofPole 3 is matched by the 1,000 MW cable capacity, but may be limited by thesteady-state 700 MW rating of the transmission line. Pole 3 will provide aminimum cover up to 700 MW for a failure of Pole 2.Pole 2 will have one cable connected, so the 700 MW capacity of Pole 2 will belimited by the 500 MW rating of the cable. Pole 2 will provide cover up to500 MW for a failure of Pole 3.As discussed in Section 6.8.1, the south transfer capability is limited by the capacityof the AC network in the North and South Islands, and varies significantly with thesystem demand in the Wellington region because of the AC system limitation. TheHVDC controls will apply a maximum south transfer limit of 750 MW to represent thisAC system limitation with all equipment in service and at a time of minimum systemdemand. The south transfer capability will reduce below this value as the demandincreases (and during equipment outages).110 kV filters at HaywardsThe 110 kV connected filters at Haywards, installed as part of the original HVDC Linkin the mid 1960s, will be replaced by 5 th /7 th harmonic filters.Synchronous condensers at HaywardsThe eight existing condensers will be retained and refurbished. The two condensersthat are connected to the Pole 1 mercury arc valve converter transformers will bereconnected to the 110 kV busbars with new transformers after Pole 1 isdecommissioned.Pole 2 and Bipole protection and controlThe Pole 2 and Bipole control systems will be replaced with identical technology tothat of new Pole 3. The Pole 2 valve firing controls will be replaced as part of the newPole 2 control system, and will interface to the existing valve based electronics (whichwill be retained) at the thyristors.The new control system will be very flexible. It will monitor and control the HVDCtransfer to manage system conditions at Haywards and Benmore and on the ACnetwork at Haywards. The flexibility of the new control system will provide options tomodify it, allowing the AC network to operate above the n-1 limit by relying on theHVDC control system to prevent post-contingency overloads.82<strong>2012</strong> <strong>Annual</strong> <strong>Planning</strong> <strong>Report</strong> © <strong>Transpower</strong> New Zealand Limited <strong>2012</strong>. All rights reserved.
Chapter 6: Grid BackboneHaywards STATCOM (Stage 2 – 1,200 MW)In addition to the existing synchronous condensers, additional dynamic reactivepower capacity will be required to achieve HVDC capacity greater than 1,000 MW,driven by two major functional requirements to:provide reactive support and improve voltage stabilitylimit excessive transient or temporary overvoltage (TOV) following a bipole trip.A STATCOM with a substantial overload rating will provide the necessary dynamicreactive support for HVDC capacity of 1,200 MW. The STATCOM has a nominalrating of +60/-60 Mvar and a short-term rating which is expected to be a minimum of+100/-180 Mvar.HVDC north transfer up to 1,200 MW is possible with unbalanced 700/500 MWoperation of Pole 3/Pole 2.Only three cables are available, which limits the self-cover of the HVDC for a pole tripas described for Stage 1.As for Stage 1, the south transfer capability is limited by the capacity of the ACnetwork and will vary significantly with the system demand in the Wellington region.The HVDC controls at Stage 2 will limit the maximum south transfer to 850 MW withall equipment in service and at a time of minimum system demand. The increasefrom Stage 1 is due to the additional reactive support provided by the STATCOM.The south transfer capability will reduce below this value as the demand increases(and during equipment outages).HVDC line ratingEach of the poles on the HVDC line has a steady state rating of 700 MW, whereasPole 3 will have a minimum short-term rating of 1,000 MW for 30 minutes. The shorttermrating of the line depends on its pre-contingency loading and ambient airtemperature. At times, the full short-term rating of Pole 3 may be restricted by therating of the line.6.8.4 Further HVDC developmentsHVDC link expansion to 1,400 MWFollowing the Pole 3 project, the HVDC Link can be further expanded to 1,400 MWnorth transfer capacity with the installation of:one additional submarine cableadditional filters at both Benmore and Haywards, andadditional dynamic reactive support at Haywards.Figure 6-18 (in Section 6.7.2) shows a simplified diagram for this possible upgrade.The HVDC controls will limit the maximum south transfer to 950 MW with allequipment in service and at a time of minimum system demand. The increase fromStage 2 is due to the additional reactive support at Haywards. The south transfercapability will reduce below this value as the demand increases (and duringequipment outages)When planning for the additional cable, the condition and risks associated with theexisting cables will also be reviewed and the need for a spare (fifth) cable will beassessed.The timing for this possible upgrade will be assessed following completion of thePole 3 project. The earliest anticipated date for expansion to 1,400 MW is presently2017 and we anticipate seeking approval from the Commission in 2014. This wouldbe a major capex proposal and our project reference is HVDC-TRAN-DEV-03.<strong>2012</strong> <strong>Annual</strong> <strong>Planning</strong> <strong>Report</strong> © <strong>Transpower</strong> New Zealand Limited <strong>2012</strong>. All rights reserved. 83
Chapter 6: Grid BackboneWe anticipate that a capacity increase to 1,400 MW will provide sufficient capacity toenable diversity of generation in the North and South Islands for the foreseeablefuture.HVDC line ratingThe HVDC line’s capacity could be increased to allow the unconstrained use of theconverters’ short-term overload rating for all operating conditions. We will monitor theuse of the HVDC link to determine if and when an investigation for an upgrade of theHVDC line may be required. This is a possible major capex proposal and weanticipate seeking approval for this project at a date to be advised. Our projectreference is HVDC-TRAN-DEV-02.84<strong>2012</strong> <strong>Annual</strong> <strong>Planning</strong> <strong>Report</strong> © <strong>Transpower</strong> New Zealand Limited <strong>2012</strong>. All rights reserved.
Chapter 7: Northland Region7 Northland Regional Plan7.1 Regional overview7.2 Northland transmission system7.3 Northland demand7.4 Northland generation7.5 Northland significant maintenance work7.6 Future Northland projects summary and transmission configuration7.7 Changes since the 2011 <strong>Annual</strong> <strong>Planning</strong> <strong>Report</strong>7.8 Northland transmission capability7.9 Other regional items of interest7.10 Northland generation proposals and opportunities7.1 Regional overviewThis chapter details the Northland regional transmission plan. We base this regionalplan on an assessment of available data, and welcome feedback to improve its valueto all stakeholders.Figure 7-1: Northland region<strong>2012</strong> <strong>Annual</strong> <strong>Planning</strong> <strong>Report</strong> © <strong>Transpower</strong> New Zealand Limited <strong>2012</strong>. All rights reserved. 85
Chapter 7: Northland RegionThe Northland region load includes greater Auckland loads such as Henderson andAlbany, a major industrial load at Bream Bay, and loads at smaller regional centres tothe north.We have assessed the Northland region’s transmission needs over the next 15 yearswhile considering longer-term development opportunities. Specifically, thetransmission network needs to be flexible to respond to a range of future service andtechnology possibilities, taking into consideration:the existing transmission networkforecast demandforecast generationequipment replacement based on condition assessment, andpossible technological development.7.2 Northland transmission systemThis section highlights the state of the Northland regional transmission network. Theexisting transmission network is set out geographically in Figure 7-1 andschematically in Figure 7-2.Figure 7-2: Northland transmission schematicKaitaiaLines company assets33 kV110 kVKaikohe33 kVKensington110 kV33 kVBream BayDargaville11 kV 50 kVMaungatapere33 kV110 kV50 kV110 kVMaungaturotoMarsden110 kV33 kV220 kV220 kVWellsford110 kV33 kVKEYSilverdale33 kVSVC220kV CIRCUIT110kV CIRCUIT50kV CIRCUITSUBSTATION BUSTRANSFORMERLOADCAPACITORSTATIC VARCOMPENSATORBONDED CIRCUIT33 kVHuapai220 kV110 kV220 kV 110 kVHendersonVECTORWAIRAU ROAD110 kVSVC220 kV33 kVAlbanyOtahuhu Southdown Mount RoskillAUCKLAND33 kVHepburn Road86<strong>2012</strong> <strong>Annual</strong> <strong>Planning</strong> <strong>Report</strong> © <strong>Transpower</strong> New Zealand Limited <strong>2012</strong>. All rights reserved.
Chapter 7: Northland Region7.2.1 Transmission into the regionThe Northland region is supplied through Auckland by a 220 kV double-circuit linefrom Otahuhu, with Southdown power station connected into one of these circuits justnorth of Otahuhu, and a 110 kV double-circuit line from Mount Roskill.The Northland region’s generation capacity is well short of the local demand. Most ofthe region’s power requirements must be imported into the region through Auckland.We have committed to a major project to improve security of supply into theNorthland region. The North Auckland and Northland (NAaN) project (see Chapter 8for more information) includes a 220 kV cable from Pakuranga to Penrose and on toAlbany. This will approximately double the n-1 capacity into Northland, and will takea different route across Auckland from the existing 220 kV circuits. When required, asecond 220 kV cable will be installed along a similar cable route.7.2.2 Transmission within the regionTransmission within the Northland region consists of three sub-regions.The first sub-region consists of five substations 31 within the Auckland city area. Thesubstations are connected through high capacity 220 kV circuits or relatively highcapacity 110 kV circuits. There are six capacitor banks 32 and a static varcompensator (SVC) for voltage support.The second sub-region is the high capacity 220 kV double-circuit line from Huapai toMarsden and Bream Bay. Two static synchronous compensators (STATCOMs) arebeing installed at Marsden for voltage support.The third sub-region is around Maungatapere, supplied mainly through the 110 kVdouble-circuit Marsden–Maungatapere line. There is also a low capacity backupdouble circuit Henderson–Maungatapere line, with substations at Wellsford andMaungaturoto. From Maungatapere there is a 110 kV double-circuit line toKensington and a 110 kV double-circuit line to Kaikohe. There are also two 50 kVsingle-circuit Maungatapere–Dargaville lines. At present, voltage support for thesub-region is provided by capacitors at Kaitaia and, within the distribution, at Kaikohe.There are five 220/110 kV interconnecting transformers: two at Henderson, one atAlbany, and two at Marsden.7.2.3 Additional voltage supportThe sub-region around Maungatapere will require additional voltage support in boththe short and long term. Technically, the most effective voltage support solution is toover-compensate the system by installing additional capacitors at Kaitaia, so reactivepower flows from Kaitaia to Kaikohe and Maungatapere.If additional voltage support is installed at Maungatapere, then higher capacityequipment must be installed to achieve the same voltage set point. This may requireSTATCOMs or similar technology rather than lower cost capacitors.7.2.4 Longer-term development pathThe North Auckland and Northland (NAaN) project is expected to secure transmissioninto Northland well beyond the 15-year forecast period. In the longer term, anadditional 220 kV circuit will be required to retain adequate security. This is likely tobe a second cable between Penrose and Albany.3132The five lower sub-region substations are Henderson, Huapai, Albany, Silverdale and HepburnRoad.A 30 Mvar capacitor bank, connected to the 11 kV tertiary of the Henderson T1 220/110 kVtransformer, will soon be decommissioned.<strong>2012</strong> <strong>Annual</strong> <strong>Planning</strong> <strong>Report</strong> © <strong>Transpower</strong> New Zealand Limited <strong>2012</strong>. All rights reserved. 87
Chapter 7: Northland RegionNo new transmission lines are expected to be required from the North Isthmus toNorthland to provide additional transmission capacity. At most, one of the two 220 kVcircuits from Huapai to Bream Bay and Marsden may need to be reconductored fromsimplex to duplex (the other circuit is already duplex), and the two 110 kVHenderson–Maungatapere circuits may also need to be reconductored.A new transmission line will be required if an increase in security is required at sometime in the future, particularly if security needs to be maintained during maintenanceoutages.7.3 Northland demandThe after diversity maximum demand (ADMD) for the Northland region is forecast togrow on average by 2.2% annually over the next 15 years, from 908 MW in <strong>2012</strong> to1,254 MW by 2027. This is higher than the national average demand growth of 1.7%annually.Figure 7-3 shows a comparison of the 2011 and <strong>2012</strong> forecast 15-year maximumdemand (after diversity 33 ) for the Northland region. The forecasts are derived usinghistorical data, and modified to account for customer information, where appropriate.The power factor at each grid exit point is also derived from historical data, and isused to calculate the real power capacity for power transformer and transmission line.See Chapter 4 for more information about demand forecasting.Figure 7-3: Northland region after diversity maximum demand forecastLoad (MW)1300Northland1200110010009008002011 APR Forecast700<strong>2012</strong> APR ForecastActual Peak6001997 1999 2001 2003 2005 2007 2009 2011 2013 2015 2017 2019 2021 2023 2025 2027Table 7-1 lists forecast peak demand (prudent growth) for each grid exit point for theforecast period, as required for the Grid Reliability <strong>Report</strong>.33The after diversity maximum demand (ADMD) for the region will be less than the sum of theindividual grid exit point peak demands, as it takes into account the fact that the peak demand doesnot occur simultaneously at all the grid exit points in the region.88<strong>2012</strong> <strong>Annual</strong> <strong>Planning</strong> <strong>Report</strong> © <strong>Transpower</strong> New Zealand Limited <strong>2012</strong>. All rights reserved.
Chapter 7: Northland RegionTable 7-1: Forecast annual peak demand (MW) at Northland grid exit points to 2027Grid exit pointPowerfactorNext 5 yearsPeak demand (MW)5-15 years out<strong>2012</strong> 2013 2014 2015 2016 2017 2019 2021 2023 2025 2027Albany 33 kV 0.99 160 165 170 175 180 186 197 207 215 224 231Albany 110 kV1 0.99 160 165 170 175 180 186 197 207 215 224 231(Wairau Rd)Bream Bay 2 0.95 45 46 46 47 48 49 52 53 55 56 57Dargaville 0.97 13 13 14 14 14 14 15 16 16 16 17Henderson 3 0.99 130 134 138 142 146 151 160 168 175 182 187Hepburn Road 0.99 165 170 175 180 186 191 203 213 222 231 238Kensington 4 0.99 70 71 73 74 75 77 79 82 84 87 90Maungatapere33 kV0.96 54 55 56 57 59 60 62 65 67 70 72Kaikohe 5 0.97 63 65 66 68 70 71 75 78 81 84 86Maungaturoto 0.99 18 18 18 19 19 19 20 21 21 22 23Silverdale 0.99 80 82 85 87 90 93 98 103 108 112 115Wellsford 0.99 35 36 37 38 39 40 42 43 45 47 491. A new grid exit point at Wairau Road is planned for commissioning in 2013. This will take some loadfrom the Albany 110 kV grid exit point, although the exact split is not known.2. The customer advised there are some major step increases proposed at Bream Bay that should beincluded in the prudent forecast. In particular, 2 MW additional load included in 2019.3. The customer advised that their forecast is lower than <strong>Transpower</strong>’s forecast.4. The customer advised of load transfers between Kensington and Maungatapere. These affect theobserved peaks with the amount varying year-on-year.5. Kaikohe is supplied on two 110 kV feeders from Maungatapere. In previous years, the APRprovided separate load forecasts for Kaikohe and Kaitaia; these are now combined in a single loadforecast for Kaikohe.7.4 Northland generationThe Northland region’s generation capacity is approximately 54 MW, well short of thelocal demand. Proposals for new generation in the Northland region have beenannounced, but as yet are not committed (see Section 7.10 for more information).Table 7-2 lists the generation forecast for each grid injection point for the forecastperiod, as required for the Grid Reliability <strong>Report</strong>. This includes all known andcommitted generation stations including those embedded within the relevant locallines company’s network (Vector, Northpower or Top Energy). 34Table 7-2: Forecast annual generation capacity (MW) at Northland grid injection pointsto 2027 (including existing and committed generation)Grid injection point(location ifembedded)Next 5 yearsGeneration capacity (MW)5-15 years out<strong>2012</strong> 2013 2014 2015 2016 2017 2019 2021 2023 2025 2027Albany (Rosedale 1 ) 3 3 3 3 3 3 3 3 3 3 3Bream Bay (MarsdenDiesel)9 9 9 9 9 9 9 9 9 9 9Kaikohe (Ngawha) 27 27 27 27 27 27 27 27 27 27 2734Only generators with a capacity greater than 1 MW are listed. Generation capacity is rounded to thenearest megawatt.<strong>2012</strong> <strong>Annual</strong> <strong>Planning</strong> <strong>Report</strong> © <strong>Transpower</strong> New Zealand Limited <strong>2012</strong>. All rights reserved. 89
Chapter 7: Northland RegionGrid injection point(location ifembedded)Maungatapere(Wairua)Next 5 yearsGeneration capacity (MW)5-15 years out<strong>2012</strong> 2013 2014 2015 2016 2017 2019 2021 2023 2025 20275 5 5 5 5 5 5 5 5 5 5Silverdale (Redvale) 10 10 10 10 10 10 10 10 10 10 101. Rosedale generation is limited to approximately 1 MW due to insufficient gas at the site. Thisamount is not expected to rise significantly within the next few years.7.5 Northland significant maintenance workOur capital project and maintenance works are integrated to enable system issues tobe resolved if possible when assets are replaced or refurbished. Table 7-3 lists thesignificant maintenance-related work 35 proposed for the Northland region for the next15 years that may significantly impact related system issues or connected parties.Table 7-3: Proposed significant maintenance workDescriptionAlbany 220/110/11 kVinterconnecting transformerexpected end-of-lifeAlbany 33 kV outdoor to indoorconversionHenderson 220/110/11 kVinterconnecting transformersexpected end-of-lifeHenderson 33 kV outdoor to indoorconversionHepburn Road 33 kV outdoor toindoor conversionKensington supply transformerexpected end-of-lifeMaungatapere 110/50 kVtransformers expected end-of-lifeMaungatapere 110/33 kVtransformers expected end-of-life,and 33 kV outdoor to indoorconversionMaungaturoto 33 kV outdoor toindoor conversionWellsford supply transformersexpected end-of-lifeTentativeyearRelated system issues2022-2024 The appropriate replacement option will beconsidered and carried out in conjunction with theHenderson interconnecting transformersreplacement.2020-2023 Albany supply transformer n-1 capacity is limited bytransformer branch component limits. The work toremove these limits will be coordinated with the33 kV outdoor to indoor conversion work. SeeSection 7.8.9 for more information.2023-2025 The appropriate replacement option will beconsidered and carried out in conjunction with theAlbany interconnecting transformer replacement.2014-2016 Henderson supply transformer n-1 capacity islimited by transformer branch component limits.The work to remove these limits will be coordinatedwith the 33 kV outdoor to indoor conversion work.See Section 7.8.13 for more information.2014-2016 No system issues are identified within the forecastperiod.2027-2029 The forecast load at Kensington already exceedsthe Kensington transformer n-1 capacity. SeeSection 7.8.15 for information.<strong>2012</strong>-2014 The forecast load at Dargaville already exceeds theMaungatapere transformer n-1 capacity. SeeSection 7.8.11 for more information.2018-20202022-2025The forecast load at Maungatapere alreadyexceeds the transformer n-1 capacity. See Section7.8.16 for more information.2017-2019 No system issues are identified within the forecastperiod.2015-2017 The forecast load at Wellsford already exceeds thetransformer n-1 capacity. See Section 7.8.19 formore information.35This may include replacement of the asset due to its condition assessment.90<strong>2012</strong> <strong>Annual</strong> <strong>Planning</strong> <strong>Report</strong> © <strong>Transpower</strong> New Zealand Limited <strong>2012</strong>. All rights reserved.
Chapter 7: Northland Region7.6 Future Northland projects summary and transmission configurationTable 7-4 lists projects to be carried out in the Northland region within the next 15years.Figure 7-4 shows the possible configuration of Northland transmission in 2027, withnew assets, upgraded assets, and assets undergoing significant maintenance withinthe forecast period.Table 7-4: Projects in the Northland region up to 2027Site Projects StatusAlbanyAlbany–Wairau Road–Hobson Street–PenroseReplace interconnecting transformer.Resolve supply transformers’ protection and circuit breaker limits.Convert 33 kV outdoor switchgear to an indoor switchboard.Construct a new 220 kV underground cable link.Base CapexPossibleBase CapexCommittedBream Bay Resolve supply transformer protection limits. Base CapexDargavilleHendersonHenderson–WellsfordUse the 15 MVA short-term capacity of the supply transformers.Increase the supply transformers thermal capacity by adding fansand pumps.Replace switchgear on the interconnecting transformers.Replace interconnecting transformers.Install a new 220/33 kV supply transformerConvert 33 kV outdoor switchgear to an indoor switchboard.Install a special protection scheme to automatically split the system.PossiblePossibleBase CapexBase CapexPossibleBase CapexPossibleHepburn Road Convert 33 kV outdoor switchgear to an indoor switchboard. Base CapexHuapai Split the Huapai 220 kV bus. PossibleKaikohe–MaungatapereThermal upgrade the circuits.PossibleKaitaia Install a second 20 Mvar binary switched capacitor bank. PossibleKensingtonKensington–MaungatapereMarsdenMaungatapereMaungaturotoReplace supply transformers with higher-rated units.Upgrade 33 kV switchboard.Resolve protection limits on the Kensington–Maungatauere circuits.Install two new STATCOMs.Replace interconnecting transformers with higher-rated units.Replace 110/50 kV supply transformers with two higher-rated units.Replace 110/33 kV supply transformers.Convert 33 kV outdoor switchgear to an indoor switchboard.Convert 33 kV outdoor switchgear to an indoor switchboard.Resolve supply transformers’ protection and metering limits.PossibleBase CapexBase CapexCommittedPossibleBase CapexBase CapexBase CapexBase CapexBase CapexSilverdale Recalibrate supply transformers’ metering parameters. Base CapexWellsford Replace existing 110/33 kV supply transformers. Base CapexWairau Road Construct a new grid exit point. Committed<strong>2012</strong> <strong>Annual</strong> <strong>Planning</strong> <strong>Report</strong> © <strong>Transpower</strong> New Zealand Limited <strong>2012</strong>. All rights reserved. 91
Chapter 7: Northland RegionFigure 7-4: Possible Northland transmission configuration in 2027KaitaiaLines company assets33 kV110 kV110 kVKaikohe33 kVKensington33 kVBream BayDargaville33 kVMaungatapere110 kV50 kV*MarsdenSTC33 kV*220 kV220 kV11 kV50 kV110 kVMaungaturoto110 kV33 kV*Wellsford110 kV33 kVSilverdaleKEY*33kVNEW ASSETSUPGRADED ASSETSASSETS SCHEDULEDFOR REPLACEMENTMINOR UPGRADE*33 kVHuapai220 kV*Otahuhu Southdown Mount RoskillAUCKLAND110 kV220 kV 110 kVHendersonVECTORWAIRAU ROAD110 kV33 kVHepburn Road*SVCPenroseAUCKLAND220 kV33 kVAlbanyWAIRAU ROAD220 kV33 kV7.7 Changes since the 2011 <strong>Annual</strong> <strong>Planning</strong> <strong>Report</strong>Table 7-5 lists the specific issues that are either new or no longer relevant within theforecast period when compared to last year's report.Table 7-5: Changes since 2011IssuesAlbany supply transformer capacityBream Bay supply transformer capacityDargaville supply transformer capacityHenderson–Wellsford 110 kV transmission capacityKaikohe supply transformer capacityKaitaia transmission securityKaitaia supply transformer capacityMarsden interconnection transformer capacityMaungaturoto supply transformer capacitySilverdale supply transformer capacityChangeNew issue.New issue.New issue.New issue.Removed. These assets have beentransferred to Top Energy.New issue.New issue.New issue.7.8 Northland transmission capabilityTable 7-6 summarises issues involving the Northland region for the next 15 years.For more information about a particular issue, refer to the listed section number.92<strong>2012</strong> <strong>Annual</strong> <strong>Planning</strong> <strong>Report</strong> © <strong>Transpower</strong> New Zealand Limited <strong>2012</strong>. All rights reserved.
Chapter 7: Northland RegionTable 7-6: Northland region transmission issuesSectionnumberIssueRegional7.8.1 Henderson interconnecting transformer capacity7.8.2 Henderson–Wellsford transmission capacity7.8.3 Marsden interconnecting transformer capacity7.8.4 North Auckland and the Northland region transmission capacity7.8.5 North of Henderson transmission capacity7.8.6 North of Huapai transmission security7.8.7 North of Marsden low voltage7.8.8 Upper North Island voltage instability for grid backbone contingenciesSite by grid exit point7.8.9 Albany supply transformer capacity7.8.10 Bream Bay supply transformer capacity7.8.11 Dargaville transmission security7.8.12 Dargaville supply transformer capacity7.8.13 Henderson supply transformer capacity7.8.14 Kaikohe–Maungatapere 110 kV transmission capacity7.8.15 Kensington transmission security and supply transformer capacity7.8.16 Maungatapere supply transformer capacity7.8.17 Maungaturoto supply transformer capacity7.8.18 Silverdale supply transformer capacity7.8.19 Wellsford supply transformer capacity7.8.1 Henderson interconnecting transformer capacityProject reference: HEN-POW_TFR_DIS-EHMT-01Project status/purpose: Base Capex, minor enhancementIndicative timing: 2023Indicative cost band: AIssueThere are two 220/110 kV interconnecting transformers at Henderson, providing:a total nominal installed capacity of 400 MVA, andn-1 capacity of 229/229 MVA 36 (summer/winter).Switchgear on the Henderson T1 transformer restricts its n-1 capacity to 229 MVA.Loading on these transformers may exceed their n-1 capacity during peak load from2014.In addition, Vector is able to transfer approximately 90 MW of load from Penrose toMount Roskill. If this occurs during peak load periods, the load on the Hendersoninterconnecting transformers will exceed their n-1 capacity.36The transformers’ capacity is limited by switchgear; with this limit resolved, the n-1 capacity will be254/270 MVA (summer/winter).<strong>2012</strong> <strong>Annual</strong> <strong>Planning</strong> <strong>Report</strong> © <strong>Transpower</strong> New Zealand Limited <strong>2012</strong>. All rights reserved. 93
Chapter 7: Northland RegionSolutionCommissioning of the NAaN project, scheduled for completion in 2013, will delay theissue to 2023.If required, we will replace the limiting switchgear on the Henderson interconnectingtransformers to enable full use of their post-contingency capacity of 254/270 MVA(summer/winter).In addition, the interconnecting transformers at Henderson have an expected end-oflifewithin the forecast period. The appropriate replacement option will be consideredand carried out in conjunction with the Albany interconnecting transformerreplacement (see Section 7.5).7.8.2 Henderson–Wellsford transmission capacityProject reference:Project status/purpose:Indicative timing: 2024Indicative cost band:HEN_MPE-TRAN-EHMT-01Possible, to meet the Grid Reliability Standard (not core grid)To be advisedIssueThere are two 110 kV circuits between Henderson and Wellsford, each rated at55/68 MVA (summer/winter). An outage of one Henderson–Wellsford circuit willcause the other circuit to exceed its n-1 capacity from 2024.SolutionThe most likely solution will be to split the 110 kV network between Henderson andMaungatapere to remove the overload. Another possible option is to thermallyupgrade the Henderson–Wellsford circuits. The options to resolve the issue will beinvestigated closer to the need date.7.8.3 Marsden interconnecting transformer capacityProject reference:Project status/purpose:Indicative timing: 2023Indicative cost band:MDN-POW_TFR-DEV-01Possible, to meet the Grid Reliability Standard (core grid)New interconnecting transformer: BIssueThere are two 220/110 kV interconnecting transformers at Marsden, providing:a total nominal installed capacity of 300 MVA, andn-1 capacity of 180/188 MVA (summer/winter).Loading on these transformers may exceed their n-1 capacity during peak load from2023.SolutionThe Marsden site is developed to install a third 220/110 kV transformer, and convertthe 220 kV and 110 kV buses to three zones.7.8.4 North Auckland and the Northland region transmission capacityProject context:Project reference:Project status/purpose:NAaNALB_PAK-TRAN-DEV-01Committed, to meet the Grid Reliability Standard (core grid)94<strong>2012</strong> <strong>Annual</strong> <strong>Planning</strong> <strong>Report</strong> © <strong>Transpower</strong> New Zealand Limited <strong>2012</strong>. All rights reserved.
Chapter 7: Northland RegionIndicative timing: Q4 2013Indicative cost band:GIssueTwo 220 kV Henderson–Otahuhu circuits supply the Northland region’s load, with theparallel 110 kV Otahuhu–Roskill–Hepburn–Henderson circuits supplying MountRoskill from both the north and south under normal grid configuration. The 220 kVcircuit capacities are limited by station equipment at Henderson to 915 MVA percircuit. The conductor rating of each circuit is 938/984 MVA (summer/winter).An outage of a Henderson–Otahuhu circuit may cause the Henderson–Southdowncircuit to exceed its branch rating by winter 2017.A double-circuit outage of the 220 kV Henderson–Otahuhu line will result in asignificantly lower capacity for supplying the North Auckland and Northland load, viathe 110 kV transmission network.SolutionWe are committed to implementing the NAaN project in 2013 (see Chapter 8 for moreinformation). This will ensure loading on the 220 kV Henderson–Otahuhu circuitsremains within the n-1 capacity, and improve reliability of supply to the Northlandregion.7.8.5 North of Henderson transmission capacityProject status/purpose:This issue is for information onlyIssueThe 220 kV Henderson–Huapai 1 circuit is rated at 457/457 MVA 37 (summer/winter).An outage of the parallel 220 kV Albany–Henderson 3 circuit may cause the 220 kVHenderson–Huapai 1 circuit to exceed its branch rating during peak winter loadperiods.The present system allows transfer of the Liverpool Street load through Vector’snetwork to Mount Roskill, if required. This will increase the loading on theHenderson–Huapai 1 circuit.SolutionCompletion of the NAaN project in 2013 provides a second 220 kV connection intoAlbany from the south, resolving the capacity issue in the long term.7.8.6 North of Huapai transmission securityProject reference:Project status/purpose:Indicative timing: 2013Indicative cost band:HPI-BUSC-DEV-01Base Capex, minor enhancementAIssueThe Huapai switching station comprises three circuit breakers:one on each of the 220 kV circuits connecting Marsden and Bream Bay, and37The capacity of this circuit is limited by substation equipment at Henderson; with this limit resolved,the capacity will be 666/740 MVA (summer/winter).<strong>2012</strong> <strong>Annual</strong> <strong>Planning</strong> <strong>Report</strong> © <strong>Transpower</strong> New Zealand Limited <strong>2012</strong>. All rights reserved. 95
Chapter 7: Northland Regiona shared circuit breaker for the two incoming 220 kV circuits from Albany andHenderson.If the shared circuit breaker fails to trip following a fault, both the incoming circuits willtrip, leaving the entire load north of Huapai supplied by the low capacity 110 kVHenderson–Maungatapere circuits. This will result in significant load shedding.SolutionSplitting the Huapai bus once the NAaN project is completed (see Chapter 8) willresolve this issue.7.8.7 North of Marsden low voltageProject reference:Project status/purpose:Indicative timing:Indicative cost band:MDN-C_BANKS-DEV-01Possible, to meet the Grid Reliability Standard (not core grid) and/or customerspecificTo be advisedTo be advisedIssueIncreasing load lowers the voltage in the Northland region. An outage of:the 220 kV Huapai–Marsden circuit from 2013 will cause low voltages at theMarsden and Bream Bay 220 kV buses and at the Maungatapere, Dargaville,Kaikohe, and Kaitaia supply buses.one of the 110 kV Marsden–Maungatapere circuits will cause low voltages atMaungatapere, Kaikohe, and Dargaville from 2013.one of the 110 kV Kaikohe–Maungatapere circuits will cause low voltages atKaikohe from 2013.SolutionThe low voltage issues due to the loss of a 220 kV circuit will be solved by installingtwo STATCOMs at Marsden, with commissioning scheduled for 2014 (see Chapter 8,Section 8.8.1). This will resolve the low voltage issue for the forecast period andbeyond.The low voltage issue due to the loss of a 110 kV circuit can be resolved as atransmission investment by installing reactive support at Kaitaia and/orMaungatapere, or as a non-transmission alternative by installing capacitors atKaikohe. The reactive support is most effective if installed at Kaitaia to avoid lowvoltages at all other substations. Greater amounts of reactive support are required ifthe reactive support is solely at Kaikohe or Maungatapere.Addressing the low voltage issue due to the loss of a 110 kV circuit involves atrade-off between operating at a lower than normal voltage, transmission investmentin reactive support, and investment within the distribution network (non-transmissionalternatives). Options include 38 :operating at a low voltage (for example, 0.9 p.u. at the Kaitaia 110 kV bus), andfollowing a circuit outage, automatically switching in the existing binary switchedcapacitors at Kaitaiaoperating within the standard voltage range by switching in the Kaitaia capacitors,and accepting a 20% voltage drop should the Kaitaia capacitors trip38The figures given in the options list are with the existing 4 x 5 Mvar of capacitors at Kaikohe, withinTop Energy’s network. Other figures apply if the capacitors are not available.96<strong>2012</strong> <strong>Annual</strong> <strong>Planning</strong> <strong>Report</strong> © <strong>Transpower</strong> New Zealand Limited <strong>2012</strong>. All rights reserved.
Chapter 7: Northland Regionat Kaitaia, installing 20 Mvar of binary switched capacitors (a duplicate of theexisting binary switched capacitor bank at Kaitaia), so the voltage is always withinthe standard range, orat Maungatapere, installing 60 Mvar by 2018 and 80 Mvar by 2022, so thevoltage is always within the standard range.Capacitor-based reactive support at Maungatapere will require many small capacitorbanks to limit the voltage step when switching the capacitors. This may result in anunrealistic capacitor bank installation, requiring a STATCOM instead.Installing capacitors at Kaitaia will result in a leading power factor at the <strong>Transpower</strong>and Top Energy boundary following asset transfer.Addressing the low voltage issues due to 110 kV circuit outages will also address thelow voltage issues due to 220 kV circuit outages beyond 2018.7.8.8 Upper North Island voltage instability for grid backbone contingenciesProject status/purpose: See Chapter 6, Sections 6.4.1 and 6.4.2IssueAs demand in the Auckland and Northland regions grows, voltage stability marginswill deteriorate to the point where there are several generators and circuitcontingencies on the grid backbone that can cause voltage control problems withinthe Northland region (see Chapter 6, Sections 6.4.1 and 6.4.2, for more information).SolutionWe have proposed and committed to a number of projects to solve the issuesidentified. These are detailed under the North Island Grid Backbone Issues andProject Options (see Chapter 6, Sections 6.4.1 and 6.4.2 for more information).7.8.9 Albany supply transformer capacityProject reference:Project status/purpose:Indicative timing: 2023Indicative cost band:ALB-POW_TFR_EHMT-01Base Capex, minor enhancementAIssueThree 220/33 kV transformers (two rated at 100 MVA and one at 120 MVA) supplyAlbany’s load, providing:a total nominal installed capacity of 320 MVA, andn-1 capacity of 234/234 MVA 39 (summer/winter).The peak load at Albany is forecast to exceed the transformers’ n-1 winter capacityby approximately 1 MW in 2023, increasing to approximately 16 MW in 2027 (seeTable 7-7).Table 7-7: Albany supply transformer overload forecastGrid exitpointPowerfactorNext 5 yearsTransformer overload (MW)5-15 years out<strong>2012</strong> 2013 2014 2015 2016 2017 2019 2021 2023 2025 2027Albany 0.99 0 0 0 0 0 0 0 0 1 9 1639The transformers’ capacity is limited by a protection limit; with this limit resolved, the n-1 capacity willbe 244/258 MVA (summer/winter).<strong>2012</strong> <strong>Annual</strong> <strong>Planning</strong> <strong>Report</strong> © <strong>Transpower</strong> New Zealand Limited <strong>2012</strong>. All rights reserved. 97
Chapter 7: Northland RegionSolutionWe will convert the Albany 33 kV outdoor switchgear to an indoor switchboard withinthe next 5-10 years. This will resolve the transformers’ protection and circuit breakerlimits until 2027. Future investment will be customer driven.7.8.10 Bream Bay supply transformer capacityProject reference:Project status/purpose:Indicative timing: 2021Indicative cost band:BRB-POW_TFR_PTN-EHMT-01Base Capex, minor enhancementAIssueTwo 220/33 kV transformers supply Bream Bay’s load, providing:a total nominal installed capacity of 200 MVA, andn-1 capacity of 59/59 MVA 40 (summer/winter).The peak load at Bream Bay is forecast to exceed the transformers’ n-1 summercapacity by approximately 1 MW in 2021, increasing to approximately 4 MW in 2027(see Table 7-7).Table 7-8: Bream Bay supply transformer overload forecastGrid exitpointPowerfactorNext 5 yearsTransformer overload (MW)5-15 years out<strong>2012</strong> 2013 2014 2015 2016 2017 2019 2021 2023 2025 2027Bream Bay 0.95 0 0 0 0 0 0 0 1 2 3 4SolutionIncreasing the transformers’ protection limits will resolve the overload issue beyondthe forecast period.7.8.11 Dargaville transmission securityProject reference:Project status/purpose:Indicative timing: <strong>2012</strong>-2014Indicative cost band:MPE-POW_TFR-REPL-01Base Capex, replacementBIssueTwo 110/50 kV transformers (rated at 10 MVA and 30 MVA) at Maungatapereconnected to two 50 kV circuits supply Dargaville’s load. These transformers provide:a total nominal installed capacity of 40 MVA, andn-1 capacity of 13/14 MVA (summer/winter).The total load on the Maungatapere transformers equals the Dargaville load plustransmission line losses. The peak load at Dargaville already exceeds thetransformers’ n-1 summer capacity by 2 MW, and the overload is forecast to increaseto approximately 6 MW in 2027.40The transformers’ capacity is limited by protection limits; with this limit resolved, the n-1 capacity willbe 108/108 MVA (summer/winter).98<strong>2012</strong> <strong>Annual</strong> <strong>Planning</strong> <strong>Report</strong> © <strong>Transpower</strong> New Zealand Limited <strong>2012</strong>. All rights reserved.
Chapter 7: Northland RegionSolutionBoth 110/50 kV transformers at Maungatapere have an expected end-of-life withinthe next five years. Two 20 or 25 MVA replacement transformers will have sufficientcapacity for the forecast period and beyond. We will discuss with Northpower thedetails of the timing and capacity for the replacement transformers.7.8.12 Dargaville supply transformer capacityProject reference:Project status/purpose:Indicative timing: 2013Indicative cost band:DAR-POW-TFR-EHMT-01Possible, customer-specificAdd fans and/or pumps: AIssueTwo 50/11 kV transformers supply Dargaville’s load, providing:a total nominal installed capacity of 15 MVA, andn-1 capacity of 14/14 MVA (summer/winter).The peak load at Dargaville is forecast to exceed the transformers’ n-1 summercapacity by approximately 1 MW in <strong>2012</strong>, increasing to approximately 5 MW in 2027(see Table 7-9).Table 7-9: Dargaville supply transformer overload forecastGrid exitpointPowerfactorNext 5 yearsTransformer overload (MW)5-15 years out<strong>2012</strong> 2013 2014 2015 2016 2017 2019 2021 2023 2025 2027Dargaville 0.97 1 2 2 2 2 3 3 4 4 5 5SolutionWe will discuss future supply options with Northpower. Possible options include:using the transformers’ 15 MVA short term n-1 capacityusing operational measures to manage the peak load within the transformers’ n-1capacity, andincreasing the transformers’ thermal capacity by adding fans and/or pumps.Future investment will be customer driven.7.8.13 Henderson supply transformer capacityProject reference:Project status/purpose:Indicative timing:Indicative cost band:HEN-POW_TFR-EHMT-01Possible, customer-specificTo be advisedBIssueTwo 220/33 kV transformers supply Henderson’s load, providing:a total nominal installed capacity of 240 MVA, andn-1 capacity of 135/135 MVA 41 (summer/winter).41The transformers’ capacity is limited by a bus section, circuit breaker and disconnector; with theselimits resolved, the n-1 capacity will be 146/153 MVA (summer/winter).<strong>2012</strong> <strong>Annual</strong> <strong>Planning</strong> <strong>Report</strong> © <strong>Transpower</strong> New Zealand Limited <strong>2012</strong>. All rights reserved. 99
Chapter 7: Northland RegionThe peak load at Henderson is forecast to exceed the transformers’ n-1 wintercapacity by approximately 2 MW in <strong>2012</strong>, increasing to approximately 59 MW in 2027(see Table 7-10).Table 7-10: Henderson supply transformer overload forecastGrid exitpointPowerfactorNext 5 yearsTransformer overload (MW)5-15 years out<strong>2012</strong> 2013 2014 2015 2016 2017 2019 2021 2023 2025 2027Henderson 0.99 2 6 10 14 18 23 32 40 47 54 59SolutionWe will also convert the Henderson 33 kV outdoor switchgear to an indoorswitchboard within the next five years. This will raise the n-1 limit but will not resolvethe issue.In addition, Vector has the ability to shift load between Henderson and HepburnRoad, providing an operational solution when the issue arises. A longer-term optionis to install a third supply transformer.7.8.14 Kaikohe–Maungatapere 110 kV transmission capacityProject reference:Project status/purpose:Indicative timing:Indicative cost band:KOE_MPE-TRAN-EHMT-01Possible, customer-specificTo be advisedTo be advisedIssueTwo 110 kV Kaikohe–Maungatapere circuits supply Kaikohe, with onwardtransmission to Kaitaia. The two circuits provide:a total nominal installed capacity of 141/155 MVA (summer/winter), andn-1 capacity of 63/77 MVA (summer/winter).The combined peak load of Kaikohe and Kaitaia is forecast to exceed thetransmission n-1 capacity from 2014 when Ngawha is not generating.SolutionThe Ngawha generation station is embedded behind the Kaikohe supply bus. WithNgawha generating 10 MW, the issue can be delayed until 2019. If Ngawha isgenerating nearer its peak of 25 MW, the issue can be delayed to the end of theforecast period.The issue may also be managed operationally by Top Energy limiting the net peakload to the circuit’s capacity. A possible longer-term option is to thermally upgradethe Kaikohe–Maungatapere circuits.Future investment will be customer driven.7.8.15 Kensington transmission security and supply transformer capacityProject reference:Project status/purpose:Indicative timing:Indicative cost band:KEN-SUB-EHMT-01Possible, customer-specificTo be advisedTo be advised100<strong>2012</strong> <strong>Annual</strong> <strong>Planning</strong> <strong>Report</strong> © <strong>Transpower</strong> New Zealand Limited <strong>2012</strong>. All rights reserved.
Chapter 7: Northland RegionIssueTwo 110 kV circuits supply Kensington’s load, providing:a total nominal installed capacity of 293/323 MVA (summer/winter), andn-1 capacity of 70/70 MVA 42 (summer/winter).There is no 110 kV bus at Kensington. Each circuit operates in series with a110/33 kV transformer. A fault on either the transmission circuit or transformer willcause both the circuit and transformer to be out of service.Two 110/33 kV transformers supply Kensington’s load, providing:a total nominal installed capacity of 100 MVA, andn-1 capacity of 59/62 MVA (summer/winter).An outage of one Kensington–Maungatapere circuit and a supply transformer willcause:the other circuit to exceed its winter branch rating from <strong>2012</strong>, andthe other supply transformer to exceed its n-1 winter capacity by approximately12 MW in <strong>2012</strong>, increasing to approximately 32 MW in 2027 (see Table 7-11).Table 7-11: Kensington supply transformer overload forecastGrid exitpointPowerfactorNext 5 yearsTransformer overload (MW)5-15 years out<strong>2012</strong> 2013 2014 2015 2016 2017 2019 2021 2023 2025 2027Kensington 0.99 12 13 14 16 17 18 21 24 26 29 32SolutionNorthpower can transfer significant load within its network from Kensington toMaungatapere following a line and a transformer failure and does not consider aproject necessary at this time.In the longer term, developments to resolve this issue include:an upgrade of the Kensington grid exit point, including supply transformers andthe 33 kV switchboard, andresolving the protection limits on the Kensington–Maungatapere circuits.In addition, the Kensington supply transformers have an expected end-of-life withinthe forecast period. Future investment will be customer driven.7.8.16 Maungatapere supply transformer capacityProject status/purpose:This issue is for information onlyIssueTwo 110/33 kV transformers supply Maungatapere’s load, providing:a total nominal installed capacity of 60 MVA, andn-1 capacity of 37/39 MVA (summer/winter).Maungatapere’s summer demand peaks are approaching its winter peaks. The peakload at Maungatapere is forecast to exceed the transformers’ n-1 summer capacity byapproximately 20 MW in <strong>2012</strong>, increasing to approximately 39 MW in 2027 (seeTable 7-12).42The circuits’ capacity is limited by the protection; with this limit resolved, the n-1 capacity will be152/152 MVA (summer/winter).<strong>2012</strong> <strong>Annual</strong> <strong>Planning</strong> <strong>Report</strong> © <strong>Transpower</strong> New Zealand Limited <strong>2012</strong>. All rights reserved. 101
Chapter 7: Northland RegionTable 7-12: Maungatapere supply transformer overload forecastGrid exitpointPowerfactorNext 5 yearsTransformer overload (MW)5-15 years out<strong>2012</strong> 2013 2014 2015 2016 2017 2019 2021 2023 2025 2027Maungatapere 0.96 20 21 23 24 25 26 29 31 34 36 39Northpower can transfer significant load within its network between Maungatapereand Kensington following a transformer failure. This effectively makes Maungatapereand Kensington a single load when considering supply transformer capacity.SolutionLoad growth at Maungatapere is expected to be limited by Northpower, which advisesthat it intends to permanently shift load from this grid exit point to Kensington inapproximately 2016 to avoid the need to upgrade. The Maungatapere 110/33 kVtransformers have an expected end-of-life within the next 5-10 years.7.8.17 Maungaturoto supply transformer capacityProject reference:Project status/purpose:Indicative timing: 2019Indicative cost band:MTO-POW_TFR_PTN-EHMT-01Base Capex, minor enhancementAIssueTwo 110/33 kV transformers supply Maungaturoto’s load, providing:a total nominal installed capacity of 50 MVA, andn-1 capacity of 20/20 MVA 43 (summer/winter).The peak load at Maungaturoto is forecast to exceed the transformers’ n-1 wintercapacity by 1 MW in 2019, increasing to approximately 3 MW in 2027 (see Table7-13).Table 7-13: Maungaturoto supply transformer overload forecastGrid exitpointPowerfactorNext 5 yearsTransformer overload (MW)5-15 years out<strong>2012</strong> 2013 2014 2015 2016 2017 2019 2021 2023 2025 2027Maungaturoto 0.99 0 0 0 0 0 0 1 1 2 3 3SolutionWe will convert the Maungaturoto 33 kV outdoor switchyard to an indoor switchboardwithin the next 5-10 years. Protection and metering limits will be resolved at thesame time. This will solve the supply transformer capacity issue for the forecastperiod and beyond.7.8.18 Silverdale supply transformer capacityProject reference:Project status/purpose:Indicative timing: 2023Indicative cost band:SVL-POW_TFR_PTN-EHMT-01Base Capex, minor enhancementA43The transformers’ capacity is limited by protection and metering limits; with these limits resolved, then-1 capacity will be 31/33 MVA (summer/winter).102<strong>2012</strong> <strong>Annual</strong> <strong>Planning</strong> <strong>Report</strong> © <strong>Transpower</strong> New Zealand Limited <strong>2012</strong>. All rights reserved.
Chapter 7: Northland RegionIssueTwo 110/33 kV transformers supply Silverdale’s load, providing:a total nominal installed capacity of 220 MVA, andn-1 capacity of 109/109 MVA 44 (summer/winter).The peak load at Silverdale is forecast to exceed the transformers’ n-1 wintercapacity by approximately 1 MW in 2023, increasing to approximately 9 MW in 2027(see Table 7-14).Table 7-14: Silverdale supply transformer overload forecastGrid exitpointPowerfactorNext 5 yearsTransformer overload (MW)5-15 years out<strong>2012</strong> 2013 2014 2015 2016 2017 2019 2021 2023 2025 2027Silverdale 0.99 0 0 0 0 0 0 0 0 1 6 9SolutionRecalibrating the metering parameters resolves the issue for the forecast period andbeyond.7.8.19 Wellsford supply transformer capacityProject reference:Project status/purpose:Indicative timing: 2013Indicative cost band:WEL-POW_TFR-EHMT-01Base Capex, minor enhancementAIssueTwo 110/33 kV transformers supply Wellsford’s load, providing:a total nominal installed capacity of 60 MVA, andn-1 capacity of 31/31 MVA 45 (summer/winter).The peak load at Wellsford already exceeds the transformers’ n-1 winter capacity,and the overload is forecast to increase to approximately 20 MW in 2027 (see Table7-15). Both existing transformers are made up of three single-phase units, with nospare unit on site.Table 7-15: Wellsford supply transformer overload forecastGrid exitpointPowerfactorNext 5 yearsTransformer overload (MW)5-15 years out<strong>2012</strong> 2013 2014 2015 2016 2017 2019 2021 2023 2025 2027Wellsford 0.99 7 8 9 9 10 11 13 15 17 18 20SolutionIn the short term, we are investigating resolving the protection and metering limits toenable use of the transformers’ full capacity. This will increase the n-1 capacity to37/39 MVA (summer/winter), deferring the issue for two years.4445The transformers’ capacity is limited by a metering limit, followed by a cable limit (120 MVA); withthese limits resolved, the n-1 capacity will be 126/132 MVA (summer/winter).The transformers’ capacity is limited by protection equipment and metering limits; with these limitsresolved, the n-1 capacity will be 37/39 MVA (summer/winter).<strong>2012</strong> <strong>Annual</strong> <strong>Planning</strong> <strong>Report</strong> © <strong>Transpower</strong> New Zealand Limited <strong>2012</strong>. All rights reserved. 103
Chapter 7: Northland RegionBoth 110/33 kV transformers at Wellsford have an expected end-of-life within the nextfive years. We will discuss with Vector the rating and timing for the replacementtransformers.7.9 Other regional items of interestThere are no other items of interest identified to date beyond those set out in Section7.8. See Section 7.10 for more information about specific generation proposalsrelevant to this region.7.10 Northland generation proposals and opportunitiesThis section details relevant regional issues for selected generation proposals underinvestigation by developers and in the public domain, or other generationopportunities.The maximum generation that can be connected depends on several factors andusually falls within a range. Generation developers should consult with us at an earlystage of their investigations to discuss connection issues. See our website for moreinformation about connecting generation. 467.10.1 Maximum regional generationThe following maximum generation estimates assume a light North Island load profileand that existing generation is high (Ngawha generating 25 MW).For generation connected at the Maungatapere 110 kV bus, the maximum generationthat can be injected under n-1 is approximately 270 MW. The constraint is due to oneMarsden interconnector when the other interconnector is out of service.For generation connected at the Huapai 220 kV bus, the maximum generation thatcan be injected under n-1 is approximately 560 MW. The constraint is due to theHenderson–Huapai 1 circuit overloading when Albany–Huapai 1 is out of service.This may increase to 750 MW if a substation equipment constraint on this circuit isremoved.7.10.2 Generation injection at Kaikohe and MaungatapereKaikoheIn addition to Ngawha generation, the combined generation injection at Kaikohe andKaitaia is limited to approximately 70 MW by the rating of the two 110 kV Kaikohe–Maungatapere circuits. Thermally upgrading the circuits will allow approximately100 MW of generation, while replacing the conductor will allow approximately140 MW of generation.The generation limits above can be increased to approximately 150 MW, 200 MWand 280 MW, respectively, if the additional generation is connected directly to theKaikohe bus and automatically tripped if a Kaikohe–Maungatapere circuit trips.Other parts of the transmission network may also limit the maximum level ofgeneration.MaungatapereGeneration of approximately 300-350 MW can be connected directly or indirectly atMaungatapere. This includes generation at Kaitaia, Kaikohe, and Dargaville and, forsome system configurations, generation connected to the 110 kV Henderson–Maungatapere line (see also Section 7.10.3). Higher levels of generation may be46http://www.transpower.co.nz/connecting-new-generation.104<strong>2012</strong> <strong>Annual</strong> <strong>Planning</strong> <strong>Report</strong> © <strong>Transpower</strong> New Zealand Limited <strong>2012</strong>. All rights reserved.
Chapter 7: Northland Regionpossible by replacing some equipment at substations, upgrading the Marsdeninterconnection capacity, and thermally upgrading the Henderson–Maungatapereline.7.10.3 Generation connected to the 110 kV Henderson–Maungatapere lineThere is a 110 kV double-circuit line from Henderson to Wellsford, Maungaturoto, andMaungatapere. Each circuit is rated at 56/68 MVA. Generation up to a total ofapproximately 200 MW can be connected, provided a system split is put in place withhalf the generation transmitted towards Maungatapere and half towards Henderson.In addition, if one circuit is out of service, the generation must be automaticallyreduced to match the capacity of the remaining circuit.The two circuits can be thermally upgraded to allow approximately 300 MW ofgeneration, or have replacement conductors to allow even greater generation.Generation transmitted towards Maungatapere forms part of the generation injectionlimit into Maungatapere (see Section 7.10.2 for more information).7.10.4 Generation connected to the 220 kV Huapai–Marsden lineThere is a 220 kV double-circuit line from Huapai (north of Auckland) to Marsden andBream Bay (in Northland), which is the main connection to the Northland region. Onecircuit is predominantly a simplex conductor and the other is a duplex conductor, withratings of 333/370 MVA and 666/740 MVA 47 , respectively.Generation can be connected along this line, not just at existing substations.Maximum generation of between 300 MW and 500 MW may be possible dependingon which circuit the generation connects into, with the simplex Bream Bay–Huapaiconductor being the limiting component. New generation elsewhere in the Northlandregion will reduce this limit.47The actual circuit rating is presently limited to 457 MVA due to some substation equipment, which isrelatively easy and inexpensive to replace in the context of generation connection. Therefore, thelimit is ignored in the context of this discussion.<strong>2012</strong> <strong>Annual</strong> <strong>Planning</strong> <strong>Report</strong> © <strong>Transpower</strong> New Zealand Limited <strong>2012</strong>. All rights reserved. 105
Chapter 8: Auckland Region8 Auckland Regional Plan8.1 Regional overview8.2 Auckland transmission system8.3 Auckland demand8.4 Auckland generation8.5 Auckland significant maintenance work8.6 Future Auckland projects summary and transmission configuration8.7 Changes since the 2011 <strong>Annual</strong> <strong>Planning</strong> <strong>Report</strong>8.8 Auckland transmission capability8.9 Other regional items of interest8.10 Auckland generation proposals and opportunities8.1 Regional overviewThis chapter details the Auckland regional transmission plan. We base this regionalplan on an assessment of available data, and welcome feedback to improve its valueto all stakeholders.Figure 8-1: Auckland Region106<strong>2012</strong> <strong>Annual</strong> <strong>Planning</strong> <strong>Report</strong> © <strong>Transpower</strong> New Zealand Limited <strong>2012</strong>. All rights reserved.
Chapter 8: Auckland RegionThe Auckland region has some of the highest load densities in New Zealand, coupledwith relatively low levels of local generation.We have assessed the Auckland region’s transmission needs over the next 15 yearswhile considering longer-term development opportunities. Specifically, thetransmission network needs to be flexible to respond to a range of future service andtechnology possibilities, taking into consideration:the existing transmission networkforecast demandforecast generationequipment replacement based on condition assessment, andpossible technological development.8.2 Auckland transmission systemThis section highlights the state of the Auckland regional transmission network. Theexisting transmission network is set out geographically in Figure 8-1 andschematically in Figure 8-2.Figure 8-2: Auckland transmission schematicNORTHLANDHenderson Hepburn RoadVECTOR CBD22 kVVECTOR CBD33 kVPenrose220 kV110 kVMount Roskill22 kV110 kVSouthdownPakuranga220 kV33 kV220 kVSCKEY220kV CIRCUIT110kV CIRCUITSUBSTATION BUSTRANSFORMERTEE POINTLOADMangere33 kV 110 kV220 kV110 kVOtahuhuCombinedCycleWiriSCOtahuhu110 kV22 kV220 kVCAPACITORUNDERGROUND CABLEBONDED CIRCUIT33 kV110 kV110 kVSCSYNCHRONOUS CONDENSER33 kVGENERATORTakaniniBombayGlenbrook33 kV 220 kV33 kV 220 kVDrury220 kVHuntlyWAIKATOOhinewai Whakamaru Arapuni HamiltonWAIKATO<strong>2012</strong> <strong>Annual</strong> <strong>Planning</strong> <strong>Report</strong> © <strong>Transpower</strong> New Zealand Limited <strong>2012</strong>. All rights reserved. 107
Chapter 8: Auckland Region8.2.1 Transmission into/through the regionAs approximately 70% of the Auckland and Northland regions’ peak electricitydemand is supplied by generation located south of Bombay, transmission isnecessary to keep the energy flowing into Auckland and through to North Aucklandand the Northland region.There are three major projects and a series of small projects that we are progressingto ensure that the Auckland region has secure transmission as demand continues togrow.Broader project descriptions that provide a context for the issues identified in latersections include the:North Island Grid Upgrade (NIGU) projectNorth Auckland and Northland (NAaN) grid upgrade project, andUpper North Island Reactive Support (UNIRS) project.North Island Grid Upgrade (NIGU) projectThis committed project includes building a new transmission link into the Pakurangasubstation from the south, operating the existing Otahuhu–Pakuranga line at itsdesign voltage of 220 kV (previously operating at 110 kV), and providing additionalreactive support for the area to maintain voltages in the Auckland and Northlandregions (see Chapter 6, Sections 6.3.2 and 6.4.2).This project:provides additional transmission capacity into the Auckland region (see Section6.4.2)provides diversity for transmission from the south into the Auckland region (allexisting 220 kV transmission circuits terminate into Otahuhu), andconverts Pakuranga from 110 kV to 220 kV, which reduces the load on the110 kV system supplying the eastern side of the Auckland region, includingPenrose.North Auckland and Northland (NAaN) grid upgrade projectThis committed project adds new transmission capacity between the Pakuranga,Penrose, and Albany substations. It also enables the building of new grid exit pointsat Hobson Street (Auckland CBD) and Wairau Road (North Shore). The NAaNproject reinforces transmission in the Auckland region and across into the Northlandregion. The 220 kV circuit from Pakuranga to Penrose will:increase capacity to the Penrose 220 kV bus by adding a third 220 kV circuitalongside the existing 220 kV Otahuhu–Penrose double-circuit line, andbuild on the NIGU project by increasing the diversity for transmission from thesouth into the Auckland region, as there will be 220 kV transmission fromPakuranga to Otahuhu and Penrose.The 220 kV circuit from Penrose to Albany will:increase capacity to the Northland region (including the North Isthmus) by addinga third 220 kV circuit from Otahuhu to Hendersonbuild on the NIGU project by increasing the diversity for transmission from thesouth into the Northland region (including the North Isthmus), as there will be220 kV transmission from Pakuranga, through Penrose, to Albanyprovide capacity and security to Vector’s Hobson Street and Wairau Roadsubstations through a 220 kV connection to the Albany–Penrose circuit, andenable Vector to redistribute load from existing grid exit points, particularly theAlbany 33 kV and 110 kV (Wairau Road) loads and Auckland CBD loads.108<strong>2012</strong> <strong>Annual</strong> <strong>Planning</strong> <strong>Report</strong> © <strong>Transpower</strong> New Zealand Limited <strong>2012</strong>. All rights reserved.
Chapter 8: Auckland RegionUpper North Island Reactive Support (UNIRS) projectThe purpose of this project is to relieve voltage stability issues associated with anoutage of major generators and/or circuits supplying the Upper North Island area (seeChapter 6). It includes installing dynamic reactive support at Penrose and Marsden.8.2.2 Transmission and distribution network within the regionThe Auckland transmission network consists of three layers: the 220 kV network,the 110 kV network, and the 110 kV distribution system belonging to the local linescompany, Vector.220 kV transmission networkThe 220 kV network supplies Otahuhu from the south, via a double-circuit line fromHuntly, a double-circuit line from Whakamaru via Ohinewai, and two single-circuitlines from Whakamaru.At Otahuhu the 220 kV network splits into two with one network supplying Penrosevia a double-circuit line, and the other network supplying the Northland region(including the North Isthmus) via a second double-circuit line to Henderson.The commissioning of a new 220 kV substation at Otahuhu (physically separatedfrom the existing switchyard) provides physical diversity, making the power supplymore resilient for rare but high-impact disturbances.110 kV transmission networkThe 110 kV transmission network is split into two parts.One half of the 110 kV network is a backup supply to Penrose, in parallel with the220 kV Otahuhu–Penrose double circuit line, with 220/110 kV interconnectors atOtahuhu and Penrose. The 110 kV system also connects to the Waikato regionby a Bombay–Wiri–Otahuhu double-circuit line, with power flow generally southout of Otahuhu.The other half of the 110 kV network supplies Mangere and Mount Roskill in adouble-circuit ring, extending from Mount Roskill through a double-circuit 110 kVconnection to substations in the Northland region (at Henderson and Albany).There are 220/110 kV interconnections at Otahuhu, Henderson, and Albany,making the 110 kV network parallel with the 220 kV Otahuhu–Henderson doublecircuitline. Power flow is generally into Mount Roskill on all circuits, from bothOtahuhu and the Northland region.110 kV distribution systemVector’s 110 kV distribution system connects from Penrose to Mount Roskill viaVector’s Liverpool Street substation, and is normally split between Mount Roskill andLiverpool Street. However, it is often used to transfer the Liverpool Street load (up to90 MW) between the Penrose and Mount Roskill substations.8.2.3 Reactive powerTo improve the network voltage and voltage stability, static capacitors are installed atthe Otahuhu, Penrose, and Bombay substations. Condensers at Otahuhu providedynamic reactive power under contract.8.2.4 Longer-term development pathWe have identified a longer-term development path to address issues involvingtransmission into, within and through the Auckland region, the details of which will berevisited when the need arises. The timing of the transmission investments dependson the net load of the Auckland and Northland regions. New generation in the region<strong>2012</strong> <strong>Annual</strong> <strong>Planning</strong> <strong>Report</strong> © <strong>Transpower</strong> New Zealand Limited <strong>2012</strong>. All rights reserved. 109
Chapter 8: Auckland Regionor demand-side response may defer transmission investment. Similarly, regionalgeneration retirement or increased demand will bring forward the need fortransmission investment.Possible future upgrades include, but are not limited to the following:Installation of series compensation on the 220 kV Pakuranga–Whakamarucircuits to improve load sharing with the other 220 kV circuits. Ultimately, theBrownhill–Whakamaru section of the Pakuranga–Whakamaru circuits will beupgraded to operate at 400 kV, by installing 400/220 kV transformers at Brownhilland Whakamaru.Increasing the transfer capacity into Auckland by building a switching station atBrownhill and cable circuits from Brownhill to Otahuhu.Possibly increasing the capacity of the 110 kV circuits between Arapuni andOtahuhu via thermal upgrades or re-conductoring with higher-capacityconductors.Transmission reinforcement within the Auckland region via additional cablesbetween Pakuranga, Penrose, and Mount Roskill.Transmission reinforcement into the Northland region via a second cablebetween Penrose and Albany.Additional static and dynamic reactive power support approximately every 2 to 3years to ensure power system voltage stability, and sufficient reserves aremaintained to cover the worst transmission contingency. The seriescompensation on the 220 kV Pakuranga–Whakamaru circuits may be broughtforward because of its positive contribution to voltage stability and reduction intransmission losses.Beyond the next 30 years, new transmission capacity may be required into Auckland,which can be provided by a new 400 kV line, an HVDC link or refurbishment of theexisting lines.The development of the Auckland spatial plan (particularly in the South Aucklandarea) will have a large influence on future options for increasing transmission capacityinto Auckland.Figure 8-3 provides an indication of the possible transmission development within andthrough Auckland in the longer term (beyond 2027).110<strong>2012</strong> <strong>Annual</strong> <strong>Planning</strong> <strong>Report</strong> © <strong>Transpower</strong> New Zealand Limited <strong>2012</strong>. All rights reserved.
Chapter 8: Auckland RegionFigure 8-3: Indicative Auckland and Northland region schematic beyond 2027VECTOR CBD NETWORKNORTHLANDHendersonHepburn RoadNORTHLANDAlbany / Wairau RoadHobsonStreet110 kV220 kVMVAR110 kV220 kV220 kVPenrose110 kVMountRoskillSouthdown220 kVPakurangaMVAR220 kVKEYMangere110 kV220 kV110 kVOtahuhuCombinedCycleMVAROtahuhu110 kV220 kVNEW ASSETSUPGRADED ASSETSWiri110 kV110 kVBombayBrownhill220 kV400 kVTakaniniHuntlyOhinewaiWhakamaru Arapuni HamiltonWAIKATOWhakamaru8.3 Auckland demandThe after diversity maximum demand (ADMD) for the Auckland region is forecast togrow on average by 2.1% annually over the next 15 years, from 1,530 MW in <strong>2012</strong> to2,078 MW by 2027. This is higher than the national average demand growth of 1.7%annually.Figure 8-4 shows a comparison of the 2011 and <strong>2012</strong> forecast 15-year maximumdemand (after diversity 48 ) for the Auckland region. The forecasts are derived usinghistorical data, and modified to account for customer information, where appropriate.The power factor at each grid exit point is also derived from historical data, and isused to calculate the real power capacity for power transformer and transmission line.See Chapter 4 for more information about demand forecasting.48The after diversity maximum demand (ADMD) for the region will be less than the sum of theindividual grid exit point peak demands, as it takes into account the fact that the peak demand doesnot occur simultaneously at all the grid exit points in the region.<strong>2012</strong> <strong>Annual</strong> <strong>Planning</strong> <strong>Report</strong> © <strong>Transpower</strong> New Zealand Limited <strong>2012</strong>. All rights reserved. 111
Chapter 8: Auckland RegionFigure 8-4: Auckland region after diversity maximum demand forecastLoad (MW)2200Auckland2000180016001400120010002011 APR Forecast800<strong>2012</strong> APR ForecastActual Peak6001997 1999 2001 2003 2005 2007 2009 2011 2013 2015 2017 2019 2021 2023 2025 2027Table 8-1 lists forecast peak demand (prudent growth) for each grid exit point for theforecast period, as required for the Grid Reliability <strong>Report</strong>.Table 8-1: Forecast annual peak demand (MW) at Auckland grid exit points to 2027Grid exit pointPowerfactorNext 5 yearsPeak demand (MW)5-15 years out<strong>2012</strong> 2013 2014 2015 2016 2017 2019 2021 2023 2025 2027Bombay 33 kV 1 0.98 25 26 26 27 14 14 14 0 0 0 0Bombay 110 kV 1 1.00 51 52 53 54 69 70 73 90 93 96 98Glenbrook 33 kV 1.00 32 33 33 34 35 35 37 38 39 40 41Glenbrook NZSteel0.99 116 116 120 120 120 120 120 120 120 120 120Hobson Street 2, 3 0.97 0 0 126 130 134 137 144 150 155 161 164Mangere 33 kV 0.94 115 119 122 126 129 133 141 149 155 161 166Mangere 110 kV 0.87 55 55 55 55 55 55 55 55 55 55 55Meremere 4 0.95 14 14 15 15 0 0 0 0 0 0 0Mt Roskill 22 kV 0.98 130 134 138 142 146 151 160 168 175 182 187Mt Roskill 110 kV– Kingsland0.97 66 68 70 72 74 76 80 83 86 89 91Otahuhu 0.99 66 69 71 73 75 77 82 86 91 95 100Pakuranga 0.98 163 167 171 174 178 182 189 196 203 210 218Penrose 22 kV 0.96 50 52 53 55 56 58 62 65 67 70 72Penrose 33 kV 0.98 300 309 318 328 338 348 369 388 403 420 432Penrose 110 kV -3 0.97 238 246 126 130 134 137 144 150 155 161 164Liverpool StreetPenrose 110 kV- Quay Street 5 NA 0 0 0 0 0 0 0 0 0 0 0Takanini 6 0.99 125 129 133 137 141 145 154 162 168 175 180Wiri 0.99 82 85 87 90 92 95 101 106 110 115 118112<strong>2012</strong> <strong>Annual</strong> <strong>Planning</strong> <strong>Report</strong> © <strong>Transpower</strong> New Zealand Limited <strong>2012</strong>. All rights reserved.
Chapter 8: Auckland RegionGrid exit pointPowerfactorNext 5 yearsPeak demand (MW)5-15 years out<strong>2012</strong> 2013 2014 2015 2016 2017 2019 2021 2023 2025 20271. The customer advised that approximately half of the load will shift from Bombay 33 kV to Bombay110 kV in 2016, with the balance of the load shifting in 2020.2. A new grid exit point at Hobson Street is planned to be commissioned in 2013/2014. Some of thePenrose–Liverpool Street load will be transferred to Hobson Street.3. The 50/50 load split between Hobson Street and Penrose–Liverpool Street is an estimate only.Paralleling of the Vector and <strong>Transpower</strong> networks between these grid exit points is beingconsidered.4. The customer advised that the load at Meremere will be shifted to Huntly (in the Waikato region) in2016.5. The Penrose 110 kV–Quay Street load has been transferred to Penrose–Liverpool Street and thePenrose–Quay Street circuits decommissioned.6. The customer advised that their forecast is lower than <strong>Transpower</strong>’s forecast.8.4 Auckland generationThe Auckland region’s generation capacity is approximately 681 MW.Table 8-2 lists the generation forecast for each grid injection point for the forecastperiod, as required for the Grid Reliability <strong>Report</strong>. This includes all known andcommitted generation stations including those embedded within the relevant locallines company’s network (Vector or Counties Power). 49No new generation is known to be committed in the Auckland region for the forecastperiod.Table 8-2: Forecast annual generation capacity (MW) at Auckland grid injection points to2027 (including existing and committed generation)Grid injection point(location if embedded)Next 5 yearsGeneration capacity (MW)5-15 years out<strong>2012</strong> 2013 2014 2015 2016 2017 2019 2021 2023 2025 2027Glenbrook 1 112 112 112 112 112 112 112 112 112 112 112Mangere (WatercareMangere)7 7 7 7 7 7 7 7 7 7 7Otahuhu B CCGT 380 380 380 380 380 380 380 380 380 380 380Otahuhu(Greenmount Landfill)Penrose (AucklandHospital)5 5 5 5 5 5 5 5 5 5 54 4 4 4 4 4 4 4 4 4 4Southdown CCGT 170 170 170 170 170 170 170 170 170 170 170Takanini(Whitford Landfill)3 3 3 3 3 3 3 3 3 3 31. This is a 38 MW embedded generating unit with a continuous output rating of approximately 25 MW.8.5 Auckland significant maintenance workOur capital project and maintenance works are integrated to enable system issues tobe resolved if possible when assets are replaced or refurbished. Table 8-3 lists thesignificant maintenance-related work 50 proposed for the Auckland region for the next15 years that may significantly impact related system issues or connected parties.4950Only generators with capacity greater than 1 MW are listed. Generation capacity is rounded to thenearest megawatt.This may include replacement of the asset due to its condition assessment.<strong>2012</strong> <strong>Annual</strong> <strong>Planning</strong> <strong>Report</strong> © <strong>Transpower</strong> New Zealand Limited <strong>2012</strong>. All rights reserved. 113
Chapter 8: Auckland RegionTable 8-3: Proposed significant maintenance workDescriptionBombay supply transformersexpected end-of-life, and 33 kVoutdoor to indoor conversionTentativeyear2018-20202016-2018Related system issuesBombay supply transformer capacities are sufficient forthe forecast period. The customer may relinquish33 kV supply from Bombay within 10-20 years.Mangere 33 kV outdoor toindoor conversionMount Roskill supplytransformer T3 expected end-oflife,and 22 kV outdoor to indoorconversionOtahuhu interconnectingtransformer expected end-of-lifeOtahuhu supply transformersexpected end-of-lifePenrose T10 interconnectingtransformer expected end-of-life2014-2016 The forecast load will exceed the transformer n-1capacity from <strong>2012</strong>. The n-1 capacity is limited byprotection limit. If appropriate, the work to resolve thislimit will be coordinated with the 33 kV outdoor to indoorconversion work. See Section 8.8.5 for moreinformation.2015-2019 The Mount Roskill load is forecast to exceed thetransformer n-1 capacity from <strong>2012</strong>. The n-1 capacity islimited by a few branch components initially, and thenthe transformers need a capacity upgrade by 2020 tomeet n-1 capacity. See Section 8.8.6 for moreinformation.2019-2021 The options to replace the transformers must becoordinated with the:Penrose T10 interconnecting transformer replacement –see Section 8.8.3 for more informationOtahuhu–Wiri transmission capacity issue – see Section8.8.8 for more information, andOtahuhu–Penrose 110 kV transmission capacity issue –see Section 8.8.102021-2023 The Otahuhu load already exceeds the transformers’n-1 capacity. See Section 8.8.7 for more information.2017-2019 This work will be coordinated with the Otahuhuinterconnecting transformer replacement. See Section8.8.3 for more information.Penrose supply transformersexpected end-of-life, and 33 kVoutdoor to indoor conversion2026-2028<strong>2012</strong>-2014A spare transformer enables us to manage the existingthree supply transformers for the next 15 years. See8.8.11 for more informationTakanini 33 kV outdoor toindoor conversionWiri supply transformerexpected end-of-life and 33 kVoutdoor to indoor conversion2014-2016 Takanini supply transformer n-1 capacity is limited by afew transformer branch component limits. Ifappropriate, the work to resolve these limits will becoordinated with the 33 kV outdoor to indoor conversionwork. See Section 8.8.12 for more information.2014-2017 The Wiri load is forecast to exceed the transformer n-1capacity by 2019. See Section 0 for more information.8.6 Future Auckland projects summary and transmission configurationTable 8-4 lists projects to be carried out in the Auckland region within the next 15years.Figure 8-5 shows the possible configuration of Auckland transmission in 2027, withnew assets, upgraded assets, and assets undergoing significant maintenance withinthe forecast period.Table 8-4: Projects in the Auckland region up to 2027Site Projects StatusAlbany–Penrose 220 kV cables between Albany and Penrose. CommittedBrownhill –WhakamaruBrownhill–Pakuranga400 kV capable double-circuit transmission line. Committed220 kV cables between Brownhill and Pakuranga. CommittedBombay Replace 110/33 kV supply transformers. Base Capex114<strong>2012</strong> <strong>Annual</strong> <strong>Planning</strong> <strong>Report</strong> © <strong>Transpower</strong> New Zealand Limited <strong>2012</strong>. All rights reserved.
Chapter 8: Auckland RegionSite Projects StatusConvert 33 kV outdoor switchgear to an indoor switchboard.Base CapexHobson Street New substation at Hobson Street. CommittedMangereMount RoskillOtahuhuResolve supply transformer protection limits.Convert 33 kV outdoor switchgear to an indoor switchboard.Upgrade supply transformer branch limiting components.Replace Mount Roskill T3 supply transformer.Convert 22 kV outdoor switchgear to an indoor switchboard.Replace Otahuhu T2/T4 interconnecting transformers.Replace 220/22 kV supply transformers.Install a new 220/22 kV supply transformer.Base CapexBase CapexPossibleBase CapexBase CapexBase CapexBase CapexPossibleOtahuhu–Wiri Increase transmission capacity to Wiri. PossibleOtahuhu–PenrosePakuranga–PenrosePenroseTakaniniWiriIncrease the circuit’s capacity.Install 220 kV cable between Pakuranga and Penrose.Install a new +/- 40 Mvar STATCOM at 33 kV bus.Replace Penrose T10 interconnecting transformer.Replace 220/33 kV supply transformer.Convert 33 kV outdoor switchgear to an indoor switchboard.Upgrade supply transformer branch limiting components.Convert 33 kV outdoor switchgear to an indoor switchboard.Resolve supply transformer’s protection limits.New or upgrade the existing supply transformers’ capacity.Convert 33 kV outdoor switchgear to an indoor switchboard.PossibleCommittedCommittedBase CapexBase CapexBase CapexPossibleBase CapexBase CapexPossibleBase Capex<strong>2012</strong> <strong>Annual</strong> <strong>Planning</strong> <strong>Report</strong> © <strong>Transpower</strong> New Zealand Limited <strong>2012</strong>. All rights reserved. 115
Chapter 8: Auckland RegionFigure 8-5: Possible Auckland transmission configuration in 2027NORTHLANDHenderson Hepburn RoadNORTHLANDAlbany / Wairau RoadHobsonStreet110 kV220 kVVECTOR CBDVECTOR CBDVECTOR CBD22 kV33 kVSTCPenrose110 kV220 kVMount Roskill22 kV*110 kVSouthdown220 kVPakuranga33 kV220 kVMangere220 kV110 kVOtahuhu110 kV22 kVKEYNEW ASSETSUPGRADED ASSETSASSETS SCHEDULEDFOR MAINTENANCEMINOR UPGRADE*Takanini*33 kV 110 kVOtahuhuCombinedCycleWiri *33 kV 110 kV110 kVBombay220 kVBrownhill220 kV33 kV33 kV 220 kVGlenbrookDrury33 kV 220 kV220 kVHuntlyWAIKATOOhinewaiWhakamaruArapuni HamiltonWAIKATOWhakamaru8.7 Changes since the 2011 <strong>Annual</strong> <strong>Planning</strong> <strong>Report</strong>Table 8-5 lists the specific issues that are either new or no longer relevant within theforecast period when compared to last year's report.Table 8-5: Changes since 2011IssuesPakuranga supply transformer capacityOtahuhu–Penrose 110 kV transmission capacityBombay transmission securityChangeRemoved. Project to install a third transformercompleted.New issue.Removed. Project to install a 110 kV bus couplercompleted.8.8 Auckland transmission capabilityTable 6-2 summarises issues involving the Auckland region for the next 15 years.For more information about a particular issue, refer to the listed section number.116<strong>2012</strong> <strong>Annual</strong> <strong>Planning</strong> <strong>Report</strong> © <strong>Transpower</strong> New Zealand Limited <strong>2012</strong>. All rights reserved.
Chapter 8: Auckland RegionTable 8-6: Auckland region transmission issuesSectionnumberIssueRegional8.8.1 Auckland region voltage quality8.8.2 North Auckland and Northland regional transmission security8.8.3 Otahuhu interconnecting transformer capacitySite by grid exit point8.8.4 Hobson Street supply security8.8.5 Mangere supply transformer capacity8.8.6 Mount Roskill supply transformer capacity8.8.7 Otahuhu supply transformer capacity8.8.8 Otahuhu–Wiri 110 kV transmission capacity8.8.9 Penrose 220 kV transmission security8.8.10 Otahuhu–Penrose 110 kV transmission8.8.11 Penrose 33 kV supply transformer capacity8.8.12 Takanini supply transformer capacity8.8.13 Wiri supply transformer capacity8.8.14 Wiri Tee transmission capacity8.8.1 Auckland region voltage qualityProject context:UNIRS – Chapter 6, See Section 6.4.1 (UNIRS)IssueAs demand in the Auckland and Northland regions grows, regional voltages maydeteriorate to a point where the outage of a 220 kV circuit may cause voltagecollapse.Generation located in the Auckland and Northland regions is insufficient to meetreactive demand. Reactive power from non-generation sources such as shuntcapacitors, series capacitors, static synchronous compensators (STATCOM), staticvar compensators (SVC) and condensers is required to ensure the maintenance ofacceptable voltage levels and quality.SolutionWe have a number of projects underway to improve Auckland voltage, including aSTATCOM at Penrose and a STATCOM at Marsden. Despite these projects,Auckland voltage stability is an ongoing issue requiring continual study as theAuckland and Northland regional loads grow.8.8.2 North Auckland and Northland regional transmission securityProject context:NAaNProject reference: ALB_PAK-TRAN-DEV-01Project status/purpose: Committed, to meet Grid Reliability Standard (core grid)Indicative timing: Q4 2013Indicative cost band: GIssueThere are three issues with respect to Auckland transmission security.<strong>2012</strong> <strong>Annual</strong> <strong>Planning</strong> <strong>Report</strong> © <strong>Transpower</strong> New Zealand Limited <strong>2012</strong>. All rights reserved. 117
Chapter 8: Auckland RegionNorth Auckland and Northland supply can be maintained with n-1 security untilwinter 2016. From that date, further transmission reinforcement or a transmissionalternative will be required.North Auckland and Northland load is supplied by a single 220 kV double-circuitoverhead line, leaving this significant load at risk from a double-circuit outage.Vector requires transmission reinforcement in the Auckland CBD (Hobson Street)and on the North Shore (Wairau Road, in the Northland region) in 2014 and2013, respectively.SolutionWe have committed to install a 220 kV underground cable link between thePakuranga, Penrose and Albany substations, which:provides security of supply for the North Auckland and Northland beyond 2016improves transmission diversity into the North Auckland and Northland, andconnects to new grid exit points at Hobson Street and Wairau Road.The link will provide a capacity of approximately 790 MVA (winter). As the cable linkwill have significantly lower impedance than the parallel 220 kV overheadtransmission circuits between Otahuhu, Henderson, and Albany, more power will flowthrough the cable than in the parallel circuits. A series reactor in the cable circuit isincluded to balance the power flow between the parallel routes.8.8.3 Otahuhu interconnecting transformer capacityProject status/purpose:This issue is for information onlyIssueThe Otahuhu 110 kV bus is normally operated split with two separate buses to givebetter load distribution and manage fault levels.There are two pairs of 220/110 kV interconnecting transformers at Otahuhu.One pair (T2 and T4, rated at 100 MVA and 200 MVA, respectively) supplies the110 kV bus section with circuits to Bombay, Penrose and Wiri 110 kV substations,providing:a total nominal installed capacity of 300 MVA, andn-1 capacity of 135/145 MVA (summer/winter).One pair (T3 and T5, rated at 250 MVA each) supplies the 110 kV bus section withcircuits to the Mangere and Mount Roskill 110 kV substations, providing:a total nominal installed capacity of 500 MVA, andn-1 capacity of 318/332 MVA (summer/winter).Otahuhu T2 and T4 are effectively in parallel with the Penrose T6 and T10interconnecting transformers through the Otahuhu–Penrose transmission system.Toward the end of the forecast period, the T2 transformer may exceed its postcontingencycapacity at peak load times for an outage of the T4 transformer.SolutionThe recent conversion of Pakuranga from 110 kV to 220 kV reduced the load onOtahuhu T2 and T4, and Penrose T6 and T10 transformers. These transformers nowhave sufficient capacity until the Auckland CBD load reaches approximately 300 MW.This is likely to occur in the second half of the forecast period or beyond. Any loadpermanently transferred to Hobson Street will also reduce the loading on theinterconnecting transformers at Otahuhu and Penrose.118<strong>2012</strong> <strong>Annual</strong> <strong>Planning</strong> <strong>Report</strong> © <strong>Transpower</strong> New Zealand Limited <strong>2012</strong>. All rights reserved.
Chapter 8: Auckland RegionAdditionally, the Otahuhu T2, T4 and Penrose T10 interconnecting transformers havean expected end-of-life within the forecast period. We will investigate the number andratings for the replacement interconnecting transformers.8.8.4 Hobson Street supply securityProject context:NAaNProject reference: HOB-SUBEST-DEV-01Project status/purpose: Committed, customer-specificIndicative timing: 2014Indicative cost band: D (including an initial 250 MVA 220/110 kV transformer)IssueVector has indicated that to ensure security of supply, it requires reinforcement of itsHobson Street substation by 2014.SolutionA new 220/110 kV grid exit point will be built at Hobson Street connecting to the newAlbany–Penrose cable (see Section 8.8.2). This will also allow Vector to transfersome load from the Penrose 110 kV grid exit point.8.8.5 Mangere supply transformer capacityProject reference: MNG-POW_TFR_PTN-01Project status/purpose: Base Capex, minor enhancementIndicative timing: <strong>2012</strong>Indicative cost band: AIssueTwo 110/33 kV transformers supply Mangere’s load, providing:a total nominal installed capacity of 240 MVA, andn-1 capacity of 118/118 MVA 51 (summer/winter).The peak load at Mangere is forecast to exceed the transformers’ n-1 winter capacityby 5 MW in <strong>2012</strong>, increasing to approximately 56 MW in 2027 (see Table 8-7).Table 8-7: Mangere supply transformer overload forecastGrid exitpointPowerfactorNext 5 yearsTransformer overload (MW)5-15 years out<strong>2012</strong> 2013 2014 2015 2016 2017 2019 2021 2023 2025 2027Mangere 0.94 5 9 12 16 20 24 32 39 45 51 56SolutionWe will discuss options with Vector. Possible solutions include:resolving the protection limit of the transformers which will solve the overloadissue until 2018, orlimiting the peak load to the transformer capacity, with future load growthtransferred to other grid exit points.Future development options to increase transformer capacity for this grid exit pointwill be customer driven.51The transformers’ capacity is limited by a protection equipment limit; with this limit resolved, the n-1capacity will be 138/144 MVA (summer/winter).<strong>2012</strong> <strong>Annual</strong> <strong>Planning</strong> <strong>Report</strong> © <strong>Transpower</strong> New Zealand Limited <strong>2012</strong>. All rights reserved. 119
Chapter 8: Auckland RegionIn addition, we also plan to convert the Mangere 33 kV outdoor switchgear to anindoor switchboard within the next five years.8.8.6 Mount Roskill supply transformer capacityProject reference: ROS-POW_TFR-EHMT-01Project status/purpose: Possible, customer-specificIndicative timing: 2015Indicative cost band: AIssueThree 110/22 kV transformers (one rated at 50 MVA and two at 70 MVA each) supplyMount Roskill’s load, providing:a total nominal installed capacity of 190 MVA, andn-1 capacity of 140/141 MVA 52 (summer/winter).The peak load at Mount Roskill is forecast to exceed the transformers’ n-1 wintercapacity by 1 MW in <strong>2012</strong>, increasing to 58 MW in 2027 (see Table 8-8).Table 8-8: Mount Roskill supply transformer overload forecastGrid exitpointPowerfactorNext 5 yearsTransformer overload (MW)5-15 Years out<strong>2012</strong> 2013 2014 2015 2016 2017 2019 2021 2023 2025 2027Mount Roskill 0.98 1 5 9 13 17 21 31 39 46 53 58SolutionWe will investigate removing the transformers’ circuit breaker and protection relayconstraints. This will increase the n-1 capacity to 145/152 MVA (summer/winter),which is sufficient to delay the issue for several years.The Mount Roskill T3 supply transformer has an expected end-of-life within theforecast period. In addition, we also plan to convert the 22 kV outdoor switchyard toan indoor switchboard within the forecast period.We will discuss the ratings and timing for the replacement transformer with Vector.Further development options to increase transformer capacity for this grid exit pointwill be customer driven.8.8.7 Otahuhu supply transformer capacityProject reference:Project status/purpose:Indicative timing:Indicative cost band:OTA-POW_TFR-EHMT-01New transformer: possible, customer-specificTo be advisedBIssueTwo 220/22 kV transformers supply Otahuhu’s load, providing:a total nominal installed capacity of 100 MVA, andn-1 capacity of 59/59 MVA 53 (summer/winter).5253The transformer’s capacity is limited by a circuit breaker limit on the 50 MVA transformer and relaylimits on the 70 MVA transformers; with auxiliary equipment limits resolved, the n-1 capacity will be145/152 MVA (summer/winter).The transformers’ capacity is limited by LV cable ratings, followed by a transformer bushings limit(64 MVA); with these limits resolved, the n-1 capacity will be 67/71 MVA (summer/winter).120<strong>2012</strong> <strong>Annual</strong> <strong>Planning</strong> <strong>Report</strong> © <strong>Transpower</strong> New Zealand Limited <strong>2012</strong>. All rights reserved.
Chapter 8: Auckland RegionThe peak load at Otahuhu is forecast to exceed the n-1 winter capacity by 9 MW in<strong>2012</strong>, increasing to approximately 42 MW in 2027 (see Table 8-9).Table 8-9: Otahuhu supply transformer overload forecastGrid exitpointPowerfactorNext 5 yearsTransformer overload (MW)5-15 years out<strong>2012</strong> 2013 2014 2015 2016 2017 2019 2021 2023 2025 2027Otahuhu 0.99 9 11 13 16 18 20 24 29 33 38 42SolutionUpgrading the LV cable and removing the bushing constraints on the supplytransformers will not resolve the issue.We will discuss other options with Vector, which include:limiting peak load to the firm transformer capacity, with future load growthtransferred to other grid exit pointsadding a third supply transformer, andreplacing the two existing supply transformers with higher-rated units.Both supply transformers have an expected end-of-life within the forecast period. Wewill discuss the ratings and timing for the replacement transformers with Vector.Further development options to increase transformer capacity for this grid exit pointwill be customer driven.8.8.8 Otahuhu–Wiri 110 kV transmission capacityProject reference:Project status/purpose:Indicative timing:Indicative cost band:OTA_WIR-TRAN-DEV-01Possible, to meet the Grid Reliability Standard (core grid) and/or customerspecificTo be advisedDIssueTwo 110 kV Bombay–Wiri–Otahuhu circuits supply Wiri’s load, with the:Bombay–Wiri section of each circuit rated at 62/76 MVA (summer/winter), andOtahuhu–Wiri section of each circuit rated at 92/101 MVA (summer/winter).Wiri is a double hard tee connection, and an outage of one of the 110 kV Bombay–Wiri–Otahuhu circuits is forecast to overload the Otahuhu–Wiri section of theremaining circuit during summer peak load periods from approximately <strong>2012</strong>. Thiswill occur during periods of high Auckland generation and low Waikato generation.SolutionWe are investigating several options. In the short-term, Vector can limit Wiri load withfuture load growth transferred to other grid exit points. Possible longer-term optionsare:a new 110 kV cable from Otahuhu connecting to a new 110/33 kV supplytransformer at Wiria new 110/33kV transformer at Otahuhu and a new 33 kV cable connected intoWirireconductoring the 110 kV Otahuhu–Wiri circuits with higher capacity conductor,ora new 220/110 kV connection at Bombay substation on the Huntly–Otahuhucircuit (to reinforce the supply to Wiri from Bombay) and a 110 kV bus at Wiri.<strong>2012</strong> <strong>Annual</strong> <strong>Planning</strong> <strong>Report</strong> © <strong>Transpower</strong> New Zealand Limited <strong>2012</strong>. All rights reserved. 121
Chapter 8: Auckland RegionSee also the Wiri supply transformer capacity issue (Section 8.8.14).8.8.9 Penrose 220 kV transmission securityProject context:NIGU and UNIRSSee Section 6.4.2 (NIGU project) and Section 8.8.2 (NAaN)IssueThe two 220 kV Otahuhu–Penrose circuits are rated at 469/492 MVA(summer/winter). During peak demand periods, an outage of one Otahuhu–Penrosecircuit may cause the other circuit to exceed the conductor rating from 2013.SolutionIn the short term, the loading on the 220 kV Otahuhu–Penrose circuits may bereduced following an outage by taking the low impedance Penrose 220/110 kVtransformer (T10) out of service. 54 This transfers some of the load to the 110 kVOtahuhu–Penrose 2 circuit. This solution is sufficient until 2014.We are committed to installing a 220 kV Pakuranga–Penrose cable circuit as part ofthe NAaN project, scheduled for completion in 2013 (see Section 8.8.2). This willaddress the issue until approximately 2027 or beyond, when a second 220 kVPakuranga–Penrose circuit will be required.8.8.10 Otahuhu–Penrose 110 kV transmission capacityProject reference:Project status/purpose:Indicative timing:Indicative cost band:OTA_PEN-TRAN-DEV-01Possible, to meet Grid Relilability Standard (not core grid)To be advisedTo be advisedIssueThe 110 kV Otahuhu–Penrose circuit is rated at 177/195 MVA (summer/winter). Aftercommissioning of the NIGU project, an outage of the Penrose 220/110 kVtransformer (T10) will cause the 110 kV Otahuhu–Penrose circuit to overload from2020.SolutionThe Otahuhu–Penrose 110 kV circuit is limited by the terminal spans at Otahuhu andPenrose substations. With this limit removed, the circuit rating is 191/210 MVA,which will delay the issue in the short term.Longer-term solutions include:replacing the old Otahuhu T2 and T4 interconnecting transformers with higherimpedance transformersthermally upgrading the circuit to a higher temperature, orreplacing the circuit with a higher capacity conductor.8.8.11 Penrose 33 kV supply transformer capacityProject status/purpose:This issue is for information only54The two existing Penrose 220/110 kV interconnecting transformers are 200 MVA 5% impedance and250 MVA 15% impedance units. By switching the 5% impedance transformer out of service, thehigher impedance unit will balance the power flow between the remaining 220 kV and the existing110 kV circuits.122<strong>2012</strong> <strong>Annual</strong> <strong>Planning</strong> <strong>Report</strong> © <strong>Transpower</strong> New Zealand Limited <strong>2012</strong>. All rights reserved.
Chapter 8: Auckland RegionIssueThree 220/33 kV transformers (two rated at 200 MVA and one at 160 MVA) supplyPenrose’s load, providing:a total nominal installed capacity of 560 MVA, andn-1 capacity of 429/450 MVA (summer/winter).The peak load at Penrose is forecast to exceed the transformers’ n-1 winter capacityby approximately 28 MW in <strong>2012</strong>, increasing to approximately 183 MW in 2027 (seeTable 8-10).Table 8-10: Penrose supply transformer overload forecastGrid exitpointPowerfactorNext 5 yearsTransformer overload (MW)5-15 years out<strong>2012</strong> 2013 2014 2015 2016 2017 2019 2021 2023 2025 2027Penrose 0.98 28 39 50 61 72 84 109 131 149 168 183SolutionWe are discussing future development options for this connection point with Vector.It is expected that the peak load will be limited to the firm transformer capacity, withfuture load growth transferred to other grid exit points.We have installed a fourth 220/33 kV supply transformer. This is a system sparetransformer to enable us to manage outages on the existing three supplytransformers for the next 15 years (in particular, allowing the existing T9 transformerto undergo extensive preventative maintenance). The firm capacity will not increase,because only three of the four transformers can be in service to maintain fault levelswithin the equipment ratings.Additionally, we also plan to convert the Penrose 33 kV outdoor switchyard to anindoor switchboard within the forecast period.8.8.12 Takanini supply transformer capacityProject reference: Upgrade protection: TAK-POW_TFR-EHMT-01Upgrade circuit breaker and busbar: TAK-SUBEST-EHMT-01Project status/purpose: Upgrade protection: Base Capex, minor enhancementUpgrade circuit breaker and busbar: possible, customer-specificIndicative timing: 2014-2016Indicative cost band: Upgrade protection: AUpgrade circuit breaker and busbar: AIssueTwo 220/33 kV transformers supply Takanini’s load, providing:a total nominal installed capacity of 300 MVA, andn-1 capacity limit of 126/126 MVA 55 (summer/winter).The peak load at Takanini is forecast to exceed the transformers’ n-1 winter capacityby 6 MW in <strong>2012</strong>, increasing to approximately 61 MW in 2027 (see Table 8-11).55The transformers’ capacity is limited by protection equipment limit, followed by the circuit breaker(137 MVA) and 33 kV bus (137 MVA) limits; with these limits resolved, the n-1 capacity will be188/198 MVA (summer/winter).<strong>2012</strong> <strong>Annual</strong> <strong>Planning</strong> <strong>Report</strong> © <strong>Transpower</strong> New Zealand Limited <strong>2012</strong>. All rights reserved. 123
Chapter 8: Auckland RegionTable 8-11: Takanini supply transformer overload forecastGrid exitpointPowerfactorNext 5 yearsTransformer overload (MW)5-15 years out<strong>2012</strong> 2013 2014 2015 2016 2017 2019 2021 2023 2025 2027Takanini 0.99 6 10 14 18 22 26 35 43 49 56 61SolutionIf the protection equipment, circuit breaker, and busbar limits are resolved, thetransformers’ thermal capacity will be sufficient until the second half of the forecastperiod.In addition, the Takanini 33 kV outdoor switchyard will be converted into an indoorswitchboard within the next five years. If appropriate, we will upgrade the transformerbranch limiting components in conjunction with the conversion work.Vector has advised that they expect to keep peak load within the transformers’ n-1capacity for several years. Further development options to increase the transformercapacity for this grid exit point will be customer driven.8.8.13 Wiri supply transformer capacityProject reference: Upgrade protection: WIR-POW_TFR_PTN-EHMT-01Upgrade transformer capacity: WIR-POW_TFR-EHMT-01Project status/purpose: Upgrade protection: Base Capex, minor enhancementUpgrade transformer capacity: possible, customer-specificIndicative timing: Upgrade protection: 2019Upgrade transformer capacity: 2021Indicative cost band: Upgrade protection: AUpgrade transformer capacity: BIssueTwo 110/33 kV transformers supply Wiri’s load, providing:a total nominal installed capacity of 200 MVA, andn-1 capacity limit of 106/106 MVA 56 (summer/winter).The peak load at Wiri will exceed the transformers’ summer n-1 capacity byapproximately 2 MW in 2019, increasing to approximately 20 MW in 2027 (see Table8-12).Table 8-12: Wiri supply transformer overload forecastGrid exitpointPowerfactorNext 5 yearsTransformer overload (MW)5-15 years out<strong>2012</strong> 2013 2014 2015 2016 2017 2019 2021 2023 2025 2027Wiri 0.99 0 0 0 0 0 0 2 7 12 16 20SolutionResolving the protection equipment limits will delay the overload until 2020. We willdiscuss future supply options with Vector, including:limiting peak load to the firm transformer capacity (i.e. 106/106 MVA), with futureload growth transferred to other grid exit points, and/orreplacing the existing transformers with two 120 MVA units, orinstalling a third supply transformer.56The transformers’ capacity is limited by protection equipment limit; with this limit resolved, the n-1capacity will be 109/115 MVA (summer/winter).124<strong>2012</strong> <strong>Annual</strong> <strong>Planning</strong> <strong>Report</strong> © <strong>Transpower</strong> New Zealand Limited <strong>2012</strong>. All rights reserved.
Chapter 8: Auckland RegionThe solution to the Otahuhu–Wiri transmission capacity issue may also address theWiri supply transformer capacity issue (see Section 8.8.8).The Wiri single phase supply transformers have an expected end-of-life within thenext five years. In addition, we also plan to conver the Wiri 33 kV outdoor switchyardto an indoor switchboard within the next five years.We will discuss with Vector the number, rating, and timing of the transformerreplacement in conjunction with the transformer upgrade and 33 kV outdoor to indoorswitchyard conversion work.Any future transformer upgrade will be customer driven.8.8.14 Wiri Tee transmission capacityProject status/purpose:This issue is for information onlyIssueWiri is connected to the Bombay–Wiri–Otahuhu circuits through the Wiri Tee circuitsections, each rated at 92/101 MVA (summer/winter).The peak load at Wiri already exceeds the circuits’ n-1 summer capacity.SolutionThis issue arises along with the Otahuhu–Wiri circuit issue (see Section 8.8.8). It isexpected to be resolved with that issue. Although the Wiri Tee section is onlyapproximately 90 m in length, it crosses over a motorway, which is expected tocomplicate an otherwise a relatively minor project to increase this circuit section’scapacity.8.9 Other regional items of interestThere are no other items of interest identified to date beyond those set out inSection 8.8. See Section 8.10 for more information about specific generationproposals relevant to this region.8.10 Auckland generation proposals and opportunitiesThis section details relevant regional issues for selected generation proposals underinvestigation by developers and in the public domain, or other generationopportunities.The maximum generation that can be connected at any substation depends onseveral factors and usually falls within a range. Generation developers shouldconsult with us at an early stage of their investigations to discuss connection issues.See our website for more information about connecting generation. 578.10.1 Maximum regional generationThe Auckland region has some of the highest load densities in New Zealand, coupledwith relatively low levels of local generation, and so there is no practical limit to themaximum generation that can be connected within the region. However, there will belimits on the maximum generation that can be connected at a substation or along anexisting line due to the rating of the existing circuits.57http://www.transpower.co.nz/connecting-new-generation.<strong>2012</strong> <strong>Annual</strong> <strong>Planning</strong> <strong>Report</strong> © <strong>Transpower</strong> New Zealand Limited <strong>2012</strong>. All rights reserved. 125
Chapter 8: Auckland Region8.10.2 Auckland generation issuesThere are numerous inter-related issues with supplying the load within the Aucklandregion, as discussed earlier in this chapter. In addition, the increase in fault level dueto generators will be an issue for some parts of the transmission and/or distributionsystems.Therefore, depending on its connection point, new generation within the Aucklandregion may assist in addressing an issue, make it worse, have no effect, or mayrequire specific additional transmission investment to enable connection. Fault-levelissues may also preclude new generation connection in some locations.126<strong>2012</strong> <strong>Annual</strong> <strong>Planning</strong> <strong>Report</strong> © <strong>Transpower</strong> New Zealand Limited <strong>2012</strong>. All rights reserved.
Chapter 9: Waikato Region9 Waikato Regional Plan9.1 Regional overview9.2 Waikato transmission system9.3 Waikato demand9.4 Waikato generation9.5 Waikato significant maintenance work9.6 Future Waikato projects summary and transmission configuration9.7 Changes since the 2011 <strong>Annual</strong> <strong>Planning</strong> <strong>Report</strong>9.8 Waikato transmission capability9.9 Other regional items of interest9.10 Waikato generation proposals and opportunities9.1 Regional overviewThis chapter details the Waikato regional transmission plan. We base this regionalplan on an assessment of available data, and welcome feedback to improve its valueto all stakeholders.Figure 9-1: Waikato region<strong>2012</strong> <strong>Annual</strong> <strong>Planning</strong> <strong>Report</strong> © <strong>Transpower</strong> New Zealand Limited <strong>2012</strong>. All rights reserved. 127
Chapter 9: Waikato RegionThe Waikato region comprises two distinct transmission networks, 110 kV and220 kV, of which the 220 kV network forms part of the grid backbone. The 220 kVcircuits enter the region from Stratford, Tokaanu, and Wairakei. The 110 kV circuitsenter the region from Kinleith to Arapuni, and from Ongarue to Hangatiki. Thenorthern boundary is crossed by the:220 kV circuits from Huntly, Ohinewai, and Whakamaru, and110 kV circuits from Hamilton and Arapuni.We have assessed the Waikato region’s transmission needs over the next 15 yearswhile considering longer-term development opportunities. Specifically, thetransmission network needs to be flexible to respond to a range of future service andtechnology possibilities, taking into consideration:the existing transmission networkforecast demandforecast generationequipment replacement based on condition assessment, andpossible technological development.9.2 Waikato transmission systemThis section highlights the state of the Waikato regional transmission network. Theexisting transmission network is set out geographically in Figure 9-1 andschematically in Figure 9-2.Figure 9-2: Waikato transmission schematicAUCKLANDDrury OtahuhuAUCKLANDBombay OtahuhuKopu66 kV110 kV33 kVWaihou110 kVWaikino110 kV33 kV220 kV 33 kVOhinewaiKEY220kV CIRCUIT110kV CIRCUITSUBSTATION BUSTRANSFORMERTEE POINTHuntlyTe KowhaiHamilton11 kV 220 kVCambridge11 kVKarapiro110 kV110 kVHinuera33 kVLOADCAPACITORGENERATOR220 kV 33 kV110 kV33 kV110 kVArapuniTe AwamutuHangatiki33 kV110 kV11 kV110 kVWaipapa220 kVKinleithMaraetai220 kVTarukengaAtiamuriBAY OF PLENTYKawerauOhakuriWhakamaru220 kVOngarueCENTRAL NORTH ISLANDStratford TaumarunuiTARANAKITokaanu220 kVCENTRAL NORTH ISLAND220 kVPoihipiWairakeiCENTRAL NORTH ISLAND128<strong>2012</strong> <strong>Annual</strong> <strong>Planning</strong> <strong>Report</strong> © <strong>Transpower</strong> New Zealand Limited <strong>2012</strong>. All rights reserved.
Chapter 9: Waikato Region9.2.1 Transmission into the regionThis region contributes a significant portion of the total North Island generation andexceeds local demand. Surplus generation is exported over the 220 kV transmissionnetwork to the rest of the country. The 220 kV transmission network has enoughcapacity to provide n-1 security to the local load indefinitely.The committed 400 kV-capable transmission line 58 between Whakamaru andPakuranga (Auckland) will reduce loading on the 220 kV and 110 kV circuits withinthe Waikato region.9.2.2 Transmission within the regionThe 110 kV transmission network within the region predominantly supplies andconnects the rest of the Waikato region, including most of the regional load and someregional generation.Transmission system issuesThe 110 kV transmission network predominantly comprises low capacity circuits.This results in capacity and supply security issues for some outages. It also results ingeneration restrictions, particularly at Arapuni, even with all circuits in service. Wehave a number of investigations planned or underway to address these issues.Maintenance security issuesThe 220/110 kV interconnection at Hamilton supplies most of the load in the Waikatoregion. The outage of a 220 kV circuit to Hamilton or a 220/110 kV interconnectingtransformer at Hamilton will place many grid exit points in the region on n security.We will consider options to increase the security of this interconnection to provide fullor partial n-1 security.9.2.3 Longer-term development pathWe are presently working on a Waikato regional development strategy. This projectfocuses on resolving short and long-term issues in the region, including the:Waikato 110 kV transmission network (the 110 kV circuits that operate in parallelwith the grid backbone between Tarukenga and Bombay)110 kV Thames Valley spur, andHamilton interconnecting transformer capacity and maintenance security.Additionally, in order to meet high load growth in the Tauranga area, one option is atransmission connection between Waihou and a new grid exit point north ofTauranga. This may involve converting parts of the Thames Valley spur to 220 kV.The following are possible developments in the grid backbone through the Waikatoregion:installing series capacitors on the 220 kV Brownhill–Whakamaru circuits (likelywithin the forecast period)converting the 220 kV Brownhill–Whakamaru circuits to 400 kV operation byinstalling 400/220 kV interconnecting transformers at Brownhill and Whakamaru(likely beyond the forecast period).9.3 Waikato demandThe after diversity maximum demand (ADMD) for the Waikato region is forecast togrow on average by 1.8% annually over the next 15 years, from 511 MW in <strong>2012</strong> to58Part of the North Island Grid Upgrade (NIGU) project, see Chapter 6 for more information.<strong>2012</strong> <strong>Annual</strong> <strong>Planning</strong> <strong>Report</strong> © <strong>Transpower</strong> New Zealand Limited <strong>2012</strong>. All rights reserved. 129
Chapter 9: Waikato Region668 MW by 2027. This is higher than the national average demand growth of 1.7%annually.Figure 9-3 shows a comparison of the 2011 and <strong>2012</strong> forecast 15-year maximumdemand (after diversity 59 ) for the Waikato region. The forecasts are derived usinghistorical data, and modified to account for customer information, where appropriate.The power factor at each grid exit point is also derived from historical data, and isused to calculate the real power capacity for power transformer and transmission line.See Chapter 4 for more information about demand forecasting.Figure 9-3: Waikato region after diversity maximum demand forecastLoad (MW)800Waikato7507006506005505004504002011 APR Forecast350<strong>2012</strong> APR ForecastActual Peak3001997 1999 2001 2003 2005 2007 2009 2011 2013 2015 2017 2019 2021 2023 2025 2027Table 9-1 lists forecasts peak demand (prudent growth) for each grid exit point for theforecast period, as required for the Grid Reliability <strong>Report</strong>.Table 9-1: Forecast annual peak demand (MW) at Waikato grid exit points to 2027Grid exit pointPowerfactorNext 5 yearsPeak demand (MW)5-15 years out<strong>2012</strong> 2013 2014 2015 2016 2017 2019 2021 2023 2025 2027Cambridge 1 0.98 38 39 39 40 40 41 42 43 45 46 47Hamilton 11 kV 1.00 47 48 49 25 0 0 0 0 0 0 0Hamilton 33 kV 2 0.99 148 151 154 182 212 216 225 234 241 249 256Hamilton NZR 0.80 8 8 8 8 8 8 8 8 8 8 8Hangatiki 0.88 30 31 31 32 33 33 35 36 37 38 39Hinuera 3 0.95 47 48 42 43 44 45 47 49 51 52 54Huntly 4 0.99 25 25 26 26 42 43 44 45 47 48 49Kopu -0.99 50 52 53 55 56 58 62 65 67 70 72Piako 5 0.98 0 28 28 29 30 31 33 35 36 38 39Putaruru 3 0.95 0 0 7 8 8 8 8 9 9 9 10Te Kowhai 2 0.97 105 110 112 117 120 122 127 131 135 139 141Te Awamutu 1 0.98 37 37 38 39 39 40 41 43 44 46 4859The after diversity maximum demand (ADMD) for the region will be less than the sum of theindividual grid exit point peak demands, as it takes into account the fact that the peak demand doesnot occur simultaneously at all the grid exit points in the region.130<strong>2012</strong> <strong>Annual</strong> <strong>Planning</strong> <strong>Report</strong> © <strong>Transpower</strong> New Zealand Limited <strong>2012</strong>. All rights reserved.
Chapter 9: Waikato RegionGrid exit pointPowerfactorNext 5 yearsPeak demand (MW)5-15 years out<strong>2012</strong> 2013 2014 2015 2016 2017 2019 2021 2023 2025 2027Waihou 5 0.96 67 41 43 44 45 47 49 52 54 56 58Waikino 1.00 41 42 44 45 46 48 50 53 55 57 59Whakamaru 1.00 11 11 11 11 12 12 12 13 13 14 141. The customer provided this forecast.2. The forecast is distorted by frequent and regular load shifting between Hamilton and Te Kowhai.3. Some load will be shifted from Hinuera to a proposed new grid exit point at Putaruru in 2014.4. An industrial load increase of 5 MW is expected at Huntly in <strong>2012</strong>.5. Some load will be shifted from Waihou to a new grid exit point at Piako.9.4 Waikato generationThe Waikato region’s generation capacity is 2,662 MW.Table 9-2 lists the generation forecast for each grid injection point for the forecastperiod, as required for the Grid Reliability <strong>Report</strong>. This includes all known andcommitted generation stations including those embedded within the relevant locallines company’s network (Waipa Networks, WEL Networks, The Lines Company orPowerco). 60Table 9-2: Forecast annual generation capacity (MW) at Waikato grid injection points to2027 (including existing and committed generation)Grid injection point(location ifembedded)Next 5 yearsGeneration capacity (MW)5-15 years out<strong>2012</strong> 2013 2014 2015 2016 2017 2019 2021 2023 2025 2027Arapuni 197 197 197 197 197 197 197 197 197 197 197Atiamuri 84 84 84 84 84 84 84 84 84 84 84Huntly 1448 1448 1448 1448 1448 1448 1448 1448 1448 1448 1448Karapiro 90 90 90 90 90 90 90 90 90 90 90Maraetai 360 360 360 360 360 360 360 360 360 360 360Mokai 112 112 112 112 112 112 112 112 112 112 112Ohakuri 112 112 112 112 112 112 112 112 112 112 112Te Kowhai (Te Rapa) 44 44 44 44 44 44 44 44 44 44 44Te Kowhai (Te Uku) 64 64 64 64 64 64 64 64 64 64 64Waipapa 51 51 51 51 51 51 51 51 51 51 51Whakamaru 100 100 100 100 100 100 100 100 100 100 1009.5 Waikato significant maintenance workOur capital project and maintenance works are integrated to enable system issues tobe resolved if possible when assets are replaced or refurbished. Table 9-3 lists thesignificant maintenance-related work 61 proposed for the Waikato region for the next15 years that may significantly impact related system issues or connected parties.6061Only generators with a capacity greater than 1 MW are listed. Generation capacity is rounded to thenearest megawatt.This may include replacement of the asset due to its condition assessment.<strong>2012</strong> <strong>Annual</strong> <strong>Planning</strong> <strong>Report</strong> © <strong>Transpower</strong> New Zealand Limited <strong>2012</strong>. All rights reserved. 131
Chapter 9: Waikato RegionTable 9-3: Proposed significant maintenance workDescriptionCambridge 11 kV switchgearreplacementHamilton T5 supply transformerexpected end-of-lifeHangatiki T1 and T2 supplytransformers’ expected end-of-lifeHinuera T1 and T2 supplytransformers’ expected end-of-lifeTentative year Related system issues2013 Upgrading the 11 kV switchgear will improve theCambridge supply transformer n-1 capacity issue.See Section 9.8.6 for more information.2022-2024 A significant increase in supply transformer capacityis required within the forecast period. Increasing thecapacity of T5 will reduce the transformer overload.See Section 9.8.7 for more information.2013-2015 Upgrading the transformers’ capacity is one of thepossible options to resolve the transformer overloadissue. See Section 9.8.8 for more information.2022-2029 Upgrading the capacity of T1 is one of the possibleoptions (following construction of Putaruru) toresolve the transformer loading issue. See Section9.8.9 for more information.Waihou supply transformers’expected end-of-life,33 kV outdoor to indoorconversion, and 110 kVsubstation rebuild2022-20272013-2015Upgrading the transformers’ capacity is one of thepossible options (following construction of Piako) toresolve the transformer overloading issue. SeeSection 9.8.15 for more information.The replacement transformer with on-load tapchanging capability will improve the voltage profileat Waihou. See Section 9.8.5 for more information.Waikino supply transformers’expected end-of-life, and 33 kVoutdoor to indoor conversion2018-2022 Upgrading the transformers’ capacity is one of thepossible options to resolve transformer overloadingissue. See Section 9.8.16 for more information.The replacement transformer with on-load tapchanging capability will improve the voltage profileat Waikino. See Section 9.8.5 for more information.9.6 Future Waikato projects summary and transmission configurationTable 9-4 lists projects to be carried out in the Waikato region within the next 15years.Figure 9-4 shows the possible configuration of Waikato transmission in 2027, withnew assets, upgraded assets, and assets undergoing significant maintenance withinthe forecast period.Table 9-4: Projects in the Waikato region up to 2027Site Projects StatusArapuni Reconfigure 110 kV bus. CommittedArapuni–Kinleith Increase the line capacity by reconductoring/thermal upgrading. PossibleCambridge Replace 11 kV switchgear. CommittedHamiltonHamilton–WaihouInstall a new 220/110 kV interconnecting transformer.Install a new 220/33 kV supply transformer.Increase the line capacity by building a new 110 kV Hamilton–Waihou circuit or upgrade 110 kV Hamilton–Waihou circuits.PossiblePossiblePossibleHangatiki Replace 110/33 kV supply transformers Base CapexHinuera Upgrade the 110/33 kV 30 MVA supply transformer capacity. PossibleKarapiro Upgrade 110 kV switchyard. Base CapexKopu Resolve supply transformer protection limits. Base CapexPiako New grid exit point. CommittedPutaruru New grid exit point. PossibleTe AwamutuNew transmission circuit either from Hangatiki or Karapiro.Resolve supply transformer protection limits.PossibleBase CapexTe Kowhai Install radiators and fans on the existing supply transformers. Committed132<strong>2012</strong> <strong>Annual</strong> <strong>Planning</strong> <strong>Report</strong> © <strong>Transpower</strong> New Zealand Limited <strong>2012</strong>. All rights reserved.
Chapter 9: Waikato RegionSite Projects StatusWaihouWaikinoInstall a new 220/33 kV supply transformer.Rebuild 110 kV structure.Replace 110/33 kV supply transformers.Convert 33 kV outdoor switchgear to an indoor switchboard.Install new capacitors.Install new capacitors.Replace supply transformers.Convert 33 kV outdoor switchgear to an indoor switchboard.PossibleBase CapexBase CapexBase CapexPossiblePossibleBase CapexBase CapexFigure 9-4: Possible Waikato transmission configuration in 2027DruryOtahuhuAUCKLANDBombay OtahuhuKopu66 kV*110 kVHuntly33 kV`Waihou110 kVWaikino110 kV33 kV33 kVOhinewaiPiako110 kV220 kV220 kVHamiltonTe Kowhai220 kV11 kVCambridgeKarapiro110 kV110 kV33 kVHinuera220 kV 33 kVTe Awamutu110 kV110 kV33 kVArapuni110 kVPutaruruHangatiki33 kV110 kV*11 kVWaipapa220 kVMaraetai220 kVAtiamuri220 kVWhakamaru NorthKinleithTarukengaBAY OF PLENTYKawerauOhakuri220 kV WairakeiAUCKLANDBrownhill(1)Ongarue Stratford TaumarunuiTARANAKI(1) the transmission backbone section identifies twodevelopment paths for the lower North Island:- upgrade existing lines, and/or- new transmission lineAlthough this diagram shows upgrading of existinglines, it is not intended to indicate a preference asboth options are still being investigated.Tokaanu220 kVWhakamaruCENTRAL NORTH ISLANDWairakeiPoihipi/WairakeiKEYNEW ASSETSUPGRADED ASSETSASSETS SCHEDULEDFOR REPLACEMENTMINOR UPGRADE*9.7 Changes since the 2011 <strong>Annual</strong> <strong>Planning</strong> <strong>Report</strong>Table 9-5 lists the specific issues that are either new or no longer relevant within theforecast period when compared to last year's report.Table 9-5: Changes since 2011IssuesBombay–Hamilton and Arapuni–Bombay 110 kVtransmission capacityTe Awamutu supply transformer capacityChangeIssue removed. Loading on these circuits ismanaged with Arapuni constraints or a bus split.New issue.<strong>2012</strong> <strong>Annual</strong> <strong>Planning</strong> <strong>Report</strong> © <strong>Transpower</strong> New Zealand Limited <strong>2012</strong>. All rights reserved. 133
Chapter 9: Waikato Region9.8 Waikato transmission capabilityTable 9-6 summarises issues involving the Waikato region for the next 15 years. Formore information about a particular issue, refer to the listed section number.Table 9-6: Waikato regional transmission issuesSectionnumberIssueRegional9.8.1 Arapuni–Hamilton 110 kV transmission capacity9.8.2 Arapuni–Kinleith 110 kV transmission capacity9.8.3 Hamilton interconnecting transformer capacity9.8.4 Hamilton–Waihou 110 kV transmission capacity9.8.5 Waihou–Waikino–Kopu spur low voltageSite by grid exit point9.8.6 Cambridge supply transformer capacity9.8.7 Hamilton supply transformer capacity9.8.8 Hangatiki supply transformer capacity9.8.9 Hinuera supply transformer capacity9.8.10 Hinuera transmission security9.8.11 Kopu supply transformer capacity9.8.12 Maraetai–Whakamaru transmission capacity9.8.13 Te Awamutu supply transformer capacity9.8.14 Te Awamutu transmission security9.8.15 Waihou supply transformer capacity9.8.16 Waikino supply transformer capacity9.8.1 Arapuni–Hamilton 110 kV transmission capacityProject status/purpose:This issue is for information onlyIssueThe two 110 kV Arapuni–Hamilton circuits are each rated at 51/62 MVA(summer/winter).The 110 kV bus is currently permanently split with two bus sections:Arapuni G1-4 generators, Arapuni–Bombay, Arapuni–Hamilton 1 and 2, Arapuni–Hangatiki, and the Arapuni–Ongarue circuits on one bus (north bus)Arapuni–Kinleith 1 and 2 circuits on the other bus (south bus), andArapuni G5-8 are selectable between the two bus sections.Cost benefit analysis showed that it is economic to permanently split the bus until thenew Pakuranga–Whakamaru line 62 is commissioned. This analysis will be revisitedprior to the commissioning of the new line to decide the operational strategy in thefuture.With the Arapuni bus split open:62This is a new 220/400 kV double-circuit transmission line, and forms part of the North Island GridUpgrade (NIGU) project.134<strong>2012</strong> <strong>Annual</strong> <strong>Planning</strong> <strong>Report</strong> © <strong>Transpower</strong> New Zealand Limited <strong>2012</strong>. All rights reserved.
Chapter 9: Waikato RegionArapuni north bus generation may be constrained pre-contingency to manage theloading on the Arapuni–Hamilton circuits for an outage of the Arapuni–Hamiltoncircuitthe Arapuni runback is enabled on Arapuni G1-4 to reduce generation if anArapuni–Hamilton circuit overloads.With the Arapuni bus split closed, and following the commissioning of the Pakuranga–Whakamaru line:Arapuni generation may be constrained pre-contingency to manage the loadingon the Arapuni–Hamilton circuits for an outage of the Arapuni–Hamilton orHamilton–Whakamaru circuit.the Arapuni runback is enabled on Arapuni G1-4 to reduce generation if anArapuni–Hamilton circuit overloads.The worst case conditions are during:summer, when Huntly generation is sometimes restricted due to high rivertemperatures, andhigh hydro inflow periods, when renewable generation south of Whakamaru isdispatched ahead of thermal generation in the upper North Island.SolutionThe Arapuni bus split is currently implemented by connecting three 110 kV circuitsdirectly to the 110 kV bus. This is not a long-term solution, as it restricts maintenanceaccess to those circuits. An investigation is underway to determine a longer-termstrategy for the Arapuni bus split.A number of projects that are presently being implemented or considered as solutionsto other issues will also relieve the loading on the 110 kV Arapuni–Hamilton circuits.These other projects include the NIGU project, the Tarukenga interconnectingtransformer replacement and the new Putaruru grid exit point (see Section 9.8.10 formore information).An investigation into longer-term options to resolve this issue is ongoing. However, apreliminary assessment of the Investment Test indicates that reconductoring the110 kV circuits to remove the overload may not be economic. A conditionassessment shows that the existing conductor will not require replacement within theforecast period.9.8.2 Arapuni–Kinleith 110 kV transmission capacityProject reference: ARI_KIN-TRAN-EHMT-01Project status/purpose: Possible, to meet the Grid Reliability Standard (not core grid)Indicative timing: 2020-2027Indicative cost band: AIssueThere are two 110 kV Arapuni–Kinleith circuits (1 and 2), rated at 57/70 MVA and63/77 MVA (summer/winter), respectively. There is a possibility of a new grid exitpoint (Putaruru) being single tee-connected part way along Arapuni–Kinleith circuit 2in 2013 63 (see Section 9.8.10 for more information).Loading on the 110 kV Arapuni–Kinleith circuits may exceed their n-1 capacity undercertain operating conditions.With the Arapuni bus split open, factors contributing to this overload include:the summer ratings period, and63Putaruru load is expected to be approximately 7 MW from 2014.<strong>2012</strong> <strong>Annual</strong> <strong>Planning</strong> <strong>Report</strong> © <strong>Transpower</strong> New Zealand Limited <strong>2012</strong>. All rights reserved. 135
Chapter 9: Waikato Regionfull generation from three Arapuni generation units connected to the south bus.With the Arapuni bus split closed, factors contributing to this overload include:high net load at Kinleith (for example when Kinleith generation is off during highpulp and paper plant production periods)high generation at Arapunihigh Huntly and Auckland-area generation, andhigh south power flow (for example, HVDC south power flow).Additionally, the 110 kV circuits between Kinleith and Lichfield are often opened toprevent overloading during some outages in the Bay of Plenty region. The Kinleithload is then supplied by the two 110 kV Arapuni–Kinleith circuits and generation atKinleith. For some system conditions the load at Kinleith may be on n security whenthe system is split.Peak load at Kinleith is approximately 95 MW (offset by up to 40 MW of on-sitegeneration) and is forecast to remain steady. The net Kinleith load rarely exceeds75 MW. The typical daily peaks are between 55 MW and 65 MW.SolutionIn the short term, loading on Arapuni–Kinleith circuits is managed by:opening Arapuni bus split, andrestricting Arapuni south bus generation during summer ratings.Following the commissioning of the Pakuranga–Whakamaru double-circuit line andthe new Putaruru grid exit point, the Arapuni bus split will be opened less frequently.In the medium term, possible options to relieve the loading on Arapuni–Kinleith duringsouth power flow include:special protection schemes, orreconfiguration of the Kinleith 110 kV bus.In the longer term, possible options to increase the capacity of the Arapuni–Kinleithcircuits include:reconductoring Arapuni–Kinleith 1reconductoring the Arapuni–Putaruru line section, andthermally upgrading the Kinleith–Putaruru line section.Acquisition of property easements may be required for reconductoring work in somecases.9.8.3 Hamilton interconnecting transformer capacityProject reference: HAM-POW_TFR-DEV-01Project status/purpose: Possible, to meet the Grid Reliability Standard (core grid)Indicative timing: 2025Indicative cost band: New interconnecting transformer: BNew substation: CIssueTwo three-phase interconnecting transformers at Hamilton supply much of theWaikato 110 kV transmission network load, as well as a small proportion of theAuckland and Bay of Plenty 110 kV loads under certain load flow conditions. Thesetransformers provide:a total nominal installed capacity of 420 MVA, and136<strong>2012</strong> <strong>Annual</strong> <strong>Planning</strong> <strong>Report</strong> © <strong>Transpower</strong> New Zealand Limited <strong>2012</strong>. All rights reserved.
Chapter 9: Waikato Regionn-1 capacity of 243/243 MVA 64 (summer/winter).During low 110 kV generation in Waikato (Arapuni and Karapiro generation) and highWaikato demand, the load on the Hamilton interconnecting transformers may exceedtheir n-1 capacity. This overloading issue worsens:with low Upper North Island generation, andafter completion of the Tarukenga interconnecting transformer replacementproject (see Chapter 10, Section 10.9.4).SolutionIn the short term, we anticipate this issue will be managed operationally withgeneration rescheduling and load management.However, with low upper North Island generation and/or higher load growth there maynot be enough Waikato 110 kV generation to manage this issue towards the end ofthe forecast period.Developments being considered or underway, such as the NIGU project, will reduceloading on the Hamilton interconnecting transformers. We are also discussingoptions for the long-term supply of Hamilton City with WEL Networks (see Section9.8.7). If the existing 110/11 kV load at Hamilton is moved to the 33 kV bus, theloading on the Hamilton transformers will decrease.Two of the options that <strong>Transpower</strong> is considering for upgrading the 220/110 kVHamilton interconnecting transformers (when required) include a new 200 MVAtransformer:in parallel with the existing transformers, orat a new substation, connected to the intersection of the 220 kV Otahuhu–Whakamaru 3 circuit and the 110 kV Hamilton–Waihou circuits.The second option improves security during maintenance outages of the 220 kVcircuits supplying Hamilton, and forms the connection point for a third circuit toWaihou (instead of a Hamilton connection, see Section 9.8.4 for more information).9.8.4 Hamilton–Waihou 110 kV transmission capacityProject reference: HAM_WHU-TRAN-DEV-01Project status/purpose: Possible, customer-specificIndicative timing: 2017Indicative cost band: Third Hamilton–Waihou circuit: DReconductoring Hamilton–Waihou circuit: CIssueTwo 110 kV Hamilton–Waihou circuits supply the ‘Valley Spur’ (Waihou, Waikino, andKopu), each circuit having a summer/winter capacity of 154/168 MVA. Valley Spursummer and winter peak loads are increasingly similar, with 2011 peaks ofapproximately 114 MW and 127 MW, respectively.The peak load in the Valley Spur is forecast to exceed the circuits’ n-1 summercapacity by approximately 1 MW in 2016, increasing to approximately 40 MW in 2027(See Table 9-7).64The transformers’ capacity is limited by protection equipment; with this limit resolved, then-1 capacity will be 248/259 MVA (summer/winter).<strong>2012</strong> <strong>Annual</strong> <strong>Planning</strong> <strong>Report</strong> © <strong>Transpower</strong> New Zealand Limited <strong>2012</strong>. All rights reserved. 137
Chapter 9: Waikato RegionTable 9-7: Valley Spur circuit overload forecastGrid exit pointNext 5 yearsCircuit overload (MW)5-15 years out<strong>2012</strong> 2013 2014 2015 2016 2017 2019 2021 2023 2025 2027Valley Spur 0 0 0 0 1 5 14 22 28 35 40The transmission loading is further exacerbated by the low voltage along the spur(see Section 9.8.5 for more information).SolutionTogether with Powerco, we have investigated connecting a new grid exit point tothese circuits at Piako, part-way between Hamilton and Waihou (see Section 9.8.15for more information). Approximately 40% of the Waihou load will be shifted to Piako,and consequently the circuit overloading issue will only occur between Hamilton andPiako.We will investigate the installation of capacitors to relieve the Valley Spur low voltageissues (see Section 9.8.5 for more information). This provides an interim solution tothe Hamilton–Waihou circuits’ capacity issue, delaying the need for furthertransmission reinforcement by approximately one year.In the short term, the overload can be managed operationally.We will also investigate longer-term additional investment, other than installingcapacitors along the Valley Spur. Possible options include:constructing a third 110 kV Hamilton–Waihou circuit of a similar capacity to theexisting circuits, orupgrading the existing 110 kV Hamilton–Waihou circuits to increase their summercapacity.The timing and choice of the capacity reinforcement option will be influenced by loadgrowth and developments within Powerco’s network, such as load transfer from theValley Spur to Hinuera grid exit point.Depending on the solution, we may need to purchase easements for either a new lineor for some parts of an upgraded line.9.8.5 Waihou–Waikino–Kopu spur low voltageProject reference: VLYS-REA_PWS-DEV-01Project status/purpose: Possible, customer-specificIndicative timing: New capacitors: 2014-2017Supply transformer replacement: 2013-2015Indicative cost band: New capacitors: AWaihou supply transformer replacement: BWaikino supply transformer replacement: AIssueSupply bus voltages at the Waihou and Waikino grid exit points are forecast to fallbelow 0.95 pu following an outage of one 110 kV Hamilton–Waihou circuit. Inaddition, the step voltage change for such an outage will exceed 5%. Both grid exitpoints have supply transformers with off-load tap changers.SolutionWe are investigating options to maintain voltage at the Waihou and Waikino buses.Possible options include:138<strong>2012</strong> <strong>Annual</strong> <strong>Planning</strong> <strong>Report</strong> © <strong>Transpower</strong> New Zealand Limited <strong>2012</strong>. All rights reserved.
Chapter 9: Waikato Regioninstalling two 20 Mvar capacitors (along the Valley Spur or within Powerco’snetwork), which will also defer Valley Spur investment (see Section 9.8.4 for moreinformation), orreplacing the existing transformers at Waikino and Waihou, which are due forreplacement in the next 10 years, with on-load tap changing transformers, andinstalling a lesser number of capacitors.Property issues may arise if there is a need to expand the substation toaccommodate the new capacitors.9.8.6 Cambridge supply transformer capacityProject reference: CBG-SUBEST-EHMT-01Project status/purpose: Committed, minor enhancement and customer-specificIndicative timing: 2013Indicative cost band: AIssueTwo 110/11 kV transformers supply Cambridge’s load, providing:a total nominal installed capacity of 80 MVA, andn-1 capacity of 38/38 65 MVA (summer/winter).The peak load at Cambridge is forecast to exceed the transformers’ n-1 wintercapacity by approximately 3 MW in <strong>2012</strong>, increasing to approximately 12 MW in 2027(see Table 9-8).Table 9-8: Cambridge supply transformer overload forecastGrid exitpointPowerfactorNext 5 yearsTransformer overload (MW)5-15 years out<strong>2012</strong> 2013 2014 2015 2016 2017 2019 2021 2023 2025 2027Cambridge 0.98 3 4 5 5 5 6 8 8 10 11 12SolutionThe Cambridge 11 kV switchgear is currently being replaced. This will resolve thebus and protection limits, providing sufficient capacity until 2023 when thetransformers’ n-1 winter capacity will be exceeded by approximately 1 MW. Thisoverload will increase to approximately 2 MW in 2027. We will discuss the options toincrease the supply transformers’ n-1 capacity with Waipa Networks closer to thistime.9.8.7 Hamilton supply transformer capacityProject reference: HAM-SUBEST-DEV-01Project status/purpose: Possible, customer-specificIndicative timing: New supply transformer at Hamilton: 2015New supply transformer at Te Kowhai: 2018Indicative cost band: Cost for one new supply transformer: A (at Hamilton), C (at Te Kowhai)IssueHamilton has both an 11 kV and a 33 kV supply bus. In 2015, the 11 kV supply willbe decommissioned and the load transferred to the 33 kV.Two 110/11 kV transformers supply Hamilton’s 11 kV load, providing:65The transformers’ capacity is limited by the 11 kV bus and protection limits; with these limitsresolved, the n-1 capacity will be 45/47 MVA (summer/winter).<strong>2012</strong> <strong>Annual</strong> <strong>Planning</strong> <strong>Report</strong> © <strong>Transpower</strong> New Zealand Limited <strong>2012</strong>. All rights reserved. 139
Chapter 9: Waikato Regiona total nominal installed capacity of 80 MVA, andn-1 capacity of 40/40 66 MVA (summer/winter).The peak load at Hamilton 11 kV is forecast to exceed the transformers’ n-1 wintercapacity by approximately 10 MW in <strong>2012</strong>, increasing to approximately 13 MW in2014 (see Table 9-9).Two 220/33 kV transformers supply Hamilton’s 33 kV load, providing:a total nominal installed capacity of 220 MVA, andn-1 capacity of 124/132 MVA (summer/winter).The peak load at Hamilton 33 kV is forecast to exceed the transformers’ n-1 wintercapacity by approximately 34 MW in <strong>2012</strong>, increasing to approximately 68 MW in2015. When the 11 kV supply bus is decommissioned and the load is transferred tothe 33 kV bus, the 220/33 kV transformer overload forecast increases toapproximately 141 MW in 2027 (see Table 9-9). This large overload is partly due toload shifting from Te Kowhai to Hamilton to manage distribution company loads.Table 9-9: Hamilton supply transformer overload forecastGrid exitpointPowerfactorNext 5 yearsTransformer overload (MW)5-15 years out<strong>2012</strong> 2013 2014 2015 2016 2017 2019 2021 2023 2025 2027Hamilton 11 kV 1.00 10 12 13 0 0 0 0 0 0 0 0Hamilton 33 kV 0.99 34 37 40 68 97 102 111 119 127 135 141WEL Networks is capable of significant load shifting between Hamilton and TeKowhai, so the combined load is compared with the total supply transformer capacityat both grid exit points.Four 220/33 kV transformers at Hamilton and Te Kowhai supply the total Hamiltoncity 33 kV load, providing:a total nominal installed capacity of 420 MVA, andn-1 capacity of 342/350 MVA (summer/winter).The total load is forecast to be 220 MW in <strong>2012</strong>, increasing to 354 MW by 2027. Thetotal supply transformer capacity will not be exceeded until approximately 2026.SolutionAn interim solution is to transfer load to the Te Kowhai grid exit point. Table 9-9shows that significant load transfers will be required by 2027. As a longer-termsolution, we are investigating a range of options with WEL networks that include:increasing the rating of the two existing supply transformers at Te Kowhai (acommitted project, see Section 9.9.4)installing a third 220/33 kV supply transformer at Hamilton, andinstalling a third 220/33 kV supply transformer at Te Kowhai (see Section 9.9.4).In addition, Hamilton T5 transformer has an expected end-of-life in the next 10-15years. We will discuss with WEL Networks the appropriate rating and timing for thereplacement transformer.9.8.8 Hangatiki supply transformer capacityProject reference:Project status/purpose:HTI-POW_TFR-REPL-01Base Capex, replacement66The transformers’ capacity is limited by the 11 kV transformer branch component; with this limitresolved, the n-1 capacity will be 48/51 MVA (summer/winter).140<strong>2012</strong> <strong>Annual</strong> <strong>Planning</strong> <strong>Report</strong> © <strong>Transpower</strong> New Zealand Limited <strong>2012</strong>. All rights reserved.
Chapter 9: Waikato RegionIndicative timing: 2015Indicative cost band: BIssueTwo 110/33 kV transformers supply Hangatiki’s load, providing:a total nominal installed capacity of 40 MVA, andn-1 capacity of 22/24 MVA (summer/winter).Hangatiki winter and summer load peaks are similar. The peak load at Hangatiki isforecast to exceed the transformers’ n-1 summer capacity by approximately 13 MW in<strong>2012</strong>, increasing to approximately 20 MW in 2027 (see Table 9-10).Table 9-10: Hangatiki supply transformer overload forecastGrid exitpointPowerfactorNext 5 yearsTransformer overload (MW)5-15 years out<strong>2012</strong> 2013 2014 2015 2016 2017 2019 2021 2023 2025 2027Hangatiki 0.88 13 14 14 15 15 16 17 18 19 20 20SolutionThe Hangatiki transformers are made up of single-phase units, with a non-contractedspare available on site. There is a possibility of new embedded generation in thisarea that may reduce peak transformer loading.We are discussing longer-term options with The Lines Company, such as replacingthe existing transformers with two 40 MVA supply transformers.In addition, all the Hangatiki supply transformers have an expected end-of-life withinthe next five years. Future investment will be customer driven.9.8.9 Hinuera supply transformer capacityProject reference: New grid exit point: PTR-SUBEST-DEV-01Transformer replacement: HIN-POW_TFR-EHMT-01Project status/purpose: Possible, customer-specificIndicative timing: New grid exit point: 2014Transformer replacement: to be advisedIndicative cost band: New grid exit point: CTransformer replacement: AIssueTwo 110/33 kV transformers (rated at 30 MVA and 50 MVA) supply Hinuera’s load,providing:a total nominal installed capacity of 80 MVA, andn-1 capacity of 37/40 MVA (summer/winter).The peak load at Hinuera is forecast to exceed the transformers’ n-1 winter capacityby approximately 13 MW in <strong>2012</strong>. The overload will decrease in 2014 if Putaruru iscompleted. The transformers’ n-1 winter capacity will be exceeded by approximately8 MW in 2014, increasing to approximately 20 MW in 2027 (see Table 9-11).<strong>2012</strong> <strong>Annual</strong> <strong>Planning</strong> <strong>Report</strong> © <strong>Transpower</strong> New Zealand Limited <strong>2012</strong>. All rights reserved. 141
Chapter 9: Waikato RegionTable 9-11: Hinuera supply transformer overload forecastGrid exitpointPowerfactorNext 5 yearsTransformer overload (MW)5-15 years out<strong>2012</strong> 2013 2014 2015 2016 2017 2019 2021 2023 2025 2027Hinuera 0.95 13 14 8 8 9 10 12 14 16 18 20Hinuera(no Putaruru)0.95 13 14 15 16 17 18 21 23 25 28 30SolutionPowerco is planning to increase transmission security in the Hinuera area with a newgrid exit point near Putaruru, which will be connected to the existing 110 kV Arapuni–Kinleith circuit 2 (see also Section 9.8.10). This new grid exit point will reduceHinuera load by approximately 15% by 2027, but will not resolve the Hinuera supplytransformer overload issue.We will discuss with Powerco the options to relieve this issue, one of which is toreplace the 30 MVA transformer with a 60 MVA unit. This will provide n-1 security ofsupply beyond the forecast period 67 . In the short term, load may be transferred withinthe Powerco network from Hinuera to Waihou to resolve this issue. Any futureinvestment or transformer upgrade will be customer driven.9.8.10 Hinuera transmission securityProject reference: PTR-SUBEST-DEV-01Project status/purpose: Possible, customer-specificIndicative timing: 2014Indicative cost band: CIssueA single 110 kV circuit from Karapiro supplies Hinuera’s load, providing:a capacity of 63/77 MVA (summer/winter), andno n-1 security (given there is only one supplying circuit).Peak load in the Hinuera area is forecast to be 47 MW in <strong>2012</strong>, increasing to 54 MWin 2027.SolutionPowerco is considering increasing transmission security to Hinuera’s load with a newgrid exit point near Putaruru (connected to the existing 110 kV Arapuni–Kinleith circuit2). Land will need to be acquired for the new grid exit point.Some of Hinuera’s load will be transferred to Putaruru, with most of the remaindersecured by backfeeding within the local lines distribution system from Putaruru orWaihou.9.8.11 Kopu supply transformer capacityProject reference: KPU-POW_TFR_PTN-EHMT-01Project status/purpose: Base Capex, minor enhancementIndicative timing: Q4 <strong>2012</strong>Indicative cost band: A67The 50 MVA transformer’s capacity is limited by 33 kV metering; this limit will bind from 2021 if it isnot resolved.142<strong>2012</strong> <strong>Annual</strong> <strong>Planning</strong> <strong>Report</strong> © <strong>Transpower</strong> New Zealand Limited <strong>2012</strong>. All rights reserved.
Chapter 9: Waikato RegionIssueTwo 110/66 kV transformers supply Kopu’s load, providing:a total nominal installed capacity of 120 MVA, andn-1 capacity of 45/45 MVA 68 (summer/winter).The peak load at Kopu is forecast to exceed the transformers’ n-1 capacity byapproximately 9 MW in <strong>2012</strong>, increasing to approximately 31 MW in 2027 (see Table9-12).Table 9-12: Kopu supply transformer overload forecastGrid exitpointPowerfactorNext 5 yearsTransformer overload (MW)5-15 years out<strong>2012</strong> 2013 2014 2015 2016 2017 2019 2021 2023 2025 2027Kopu -0.99 9 11 12 14 15 17 21 24 26 29 31SolutionResolving the protection limit will increase the transformers’ n-1 capacity to64/67 MVA (summer/winter), providing sufficient capacity until 2018. Following theprotection upgrade, the peak load at Kopu is forecast to exceed the transformers’ n-1winter capacity by approximately 1 MW in 2018. This overload will increase toapproximately 13 MW in 2027. We will discuss options to increase the supplytransformers’ n-1 capacity with Powerco closer to this time. Alternatives may include:replacing the existing transformers with higher capacity units, orconverting some 66 kV feeders to 110 kV operation.9.8.12 Maraetai–Whakamaru transmission capacityProject status/purpose:This issue is for information onlyIssueThe 220 kV Maraetai–Whakamaru 1 and 2 circuits are each rated at 202/246 MVA(summer/winter). These circuits carry the entire generation output of the Waipapaand Maraetai generation stations to Whakamaru.The generation stations’ combined capacity is 411 MW. If there is an outage of one ofthe Maraetai–Whakamaru circuits, generation is restricted to approximately 50% offull capacity in summer and 60% of full capacity in winter.SolutionIn case of a contingency, a generation runback scheme is in place to reducegeneration to the available capacity of the remaining circuit. This situation has beenconsidered satisfactory since the generation was first installed, and there are noplans to make transmission network changes at this stage.9.8.13 Te Awamutu supply transformer capacityProject reference: TMU-POW_TFR_PTN-EHMT-01Project status/purpose: Base Capex, minor enhancementIndicative timing: 2013Indicative cost band: A68The transformers’ capacity is limited by protection equipment; with this limit resolved, then-1 capacity will be 64/67 MVA (summer/winter).<strong>2012</strong> <strong>Annual</strong> <strong>Planning</strong> <strong>Report</strong> © <strong>Transpower</strong> New Zealand Limited <strong>2012</strong>. All rights reserved. 143
Chapter 9: Waikato RegionIssueTwo 110/11 kV transformers supply Te Awamutu’s load, providing:a total nominal installed capacity of 80 MVA, andn-1 capacity of 41/41 MVA 69 (summer/winter).The peak load at Te Awamutu is forecast to exceed the transformers’ n-1 capacity byapproximately 1 MW in 2015, increasing to approximately 10 MW in 2027 (see Table9-13).Table 9-13: Te Awamutu supply transformer overload forecastGrid exitpointPowerfactorNext 5 yearsTransformer overload (MW)5-15 years out<strong>2012</strong> 2013 2014 2015 2016 2017 2019 2021 2023 2025 2027Te Awamutu 0.98 0 0 0 1 1 2 3 5 6 8 10SolutionResolving the protection limit will increase the transformers’ n-1 capacity to52/54 MVA (summer/winter), providing sufficient capacity for the forecast period andbeyond.9.8.14 Te Awamutu transmission securityProject reference: HTI_TMU-TRAN-DEV-01Project status/purpose: Possible, customer-specificIndicative timing: Q1 2015Indicative cost band: DIssueA single 110 kV circuit from Karapiro supplies Te Awamutu’s load, providing:a capacity of 63/77 MVA (summer/winter), andno n-1 security (given there is only one supplying circuit).Te Awamutu’s peak load is forecast to be 38 MW in <strong>2012</strong>, increasing to 46 MW in2027.SolutionWe have investigated and discussed several options with Waipa Networks forproviding n-1 security to Te Awamutu, which include:a new 110 kV circuit from Hangatiki to Te Awamutu, ora second 110 kV circuit from Karapiro to Te Awamutu.Waipa Networks may construct a new 110 kV circuit from Hangatiki to Te Awamutu,to be operated by <strong>Transpower</strong>.9.8.15 Waihou supply transformer capacityProject reference: New grid exit point: PAO-SUBEST-DEV-01Transformer replacement: WHU-POW_TFR-REPL-01Project status/purpose: New grid exit point: committed, customer-specificTransformer replacement: Base Capex, replacementIndicative timing: New grid exit point: <strong>2012</strong>-2013Transformer replacement: 2022-202769The transformers’ capacity is limited by protection equipment; with this limit resolved, then-1 capacity will be 52/54 MVA (summer/winter).144<strong>2012</strong> <strong>Annual</strong> <strong>Planning</strong> <strong>Report</strong> © <strong>Transpower</strong> New Zealand Limited <strong>2012</strong>. All rights reserved.
Chapter 9: Waikato RegionIndicative cost band:New grid exit point: CTransformer replacement: BIssueThree 110/33 kV transformers supply Waihou’s load, providing:a total nominal installed capacity of 60 MVA, andn-1 capacity of 48/51 MVA (summer/winter).Waihou winter and summer peak loads are similar. The peak load at Waihou isforecast to exceed the transformers’ n-1 summer capacity by approximately 26 MW in<strong>2012</strong>. The overload will decrease when Piako is completed, increasing toapproximately 17 MW in 2027 (see Table 9-14).Table 9-14: Waihou supply transformer overload forecastGrid exitpointPowerfactorNext 5 yearsTransformer overload (MW)5-15 years out<strong>2012</strong> 2013 2014 2015 2016 2017 2019 2021 2023 2025 2027Waihou 0.96 26 1 2 3 5 6 9 11 13 15 17Following a supply transformer contingency (for example, a unit failure), restoration offull capacity can be achieved by:shifting load to other grid exit points, andswapping a transformer unit with an on-site spare unit, taking up to 14 hours tocomplete.SolutionPowerco is planning to increase transmission security to Waihou with a new grid exitpoint at Piako. Piako will connect to the existing 110 kV Hamilton–Waihou circuitsand reduce Waihou peak load by approximately 40% by 2027.This will not resolve the Waihou supply transformer overload issue. A likely long-termsolution is to replace the existing transformers with higher-rated transformers. Thesetransformers have an expected end-of-life within the next 10-15 years. We willdiscuss with Powerco the appropriate number, rating, and timing for the replacementtransformers.In addition, we will convert the 33 kV outdoor switchyard to an indoor switchboardwithin the next five years.9.8.16 Waikino supply transformer capacityProject reference: WKO-POW_TFR-EHMT-01Project status/purpose: Base Capex, replacementIndicative timing: 2021Indicative cost band: BIssueTwo 110/33 kV transformers supply Waikino’s load, providing:a total nominal installed capacity of 60 MVA, andn-1 capacity of 37/39 MVA (summer/winter).The peak load at Waikino is forecast to exceed the transformers’ n-1 summercapacity by approximately 5 MW in <strong>2012</strong>, increasing to approximately 23 MW in 2027(see Table 9-15).<strong>2012</strong> <strong>Annual</strong> <strong>Planning</strong> <strong>Report</strong> © <strong>Transpower</strong> New Zealand Limited <strong>2012</strong>. All rights reserved. 145
Chapter 9: Waikato RegionTable 9-15: Waikino supply transformer overload forecastGrid exitpointPowerfactorNext 5 yearsTransformer overload (MW)5-15 years out<strong>2012</strong> 2013 2014 2015 2016 2017 2019 2021 2023 2025 2027Waikino 1.00 5 6 7 8 10 11 14 17 19 21 23SolutionIn the short term, operational measures can be used to manage this issue. We willdiscuss with Powerco the options to increase the supply transformers’ n-1 capacity.In addition, the existing supply transformers at Waikino will approach their expectedend-of-life within the next 5-10 years, and conversion of the existing 33 kV switchgearfrom outdoor to an indoor switchboard is planned for around the same time.9.9 Other regional items of interest9.9.1 Cambridge spur capacityProject statuspurpose:This issue is for information onlyIssueThe Cambridge Spur comprises three loads (at Cambridge, Te Awamutu, andHinuera), which are offset by Karapiro generation. There are two 110 kV circuitssupplying this spur, each with a capacity of 57/70 MVA (summer/winter).The summer peak load on this spur is approaching the winter peak load, and thecombined load on the Cambridge Spur in summer 2011 was approximately 100 MW.This is forecast to increase to approximately 128 MW by 2027. To avoid exceedingthe n-1 capacity of the Hamilton–Cambridge–Karapiro circuits during peak summerload periods, Karapiro’s minimum generation will need to be approximately 47 MW in<strong>2012</strong>. However, the minimum Karapiro generation will decrease to 42 MW followingthe commissioning of Putaruru in 2014, increasing to 62 MW in 2027.SolutionKarapiro generation is generally reliable and has a capacity of 90 MW. It typicallyoperates at 40 MW during low load periods and 80-90 MW during daytime peaks.Hinuera load will decrease when the new Putaruru grid exit point is commissioned in2014. However, with continued load growth and periods of low water inflows, therewill eventually be insufficient available generation to avoid exceeding the Hamilton–Cambridge–Karapiro circuits’ n-1 capacity (requiring a circuit upgrade).The proposed Hangatiki–Te Awamutu 110 kV circuit will also impact the loading onthese circuits (see Section 9.8.14). Depending on the generation and load pattern inthe region, the flows on the Cambridge spur may increase or decrease.We will investigate options to alleviate the overload.9.9.2 Hamilton low voltageProject status/purpose:This issue is for information onlyIssueThe Hamilton 220 kV bus will have low voltage (below 0.9 pu) from 2019 for thefollowing system conditions:high load periods146<strong>2012</strong> <strong>Annual</strong> <strong>Planning</strong> <strong>Report</strong> © <strong>Transpower</strong> New Zealand Limited <strong>2012</strong>. All rights reserved.
Chapter 9: Waikato Regionloss of the 220 kV Hamilton–Ohinewai circuit, andlow Waikato 110 kV generation.SolutionWe will investigate options to resolve this issue closer to the time it occurs. Some ofthe options include:reactive support in the Waikato 110 kV transmission network, anda third 220 kV connection to Hamilton (see Section 9.9.3).9.9.3 Hamilton transmission security during maintenanceProject status/purpose:This issue is for information onlyIssueWhen either a 220 kV Hamilton–Whakamaru circuit or a 220 kV Hamilton–Ohinewaicircuit or Hamilton 220/110 kV interconnection is out for maintenance, the 110 kVsystem is split from the 220 kV system, placing a considerable part of the Waikatoregion on n security.SolutionIt may be economic to provide full or partial n-1 security during maintenance. We areconsidering options that include a:new 200 MVA 220/110 kV transformer at a new substation, connected to theintersection of the 220 kV Otahuhu–Whakamaru 3 circuit and the 110 kVHamilton–Waihou circuits, orthird 220 kV circuit into Hamilton, and/orthird interconnecting transformer in parallel with the existing transformers.9.9.4 Te Kowhai substation developmentsProject reference: TWH-POW_TFR-EHMT-01Project status/purpose: Supply transformer upgrade: committed, customer-specificNew supply transformer: possible, customer-specificIndicative timing: Supply transformer upgrade: <strong>2012</strong>New supply transformer 2018Indicative cost band: Supply transformer upgrade: ANew supply transformer: CIssueTwo 220/33 kV transformers supply Te Kowhai’s load, providing:a total nominal installed capacity of 200 MVA, andn-1 capacity of 109/109 MVA (summer/winter).There are also two embedded generators (Te Uku and Te Rapa) at Te Kowhai. Thenet load in 2011 ranged from an injection of approximately 70 MW to an off take ofapproximately 85 MW.SolutionThe distribution network is capable of substantial load shifting between Te Kowhaiand Hamilton. The supply capacity at Hamilton is highly constrained (see Section9.8.7). Following discussions with WEL Networks, to enable additional load transfer toTe Kowhai from Hamilton, we are:increasing the rating of the two existing supply transformers by installing radiatorsand fans in <strong>2012</strong>, increasing the n-1 capacity to 132 MVA, and<strong>2012</strong> <strong>Annual</strong> <strong>Planning</strong> <strong>Report</strong> © <strong>Transpower</strong> New Zealand Limited <strong>2012</strong>. All rights reserved. 147
Chapter 9: Waikato Regionproposing to install a third 120 MVA 220/33 kV supply transformer at Te Kowhaiby around 2018.9.10 Waikato generation proposals and opportunitiesThis section details relevant regional issues for selected generation proposals underinvestigation by developers and in the public domain, or other generationopportunities.The maximum generation that can be connected at any substation depends onseveral factors and usually falls within a range. Generation developers shouldconsult with us at an early stage of their investigations to discuss connection issues.See our website for more information about connecting generation. 709.10.1 Hauauru Ma Raki wind stationThe proposed Hauauru Ma Raki wind generation station (also referred to as theWaikato wind station) may generate up to 540 MW, and will connect to the 220 kVdouble-circuit transmission line between Huntly and Drury.If it is necessary to cater for a generation scenario with maximum wind generationand maximum Huntly generation (assuming sustained low hydro generation), then itmay be necessary to reconductor the two 220 kV Huntly–Ohinewai circuits, andthermally upgrade the two 220 kV circuits between the wind station connection andDrury.9.10.2 Hangatiki generationThere are prospects to connect up to approximately 40 MW of generation atHangatiki. This generation will worsen the overloading issue on the 110 kV Arapuni–Hamilton circuits (see Section 9.8.1 for more information).To prevent the overloading of these circuits under a wide range of load andgeneration scenarios, the following upgrades will be required:runback schemes at Arapuni and/or Hangatiki.reconductoring the 110 kV Arapuni–Hamilton circuits.For example, during <strong>2012</strong> winter peak loads, with combined Huntly, Otahuhu, andSouthdown generation of 1,525 MW and Arapuni generation of 180 MW, anygeneration at Hangatiki will cause the Arapuni–Hamilton circuits to overload.In addition, any new generation on the 110 kV transmission network in the Waikatoregion will add to the 110 kV Bombay–Hamilton and 110 kV Arapuni–Kinleith loading(see Section 9.8.2). Options to enable this level of generation include generationrunback schemes, generation re-scheduling, and possibly reconductoring theBombay–Hamilton circuit. Possible overloading of the two 110 kV Arapuni–Kinleithcircuits may need to be addressed, but this may be required irrespective of additionalgeneration at Hangatiki.70http://www.transpower.co.nz/connecting-new-generation.148<strong>2012</strong> <strong>Annual</strong> <strong>Planning</strong> <strong>Report</strong> © <strong>Transpower</strong> New Zealand Limited <strong>2012</strong>. All rights reserved.
Chapter 10: Bay of Plenty Region10 Bay of Plenty Regional Plan10.1 Regional overview10.2 Bay of Plenty transmission system10.3 Bay of Plenty demand10.4 Bay of Plenty generation10.5 Bay of Plenty significant maintenance work10.6 Future Bay of Plenty projects summary and transmission configuration10.7 Changes since the 2011 <strong>Annual</strong> <strong>Planning</strong> <strong>Report</strong>10.8 Bay of Plenty transmission capability10.9 Other regional items of interest10.10 Bay of Plenty generation proposals and opportunities10.1 Regional overviewThis chapter details the Bay of Plenty regional transmission plan. We base thisregional plan on an assessment of available data, and welcome feedback to improveits value to all stakeholders.Figure 10-1: Bay of Plenty region<strong>2012</strong> <strong>Annual</strong> <strong>Planning</strong> <strong>Report</strong> © <strong>Transpower</strong> New Zealand Limited <strong>2012</strong>. All rights reserved. 149
Chapter 10: Bay of Plenty RegionThe Bay of Plenty region includes a mix of significant and growing provincial cities(Mount Maunganui, Tauranga, and Rotorua) together with smaller, less active rurallocalities (Waiotahi and Te Kaha) and heavy industry (Kawerau, and Kinleith Pulp andPaper Mills).We have assessed the Bay of Plenty region’s transmission needs over the next 15years while considering longer-term development opportunities. Specifically, thetransmission network needs to be flexible to respond to a range of future service andtechnology possibilities, taking into consideration:the existing transmission networkforecast demandforecast generationequipment replacement based on condition assessment, andpossible technological development.10.2 Bay of Plenty transmission systemThis section highlights the state of the Bay of Plenty regional transmission network.The existing transmission network is set out geographically in Figure 10-1 andschematically in Figure 10-2.Figure 10-2: Bay of Plenty transmission schematic11 kV110 kVMount Maunganui33 kV110 kVTauranga33 kV110 kVKaitimako33 kVTe Matai110 kVOkereEdgecumbe110 kV33 kVWaiotahi110 kV 50 kVTe Kaha11 kV11 kV220 kVWAIKATOArapuniLichfield110 kV11 kV220 kVTarukenga110 kV11 kVWheao110 kV11 kV 33 kVRotoruaOwhata110 kV11 kVKawerau110 kV 220 kV11 kV11 kV11 kV(TASMAN)KEY220kV CIRCUIT110kV CIRCUIT50kV CIRCUITSUBSTATION BUSTRANSFORMERTEE POINTLOADCAPACITORGENERATOR110 kVKinleithMatahina33 kVAtiamuriOhakuriWAIKATO110 kVAniwhenua10.2.1 Transmission into the regionBay of Plenty generation is lower than maximum local demand, with the deficitimported through the National Grid during peak load conditions, and any surplusexported during light load conditions.The 220 kV Whakamaru–Atiamuri and Ohakuri–Wairakei circuits connect the regionto the rest of the National Grid. The region will be on n security whenever one circuitis out of service for maintenance. These circuits’ capacities are expected to beadequate to supply the regional load in the short term. We will monitor the generationdevelopments in the region and the Wairakei Ring area to determine if a transmissionupgrade is required. See Chapter 6, section 6.4.3 for more information.150<strong>2012</strong> <strong>Annual</strong> <strong>Planning</strong> <strong>Report</strong> © <strong>Transpower</strong> New Zealand Limited <strong>2012</strong>. All rights reserved.
Chapter 10: Bay of Plenty RegionThere is also a low capacity 110 kV Tarukenga–Kinleith–Arapuni connection. Thisconnection is presently split at Arapuni to prevent it overloading.10.2.2 Transmission within the regionThe transmission network in the Bay of Plenty region comprises 220 kV and 110 kVcircuits with interconnecting transformers located at Tarukenga, Edgecumbe, andKawerau. The Edgecumbe interconnecting transformers are not normally in service.There is also a single 50 kV circuit between Waiotahi and Te Kaha.The Bay of Plenty load is predominantly supplied through the 220 kV Whakamaru–Atiamuri and Ohakuri–Wairakei circuits, with lower capacity 110 kV circuits throughKinleith. Reactive power support is provided by 25 Mvar capacitors at Tauranga andMount Maunganui.Within the region, we will be converting the 110 kV transmission network betweenTarukenga and Kaitimako 71 to 220 kV to provide greater capacity into MountMaunganui and Tauranga. This will resolve other system issues such as theoverloading of a Tarukenga interconnecting transformer and the overloading of a110 kV Okere–Te Matai circuit.We are also discussing with Powerco and Unison options to increase the:capacity into and around Rotorua which may involve line upgrades betweenTarukenga and Rotorua, and/or new supply transformers at Rotorua and Owhata,andsupply security by building a new grid exit point at Papamoa to alleviate loadgrowth at Mount Maunganui and Te Matai.Generation and interruptible load connected directly or indirectly to the Kawerau110 kV bus must sometimes be constrained to prevent overloading of the 220/110 kVtransformers. There is a total of 236 MW installed generation capacity at Kawerau(Aniwhenua, Kawerau Geothermal, and Matahina).10.2.3 Longer-term development pathNo firm options have been developed for the Bay of Plenty region beyond theplanning period. However, long-term planning for recent projects has indicated thefollowing possible developments in the 10-20 year range.A third interconnecting transformer at Kaitimako.A third interconnecting transformer at Tarukenga.Additional reactive support in the western Bay of Plenty area.Capacity upgrades on the Okere–Te Matai, Kaitimako–Te Matai and Okere–Tarukenga circuits.In the longer term, one possible development is a connection from north of Taurangato the existing Waihou substation in the Waikato region. This may be required tomeet long-term load growth in the fast-growing Tauranga area, and improve securityduring maintenance outages.There is the potential for significant additional geothermal generation in the easternBay of Plenty region, around Kawerau. If significant generation eventuates, then astaged transmission capacity upgrade will be required (see Section 10.10.1 for moreinformation).71The line between Tarukenga and Kaitimako is built at 220 kV but operated at 110 kV.<strong>2012</strong> <strong>Annual</strong> <strong>Planning</strong> <strong>Report</strong> © <strong>Transpower</strong> New Zealand Limited <strong>2012</strong>. All rights reserved. 151
Chapter 10: Bay of Plenty Region10.3 Bay of Plenty demandThe after diversity maximum demand (ADMD) for the Bay of Plenty region is forecastto grow on average by 1.2% annually over the next 15 years, from 581 MW in <strong>2012</strong> to689 MW by 2027. This is lower than the national average demand growth of 1.7%annually.Figure 10-3 shows a comparison of the 2011 and <strong>2012</strong> forecast 15-year maximumdemand (after diversity 72 ) for the Bay of Plenty region. The forecasts are derivedusing historical data, and modified to account for customer information, whereappropriate. The power factor at each grid exit point is also derived from historicaldata, and is used to calculate the real power capacity for power transformer andtransmission line. See Chapter 4 for more information about demand forecasting.Figure 10-3: Bay of Plenty region after diversity maximum demand forecastLoad (MW)800Bay of Plenty7507006506005505004504002011 APR Forecast350<strong>2012</strong> APR ForecastActual Peak3001997 1999 2001 2003 2005 2007 2009 2011 2013 2015 2017 2019 2021 2023 2025 2027Table 10-1 lists forecasts peak demand (prudent growth) for each grid exit point forthe forecast period, as required for the Grid Reliability <strong>Report</strong>.Table 10-1: Forecast annual peak demand (MW) at Bay of Plenty grid exit points to 2027Grid exit pointPowerfactorNext 5 yearsPeak demand (MW)5-15 years out<strong>2012</strong> 2013 2014 2015 2016 2017 2019 2021 2023 2025 2027Edgecumbe 0.96 65 67 70 72 75 77 83 88 92 96 99Kaitimako 1 0.98 22 27 34 35 36 37 39 41 43 45 47Kawerau Horizon 0.98 21 21 22 23 23 24 25 26 27 28 29Kawerau T6-T9 1.00 90 90 90 90 90 90 90 90 90 90 90Kawerau T11/ T14 0.98 85 85 85 85 85 85 85 85 85 85 85Kinleith 11 kV -0.94 85 85 85 85 85 85 85 85 85 85 85Kinleith 33 kV 0.98 28 29 29 30 30 31 32 33 34 35 36Lichfield 0.95 9 9 9 9 9 9 9 9 9 9 972The after diversity maximum demand (ADMD) for the region will be less than the sum of theindividual grid exit point peak demands, as it takes into account the fact that the peak demand doesnot occur simultaneously at all the grid exit points in the region.152<strong>2012</strong> <strong>Annual</strong> <strong>Planning</strong> <strong>Report</strong> © <strong>Transpower</strong> New Zealand Limited <strong>2012</strong>. All rights reserved.
Chapter 10: Bay of Plenty RegionGrid exit pointPowerfactorNext 5 yearsPeak demand (MW)5-15 years out<strong>2012</strong> 2013 2014 2015 2016 2017 2019 2021 2023 2025 2027Mt Maunganui 0.98 72 74 76 74 76 79 84 88 92 96 9933 kV 2Owhata 0.99 16 16 17 17 17 18 18 19 20 20 21Papamoa 2 0.98 0 0 0 10 10 10 10 10 10 10 10Rotorua 11 kV 0.97 35 35 36 36 36 36 37 38 38 39 39Rotorua 33 kV 0.97 42 42 43 43 43 44 44 45 46 47 47Tauranga 11 kV 1 0.99 30 31 26 27 28 28 30 31 32 34 35Tauranga 33 kV 0.95 88 91 93 96 99 102 108 114 118 123 127Tarukenga 11 kV 1.00 12 12 12 13 13 13 13 14 14 14 15Te Kaha 0.97 2 2 2 2 2 2 2 2 3 3 3Te Matai 2 0.96 33 34 35 31 32 33 35 37 39 41 42Waiotahi 0.98 10 10 11 11 11 11 12 12 13 13 141. The customer advises that 5 MW of load will be shifted from Tauranga 11 kV to Kaitimako in 2014.2. The customer advises that some 5 MW from Mt Maunganui and 5MW from Te Matai may be shiftedto the new Papamoa East grid exit point in 2015.10.4 Bay of Plenty generationThe Bay of Plenty region’s generation capacity is approximately 393 MW.Kaimai is a run of river scheme that varies between 14 MW and 42 MW, injecting intothe Tauranga 33 kV bus. Typically, 14 MW is the minimum generation available fromthe scheme, which is used to offset peak grid exit point loads, but only if sufficientwater is available.Table 10-2 lists the generation forecast for each grid injection point for the forecastperiod, as required for the Grid Reliability <strong>Report</strong>. This includes all known andcommitted generation stations including those embedded within the relevant locallines company’s network (Horizon, Unison, or Powerco). 73Table 10-2: Forecast annual generation capacity (MW) at Bay of Plenty grid injectionpoints to 2027 (including existing and committed generation)Grid injection point(location if embedded)Next 5 yearsGeneration capacity (MW)5-15 years out<strong>2012</strong> 2013 2014 2015 2016 2017 2019 2021 2023 2025 2027Aniwhenua 25 25 25 25 25 25 25 25 25 25 25Edgecumbe(Bay Milk)10 10 10 10 10 10 10 10 10 10 10Kawerau (BOPE) 6 6 6 6 6 6 6 6 6 6 6Kawerau (TPP) 37 37 37 37 37 37 37 37 37 37 37Kawerau - KAG 105 105 105 105 105 105 105 105 105 105 105Kawerau (KA24) 9 9 9 9 9 9 9 9 9 9 9Kawerau (Norske Skog) 25 25 25 25 25 25 25 25 25 25 25Kinleith 28 28 28 28 28 28 28 28 28 28 28Matahina 72 72 72 72 72 72 72 72 72 72 72Mount Maunganui(Ballance Agri)7 7 7 7 7 7 7 7 7 7 773Only generators with a capacity greater than 1 MW are listed. Generation capacity is rounded to thenearest megawatt.<strong>2012</strong> <strong>Annual</strong> <strong>Planning</strong> <strong>Report</strong> © <strong>Transpower</strong> New Zealand Limited <strong>2012</strong>. All rights reserved. 153
Chapter 10: Bay of Plenty RegionGrid injection point(location if embedded)Rotorua(Fletcher Forests)Rotorua (Wheao, Flaxy,Kaingaroa)Next 5 yearsGeneration capacity (MW)5-15 years out<strong>2012</strong> 2013 2014 2015 2016 2017 2019 2021 2023 2025 20273 3 3 3 3 3 3 3 3 3 324 24 24 24 24 24 24 24 24 24 24Tauranga (Kaimai) 42 42 42 42 42 42 42 42 42 42 4210.5 Bay of Plenty significant maintenance workOur capital project and maintenance works are integrated to enable system issues tobe resolved if possible when assets are replaced or refurbished. Table 10-3 lists thesignificant maintenance-related work 74 proposed for the Bay of Plenty region for thenext 15 years that may significantly impact related system issues or connectedparties.Table 10-3: Proposed significant maintenance workDescription Tentative year Related system issuesEdgecumbe supply transformersexpected end-of-life, andEdgecumbe 33 kV outdoor to indoorconversion2027-2029<strong>2012</strong>-2014The forecast load will exceed the transformers’n-1 capacity from 2013. See Section 10.8.4 formore information.Edgecumbe interconnectingtransformers expected end-of-lifeKawerau 110/11 kV supplytransformers expected end-of-life,and 11 kV switchgear replacementAll Kinleith 110/11 kV supplytransformers expected end-of-life,and 11 kV indoor switchboardreplacementKinleith T4 supply transformerexpected end-of-lifeOwhata supply transformersexpected end-of-life, and 11 kVswitchgear replacementRotorua110/11 kV supplytransformers expected end-of-lifeTarukenga interconnectingtransformers replacement2024-2026 The Edgecumbe interconnecting transformersare normally open to reduce generationconstraints at Kawerau. See Section 10.10.1 formore information.2018-2020 Replacing these transformers will affect the11 kV fault level. See Section 10.10.1 for moreinformation.2016-2021 No system issues are identified within theforecast period.2016-2021 Changing the transformer’s vector group willenable T4 and T5 to operate in parallel. This isone option to provide n-1 security to the 33 kVbus. See Section 10.8.7 for more information.2016-20182027-2029Upgrading the transformer’s capacity will resolvethe transformer overloading issue. See Section10.8.10 for more information.2013-2015 Upgrading the transformer’s capacity will resolvethe transformer overloading issue. See Section10.8.11 for more information.2013 Committed system development will relieveconstraints on 110 kV transmission networkbetween Tarukenga and Arapuni. See Section10.9.4 for more information.Te Kaha substation redevelopment <strong>2012</strong>-2013 No system issues are identified within theforecast period.Te Matai T1 supply transformerexpected end-of-lifeWaiotahi 110/11 kV supplytransformers expected end-of-life2025-2027 Upgrading the transformer capacity will resolvethe transformer overload issue. See Section10.8.16 for more information.2019-2021 Upgrading the transformer’s capacity will resolvethe transformer overloading issue. See Section10.8.17 for more information.74This may include replacement of the asset due to its condition assessment.154<strong>2012</strong> <strong>Annual</strong> <strong>Planning</strong> <strong>Report</strong> © <strong>Transpower</strong> New Zealand Limited <strong>2012</strong>. All rights reserved.
Chapter 10: Bay of Plenty Region10.6 Future Bay of Plenty projects summary and transmission configurationTable 10-4 lists projects to be carried out in the Bay of Plenty region within the next15 years.Figure 10-4 shows the possible configuration of Bay of Plenty transmission in 2027,with new assets, upgraded assets, and assets undergoing significant maintenancewithin the forecast period.Table 10-4: Projects in the Bay of Plenty region up to 2027Site Projects StatusEdgecumbeKawerauKaitimakoKinleithOwhataIncrease supply transformer protection settings – interim solution.Replace supply transformers with higher-rated units.Replace interconnecting transformers.Convert 33 kV outdoor switchgear to an indoor switchboard.Increase 220/110 kV transformer capacity.Replace 110/11 kV T1 and T2 supply transformers.Replace 11 kV switchgear.Install a new 220 kV bus, new two 150 MVA interconnectingtransformers, and thermally upgrade and convert Kaitimako–Tarukengato 220 kV operations.Install a third interconnecting transformer.Replace 110/11 kV supply transformer.Replace 11 kV indoor switchboard.Replace 110/33 kV T4 supply transformer.Replace 110/33 kV T5 supply transformer with higher-rated unit.Replace 110/11 kV supply transformers.Replace 11 kV switchgear.Base CapexPossibleBase CapexBase CapexProposedBase CapexBase CapexCommittedPossibleBase CapexBase CapexBase CapexPossibleBase CapexBase CapexPapamoa New grid exit point. PossibleRotorua–TarukengaThermal upgrade the circuit.PossibleRotorua Replace 110/11 kV supply transformers. Base CapexTarukenga Replace 220/110 kV interconnecting transformers. CommittedTauranga Upgrade 110/11 kV transformers’ branch limiting components PossibleTe Kaha Substation re-development. Base CapexTe Matai Replace 40 MVA supply transformer. Base CapexWaiotahi Replace 110/11 kV supply transformer. Base Capex<strong>2012</strong> <strong>Annual</strong> <strong>Planning</strong> <strong>Report</strong> © <strong>Transpower</strong> New Zealand Limited <strong>2012</strong>. All rights reserved. 155
Chapter 10: Bay of Plenty RegionFigure 10-4: Possible Bay of Plenty transmission configuration in 2027Mount Maunganui33 kVTauranga33 kV11 kV*110 kV110 kVKaitimako220 kV110 kV110 kVPapamoa33 kVTe Matai33 kV110 kV OkereEdgecumbe110 kV33 kVWaiotahi110 kV 50 kVTe Kaha11 kV11 kV220kVWAIKATOArapuniLichfield110 kV11 kV220 kVTarukenga110 kV11 kVWheao110 kV11 kV 33 kV110 kVRotorua11 kVOwhataKawerau110 kV 220 kV11 kV11 kV11 kV(TASMAN)KEYNEW ASSETSUPGRADED ASSETSASSETS SCHEDULEDFOR REPLACEMENTMINOR UPGRADE*110 kV33 kVKinleithAtiamuriWAIKATOOhakuri110 kVMatahinaAniwhenua10.7 Changes since the 2011 <strong>Annual</strong> <strong>Planning</strong> <strong>Report</strong>Table 10-5 lists the specific issues that are either new or no longer relevant within theforecast period when compared to last year's report.Table 10-5: Changes since 2011IssuesMount Maunganui supply transformer capacityChangeNew issue.10.8 Bay of Plenty transmission capabilityTable 10-6 summarises issues involving the Bay of Plenty region for the next 15years. For more information about a particular issue, refer to the listed sectionnumber.Table 10-6: Bay of Plenty region transmission issuesSectionnumberIssueRegional10.8.1 Kawerau 110 kV generation constraint10.8.2 Tarukenga interconnecting transformer capacity10.8.3 Tauranga and Mount Maunganui transmission securitySite by grid exit point10.8.4 Edgecumbe supply transformer capacity10.8.5 Kaitimako supply security10.8.6 Kinleith–Tarukenga 110 kV transmission capacity10.8.7 Kinleith 110/33 kV supply transformer capacity10.8.8 Mount Maunganui supply transformer capacity10.8.9 Okere–Te Matai 110 kV transmission capacity156<strong>2012</strong> <strong>Annual</strong> <strong>Planning</strong> <strong>Report</strong> © <strong>Transpower</strong> New Zealand Limited <strong>2012</strong>. All rights reserved.
Chapter 10: Bay of Plenty RegionSectionnumberIssue10.8.10 Owhata supply transformer capacity10.8.11 Rotorua supply transformer capacity10.8.12 Rotorua transmission security10.8.13 Tarukenga supply security10.8.14 Tauranga 11 kV supply transformer capacity10.8.15 Tauranga 33 kV supply transformer capacity10.8.16 Te Matai supply transformer capacity10.8.17 Waiotahi supply transformer capacity10.8.18 Waiotahi and Te Kaha supply security10.8.1 Kawerau 110 kV generation constraintProject reference: 110 kV reconfiguration: EDG_MAT-TRAN-DEV-01Interconnecting transformer: KAW-POW_TFR-DEV-01Project status/purpose: Proposed, to provide net market benefitIndicative timing: 110 kV reconfiguration: <strong>2012</strong>Interconnecting transformer: 2014Indicative cost band: 110 kV reconfiguration: AInterconnecting transformer: BIssueGeneration at Aniwhenua, Matahina, KAG, embedded generation within Horizon’sdistribution network and within the Norske-Skog mill connects to the Kawerau 110 kVbus. The Kawerau 110 kV bus is connected to the rest of the system through:Kawerau 220/110 kV transformer T12 (100 MVA, 20% impedance)Kawerau 220/110 kV transformer T13 (100 MVA, 10% impedance), andlow capacity 110 kV circuits (Kawerau–Edgecumbe 1 and 2, each rated at48/59 MVA, in series with Edgecumbe–Owhata rated at 57/69 MVA).There is an existing constraint for exporting generation from the Kawerau 110 kV busunder the following situations.High generation and low demand at Kawerau.An under frequency event for a Huntly generation trip or loss of the HVDCrequiring increased generation and tripping interruptible load.An outage of a 110 kV Edgecumbe–Kawerau circuit or the 220/110 kVinterconnecting transformer.Norske Skog is commissioning a 25 MW generator in December <strong>2012</strong>, connected tothe Kawerau 110 kV bus. This will increase the occurrences of generationconstraints at Kawerau.SolutionA grid upgrade proposal 75 has been submitted for Commerce Commission approvalto replace the Kawerau T12 transformer 76 with a 250 MVA 10% impedancetransformer. If approved, the project is expected to be completed in 2014.This will relieve existing generation constraints and allow for a small increase in futuregeneration connections at the Kawerau 110 kV bus.7576http://www.gridnewzealand.co.nz/n4751.htmlThe Kawerau 220/110 kV T12 transformer is 100 MVA, 20% impedance.<strong>2012</strong> <strong>Annual</strong> <strong>Planning</strong> <strong>Report</strong> © <strong>Transpower</strong> New Zealand Limited <strong>2012</strong>. All rights reserved. 157
Chapter 10: Bay of Plenty RegionWe will not be able to replace a transformer before 2014 due to the lead time toprocure and install the transformer. As part of our grid upgrade proposal, we willimplement an interim grid reconfiguration to relieve constraints until we commissionthe new transformer. The interim measure is to connect the Kawerau–Matahina 2circuit directly to the Edgecumbe–Kawerau 2 circuit, bypassing Kawerau to create asingle circuit between Matahina and Edgecumbe, and splitting the Matahina bus. TheEdgecumbe–Kawerau 1 circuit is open during this period (see Figure 10-5).Figure 10-5 : Grid reconfiguration to shift one Matahina generator to EdgecumbeTarukenga110 kVTe MataiOkereEdgecumbe110 kV33 kVWaiotahi220 kVKawerau110 kV 220 kVKEY220kV CIRCUIT110 kV11 kV11 kV110kV CIRCUITSUBSTATION BUSTRANSFORMEROwhata11 kV11 kV(TASMAN)TEE POINTLOADGENERATOROhakuriWAIKATO110 kVMatahina G1Matahina G2Aniwhenua10.8.2 Tarukenga interconnecting transformer capacityProject reference: 220/110 kV interconnection: KMO_TRK-TRAN-EHMT-01Interconnecting transformer: KMO-POW_TFR-DEV-01Project status/purpose: 220/110 kV interconnection: committed, to meet the Grid Reliability Standard(core grid)Interconnecting transformer: possible, to meet the Grid Reliability Standard(core grid)Indicative timing: 220/110 kV interconnection: Q4 <strong>2012</strong>Interconnecting transformer: 2017Indicative cost band: 220/110 kV interconnection: DInterconnecting transformer: BIssueTwo 220/110 kV interconnecting transformers at Tarukenga supply over half of theBay of Plenty region, including the Tauranga, Mount Maunganui, and Rotorua gridexit points. They provide:a total nominal installed capacity of 408 MVA, andn-1 capacity of 246/262 MVA (summer/winter).An outage of one interconnecting transformer may cause the other to exceed its n-1capacity. Operational measures can be taken, such as requiring increased outputfrom embedded hydro generation (assuming water is available) and load restrictions.158<strong>2012</strong> <strong>Annual</strong> <strong>Planning</strong> <strong>Report</strong> © <strong>Transpower</strong> New Zealand Limited <strong>2012</strong>. All rights reserved.
Chapter 10: Bay of Plenty RegionSolutionWe have a committed project to establish a 220/110 kV interconnection at Kaitimako,so the load at Tauranga and Mount Maunganui is removed from the Tarukengainterconnecting transformer.The new 220/110 kV interconnection at Kaitimako involves:thermally upgrading the Kaitimako–Tarukenga circuits and changing theoperating voltage from 110 kV to 220 kV 77 , andinstalling two new 220/110 kV, 150 MVA interconnecting transformers atKaitimako.This will also resolve the issue involving overloading of the 110 kV Okere–Te Matai(see Section 10.8.9) beyond the forecast period.The n-1 capacity of the new interconnection at Kaitimako (due to be commissioned atthe end of <strong>2012</strong>) is sufficient until 2017. The proposed new grid exit point atPapamoa (see Section 10.9.1) will further defer the Kaitimato interconnectingtransformers overload issue until 2018. Operational measures, such as requiringincreased output from embedded hydro generation (assuming water is available) andload restrictions, may defer the overload for another few years. In the longer-term, athird interconnecting transformer is likely to be required at Kaitimako.10.8.3 Tauranga and Mount Maunganui transmission securityProject reference:Project status/purpose:Indicative timing:Indicative cost band:PPM-SUBEST-DEV-01Possible, customer-specificTo be advisedBIssueTauranga and Mount Maunganui are supplied from Kaitimako through the following110 kV circuits (see Figure 10-6):Kaitimako–Tauranga 1, rated at 96/105 MVA (summer/winter)Kaitimako–Mount Maunganui 1, rated at 63/77 MVA (summer/winter), anda shared Kaitimako–Tauranga–Mount Maunganui 2 circuit with the followingratings.• Kaitimako–Poike section 96/105 MVA (summer/winter).• Poike–Tauranga section 96/105 MVA (summer/winter).• Poike–Mount Maunganui 63/77 MVA (summer/winter).77The Kaitimako–Tarukenga circuits are constructed at 220 kV, but operated at 110 kV.<strong>2012</strong> <strong>Annual</strong> <strong>Planning</strong> <strong>Report</strong> © <strong>Transpower</strong> New Zealand Limited <strong>2012</strong>. All rights reserved. 159
Chapter 10: Bay of Plenty RegionFigure 10-6: Kaitimako grid configurationMount Maunganui110 kVTaurangaPoike Kaitimako110 kV 110 kVTe Matai110 kVEdgecumbe110 kVOkereTarukenga110 kV110 kVOwhataFor Tauranga and Mount Maunganui security, an outage of the Kaitimako–Tauranga 1 circuit during peak load periods will cause the Kaitimako–Poike circuitsection to overload from 2013. This assumes Kaimai (Tauranga) is generating14 MW.In addition, an outage of a Kaitimako–Mount Maunganui circuit or a MountMaunganui–Poike circuit section will overload the other circuit from 2017.For Tauranga, an outage of the Kaitimako–Tauranga circuit or the Poike–Taurangacircuit section will overload the other circuit from 2020.SolutionThe overloading of the Kaitimako–Poike circuit section is addressed by an existingspecial protection scheme, which will reconfigure the Kaitimako–Tauranga–MountMaunganui 2 circuit at Tauranga or Mount Maunganui to remove the overload. Thisaddresses the issue only until the load at Mount Maunganui and Tauranga exceedsthe rating of the Kaitimako–Mount Maunganui (2017) and Kaitimako–Taurangacircuits (2020).We will discuss options to address the Tauranga security issue with Powerco, whichinclude:transferring more load from Tauranga to the new Kaitimako grid exit point, andshort-term operational measures to limit the Tauranga load and/or constrain-ongeneration at Kaimai.Future investment will be customer driven.The Mount Maunganui security issue is addressed by:transferring load from Mount Maunganui to a proposed new Papamoa grid exitpoint (see Section 10.9.1), andoperational measures (if required in the short term) to limit the Mount Maunganuiload.Land will need to be acquired for the new grid exit point at Papamoa.160<strong>2012</strong> <strong>Annual</strong> <strong>Planning</strong> <strong>Report</strong> © <strong>Transpower</strong> New Zealand Limited <strong>2012</strong>. All rights reserved.
Chapter 10: Bay of Plenty Region10.8.4 Edgecumbe supply transformer capacityProject reference: Upgrade protection: EDG-POW_TFR_PTN-EHMT-01Upgrade transformer: EDG-POW_TFR-EHMT-01Project status/purpose: Upgrade protection: Base Capex, minor enhancementUpgrade transformer: possible, customer-specificIndicative timing: Upgrade protection: 2013Upgrade transformer: to be advisedIndicative cost band: Upgrade protection: AUpgrade transformer: CIssueTwo 220/33 kV transformers supply Edgecumbe’s load, providing:a total nominal installed capacity of 100 MVA, andn-1 capacity of 60/60 MVA 78 (summer/winter).The peak load at Edgecumbe is forecast to exceed the transformers’ n-1 wintercapacity by approximately 9 MW in <strong>2012</strong>, increasing to approximately 43 MW in 2027(see Table 10-7).Table 10-7: Edgecumbe supply transformer overload forecastGrid exitpointPowerfactorNext 5 yearsTransformer overload (MW)5-15 years out<strong>2012</strong> 2013 2014 2015 2016 2017 2019 2021 2023 2025 2027Edgecumbe 0.96 9 11 14 16 19 21 27 31 35 40 43SolutionResolving the protection limit will delay the overload issue until 2013. We will discusswith Horizon Energy future supply options, which involve:limiting the load or transferring some load to another grid exit point in the shortterm, andreplacing the existing transformers with higher-rated units in the long term.We will also convert the Edgecumbe 33 kV outdoor switchgear to an indoorswitchboard within the next five years, and raise the protection limit in conjunctionwith the conversion work.In addition, the two supply transformers will approach their expected end-of-life at theend of the forecast period. Any future transformer upgrade will be customer driven.10.8.5 Kaitimako supply securityProject status/purpose:This issue is for information onlyIssueA single 110/33 kV, 75 MVA transformer supplies load at Kaitimako resulting in non-1 security. Some of the 33 kV Tauranga load will be shifted to Kaitimako, which isforecast to grow to 47 MW by 2027 (see also Section 10.8.3).SolutionThe lack of n-1 security can be managed operationally by transferring load toTauranga.78The transformers’ capacity is limited by protection settings; with this limit resolved, the n-1 capacitywill be 62/67 MVA (summer/winter).<strong>2012</strong> <strong>Annual</strong> <strong>Planning</strong> <strong>Report</strong> © <strong>Transpower</strong> New Zealand Limited <strong>2012</strong>. All rights reserved. 161
Chapter 10: Bay of Plenty Region10.8.6 Kinleith–Tarukenga 110 kV transmission capacityProject status/purpose:This issue is for information onlyThe 110 kV Kinleith–Tarukenga 1 and 2 circuits are rated at 51/62 MVA and63/77 MVA (summer/winter), respectively. These circuits may overload during lowArapuni and/or Upper North Island generation, if either of the following circuits is outof service:220 kV Hamilton–Whakamaru, or110 kV Kinleith–Lichfield–Tarukenga.SolutionThis issue is managed with the Arapuni bus split and generation limits at Arapuni.This issue will be alleviated by the following committed projects.The North Island Grid Upgrade.The Wairakei–Whakamaru C line.The Tarukenga interconnecting transformer replacement.These measures will relieve but not eliminate the constraints on the Kinleith–Taruekenga circuits. Operational measures can be used to manage the constraintsfor the forecast period and beyond.10.8.7 Kinleith 110/33 kV supply transformer capacityProject reference: KIN-POW_TFR-EHMT-01Project status/purpose: Possible, customer-specificIndicative timing: 2016Indicative cost band: AIssueTwo 110/33 kV transformers (rated at 20 MVA and 30 MVA) supply Kinleith’s 33 kVload, providing:a total nominal installed capacity of 50 MVA, andn-1 capacity of 24/25 MVA (summer/winter).These supply transformers cannot be connected to the 33 kV bus at the same time,due to different vector groups.The peak 33 kV load at Kinleith is forecast to exceed the transformers’ n-1 wintercapacity by approximately 4 MW in <strong>2012</strong>, increasing to approximately 12 MW in 2027(see Table 10-8).Table 10-8: Kinleith 33 kV supply transformer overload forecastGrid exitpointPowerfactorNext 5 yearsTransformer overload (MW)5-15 years out<strong>2012</strong> 2013 2014 2015 2016 2017 2019 2021 2023 2025 2027Kinleith 33 kV 0.98 4 4 5 5 6 7 8 9 10 11 12SolutionWe are discussing options with Powerco and Carter Holt Harvey. One possibleoption is to replace the 20 MVA transformer with a 40 MVA transformer. In addition,the 30 MVA transformer is approaching its expected end-of-life within the next fiveyears. The appropriate rating and vector group for the replacement transformer willalso be considered, in conjunction with the replacement work. Any future transformerupgrade will be customer driven.162<strong>2012</strong> <strong>Annual</strong> <strong>Planning</strong> <strong>Report</strong> © <strong>Transpower</strong> New Zealand Limited <strong>2012</strong>. All rights reserved.
Chapter 10: Bay of Plenty Region10.8.8 Mount Maunganui supply transformer capacityProject status/purpose:This issue is for information onlyIssueTwo 110/33 kV transformers supply Mount Maunganui’s load, providing:a total nominal installed capacity of 150 MVA, andn-1 capacity of 87/87 79 MVA (summer/winter).The peak load at Mount Maunganui is forecast to exceed the transformers’ n-1 wintercapacity by approximately 4 MW in 2019, increasing to approximately 19 MW in 2027(see Table 10-9).Table 10-9: Mount Maunganui supply transformer overload forecastGrid exitpointMountMaunganuiPowerfactorNext 5 yearsTransformer overload (MW)5-15 years out<strong>2012</strong> 2013 2014 2015 2016 2017 2019 2021 2023 2025 20270.98 0 0 0 0 0 0 4 9 12 16 19SolutionThe transmission capacity into Mount Maunganui is limited to approximately 75 MWby the rating of the Kaitimako–Mount Maunganui circuit (see Section 10.8.3). Thisconstraint will be addressed by transferring load from Mount Maunganui to aproposed new grid exit point at Papamoa (see Section 10.9.1 for more information).10.8.9 Okere–Te Matai 110 kV transmission capacityProject status/purpose:This issue is for information onlyIssueThe Western Bay of Plenty area of Kaitimako, Mount Maunganui, Tauranga and TeMatai are supplied via three 110 kV circuits:two 110 kV Kaitimako–Tarukenga circuits, andone 110 kV Okere–Te Matai–Kaitimako circuit.During periods of high demand, an outage of one Kaitimako–Tarukenga circuit canoverload the Okere–Te Matai circuit. The establishment of a new grid exit point atPapamoa (see Section 10.9.1 for more information) will increase the loading on theOkere–Te Matai circuit.SolutionThe committed project to increase the operating voltage of the Kaitimako–Tarukengacircuits from 110 kV to 220 kV (see Section 10.8.2 for more information) will alleviatethe overloading issue on the Okere–Te Matai circuit until 2023. With a thirdinterconnecting transformer at Kaitimako the overloading will be alleviated for theforecast period and beyond.10.8.10 Owhata supply transformer capacityProject reference:Project status/purpose:OWH-POW_TFR-EHMT-01Possible, customer-specific79The transformers’ capacity is limited by the protection limit; with this limit resolved, the n-1 capacitywill be 87/98 MVA (summer/winter).<strong>2012</strong> <strong>Annual</strong> <strong>Planning</strong> <strong>Report</strong> © <strong>Transpower</strong> New Zealand Limited <strong>2012</strong>. All rights reserved. 163
Chapter 10: Bay of Plenty RegionIndicative timing: 2014Indicative cost band: To be advisedIssueTwo 110/11 kV transformers supply Owhata’s load, providing:a total nominal installed capacity of 20 MVA, andn-1 capacity of 11/12 MVA (summer/winter).The peak load at Owhata is forecast to exceed the transformers’ n-1 winter capacityby approximately 5 MW in <strong>2012</strong>, increasing to approximately 9 MW in 2027 (seeTable 10-10).Table 10-10: Owhata supply transformer overload forecastGrid exitpointPowerfactorNext 5 yearsTransformer overload (MW)5-15 years out<strong>2012</strong> 2013 2014 2015 2016 2017 2019 2021 2023 2025 2027Owhata 0.99 5 5 5 6 6 7 7 8 8 9 9SolutionPresently, operational measures can be taken to prevent transformer overloads in theevent of a transformer failure.In the short term, Unison has a number of smart grid projects underway to increaseload shifting between Owhata and Rotorua. Shifting load from Rotorua to Owhata willalso reduce loading on the 110 kV Rotorua–Tarukenga circuits (see Section 10.8.12).Unison is reconfiguring its distribution system, and discussing options with us (seeSection 10.9.5). Unison plans to add a 33 kV connection point at Owhata within theforecast period. Three options to replace the existing transformers are beingconsidered for longer-term supply at Owhata, which involve:two higher-rated 110/11 kV transformers followed by two 110/33 kV transformerstwo 110/33/11 kV transformers, orone 110/33 kV, one 110/11 kV and one 33/11 kV transformer.Additionally, the 110/11 kV supply transformers at Owhata will approach theirexpected end-of-life within the next 5-10 years. We are discussing with Unison therating and timing for these replacement transformers.We do not anticipate any property issues, as the transformer replacement work canbe carried out within the existing substation boundary.10.8.11 Rotorua supply transformer capacityProject reference: ROT-POW_TFR-EHMT-01Project status/purpose: Possible, customer-specificIndicative timing: 2013-15Indicative cost band: BIssueTwo 110/11 kV transformers supply Rotorua’s 11 kV load, providing:a total nominal installed capacity of 40 MVA, andn-1 capacity of 25/27 MVA (summer/winter).164<strong>2012</strong> <strong>Annual</strong> <strong>Planning</strong> <strong>Report</strong> © <strong>Transpower</strong> New Zealand Limited <strong>2012</strong>. All rights reserved.
Chapter 10: Bay of Plenty RegionThe peak load at Rotorua is forecast to exceed the transformers’ n-1 winter capacityby approximately 10 MW in <strong>2012</strong>, increasing to approximately 14 MW in 2027 (seeTable 10-11).Table 10-11: Rotorua supply transformer overload forecastGrid exitpointPowerfactorNext 5 yearsTransformer overload (MW)5-15 years out<strong>2012</strong> 2013 2014 2015 2016 2017 2019 2021 2023 2025 2027Rotorua 0.97 10 10 11 11 11 11 12 13 13 14 14There are also two 110/33 kV supply transformers supplying the 33 kV load atRotorua providing:a total nominal capacity of 120 MVA, andn-1 capacity of 66/66 80 MVA (summer/winter).The Rotorua 33 kV peak load is not forecast to exceed the 110/33 kV transformers’capacity for the duration of the forecast period.SolutionWe are discussing future supply options with Unison (see Section 10.9.5), whichincludes increasing the 110/11 kV supply transformer capacities.Unison also advises that:load can be transferred within its network to Tarukenga and Owhata following a110/11 kV transformer failure, andit is investigating options to transfer some of the existing 11 kV load to the 33 kVbus and Owhata.In addition, the 110/11 kV supply transformers at Rotorua are approaching theirexpected end-of-life within the next five years.We do not anticipate any property issues, as the transformer replacement work canbe carried out within the existing substation boundary.10.8.12 Rotorua transmission securityProject reference:ROT_TRK-TRAN-EHMT-01Project status/purpose: Possible, customer-specificIndicative timing: 2014Indicative cost band: AIssueThe 110 kV Rotorua–Tarukenga line comprises two circuits, each rated at 63/77 MVA(summer/winter). The 110 kV bus at Rotorua is split so that the:local generation at Wheao and some of the Rotorua load is connected to the110 kV Rotorua–Tarukenga 2 circuit, andmajority of Rotorua’s load is supplied from the 110 kV Rotorua–Tarukenga 1circuit.Outage of the 110 kV Rotorua–Tarukenga 2 circuit:results in the loss of Wheao generation, andoverloads the remaining 110 kV Rotorua–Tarukenga 1 circuit (as it supplies allRotorua’s load).80The transformers’ capacity is limited by the protection limit; with this limit resolved, the n-1 capacitywill be 68/71 MVA (summer/winter).<strong>2012</strong> <strong>Annual</strong> <strong>Planning</strong> <strong>Report</strong> © <strong>Transpower</strong> New Zealand Limited <strong>2012</strong>. All rights reserved. 165
Chapter 10: Bay of Plenty RegionOutage of the 110 kV Rotorua–Tarukenga 1 circuit results in a loss of supply to theentire Rotorua 11 kV load.SolutionWe are discussing with Unison (the local lines company) and Trustpower (owner ofthe embedded generation connecting at Rotorua) future supply options, whichinclude:in the short term, transferring load within Unison’s network to Tarukenga andOwhata to reduce the Rotorua load to within the capacity of the 110 kV Rotorua–Tarukenga circuits, and/orin the long term, thermally upgrading the existing 110 kV Rotorua–Tarukengacircuits to 90/100 MVA (summer/winter), which may require easements oversome parts of the line.Unison is considering moving a substantial amount of load from Rotorua to Owhata,which may defer the 110 kV Rotorua–Tarukenga circuit upgrades. Reducing the11 kV load and reconfiguring the Rotorua 110 kV bus will prevent the total loss ofsupply for the 11 kV load. Future investment will be customer driven.10.8.13 Tarukenga supply securityProject status/purpose:This issue is for information onlyIssueA single 110/11 kV, 20 MVA supply transformer supplies Tarukenga’s load resultingin no n-1 security. Tarukenga’s peak load is forecast to grow to 15 MW by 2027.Unison can backfeed this load from the Rotorua 11 kV bus if required.SolutionThe lack of n-1 security can be managed operationally.10.8.14 Tauranga 11 kV supply transformer capacityProject status/purpose:This issue is for information onlyIssueTwo 110/11 kV transformers supply Tauranga’s 11 kV load, providing:a total nominal installed capacity of 60 MVA, andn-1 capacity of 30/30 MVA 81 (summer/winter).The peak load on the Tauranga 11 kV bus is forecast to:exceed the transformers’ n-1 winter capacity by approximately 3 MW in <strong>2012</strong>not exceed the transformers’ n-1 winter capacity from 2014 to 2016 following5 MW of load shifting to Kaitimako in 2014, andexceed the transformers’ n-1 winter capacity by approximately 8 MW in 2027 (seeTable 10-12).81The transformers’ capacity is limited by low voltage cables, protection limits, and the series reactors;with these limits resolved, the n-1 capacity will be 45/45 MVA (summer/winter).166<strong>2012</strong> <strong>Annual</strong> <strong>Planning</strong> <strong>Report</strong> © <strong>Transpower</strong> New Zealand Limited <strong>2012</strong>. All rights reserved.
Chapter 10: Bay of Plenty RegionTable 10-12: Tauranga 11 kV supply transformer overload forecastGrid exit pointPowerfactorNext 5 yearsTransformer overload (MW)5-15 years out<strong>2012</strong> 2013 2014 2015 2016 2017 2019 2021 2023 2025 2027Tauranga 11 kV 0.99 3 3 0 0 0 1 2 4 5 6 8SolutionA possible option is to limit the load or to transfer additional load to Kaitimako.In the longer term, resolving the low voltage cable limit and the protection limit 82 willprovide sufficient n-1 capacity to meet the load growth within the forecast period.Future investment will be customer driven.10.8.15 Tauranga 33 kV supply transformer capacityProject status/purpose:This issue is for information onlyIssueTwo 110/33 kV transformers (rated at 120 MVA and 90 MVA) supply Tauranga’s33 kV load, providing:a total nominal installed capacity of 158 MVA, andn-1 capacity of 68/68 83 MVA (summer/winter).The peak load on the Tauranga 33 kV bus is forecast to exceed the transformers’ n-1winter capacity by approximately 1 MW in 2017, increasing to approximately 20 MWin 2027 (see Table 10-13). This overload forecast assumes that there is at least14 MW of Kaimai (Tauranga) generation.Table 10-13: Tauranga 33 kV supply transformer overload forecastGrid exit pointPowerfactorTransformer overload (MW)Next 5 years5-15 years out<strong>2012</strong> 2013 2014 2015 2016 2017 2019 2021 2023 2025 2027Tauranga 33 kV 0.95 0 0 0 0 0 1 6 10 13 17 20SolutionThe branch limits on the 120 MVA supply transformer are temporary. Those limits willbe removed on completion of the 33 kV indoor switchboard project, ensuring theTauranga 33 kV load has n-1 capacity for the forecast period and beyond.10.8.16 Te Matai supply transformer capacityProject status/purpose:This issue is for information onlyIssueTwo 110/33 kV transformers (rated at 30 MVA and 40 MVA) supply Te Matai’s load,providing:a total nominal installed capacity of 70 MVA, and8283Resolving the low voltage cables and protection limits will increase the n-1 capacity to 40/40 MVA(summer/winter), which is the limit of the series reactors. This is sufficient to meet the load within theforecast period.The 120 MVA transformers’ capacity is limited by low voltage switchgear; with this limit resolved, then-1 capacity will be 75/75 MVA (summer/winter) which is the LV cable limit.<strong>2012</strong> <strong>Annual</strong> <strong>Planning</strong> <strong>Report</strong> © <strong>Transpower</strong> New Zealand Limited <strong>2012</strong>. All rights reserved. 167
Chapter 10: Bay of Plenty Regionn-1 capacity of 36/39 MVA (summer/winter).The peak load at Te Matai is forecast toexceed the transformers’ n-1 winter capacity by approximately 1 MW in 2014not exceed the transformers’ n-1 winter capacity from 2015 to 2018 following5 MW of load shifting to the proposed new grid exit point at Papamoa, andexceed the transformers’ n-1 winter capacity by approximately 8 MW in 2027 (seeTable 10-14).Table 10-14: Te Matai supply transformer overload forecastGrid exitpointPowerfactorNext 5 yearsTransformer overload (MW)5-15 years out<strong>2012</strong> 2013 2014 2015 2016 2017 2019 2021 2023 2025 2027Te Matai 0.96 0 0 1 0 0 0 1 3 5 6 8SolutionPowerco can transfer some more of its load to a new grid exit point at Papamoa (seealso Section 10.9.1) ensuring Te Matai has n-1 security for the forecast period andbeyond.In addition, the Te Matai 30 MVA supply transformer will approach its expected endof-lifeat the end of the forecast period. We will discuss with Powerco the timing andrating of the replacement transformer. Future investment will be customer driven.10.8.17 Waiotahi supply transformer capacityProject status/purpsoe:This issue is for information onlyIssueTwo 110/11 kV transformers supply Waiotahi’s load, providing:a total nominal installed capacity of 20 MVA, andn-1 capacity of 11/12 MVA (summer/winter).The transformers also supply Te Kaha’s load via an 11/50 kV step-up transformer atWaiotahi. The combined peak load at Waiotahi is forecast to exceed thetransformers’ n-1 winter capacity by approximately 1 MW in <strong>2012</strong>, increasing to 6 MWin 2027 (see Table 10-15).Table 10-15: Waiotahi supply transformer overload forecastGrid exitpointWaiotahi (andTe Kaha)PowerfactorNext 5 yearsTransformer overload (MW)5-15 years out<strong>2012</strong> 2013 2014 2015 2016 2017 2019 2021 2023 2025 20270.98 1 2 2 2 2 3 3 4 4 5 6SolutionWe will discuss with Horizon Energy options to increase the transformer capacity.Additionally, the 110/11 kV supply transformers at Waiotahi will approach theirexpected end-of-life within the next 5-10 years. We will discuss with Horizon Energythe rating and timing for these replacement transformers.We do not anticipate any property issues as the transformer replacement work can becarried out within the existing substation boundary.Future investment will be customer driven.168<strong>2012</strong> <strong>Annual</strong> <strong>Planning</strong> <strong>Report</strong> © <strong>Transpower</strong> New Zealand Limited <strong>2012</strong>. All rights reserved.
Chapter 10: Bay of Plenty Region10.8.18 Waiotahi and Te Kaha supply securityProject status/purpose:This issue is for information onlyIssueWaiotahi and Te Kaha are supplied by one transmission circuit (a 110 kV circuit toWaiotahi and a 50 kV circuit to Te Kaha) resulting in no n-1 security.Both loads are supplied from the Edgecumbe 110 kV bus via the single Edgecumbe–Waiotahi circuit, with the:Waiotahi 11 kV load supplied through two 10 MVA transformers, andTe Kaha 11 kV load supplied through one:Solution• 3 MVA 11/50 kV step up transformer at Waiotahi• 50 kV Te Kaha–Waiotahi circuit, and• 2.25 MVA 50/11 kV transformer at Te Kaha.The lack of n-1 security can be managed operationally.10.9 Other regional items of interest10.9.1 Papamoa grid exit pointWe are discussing with Powerco the establishment of a new grid exit point atPapamoa, connected to the 110 kV Kaitimako–Te Matai circuit. The new grid exitpoint is to cater for load growth, which is predominantly supplied from MountMaunganui (see also Section 10.8.3). It will also allow some load to be transferredfrom Te Matai (see also Section 10.8.16).Papamoa will increase the loading on the 110 kV Tarukenga–Okere–Te Matai–Kaitimako circuits. This will bring forward the need to upgrade these circuits, butdoes not create significant new issues. This issue does not arise within the forecastperiod once the new 220/110 kV interconnection at Kaitimako is commissioned.10.9.2 Kawerau–Matahina 110 kV transmission capacityThe 110 kV Kawerau–Matahina line comprises two circuits each rated at 88/98 MVA(summer/winter). This line carries the entire generation output of the Matahina andAniwhenua generation stations to Kawerau.The generation stations’ combined capacity is 97 MW. Given the outage of one ofthe Kawerau–Matahina circuits, generation can be managed operationally. Some ofAniwhenua’s generation is used to supply the Galatea system that is configured as anembedded network behind Matahina.During a contingency, generation at Matahina and Aniwhenua can be restricted to theremaining circuit’s available capacity. This situation is considered satisfactory, andthere are no plans to make transmission network changes at this stage.10.9.3 Kaitimako transmission securityKaitimako is supplied by (see Figure 10-6):two direct circuits, Kaitimako–Tarukenga 1 and 2, andone indirect circuit, Tarukenga–Okere–Te Matai–Kaitimako.Kaitimako also supplies Mount Maunganui and Tauranga (see Section 10.8.3).<strong>2012</strong> <strong>Annual</strong> <strong>Planning</strong> <strong>Report</strong> © <strong>Transpower</strong> New Zealand Limited <strong>2012</strong>. All rights reserved. 169
Chapter 10: Bay of Plenty RegionFollowing the outage of any of the Kaitimako–Tarukenga circuits during peak loadperiods, it may not be possible to ensure circuit ratings and bus voltages stay withintheir required limits should there be another outage. In this case, a system split isrequired to mitigate the constraints. This situation still applies even after theconversion of the Kaitimako–Tarukenga circuits from 110 kV to 220 kV operation (seeSection 10.8.2).10.9.4 Tarukenga interconnecting transformer replacementThe Tarukenga interconnecting transformers require replacement due to theircondition. We are replacing the existing 200 MVA 5% and 3.6% impedancetransformers with two 150 MVA 15% impedance transformers.The transformer capacity reduction is possible because the Western Bay of Plenty isbeing transferred to 220 kV by the Kaitimako–Tarukenga circuits’ upgrade to 220 kVoperation (see Section 10.8.2). The increase in impedance helps to reduce thethrough-transmission in the 110 kV transmission network towards Kinleith (seeSection 10.8.6).10.9.5 Rotorua area development planWe are working with Unison to develop a long-term plan for supplying load in theRotorua area. The plan will determine the most economic combination of long-termsolutions to the following issues.Owhata supply transformer capacity (see Section 10.8.10)Rotorua supply transformer capacity (see Section 10.8.11)Rotorua supply transmission security (see Section 10.8.12)Tarukenga supply security (see Section 10.8.13).10.10 Bay of Plenty generation proposals and opportunitiesThis section details relevant regional issues for selected generation proposals underinvestigation by developers and in the public domain, or other generationopportunities.The maximum generation that can be connected at any substation depends onseveral factors and usually falls within a range. Generation developers shouldconsult with us at an early stage of their investigations to discuss connection issues.See our website for more information about connecting generation. 8410.10.1 Generation connection at KawerauThe existing constraints on 110 kV generation are discussed in Section 10.8.1. Thereare also a number of other future generation connection proposals at Kawerau, as thearea has significant geothermal resources. If these generation connectionseventuate, then the likely system developments will involve:replacing the Kawerau T13 transformer (220/110 kV, 100 MVA) with a 250 MVAtransformersplitting the 110 kV Kawerau–Edgecumbe circuits, andreplacing the Edgecumbe 220/110 kV transformers and returning them to service.In addition, increased generation at Kawerau may increase the 11 kV supply bus anddistribution system fault levels sufficiently to exceed their fault-level capacities. Thisparticularly applies if new generation is connected directly to the supply bus, and mayalso be an issue if the generation is embedded within the distribution system. This84http://www.transpower.co.nz/connecting-new-generation.170<strong>2012</strong> <strong>Annual</strong> <strong>Planning</strong> <strong>Report</strong> © <strong>Transpower</strong> New Zealand Limited <strong>2012</strong>. All rights reserved.
Chapter 10: Bay of Plenty Regionmay require the replacement of the existing supply transformers with higherimpedancetransformers and/or replacement of the existing 11 kV switchboard.We are currently in discussions with Horizon Energy regarding the 11 kV fault levelissue. The 11 kV switchboard and the 110/11 kV supply transformers at Kawerau aredue for replacement within the next 10 years (see Section 10.5). We will consideroptions to reduce the 11 kV fault level when the equipment is due for replacement.10.10.2 Generation connection to the Okere–Te Matai circuitSome generation prospects exist close to the 110 kV Okere–Te Matai circuit, or closeto Okere on one of the other circuits passing through the area. These circuits canbecome highly loaded for some circuit outages when there is high demand. Underthese conditions, the generation may need to be reduced or switched off.The committed project to increase the operating voltage of the Kaitimako–Tarukengacircuits (see Section 10.8.2) will reduce the extent and duration of this issue.<strong>2012</strong> <strong>Annual</strong> <strong>Planning</strong> <strong>Report</strong> © <strong>Transpower</strong> New Zealand Limited <strong>2012</strong>. All rights reserved. 171
Chapter 11: Central North Island Region11 Central North Island Regional Plan11.1 Regional overview11.2 Central North Island transmission system11.3 Central North Island demand11.4 Central North Island generation11.5 Central North Island significant maintenance work11.6 Future Central North Island projects and transmission configuration11.7 Changes since the 2011 <strong>Annual</strong> <strong>Planning</strong> <strong>Report</strong>11.8 Central North Island transmission capability11.9 Other regional items of interest11.10 Central North Island generation proposals and opportunities11.1 Regional overviewThis chapter details the Central North Island regional transmission plan. We basethis regional plan on an assessment of available data, and welcome feedback toimprove its value to all stakeholders.Figure 11-1: Central North Island region172<strong>2012</strong> <strong>Annual</strong> <strong>Planning</strong> <strong>Report</strong> © <strong>Transpower</strong> New Zealand Limited <strong>2012</strong>. All rights reserved.
Chapter 11: Central North Island RegionThe Central North Island region includes a mix of small to large sized towns togetherwith the large load at Palmerston North and environs (supplied from Bunnythorpe andLinton). There is also a large industrial load at Tangiwai.We have assessed the Central North Island region’s transmission needs over thenext 15 years while considering longer-term development opportunities. Specifically,the transmission network needs to be flexible to respond to a range of future serviceand technology possibilities, taking into consideration:the existing transmission networkforecast demandforecast generationequipment replacement based on condition assessment, andpossible technological development.11.2 Central North Island transmission systemThis section highlights the state of the Central North Island regional transmissionnetwork. The existing transmission network is set out geographically in Figure 11-1and schematically in Figure 11-2.Figure 11-2: Central North Island transmission schematic33 kVOngarue110 kVWAIKATOHangatiki110 kV National ParkOhakuriWAIKATOWhakamaru220 kVPoihipi33 kVAratiatia11 kVOhaakiNga Awa220 kV Purua33Wairakei220 kVkV220 kVTARANAKIWanganuiBrunswickOhakune11 kV110 kV33 kV33 kVMataroa110 kVTangiwai11 kV55kV(NZR)220 kV220 kVTokaanu220 kVRangipo110 kVRedclyffe WhirinakiHAWKES BAYFernhillWaipawa33 kV220 kV11 kV33 kVMarton110 kV33 kV55 kV(NZR)110 kVBunnythorpe11 kVDannevirke110 kVTe ApitiTararua33 kVLintonMangahao110 kV33 kVHaywards WiltonWELLINGTONParaparaumu11 kV110 kVWoodvilleKEY33 kV110 kVMangamaireMastertonWELLINGTON220kV CIRCUIT110kV CIRCUIT33kV CIRCUITSUBSTATION BUSTRANSFORMERTEE POINTLOADCAPACITORGENERATOR11.2.1 Transmission into the regionThe Central North Island region comprises 220 kV and 110 kV transmission circuitswith interconnecting transformers located at Bunnythorpe. All the 220 kV circuitsform part of the grid backbone. The 110 kV transmission network is mainly suppliedthrough the 220/110 kV interconnecting transformers at Bunnythorpe, plus lowcapacity connections to other regions.<strong>2012</strong> <strong>Annual</strong> <strong>Planning</strong> <strong>Report</strong> © <strong>Transpower</strong> New Zealand Limited <strong>2012</strong>. All rights reserved. 173
Chapter 11: Central North Island RegionThe Central North Island region is a main corridor for 220 kV transmission circuitsthrough the North Island. The 220 kV transmission system connects Bunnythorpefrom the south, and Wairakei and Tokaanu from the North. There is an approvedproject to replace the 220 kV single circuit Wairakei–Poihipi–Whakamaru lineconnecting to the Waikato region with a double-circuit line. The direction of powerflow through the region, north or south, is set by generation and loads outside theregion.Most of the Central North Island’s generation capacity is connected to the 220 kV andis significantly in excess of the local demand. Surplus generation is exported over theNational Grid to other demand centres.11.2.2 Transmission within the regionThe 110 kV transmission system within the Central North Island region mainlyconsists of low-capacity circuits. The transmission system may impose constraintsunder certain operating conditions. Operational measures taken to ensure the110 kV circuits operate within their thermal capacity are:normally splitting the 110 kV system at:• Waipawa, for the Fernhill–Waipawa circuits, and• Mangahao and Paraparaumu, for the Mangahao–Paraparaumu circuits.managing generation output to avoid overloading of the following 110 kV circuits:• Bunnythorpe–Woodville• those between Bunnythorpe and Arapuni (Waikato region), and• those between Bunnythorpe and Stratford (Taranaki region).11.2.3 Longer-term development pathLonger-term development plans are being formed as part of the Lower North Islandinvestigation.The transmission development in this region will largely depend on the magnitudeand location of future generation, and the commissioning of new generation in theregion may bring forward the need for transmission investment. Possible upgradesinclude duplexing the existing 220 kV lines, and rebuilding some of the 110 kV linesfor 220 kV operation.11.3 Central North Island demandThe after diversity maximum demand (ADMD) for the Central North Island region isforecast to grow on average by 1.1% annually over the next 15 years, from 347 MWin <strong>2012</strong> to 408 MW by 2027. This is lower than the national average demand growthof 1.7% annually.Figure 11-3 shows a comparison of the 2011 and <strong>2012</strong> forecast 15-year maximumdemand (after diversity 85 ) for the Central North Island region. The forecasts arederived using historical data, and modified to account for customer information, whereappropriate. The power factor at each grid exit point is also derived from historicaldata, and is used to calculate the real power capacity for power transformer andtransmission line. See Chapter 4 for more information about demand forecasting.85The after diversity maximum demand (ADMD) for the region will be less than the sum of theindividual grid exit point peak demands, as it takes into account the fact that the peak demand doesnot occur simultaneously at all the grid exit points in the region.174<strong>2012</strong> <strong>Annual</strong> <strong>Planning</strong> <strong>Report</strong> © <strong>Transpower</strong> New Zealand Limited <strong>2012</strong>. All rights reserved.
Chapter 11: Central North Island RegionFigure 11-3: Central North Island region after diversity maximum demand forecastLoad (MW)500Central North Island4504003503002502011 APR Forecast<strong>2012</strong> APR ForecastActual Peak2001997 1999 2001 2003 2005 2007 2009 2011 2013 2015 2017 2019 2021 2023 2025 2027Table 11-1 lists forecasts peak demand (prudent growth) for each grid exit point forthe forecast period, as required for the Grid Reliability <strong>Report</strong>.Table 11-1: Forecast annual peak demand (MW) at Central North Island grid exit pointsto 2027Grid exit pointBunnythorpe33 kVBunnythorpeNZRPowerfactorNext 5 yearsPeak demand (MW)5-15 years out<strong>2012</strong> 2013 2014 2015 2016 2017 2019 2021 2023 2025 20270.98 110 112 114 117 119 121 126 131 135 139 1420.80 8 8 8 8 8 8 8 8 8 8 8Dannevirke 0.97 15 15 16 16 16 17 17 18 19 19 19Linton 0.99 75 77 78 80 81 83 86 89 92 95 97Mangamaire 0.97 12 12 13 13 13 13 14 14 15 15 16Mangahao 0.97 39 40 41 41 42 43 45 46 48 49 50Marton 0.98 16 16 17 17 17 18 18 19 20 20 21Mataroa 0.98 8 8 8 9 9 9 9 10 10 10 10National Park 0.97 8 8 8 8 8 8 8 9 9 9 9Ohaaki 0.96 6 6 6 6 6 6 7 7 7 7 7Ohakune 1 0.98 11 11 9 10 10 10 11 11 12 12 13Ongarue 0.98 11 11 11 11 11 11 11 12 12 12 12Tokaanu 0.99 11 11 11 11 11 11 12 12 12 13 13Tangiwai 11 kV 1 0.99 44 44 47 47 48 48 49 50 51 52 53Tangiwai NZR 0.80 10 10 10 10 10 10 10 10 10 10 10Woodville 0.98 4 4 4 4 5 5 5 5 5 5 6Waipawa 0.96 22 23 23 24 24 25 26 27 27 28 29Wairakei 0.90 50 51 52 53 54 55 57 60 61 63 641. The customer advised a 2 MW load shift from Ohakune to Tangiwai 11 kV planned for 2014.<strong>2012</strong> <strong>Annual</strong> <strong>Planning</strong> <strong>Report</strong> © <strong>Transpower</strong> New Zealand Limited <strong>2012</strong>. All rights reserved. 175
Chapter 11: Central North Island Region11.4 Central North Island generationThe Central North Island’s generation capacity is 1,252 MW, increasing to 1,528 MWafter the commissioning of Ngatamariki and Te Mihi geothermal power plants. Thisgeneration contributes a significant portion of the total North Island generation andexceeds local demand. Surplus generation is exported over the National Grid toother demand centres.Table 11-2 lists the generation forecast for each grid injection point for the forecastperiod, as required for the Grid Reliability <strong>Report</strong>. This includes all known andcommitted generation stations including those embedded within the relevant locallines company’s network (Powerco, The Lines Company, Scanpower, Centralines,Electra). 86Table 11-2: Forecast annual generation capacity (MW) at Central North Island gridinjection points to 2027 (including existing and committed generation)Grid injection point(location ifembedded)Next 5 yearsGeneration capacity (MW)5-15 years out<strong>2012</strong> 2013 2014 2015 2016 2017 2019 2021 2023 2025 2027Aratiatia 78 78 78 78 78 78 78 78 78 78 78Bunnythorpe (TararuaWind Stage 2)Linton (Tararua WindStage 1)36 36 36 36 36 36 36 36 36 36 3632 32 32 32 32 32 32 32 32 32 32Linton (Totara Road) 1 1 1 1 1 1 1 1 1 1 1Mangahao 37 37 37 37 37 37 37 37 37 37 37Nga Awa Purua 140 140 140 140 140 140 140 140 140 140 140Nga Awa Purua -Ngatamariki0 82 82 82 82 82 82 82 82 82 82Ohaaki 46 46 46 46 46 46 46 46 46 46 46Ongarue (Mokauiti,Kuratau and WairereFalls)13 13 13 13 13 13 13 13 13 13 13Poihipi 51 51 51 51 51 51 51 51 51 51 51Rangipo 120 120 120 120 120 120 120 120 120 120 120Tararua Wind Central(Tararua Stage 3)Tararua Wind Central(Te Rere Hau)93 93 93 93 93 93 93 93 93 93 9349 49 49 49 49 49 49 49 49 49 49Te Mihi 0 0 166 166 166 166 166 166 166 166 166Tokaanu 240 240 240 240 240 240 240 240 240 240 240Wairakei 1 161 161 109 109 109 109 109 109 109 109 109Wairakei (Hinemaiaia) 7 7 7 7 7 7 7 7 7 7 7Wairakei (Rotokawa) 35 35 35 35 35 35 35 35 35 35 35Wairakei (Te Huka) 23 23 23 23 23 23 23 23 23 23 23Woodville - Te Apiti 90 90 90 90 90 90 90 90 90 90 901. Contact has indicated that Wairakei generation will eventually be phased out by 2026.86Only generators with a capacity greater than 1 MW are listed. Generation capacity is rounded to thenearest megawatt.176<strong>2012</strong> <strong>Annual</strong> <strong>Planning</strong> <strong>Report</strong> © <strong>Transpower</strong> New Zealand Limited <strong>2012</strong>. All rights reserved.
Chapter 11: Central North Island Region11.5 Central North Island significant maintenance workOur capital project and maintenance works are integrated to enable system issues tobe resolved if possible when assets are replaced or refurbished. Table 11-3 lists thesignificant maintenance-related work 87 proposed for the Central North Island regionfor the next 15 years that may significantly impact related system issues or connectedparties.Table 11-3: Proposed significant maintenance workDescriptionBunnythorpe interconnectingtransformers expected end-of-lifeBunnythorpe 33 kV outdoor toindoor conversionLinton 33 kV outdoor to indoorconversionMangahao supply transformersexpected end-of-life, and33 kV outdoor to indoor conversionMarton supply transformersexpected end-of-lifeMataroa supply transformerexpected end-of-lifeNational Park supply transformerexpected end-of-lifeOhakune supply transformerexpected end-of-lifeOngarue 33kV supply transformerexpected end-of-life, andOngarue 33 kV outdoor to indoorconversionWairakei supply transformersexpected end-of-lifeTentativeyearRelated system issues2014-2016 The options for the replacement transformers areunder investigation. See Section 11.8.1 for moreinformation.<strong>2012</strong>-2014 No system issues are identified within the forecastperiod.2017-2019 The forecast load at Linton will exceed thetransformers’ capacity from 2015. See Section11.8.5 for more information.2020-20222014-2016Managing Mangahao generation can reduce thetransformer’s loading. See Section 11.8.6 for moreinformation.2023-2026 The forecast load will exceed the transformers’capacity from 2023. See Section 11.8.7 for moreinformation.2016-2018 No n-1 security at Mataroa. See Section 11.8.8 formore information.2013-2015 No n-1 security at National Park. See Section11.8.9 for more information.<strong>2012</strong>-2014 The discussion on options to increase the supplysecurity and transformer capacity is underway. SeeSection 11.8.10 for more information.2025-20262017-2019No n-1 security at Ongarue. See Section 11.8.11for more information.2024-2026 No system issues are identified within the forecastperiod.11.6 Future Central North Island projects and transmission configurationTable 11-4 lists projects to be carried out in the Central North Island region within thenext 15 years.Figure 11-4 shows the possible configuration of Central North Island transmission in2027, with new assets, upgraded assets, and assets undergoing significantmaintenance within the forecast period.Table 11-4: Projects in the Central North Island region up to 2027Site Projects StatusBunnythorpeReplace existing interconnecting transformers with two150 MVA units.Convert 33 kV outdoor switchgear to an indoor switchboard.Base CapexBase CapexBunnythorpe–Haywards Bunnythorpe–Haywards A and B reconductoring. PreferredBunnythorpe–Mataroa Install series reactor or phase shifting transformer. PossibleBunnythorpe–Woodville Install special protection scheme, or reconductor Possible87This may include replacement of the asset due to its condition assessment.<strong>2012</strong> <strong>Annual</strong> <strong>Planning</strong> <strong>Report</strong> © <strong>Transpower</strong> New Zealand Limited <strong>2012</strong>. All rights reserved. 177
Chapter 11: Central North Island RegionSite Projects StatusBunnythorpe–Woodville circuit or convert the circuit’soperating voltage.Linton Convert 33 kV outdoor switchgear to an indoor switchboard. Base CapexMangahaoMartonReplace supply transformers.Convert 33 kV outdoor switchgear to an indoor switchboard.Resolve supply transformers’ metering and protection limits.Replace supply transformers.Base CapexBase CapexBase CapexBase CapexMataroa Replace supply transformer. Base CapexNational Park Replace supply transformer. Base CapexOhakune Replace supply transformer. Base CapexOngarueReplace supply transformer.Convert 33 kV outdoor switchgear to an indoor switchboard.Base CapexBase CapexTangiwai Replace 11 kV switchgear. Base CapexHaywards–Bunnythorpe–Tokaanu–WhakamaruIncrease the transmission circuit capacities.PossibleWaipawa Resolve supply transformers’ metering and protection limits. Base CapexWairakei Replace supply transformers. Base CapexWairakei–WhakamaruBuild a new 220 kV double circuit transmission line anddismantle the existing 220 kV Wairakei–Whakamaru B singlecircuit transmission line.CommittedFigure 11-4: Possible Central North Island transmission configuration in 2027TARANAKIWanganui33 kVOngarue110 kVBrunswickOhakuneWAIKATOHangatiki11 kV110 kVBunnythorpe110 kV National Park33 kV33 kVMataroa110 kV220 kVOhakuriWAIKATOWhakamaruTe MihiTangiwai11 kV55kV(NZR)(1)220 kV220 kV33 kVTokaanuPoihipi220 kV220 kVAratiatiaNgatamariki220 kVWairakeiRangipoNga AwaPurua110 kV*11 kV220 kV220 kVWhirinakiRedclyffeHAWKES BAYFernhillWaipawa33 kVOhaaki11 kV33 kV33 kVMarton*110 kV55 kV(NZR)33 kV110 kV11 kVDannevirke110 kVTe Apiti(1) The transmission backbone sectionidentifies two possible developmentpaths for the lower North Island:- upgrade the existing lines, and- new transmission lineAlthough this diagram shows upgradingof the existing lines, it is not intended toindicate a preference as both optionsare still being investigated.(1)Haywards WiltonWELLINGTONTararua33 kVLintonMangahao110 kV33 kVParaparaumuMastertonWELLINGTON33 kV110 kVMangamaire11 kV110 kVWoodvilleKEYNEW ASSETSUPGRADED ASSETSASSETS SCHEDULEDFOR REPLACEMENTMINOR UPGRADE*11.7 Changes since the 2011 <strong>Annual</strong> <strong>Planning</strong> <strong>Report</strong>Table 11-5 lists the specific issues that are either new or no longer relevant within theforecast period when compared to last year's report.178<strong>2012</strong> <strong>Annual</strong> <strong>Planning</strong> <strong>Report</strong> © <strong>Transpower</strong> New Zealand Limited <strong>2012</strong>. All rights reserved.
Chapter 11: Central North Island RegionTable 11-5: Changes since 2011IssuesLinton supply transformer capacityMarton supply transformer capacityOhaaki supply securityWaipawa supply transformer capacityWoodville supply securityChangeNew issue.New issue.Removed. These assets have been transferred to Unison.New issue.Removed. Project to replace 4.5 MVA transformer with two10 MVA transformers completed.11.8 Central North Island transmission capabilityTable 11-6 summarises issues involving the Central North Island region for the next15 years. For more information about a particular issue, refer to the listed sectionnumber.Table 11-6: Central North Island region transmission issuesSectionnumberIssueRegional11.8.1 Bunnythorpe interconnecting transformer capacity11.8.2 Bunnythorpe–Mataroa 110 kV transmission capacity11.8.3 Bunnythorpe–Woodville 110 kV transmission capacitySite by grid exit point11.8.4 Bunnythorpe supply transformer capacity11.8.5 Linton supply transformer capacity11.8.6 Mangahao supply transformer capacity11.8.7 Marton supply transformer capacity11.8.8 Mataroa supply transformer security11.8.9 National Park transmission and supply transformer security11.8.10 Ohakune supply transformer security and capacity11.8.11 Ongarue supply transformer security11.8.12 Tokaanu supply transformer security11.8.13 Waipawa supply transformer capacity and security11.8.1 Bunnythorpe interconnecting transformer capacityProject reference: BPE-POW_TFR-EHMT-01Project status/purpose: Possible, to meet the Grid Reliability Standard (core grid).Indicative timing: 2014-2016Indicative cost band: BIssueThere are three interconnecting transformers at Bunnythorpe, each rated at 50 MVA,providing:a total nominal installed capacity of 150 MVA, andn-1 capacity of 116/125 MVA (summer/winter).Loading on the Bunnythorpe interconnecting transformers may exceed their n-1capacity for high Central North Island and Wellington loads, coupled with low localgeneration in Wellington.<strong>2012</strong> <strong>Annual</strong> <strong>Planning</strong> <strong>Report</strong> © <strong>Transpower</strong> New Zealand Limited <strong>2012</strong>. All rights reserved. 179
Chapter 11: Central North Island RegionSolutionThis issue can be managed operationally by constraining-on Mangahao generation.The Bunnythorpe interconnecting transformers have an expected end-of-life withinthe forecast period. They will be replaced by two 150 MVA transformers.11.8.2 Bunnythorpe–Mataroa 110 kV transmission capacityProject reference:Project status/purpose:Indicative timing:Indicative cost band:BPE_MTR–TRAN-EHMT-01Possible, to meet the Grid Reliability Standard (not core grid). This project ispart of the lower North Island transmission capacity investigation and weanticipate seeking approval from the Commerce Commission in 2013To be advisedTo be advisedIssueThe Bunnythorpe–Mataroa single circuit is rated at 57/70 MVA (summer/winter). Thiscircuit can overload for some generation dispatch patterns such as high HVDC northpower flow, high wind generation in the lower North Island, low Arapuni generation,and an outage of a 220 kV Bunnythorpe–Tokaanu, Tokaanu–Whakamaru orRangipo–Wairakei circuit.SolutionThis issue can be managed operationally by limiting the HVDC north power flow,and/or increasing Arapuni generation, and/or opening the Arapuni–Ongarue circuit,leaving Ongarue, National Park, Ohakune, and Mataroa on n security.Longer-term options to reduce the power flow along the Bunnythorpe–Mataroa circuitinclude installing a:series reactor, orphase shifting transformer.11.8.3 Bunnythorpe–Woodville 110 kV transmission capacityProject reference: BPE_WDV-TRAN-EHMT-01Project status/purpose: Possible, to meet the Grid Reliability Standard (not core grid). This project ispart of the lower North Island transmission capacity investigation, and weanticipate seeking approval from the Commerce Commission in 2013Indicative timing: Special protection scheme: 2013Circuit reconductoring/convert circuit’s operating voltage: 2015-2020Indicative cost band: Special protection scheme: ACircuit reconductoring/convert circuit’s operating voltage: to be advisedIssueThe Bunnythorpe–Woodville circuits are rated at 57/70 MVA (summer/winter). Anoutage of one circuit causes the other circuit to overload during high south flow. Theloading on these circuits depends on the HVDC transfer direction and level, Te Apitigeneration levels and the load in Wellington, Dannevirke, and Waipawa.SolutionThis issue can be resolved operationally by:restricting HVDC south power flow, and/orrestricting Te Apiti generation, oropening either the 110 kV Mangamaire–Woodville circuit or the Mangamaire–Masterton circuit, leaving Mangamaire on n security.180<strong>2012</strong> <strong>Annual</strong> <strong>Planning</strong> <strong>Report</strong> © <strong>Transpower</strong> New Zealand Limited <strong>2012</strong>. All rights reserved.
Chapter 11: Central North Island RegionLonger-term options include:installing a special protection scheme to automatically open the Mangamaire–Woodville circuit following an outagereconductoring the 110 kV Bunnythorpe–Woodville circuits with a higher-ratedconductor, orconverting the Bunnythorpe–Woodville circuits to 220 kV operation.11.8.4 Bunnythorpe supply transformer capacityProject status/purpose:This issue is for information onlyIssueTwo 220/33 kV transformers supply Bunnythorpe’s load, providing:a total nominal installed capacity of 166 MVA, andn-1 capacity of 100/100 MVA 88 (summer/winter).The peak load at Bunnythorpe is forecast to exceed the transformers’ n-1 wintercapacity by approximately 7 MW in <strong>2012</strong>, increasing to approximately 39 MW in 2027(see Table 11-7). Tararua wind generation (Stage 2) is connected to theBunnythorpe 33 kV bus, and the forecast assumes minimum generation of 7 MWcoincident with the peak load.Table 11-7: Bunnythorpe supply transformer overload forecastGrid exitpointPowerfactorNext 5 yearsTransformer overload (MW)5-15 years out<strong>2012</strong> 2013 2014 2015 2016 2017 2019 2021 2023 2025 2027Bunnythorpe 0.98 7 10 12 14 17 19 24 28 32 36 39SolutionIncreasing the transformers’ cable limit will not solve the overload issue. Powercocan transfer load within the distribution system to Linton following a contingency.This operational measure is considered adequate for at least the next 5-10 years.We will also discuss with Powerco converting the Bunnythorpe 33 kV outdoorswitchyard to an indoor switchboard. Future investment will be customer driven.11.8.5 Linton supply transformer capacityProject status/purpose:This issue is for information onlyIssueTwo 110/33 kV transformers (rated at 60 MVA and 100 MVA) supply Linton’s load,providing:a total nominal installed capacity of 160 MVA, andn-1 capacity of 77/81 MVA (summer/winter).The peak load at Linton is forecast to exceed the transformers’ n-1 winter capacity byapproximately 2 MW in 2015, increasing to approximately 19 MW in 2027 (see Table11-8). Tararua wind generation (Stage 1) is connected to the Linton 33 kV bus, andthe forecast assumes minimum generation of 7 MW coincident with the peak load.88The transformers’ capacity is limited by cable ratings; with this limit resolved, the n-1 capacity will be101/106 MVA (summer/winter).<strong>2012</strong> <strong>Annual</strong> <strong>Planning</strong> <strong>Report</strong> © <strong>Transpower</strong> New Zealand Limited <strong>2012</strong>. All rights reserved. 181
Chapter 11: Central North Island RegionTable 11-8: Linton supply transformer overload forecastGrid exitpointPowerfactorNext 5 yearsTransformer overload (MW)5-15 years out<strong>2012</strong> 2013 2014 2015 2016 2017 2019 2021 2023 2025 2027Linton 0.99 0 0 0 2 4 5 9 12 14 17 19SolutionLinton normally has two 100 MVA transformers, but one failed and has beentemporarily replaced with a 60 MVA transformer. The issue will be addressed byprocuring a replacement transformer.We will also discuss with Powerco converting the Linton 33 kV outdoor switchyard toan indoor switchboard. Future investment will be customer driven.11.8.6 Mangahao supply transformer capacityProject status/purpose:This issue is for information onlyIssueTwo 110/33 kV transformers supply Mangahao’s load, providing:a total nominal installed capacity of 60 MVA, andn-1 capacity of 37/39 MVA (summer/winter).The peak load at Mangahao is forecast to exceed the transformers’ n-1 wintercapacity by approximately 4 MW in <strong>2012</strong>, increasing to approximately 15 MW in 2027(see Table 11-9). The Mangahao generation station is connected to the 33 kV bus,and the forecast assumes that Mangahao is not generating during peak load periods.Table 11-9: Mangahao supply transformer overload forecastGrid exitpointPowerfactorNext 5 yearsTransformer overload (MW)5-15 years out<strong>2012</strong> 2013 2014 2015 2016 2017 2019 2021 2023 2025 2027Mangahao 0.97 4 5 6 7 7 8 10 12 13 14 15SolutionIf Mangahao generates at 13 MW or more, this issue could be delayed beyond theforecast period. The supply transformer overload is managed operationally asMangahao generation is usually available during peak load periods.We will also convert the Mangahao 33 kV outdoor switchgear to an indoorswitchboard within the next five years. In addition, both Mangahao supplytransformers will approach their expected end-of-life within the next 5-10 years. Wewill discuss with Electra and Todd Energy the timing and options for these works.Future investment will be customer driven.11.8.7 Marton supply transformer capacityProject reference: MTN-POW_TFR-EHMT-01Project status/purpose: Base Capex, minor enhancementIndicative timing: 2023Indicative cost band: ATwo 110/33 kV transformers (rated at 20 MVA and 30 MVA) supply Marton’s33 kV load, providing:a total nominal installed capacity of 50 MVA, and182<strong>2012</strong> <strong>Annual</strong> <strong>Planning</strong> <strong>Report</strong> © <strong>Transpower</strong> New Zealand Limited <strong>2012</strong>. All rights reserved.
Chapter 11: Central North Island Regionn-1 capacity of 20/20 MVA 89 (summer/winter).The peak load at Marton is forecast to exceed the transformers’ n-1 winter capacityby approximately 1 MW in 2023, increasing to approximately 2 MW in 2027 (seeTable 11-10).Table 11-10: Marton supply transformer overload forecastGrid exitpointPowerfactorNext 5 yearsTransformer overload (MW)5-15 years out<strong>2012</strong> 2013 2014 2015 2016 2017 2019 2021 2023 2025 2027Marton 0.98 0 0 0 0 0 0 0 0 1 1 2SolutionResolving the metering equipment limit will solve the transformers’ n-1 capacity issuewithin the forecast period.In addition, both Marton supply transformers will approach their expected end-of-lifewithin the forecast period. We will discuss with Powerco the rating and timing for thereplacement transformers. Future investment will be customer driven.11.8.8 Mataroa supply transformer securityProject status/purpose:This issue is for information onlyIssueThe load at Mataroa is supplied by a single 110/33 kV, 30 MVA supply transformercomprising three single-phase units, resulting in no n-1 security.SolutionA spare on-site unit may be able to provide backup following a unit failure, withreplacement taking 8-14 hours. However, this is an uncontracted spare, which maynot be available when needed. Powerco considers the lack of n-1 security can beresolved operationally for the forecast period.The Mataroa supply transformer is approaching its expected end-of-life within thenext five years. We will discuss with Powerco the future supply options at Mataroa.Future investment will be customer driven.11.8.9 National Park transmission and supply transformer securityProject status/purpose:This issue is for information onlyIssueThe load at National Park is supplied through a single 110 kV transmission circuit anda single 110/33 kV, 10 MVA supply transformer comprising three single-phase units,resulting in no n-1 security.SolutionA spare on-site unit provides backup following a unit failure, with replacement taking8-14 hours. Some load can also be backfed through The Lines Company distribution89The transformers’ capacity is limited by metering equipment, followed by LV bushing limit (24 MWA)and protection limit (25 MVA); with these limits resolved, the n-1 capacity will be 26/27 MVA(summer/winter).<strong>2012</strong> <strong>Annual</strong> <strong>Planning</strong> <strong>Report</strong> © <strong>Transpower</strong> New Zealand Limited <strong>2012</strong>. All rights reserved. 183
Chapter 11: Central North Island Regionsystem. The Lines Company considers the lack of n-1 security can be resolvedoperationally for the forecast period.The National Park supply transformer is approaching its expected end-of-life withinthe next five years. We are discussing future supply options with The Lines Companyto increase supply security. Future investment will be customer driven.11.8.10 Ohakune supply transformer security and capacityProject reference:Project status/purpose:Indicative timing:Indicative cost band:TNG-SUBEST-DEV-01Possible, customer-specific2013, subject to agreement with The Lines CompanyAIssueThe load at Ohakune is supplied by a single 110/11 kV, 10 MVA supply transformercomprising three single-phase units (currently with one on-site spare). This meansOhakune has no n-1 security, although the spare on-site unit provides backupfollowing a unit failure (with replacement taking 8-14 hours).The peak load at Ohakune is forecast to exceed the transformer’s continuouscapacity by approximately 2 MW in <strong>2012</strong>, increasing to approximately 5 MW in 2027(see Table 11-11).Table 11-11: Ohakune supply transformer overload forecastGrid exitpointPowerfactorNext 5 yearsTransformer overload (MW)5-15 years out<strong>2012</strong> 2013 2014 2015 2016 2017 2019 2021 2023 2025 2027Ohakune 0.98 2 2 2 2 3 3 3 4 4 5 5SolutionThe local lines companies, Powerco and The Lines Company, have not requested ahigher security level at Ohakune. We are discussing option with The Lines Companyto transfer some of its load at Ohakune to Tangiwai grid exit point, via a new feeder atTangiwai.In addition, the Ohakune supply transformer is approaching its expected end-of-lifewithin the next five years. We will discuss the timing for the replacement transformerwith the local lines companies. Future investment will be customer driven.11.8.11 Ongarue supply transformer securityProject status/purpose:This issue is for information onlyIssueThe load at Ongarue is supplied by a single 110/33 kV, 20 MVA supply transformercomprising three single-phase units, resulting in no n-1 security.SolutionMost load can be backfed through The Lines Company’s distribution system. TheLines Company considers the lack of n-1 security can be resolved operationally forthe forecast period.We will also convert the Ongarue 33 kV outdoor switchgear to an indoor switchboardwithin the next 5-10 years. Also the Ongarue supply transformer will approach itsexpected end-of-life towards the end of the forecast period. We will discuss with The184<strong>2012</strong> <strong>Annual</strong> <strong>Planning</strong> <strong>Report</strong> © <strong>Transpower</strong> New Zealand Limited <strong>2012</strong>. All rights reserved.
Chapter 11: Central North Island RegionLines Company the timing of the switchgear conversion work and transformerreplacement options. Future investment will be customer driven.11.8.12 Tokaanu supply transformer securityProject status/purpose:This issue is for information onlyIssueThe load at Tokaanu is supplied by a single 220/33 kV, 20 MVA supply transformer,with a second transformer that can be manually switched into service when required.This means that Tokaanu does not have seamless n-1 security. Tripping the on-loadtransformer will result in a loss of supply until the other transformer is manuallyswitched into service.SolutionThe Lines Company considers the lack of n-1 security can be resolved operationallyfor the forecast period. Future investment will be customer driven.11.8.13 Waipawa supply transformer capacity and securityProject reference: WPW-POW_TFR_PTN-EHMT-01Project status/purpose: Base Capex, minor enhancementIndicative timing: 2015Indicative cost band: AIssueWaipawa has loads at 33 kV and 11 kV. Two 110/33 kV transformers (rated at20 MVA and 30 MVA) supply Waipawa’s load, providing:a total nominal installed capacity of 50 MVA, andn-1 capacity of 26/26 MVA 90 (summer/winter).The peak load at Waipawa is forecast to exceed the transformers’ n-1 winter capacityby approximately 1 MW in 2015, increasing to approximately 6 MW in 2027 (seeTable 11-12).Table 11-12: Waipawa supply transformer overload forecastGrid exitpointPowerfactorNext 5 yearsTransformer overload (MW)5-15 years out<strong>2012</strong> 2013 2014 2015 2016 2017 2019 2021 2023 2025 2027Waipawa 0.96 0 0 0 1 1 2 3 3 4 5 6A single 33/11 kV, 10 MVA transformer supplies Waipawa’s 11 kV load, resulting inno n-1 security.SolutionResolving the 110/33 kV transformers’ metering and protection limits will delay thetransformers’ capacity issue for a few years. We will discuss with Centralines thefuture supply options for Waipawa.Centralines considers the lack of n-1 security for Waipawa’s 11 kV load can beresolved operationally within the forecast period. Future investment will be customerdriven.90The transformers’ capacity is limited by a metering limit, followed by protection and transformerbushing (27 MVA) limits; with these limits resolved, the n-1 capacity will be 29/30 MVA(summer/winter).<strong>2012</strong> <strong>Annual</strong> <strong>Planning</strong> <strong>Report</strong> © <strong>Transpower</strong> New Zealand Limited <strong>2012</strong>. All rights reserved. 185
Chapter 11: Central North Island Region11.9 Other regional items of interestThere are no other items of interest identified to date beyond those set out inSection 11.8. See Section 11.10 for specific generation proposals relevant to thisregion.11.10 Central North Island generation proposals and opportunitiesThis section details relevant regional issues for selected generation proposals underinvestigation by developers and in the public domain, or other generationopportunities.The maximum generation that can be connected at any substation depends onseveral factors and usually falls within a range. Generation developers shouldconsult with us at an early stage of their investigations to discuss connection issues.See our website for more information about connecting generation. 9111.10.1 Additional geothermal generationThere are a number of planned and proposed geothermal generation developmentsin the region connecting into or near the Wairakei Ring. The Ngatamariki geothermalpower station is under construction and will connect to the Nga Awa Puruaswitchyard. A new geothermal power station is being built at Te Mihi and will beconnected to a new switchyard located at or near the tee point of the existing 220 kVWairakei–Poihipi–Whakamaru circuit.We have committed to replacing the existing Wairakei–Poihipi–Whakamaru 1 circuitwith a new overhead double-circuit line between Wairakei and Whakamaru. This willincrease the power flow capacity through the Wairakei Ring (see Chapter 6, Section6.4.3, for more information).11.10.2 Tauhara geothermal stationTauhara will connect into a 220 kV circuit from Wairakei to the Hawkes Bay region.Maungaharuru wind generation station (formally known as Titiokura, and Hawke’sBay wind stations) in the Hawkes Bay region will also connect to the same circuit (seeChapter 13, Section 13.10.2), which has enough capacity for the two generationconnections.There is potential for further geothermal generation development in the Tauhara area,as well as further wind and hydro generation development in the Hawkes Bay area.This additional potential generation will require Tauhara to be connected to both220 kV circuits from Wairakei to the Hawkes Bay region, and a thermal upgrade ofthe circuits between Wairakei and Tauhara.11.10.3 Additional wind generation connection to the 220 kV circuits betweenBunnythorpe and WellingtonThere are several investigations and proposals for wind station connections to the220 kV double-circuit line between Bunnythorpe, Linton, and Wellington, which couldoccur at Linton or at new connection points along the line.This is a high-capacity line and the effect of some additional generation ontransmission capacity between Bunnythorpe and Wellington will be a small netpercentage increase or decrease in transfer capacity, depending on the direction ofpower flow. A total of approximately 830 MW maximum generation injection into boththe Bunnythorpe–Tararua Wind Central–Linton and Bunnythorpe–Linton 220 kVcircuits will not cause system issues.91http://www.transpower.co.nz/connecting-new-generation.186<strong>2012</strong> <strong>Annual</strong> <strong>Planning</strong> <strong>Report</strong> © <strong>Transpower</strong> New Zealand Limited <strong>2012</strong>. All rights reserved.
Chapter 11: Central North Island RegionThe wind generation resource under investigation is so large, however, that it isunlikely to be economical to connect it all to these 220 kV circuits because oftransmission constraints.11.10.4 Additional generation connected to the 110 kV busesThere are several possible wind generation station sites close to the 110 kVtransmission circuits that run from Mangamaire to Woodville, Dannevirke, andWaipawa.At times, the existing 90 MW Te Apiti wind station, which connects at Woodville, usesall the available transmission capacity, even with the use of generation runbackschemes. Any new generation connected to the 110 kV transmission circuits mayoccasionally cause generation constraints. The capacity on the existing 110 kVMasterton–Mangamaire–Woodville and Bunnythorpe–Woodville circuits enables theconnection of approximately 79 MW of additional generation. Higher levels ofgeneration may require new lines.11.10.5 Puketoi rangesThere are several prospective wind generation stations in the Puketoi ranges, with acombined capacity of many hundreds of megawatts. The closest network is the110 kV transmission network (see Section 11.10.4), which is not nearby. If windgeneration is developed in this area, then a single new transmission line may possiblyconnect all the wind stations to the National Grid at Bunnythorpe.Generation from the Puketoi ranges can also connect along the 220 kV double-circuitline from Bunnythorpe to Wellington. However, care is required to ensure that thetotal generation from the Puketoi ranges, plus other generation along the 220 kVBunnythorpe–Wellington line, does not become too high (see Section 11.10.3). It isalso possible that some of the 110 kV lines may be rationalised as part of this work.<strong>2012</strong> <strong>Annual</strong> <strong>Planning</strong> <strong>Report</strong> © <strong>Transpower</strong> New Zealand Limited <strong>2012</strong>. All rights reserved. 187
Chapter 12: Taranaki Region12 Taranaki Regional Plan12.1 Regional overview12.2 Taranaki transmission system12.3 Taranaki demand12.4 Taranaki generation12.5 Taranaki significant maintenance work12.6 Future Taranaki projects summary and transmission configuration12.7 Changes since the 2011 <strong>Annual</strong> <strong>Planning</strong> <strong>Report</strong>12.8 Taranaki transmission capability12.9 Other regional items of interest12.10 Taranaki generation proposals and opportunities12.1 Regional overviewThis chapter details the Taranaki regional transmission plan. We base this regionalplan on an assessment of available data, and welcome feedback to improve its valueto all stakeholders.Figure 12-1: Taranaki region188<strong>2012</strong> <strong>Annual</strong> <strong>Planning</strong> <strong>Report</strong> © <strong>Transpower</strong> New Zealand Limited <strong>2012</strong>. All rights reserved.
Chapter 12: Taranaki RegionThe Taranaki region includes a mix of medium sized and small grid exit points, andindustrial loads.We have assessed the Taranaki region’s transmission needs over the next 15 yearswhile considering longer-term development opportunities. Specifically, thetransmission network needs to be flexible to respond to a range of future service andtechnology possibilities, taking into consideration:the existing transmission networkforecast demandforecast generationequipment replacement based on condition assessment, andpossible technological development.12.2 Taranaki transmission systemThis section highlights the state of the Taranaki regional transmission network. Theexisting transmission network is set out geographically in Figure 12-1 andschematically in Figure 12-2.Figure 12-2: Taranaki transmission schematicWaikatoHuntly Te KowhaiNewPlymouth33 kV110 kV55 kV220 kVCarrington Street33 kVHuirangi33 kVMotunui33 kV220 kVTaumarunui110 kV110 kV110 kV33 kV33 kVStratfordOpunake110 kV220 kV110 kVTaranakiCombinedCycle200 MWPeakers220 kV110 kVKapuni110 kVPatea33 kVHaweraWhareroa33 kVKupeBrunswick33 kVBunnythorpeCENTRAL NORTH ISLANDKEY220kV CIRCUIT110kV CIRCUITSUBSTATION BUSTRANSFORMER110 kV11 kVWaverleyWanganui33 kVTEE POINT110 kVLOADCAPACITORGENERATORSERIES REACTORWITH A BYPASSEDSWITCHMarton/BunnythorpeCENTRAL NORTH ISLAND12.2.1 Transmission through the regionThe Taranaki region connects to the National Grid through 220 kV circuits that runnorth to Huntly and south-east to Bunnythorpe. Under normal operation, generationexceeds demand in this region and power is exported to the rest of the National Grid.Between Stratford and Bunnythorpe there is a 110 kV line in parallel with the 220 kVline. Power transfer south of Stratford can be constrained by the parallel 110 kVcircuits under certain operating conditions.<strong>2012</strong> <strong>Annual</strong> <strong>Planning</strong> <strong>Report</strong> © <strong>Transpower</strong> New Zealand Limited <strong>2012</strong>. All rights reserved. 189
Chapter 12: Taranaki RegionWe have committed to reconductoring the 110 kV circuits between Stratford andWanganui with a higher-rated conductor to maximise the through flow on the 220 kVcircuits.12.2.2 Transmission within the regionThe 220 kV Taranaki transmission network forms part of the grid backbone. Theparallel 110 kV transmission network within the region has both capacity and voltageissues under certain operating conditions.We currently have a number of projects proposed or underway to improve supplyreliability and support demand growth in the Taranaki region. These projects includereplacing old single phase transformers and resolving the overloading issues on the110 kV transmission network. Due to corrosion, we have also committed to replacingthe old 110 kV Opunake–Stratford conductor with a modern equivalent.12.2.3 Longer-term development pathNo significant new transmission is expected to be required in the Taranaki region.New generation connection may require nearby circuits to be thermally upgraded orreconductored for additional capacity to export the generation.High levels of new generation, such as two or more additional combined cycle gasturbines may require additional transmission circuits in and adjacent to the Taranakiregion to transfer generation out of the region.12.3 Taranaki demandThe after diversity maximum demand (ADMD) for the Taranaki region is forecast togrow on average by 1.0% annually over the next 15 years, from 222 MW in <strong>2012</strong> to258 MW by 2027. This is lower than the national average demand growth of 1.7%annually.Figure 12-3 shows a comparison of the 2011 and <strong>2012</strong> forecast 15-year maximumdemand (after diversity 92 ) for the Taranaki region. The forecasts are derived usinghistorical data, and modified to account for customer information, where appropriate.The power factor at each grid exit point is also derived from historical data, and isused to calculate the real power capacity for power transformer and transmission line.See Chapter 4 for more information about demand forecasting.92The after diversity maximum demand (ADMD) for the region will be less than the sum of theindividual GXP peak demands, as it takes into account the fact that the peak demand does not occursimultaneously at all the GXPs in the region.190<strong>2012</strong> <strong>Annual</strong> <strong>Planning</strong> <strong>Report</strong> © <strong>Transpower</strong> New Zealand Limited <strong>2012</strong>. All rights reserved.
Chapter 12: Taranaki RegionFigure 12-3: Taranaki region after diversity maximum demand forecastLoad (MW)400Taranaki3503002502001502011 APR Forecast<strong>2012</strong> APR ForecastActual Peak1001997 1999 2001 2003 2005 2007 2009 2011 2013 2015 2017 2019 2021 2023 2025 2027Figure 12-1 lists forecast peak demand (prudent growth) at each grid exit point for theforecast period, as required for the Grid Reliability <strong>Report</strong>.Table 12-1: Forecast annual peak demand (MW) at Taranaki grid exit points to 2027Grid exit pointPowerfactorNext 5 yearsPeak demand (MW)5-15 years out<strong>2012</strong> 2013 2014 2015 2016 2017 2019 2021 2023 2025 2027Brunswick 0.94 43 44 45 46 47 48 49 51 53 54 55Carrington1 0.95 62 63 65 66 67 69 71 74 76 78 80StreetHuirangi 1 0.91 28 29 29 30 30 31 32 33 34 35 36Hawera 0.93 32 33 33 34 35 35 35 38 39 40 41Hawera (Kupe) 1.00 12 12 12 12 12 12 12 12 12 12 12Motunui 0.92 9 9 9 9 9 9 9 9 9 9 9Moturoa 0.99 22 23 23 24 25 25 27 28 29 30 32Opunake 0.91 11 11 11 12 12 12 13 13 14 14 14Stratford 33 kV 0.92 31 32 32 32 33 33 34 35 36 37 38Stratford 220 kV 1.00 11 11 11 12 12 12 13 13 14 14 14Taumarunui 0.83 11 11 11 11 11 11 11 11 11 11 11Wanganui 0.94 50 51 52 53 54 55 57 60 61 63 64Waverley 0.92 4 4 4 4 4 4 4 4 5 5 51. Load shifting between Carrington Street and Huirangi affects both peak forecasts.12.4 Taranaki generationThe Taranaki region’s generation capacity is 733 MW, increasing to 833 MW after thecommissioning of the Todd Energy 100 MW McKee Power Plant. The region imports<strong>2012</strong> <strong>Annual</strong> <strong>Planning</strong> <strong>Report</strong> © <strong>Transpower</strong> New Zealand Limited <strong>2012</strong>. All rights reserved. 191
Chapter 12: Taranaki Regionand exports power to the National Grid depending on the level of dispatched thermalgeneration.Table 12-2 lists the generation forecast at each grid injection point for the forecastperiod, as required for the Grid Reliability <strong>Report</strong>. This includes all known andcommitted generation stations including those embedded within the relevant locallines company’s network (Powerco). 93Table 12-2: Forecast annual generation capacity (MW) at Taranaki grid injection pointsto 2027 (including existing and committed generation)Grid injection point(location if embedded)Generation capacity (MW)Next 5 years5-15 years out<strong>2012</strong> 2013 2014 2015 2016 2017 2019 2021 2023 2025 2027Carrington St (Mangorei) 5 5 5 5 5 5 5 5 5 5 5Hawera - Kiwi Dairy(Whareroa)70 70 70 70 70 70 70 70 70 70 70Hawera – Patea 31 31 31 31 31 31 31 31 31 31 31Hawera (Patearoa) 2 2 2 2 2 2 2 2 2 2 2Huirangi (Mangahewa) 9 9 9 9 9 9 9 9 9 9 9Huirangi (Motukawa) 5 5 5 5 5 5 5 5 5 5 5Kapuni 25 25 25 25 25 25 25 25 25 25 25Motunui Deviation (MPP) 0 100 100 100 100 100 100 100 100 100 100Stratford 385 385 385 385 385 385 385 385 385 385 385Stratford peaking plant 200 200 200 200 200 200 200 200 200 200 200Stratford (StratfordAustral Pacific)1 1 1 1 1 1 1 1 1 1 112.5 Taranaki significant maintenance workOur capital project and maintenance works are integrated to enable system issues tobe resolved if possible when assets are replaced or refurbished. Table 12-3 lists thesignificant maintenance-related work 94 proposed for the Taranaki region for the next15 years that might significantly impact related system issues or connected parties.Table 12-3: Proposed significant maintenance workDescriptionBrunswick supply transformerexpected end-of-lifeHawera 110 kV rebuild, and33 kV outdoor to indoorconversionHawera supply transformersexpected end-of-lifeHuirangi supply transformersexpected end-of-lifeMotunui 11 kV switchgearreplacementTentativeyearRelated system issues2017-2019 No n-1 security at Brunswick. Future investment will becustomer driven. See Section 12.8.3 for moreinformation.<strong>2012</strong>-2014 The work involves rationalising the 110 kV bus to easemaintenance outages and increasing the 110 kV busrating. The new rating will match the new Stratford andWaverley circuits.2027-2030 The forecast load will exceed the supply transformer’s n-1thermal capacity from 2014. See Section 12.8.7 for moreinformation.2019-2021 The forecast load at Huirangi already exceedstransformer n-1 capacity. See Section 12.8.7 for moreinformation.2019-2021 No system issues are identified within the forecast period.9394Only generators with a capacity greater than 1 MW are listed. Generation capacity is rounded to thenearest megawatt.This may include replacement of the asset due to its condition assessment.192<strong>2012</strong> <strong>Annual</strong> <strong>Planning</strong> <strong>Report</strong> © <strong>Transpower</strong> New Zealand Limited <strong>2012</strong>. All rights reserved.
Chapter 12: Taranaki RegionDescriptionNew Plymouth interconnectingtransformer expected end-oflifeOpunake–Stratford AreconductoringStratford interconnectingtransformer expected end-oflifeStratford supply transformerexpected end-of-lifeWanganui supply transformersexpected end-of-lifeTentativeyearRelated system issues2020-2022 There are system issues associated with an outage of theNew Plymouth interconnecting transformer. See Section12.8.1 for more information.2011-2014 No system issues are identified within the forecast period.2023-2025 The interconnecting transformer will exceed its n-1capacity under certain operating conditions. See Section12.8.1 for more information.2013-2015 The forecast load of Stratford already exceeds thetransformer n-1 capacity. See Section 12.8.10 for moreinformation.2013-2015 The forecast load of Wanganui already exceeds thetransformer n-1 capacity. See Section 12.8.11 for moreinformation.12.6 Future Taranaki projects summary and transmission configurationTable 12-4 lists projects to be carried out in the Taranaki region within the next 15years.Figure 12-4 shows the possible configuration of Taranaki transmission in 2027, withnew assets, upgraded assets, and assets undergoing significant maintenance withinthe forecast period.Table 12-4: Projects in the Taranaki region up to 2027Site Projects StatusBrunswickReplace supply transformer.Install a second supply transformer.Base CapexPossibleBrunswick–Stratford Upgrade circuit’s capacity. PossibleCarrington Street Upgrade supply transformer branch limiting components. Base CapexCarrington Street–StratfordHaweraIncrease circuit’s capacity by thermally upgrading the terminalspans near Carrington Street.110 kV bus rebuild.Convert 33 kV outdoor switchgear to an indoor switchboard.Replace supply transformers.PossiblePossibleBase CapexBase CapexHuirangi Replace supply transformers with higher-rated units. Base CapexNew PlymouthReplace interconnecting transformer.Install a second interconnecting transformer.Base CapexPossibleOpunake–Stratford Reconductor Opunake–Stratford A line. CommittedHawera–Waverley Reconductor Hawera–Waverley line. CommittedStratfordReplace interconnecting transformer.Replace supply transformers with higher-rated units.Base CapexBase CapexWanganui Replace supply transformers with higher-rated units. Base Capex<strong>2012</strong> <strong>Annual</strong> <strong>Planning</strong> <strong>Report</strong> © <strong>Transpower</strong> New Zealand Limited <strong>2012</strong>. All rights reserved. 193
Chapter 12: Taranaki RegionFigure 12-4: Possible Taranaki transmission configuration in 2027New Plymouth33 kV110 kVWaikatoHuntly Te Kowhai220 kVCarrington Street33 kV*Huirangi33 kVMotunui33 kV55 kV110 kV110 kV110 kV220 kVTaumarunuiMcKee PowerProject33 kV33 kVStratfordOpunake110 kV220 kV110 kVTaranakiCombinedCycle200 MWPeakers220 kVKEY110 kVKapuni110 kVPatea WhareroaKupe33 kVHawera 33 kVBrunswick33 kVBunnythorpeCENTRAL NORTH ISLANDNEW ASSETSUPGRADED ASSETSASSETS SCHEDULEDFOR REPLACEMENTMINOR UPGRADE*110 kV11 kVWaverleyWanganui33 kV110 kVMarton/BunnythorpeCENTRAL NORTH ISLAND12.7 Changes since the 2011 <strong>Annual</strong> <strong>Planning</strong> <strong>Report</strong>Table 12-5 lists the specific issues that are either new or no longer relevant within theforecast period when compared to last year's report.Table 12-5: Changes since 2011IssuesHawera supply transformer capacityOpunake supply transformer capacityChangeNew issue.New Issue.12.8 Taranaki transmission capabilityTable 12-6 summarises issues involving the Taranaki region for the next 15 years.For more information about a particular issue, refer to the listed section number.Table 12-6: Taranaki region transmission issuesSectionnumberIssueRegional12.8.1 North Taranaki transmission capacity and low voltage issues12.8.2 Stratford–Hawera–Waverley–Wanganui 110 kV transmission capacitySite by grid exit point12.8.3 Brunswick supply security12.8.4 Carrington Street supply transformer capacity12.8.5 Hawera voltage quality12.8.6 Hawera (Kupe) supply security12.8.7 Hawera supply transformer capacity12.8.8 Huirangi supply transformer capacity194<strong>2012</strong> <strong>Annual</strong> <strong>Planning</strong> <strong>Report</strong> © <strong>Transpower</strong> New Zealand Limited <strong>2012</strong>. All rights reserved.
Chapter 12: Taranaki RegionSectionnumberIssue12.8.9 Opunake supply transformer capacity12.8.10 Stratford supply transformer capacity12.8.11 Wanganui supply transformer capacity12.8.12 Waverley supply security12.8.1 North Taranaki transmission capacity and low voltage issuesProject reference: TRNK-TRAN-EHMT-01Project status/purpose: Stratford interconnecting transformer capacity: possible, to meet the GridReliability Standard (core grid)Replace Carrington Street–Stratford circuits’ terminal span equipment: BaseCapex, minor enhancementUpgrade Huirangi transformer: possible, customer-specificIndicative timing: 2015-2021Indicative cost band: New interconnecting transformer: BReconfigure 220 kV to 110 kV transmission: to be advisedReplace Carrington Street–Stratford circuits’ terminal span equipment: AUpgrade Huirangi transformer: BIssueThe 220/110 kV, 100 MVA interconnecting transformer at Stratford operates inparallel with the 220/110 kV, 200 MVA interconnecting transformer at New Plymouthto supply Taranaki’s load. The Stratford transformer also assists with throughtransmission on the 110 kV transmission network between Bunnythorpe andStratford.The Stratford and New Plymouth transformers provide:a total nominal installed capacity of 295 MVA, andn-1 capacity of 135/143 MVA (summer/winter).An outage of the New Plymouth interconnecting transformer may cause:the Stratford interconnecting transformer to exceed its n-1 capacity (the loadingon this interconnecting transformer depends on the 110 kV Taranaki generation)the Carrington Street–Stratford circuit to exceed its thermal capacity, andlow voltage at the Huirangi 33 kV supply bus.SolutionPossible solutions include:installing a second 220/110 kV interconnecting transformer at (or near) NewPlymouth, and we anticipate land acquisition is required for the secondtransformeroperating the 220 kV New Plymouth–Stratford circuits at 110 kV,decommissioning the New Plymouth 220/110kV interconnection and raising theStratford interconnection capacity to 250 MVAconstraining-on generation in the 110 kV network to reduce loading and retainvoltage qualityupgrading the thermal capacity of the Carington Street terminating spans of theCarrington Street–Stratford circuits, andreplacing the Huirangi supply transformers with transformers with on load tapchangers.In addition, the interconnecting transformers at New Plymouth and Stratford have anexpected end-of-life within the forecast period. We will investigate the rating and<strong>2012</strong> <strong>Annual</strong> <strong>Planning</strong> <strong>Report</strong> © <strong>Transpower</strong> New Zealand Limited <strong>2012</strong>. All rights reserved. 195
Chapter 12: Taranaki Regiontiming of the replacement transformers and possible alternate transmissionconfiguration.12.8.2 Stratford–Hawera–Waverley–Wanganui 110 kV transmission capacityProject reference: SFD_WGN-TRAN-EHMT-01Project status/purpose: Committed, to provide net market benefitIndicative timing: Q4 <strong>2012</strong>Indicative cost band: DIssueThere are several issues with respect to the capacity of the 110 kV Stratford–Hawera–Waverley–Wanganui circuits.Circuit capacities sometimes constrain high south power flow for an outage of aparallel 220 kV circuit between Stratford and Bunnythorpe. A series reactor andan automatic bus splitting scheme have been installed at Hawera. These raise,but do not eliminate, the constraint level.Circuit capacities may constrain generation, for high generation from Taranakicoupled with high or low generation at Whareroa and Patea.An outage of the 110 kV Hawera–Stratford circuit may overload the 110 kVWanganui–Waverley circuit during high net Hawera load (when Patea andWhareroa are not generating). This may require load shedding at Hawera torelieve the overloading.SolutionDuring an outage of a 220 kV circuit between Stratford and Bunnythorpe, anautomatic protection scheme will remove post-contingency overloads on the 110 kVHawera–Waverley circuit by splitting the Hawera 110 kV bus. Patea and the 33 kVload will be connected only to the Hawera–Stratford circuit. Whareroa and Kupe willbe connected only to the 110 kV Hawera–Waverley circuit.We have completed reconductoring the Hawera–Stratford and Wanganui–Waverleysections 95 and committed to reconductoring the Hawera–Waverley section by the endof <strong>2012</strong>, after which the series reactor at Hawera will be decommissioned.12.8.3 Brunswick supply securityProject reference: BRK-POW_TRF-DEV-01Project status/purpose: Possible, customer-specificIndicative timing: 2017-2019Indicative cost band: BIssueA single 220/33 kV, 50 MVA 96 transformer bank supplies load at Brunswick resultingin no n-1 security.There is a non-contracted on-site spare transformer, allowing possible replacementwithin 8-14 hours following a unit failure (if the spare unit is available). Some loadmay need to be curtailed during this transformer outage period, as there is onlylimited capacity within the Powerco network to transfer load.9596The Hawera–Stratford and Wanganui–Waverley circuits’ capacities are limited by station equipmentat Hawera of 76/76 MVA (summer/winter) and Wanganui of 78/78 MVA (summer/winter),respectively.The transformer’s meter accuracy limit of 39 MVA prevents the full nominal installed capacity beingavailable.196<strong>2012</strong> <strong>Annual</strong> <strong>Planning</strong> <strong>Report</strong> © <strong>Transpower</strong> New Zealand Limited <strong>2012</strong>. All rights reserved.
Chapter 12: Taranaki RegionSolutionWe are discussing future supply options with Powerco, one of which is to install asecond supply transformer to provide n-1 security. The existing transformer will alsoapproach its expected end-of-life within the next 5-10 years. We will discuss withPowerco the appropriate rating and timing for the replacement transformers. Futureinvestment will be customer driven.12.8.4 Carrington Street supply transformer capacityProject reference: Upgrade protection: CST-POW_TFR_PTN-EHMT-01Upgrade branch components: CST-POW_TFR-EHMT-01Project status/purpose: Upgrade protection: Base Capex, minor enhancementUpgrade branch components: possible, customer-specificIndicative timing: 2013Indicative cost band: Upgrade protection: AUpgrade branch components: AIssueTwo 110/33 kV transformers supply Carrington Street’s load, providing:a total nominal installed capacity of 150 MVA, andn-1 capacity of 64/64 MVA 97 (summer/winter).The peak load at Carrington Street is forecast to exceed the n-1 winter capacity by1 MW in <strong>2012</strong>, increasing to approximately 18 MW in 2027 (see Table 12-7).Table 12-7: Carrington Street supply transformer overload forecastGrid exitpointCarringtonStreetPowerfactorNext 5 yearsTransformer overload (MW)5-15 years out<strong>2012</strong> 2013 2014 2015 2016 2017 2019 2021 2023 2025 20270.95 1 2 3 4 6 7 10 12 15 17 18SolutionUpgrading the protection equipment, 33 kV bus section, circuit breakers,disconnectors, and current transformers to at least 109 MVA will resolve the issue forthe forecast period and beyond. Future investment will be customer driven.12.8.5 Hawera voltage qualityProject reference: HWA-REAC-SUP-DEV-01Project status/purpose: Possible, to meet the Grid Reliaility Standard (not core grid)Indicative timing: 2015-2020Indicative cost band: AIssueAn outage of the 110 kV Hawera–Stratford circuit can result in low voltage andvoltage drops greater than 5% when there is no local generation available at Hawera.When this occurs, Hawera is supplied from a 143 km spur line from Bunnythorpe. Asthe spur load grows, the voltage quality issues progressively arise at Waverley, andWanganui.97The transformers’ capacity is limited by a relay, followed by LV bus section and disconnector(69 MVA) limits, and circuit breaker (71 MVA) limits; with these limits resolved, the n-1 capacity willbe 104/109 MVA (summer/winter).<strong>2012</strong> <strong>Annual</strong> <strong>Planning</strong> <strong>Report</strong> © <strong>Transpower</strong> New Zealand Limited <strong>2012</strong>. All rights reserved. 197
Chapter 12: Taranaki RegionPatea (32 MW) and Whareroa (50 MW) inject into the Hawera 110 kV bus, but havedifficulty providing voltage support.SolutionWe are presently investigating options for resolving the low voltage issues at Hawera,which include:obtaining greater reactive support from the generatorsinstalling under-voltage load shedding capability, andinstalling reactive support at Hawera.12.8.6 Hawera (Kupe) supply securityProject status/purpose:This issue is for information onlyIssueA single 110/33 kV, 30 MVA supply transformer supplies the Origin EnergyResources Kupe load, resulting in no n-1 security.The load can be transferred to the other supply transformers at Hawera by closing the33 kV bus coupler for maintenance outages, and after a transformer trips.SolutionThe load is fixed industrial, supplied by a dedicated transformer that meets thecustomer’s requirements.12.8.7 Hawera supply transformer capacityProject status/purpose:This issue is for information onlyIssueTwo 110/33 kV transformers supply Hawera’s load, providing:a total installed capacity of 60 MVA, andn-1 capacity of 35/35 98 MVA (summer/winter).The peak load at Hawera is forecast to exceed the transformers’ n-1 summercapacity by 1 MW in 2016, increasing to approximately 9 MW in 2027 (see Table12-8).Table 12-8: Hawera supply transformer overload forecastGrid exitpointPowerfactorNext 5 yearsTransformer overload (MW)5-15 years out<strong>2012</strong> 2013 2014 2015 2016 2017 2019 2021 2023 2025 2027Hawera 0.93 0 1 2 2 3 4 5 6 7 9 9SolutionThe interim solution is to close the 33 kV bus coupler and supply the Powerco loadfrom the single Kupe supply transformer.A possible longer-term option is to replace the existing transformers with two 50 MVAunits.98The transformers’ capacity is limited by 33 kV bus section limit; with this limit resolved, the n-1capacity will be 37/39 MVA (summer/winter).198<strong>2012</strong> <strong>Annual</strong> <strong>Planning</strong> <strong>Report</strong> © <strong>Transpower</strong> New Zealand Limited <strong>2012</strong>. All rights reserved.
Chapter 12: Taranaki RegionBoth Hawera supply transformers have an expected end-of-life at the end of theforecast period. We will discuss with Powerco the appropriate rating and timing forthe replacement transformers. Future investment will be customer driven.12.8.8 Huirangi supply transformer capacityProject reference: HUI-POW_TFR-REPL-01Project status/purpose: Base Capex, replacementIndicative timing: 2019Indicative cost band: BIssueTwo 110/33 kV transformers supply Huirangi’s load, providing:a total installed capacity of 40 MVA, andn-1 capacity of 22/24 MVA (summer/winter).The peak load at Huirangi is forecast to exceed the transformers’ n-1 summercapacity by 6 MW in <strong>2012</strong>, increasing to approximately 13 MW in 2027 (see Table12-9).Table 12-9: Huirangi supply transformer overload forecastGrid exitpointPowerfactorNext 5 yearsTransformer overload (MW)5-15 years out<strong>2012</strong> 2013 2014 2015 2016 2017 2019 2021 2023 2025 2027Huirangi 0.91 6 6 7 7 8 8 9 10 11 12 13SolutionThe interim solution is for Powerco to control the Bell Block load shift from CarringtonStreet to Huirangi.The longer-term option is to replace the existing transformers with two 50 MVA unitsand reconfigure the distribution system.Both Huirangi supply transformers have an expected end-of-life within the next 5-10years. We are in discussions with Powerco to obtain the appropriate rating andtiming for the replacement transformers. Future investment will be customer driven.12.8.9 Opunake supply transformer capacityProject reference: OPK_POW-TFR-EHMT-01Project status/purpose: Base Capex, minor enhancementIndicative timing: 2019Indicative cost band: AIssueTwo 110/33 kV transformers supply Opunake’s load, providing:a total nominal installed capacity of 60 MVA, andn-1 capacity of 14/14 MVA 99 (summer/winter).The peak load at Opunake is forecast to exceed the winter n-1 capacity by 1 MW in2019, increasing to approximately 3 MW in 2027 (see Table 12-10).99The transformers’ capacity is limited by metering limit; with this limit resolved, the n-1 capacity will be38/40 MVA (summer/winter).<strong>2012</strong> <strong>Annual</strong> <strong>Planning</strong> <strong>Report</strong> © <strong>Transpower</strong> New Zealand Limited <strong>2012</strong>. All rights reserved. 199
Chapter 12: Taranaki RegionTable 12-10: Opunake supply transformer overload forecastGrid exitpointPowerfactorNext 5 yearsTransformer overload (MW)5-15 years out<strong>2012</strong> 2013 2014 2015 2016 2017 2019 2021 2023 2025 2027Opunake 0.91 0 0 0 0 0 0 1 1 2 2 3SolutionResolving the metering and protection limits will provide sufficient n-1 capacity for theforecast period and beyond.12.8.10 Stratford supply transformer capacityProject reference: SFD_POW-TFR-REPL-01Project status/purpose: Base Capex, replacementIndicative timing: 2013-2015Indicative cost band: BIssueTwo 110/33 kV transformers supply Stratford’s load, providing:a total nominal installed capacity of 40 MVA, andn-1 capacity of 23/24 MVA 100 (summer/winter).The peak load at Stratford already exceeds the transformers’ n-1 summer capacityand the overload is forecast to increase to approximately 17 MW by 2027 (see Table12-11).Table 12-11: Stratford supply transformer overload forecastGrid exitpointPowerfactorNext 5 yearsTransformer overload (MW)5-15 years out<strong>2012</strong> 2013 2014 2015 2016 2017 2019 2021 2023 2025 2027Stratford 0.92 11 11 11 12 12 13 14 15 16 17 17SolutionThe existing supply transformers are approaching their expected end-of-life within thenext five years. We are discussing with Powerco the appropriate rating and timing forthe replacement transformers. A longer-term solution involves replacing the existingtransformers with two 40 MVA units.12.8.11 Wanganui supply transformer capacityProject reference: WGN_POW-TFR-REPL-01Project status/purpose: Base Capex, replacementIndicative timing: 2013-2015Indicative cost band: BIssueThere are two 110/33 kV transformers (20 MVA and 30 MVA) at Wanganui, providing:a total nominal installed capacity of 50 MVA, andn-1 capacity of 24/24 MVA 101 (summer/winter).100 The transformers’ winter capacity is limited by the cable rating; with this limit resolved, the n-1capacity will be 25 MVA.200<strong>2012</strong> <strong>Annual</strong> <strong>Planning</strong> <strong>Report</strong> © <strong>Transpower</strong> New Zealand Limited <strong>2012</strong>. All rights reserved.
Chapter 12: Taranaki RegionThere is a single 50 MVA 220/33kV transformer at Brunswick. Both the Wanganuiand Brunswick grid exit points supply Wanganui Township, providing:a total nominal installed capacity of 89 MVA, andn-1 capacity of 59 MVA 102 (summer/winter).The aggregate peak load at Wanganui and Brunswick already exceeds thetransformers’ n-1 winter capacity and the overload is forecast to increase toapproximately 27 MW in 2027 (see Table 12-12).Table 12-12: Wanganui town supply transformer overload forecastGrid exitpointPowerfactorNext 5 yearsTransformer overload (MW)5-15 years out<strong>2012</strong> 2013 2014 2015 2016 2017 2019 2021 2023 2025 2027Wanganui 0.94 10 11 12 14 15 16 19 21 23 26 27SolutionWe are discussing future supply options with Powerco. Options include:replacing the two Wanganui transformers with two 80 MVA unitsadding 110 kV feeders from Wanganui, orinstalling a second transformer at Brunswick.All supply transformers at Wanganui are approaching their expected end-of-life withinthe next five years. We will discuss with Powerco the rating and timing ofreplacement transformers. Future investment will be customer driven.12.8.12 Waverley supply securityProject status/purpose:This issue is for information onlyIssueA single 110/11 kV, 10 MVA transformer supplies load at Waverley resulting in no n-1security.SolutionThere is an on-site spare transformer, allowing replacement within 8-14 hoursfollowing a unit failure. Powerco considers the issue can be resolved operationally forthe forecast period. Any future investment will be customer driven.12.9 Other regional items of interestThere are no other items of interest identified to date beyond those set out inSection 12.8. See Section 12.10 for information about generation proposals relevantto this region.12.10 Taranaki generation proposals and opportunitiesThis section details relevant regional issues for selected generation proposals underinvestigation by developers and in the public domain, or other generationopportunities.The maximum generation that can be connected at any substation101The transformers’ capacity is limited by the transformer bushing; with this limit resolved, the n-1capacity will be 27/28 MVA (summer/winter).102Brunswick supply transformer is taken out of service. The Wanganui supply transformers’ n-1capacity is limited by branch limiting components. With these limits resolved, the n-1 capacity willbe 64/68 MVA (summer/winter).<strong>2012</strong> <strong>Annual</strong> <strong>Planning</strong> <strong>Report</strong> © <strong>Transpower</strong> New Zealand Limited <strong>2012</strong>. All rights reserved. 201
Chapter 12: Taranaki Regiondepends on several factors and usually falls within a range. Generation developersshould consult with us at an early stage of their investigations to discuss connectionissues. See our website for more information about connecting generation. 10312.10.1 Maximum regional generationFor generation connections at the Stratford 220 kV bus, the maximum generation thatcan be injected under n-1 is approximately 800-1,200 MW. This includes the existingand newly commissioned 200 MW generators. Generation injection into the Stratford220 kV bus depends on the direction of HVDC power flows and system constraintsaround the Wairakei ring.Generation stability issues will also need to be addressed (see Chapter 6, Section6.4.4).12.10.2 Waverley wind stationThere is a potential for wind generation near Waverley. Connection options includethe nearby 110 kV Hawera–Wanganui circuit, or the three nearby 220 kV Brunswick–Stratford circuits.We have committed to upgrading the 110 kV Stratford–Wanganui circuits (seeSection 12.8.2). After the upgrade, approximately 100-150 MW of generation can beconnected.The three 220 kV Brunswick–Stratford circuits are part of the grid backboneconnecting Taranaki to the rest of the National Grid. The loading on these threecircuits is approximately equal, which maximises their transfer capacity. In order tomaintain the existing transfer capacity, a large wind station will need to be connectedto all three circuits, or the capacity of one or more of the circuits will need to beincreased.12.10.3 Additional generation at other locationsThere are no issues with connecting new generation at the New Plymouth 220 kV bus(other than stability issues). The maximum generation injection into the NewPlymouth 110 kV bus at n-1 security is approximately 450 MW under light loadconditions. Any generation injecting into this bus will play a significant role inregulating the 110 kV bus voltages in the northern part of the Taranaki region.Exploration for more gas inshore and offshore continues in the Taranaki region andhas a potential for further gas generation development. Depending on the size of newgeneration, connection to the 220 kV and few 110 kV lines in the northern Taranakiarea might be possible without a major line capacity upgrade.Due to environmental corrosion, we have committed to reconductoring the Opunake–Stratford circuit with a new AAAC conductor. The existing rating has been maintainedwhich has sufficient capacity for approximately 50 MW of new generation on a securedouble circuit.103 http://www.transpower.co.nz/connecting-new-generation.202<strong>2012</strong> <strong>Annual</strong> <strong>Planning</strong> <strong>Report</strong> © <strong>Transpower</strong> New Zealand Limited <strong>2012</strong>. All rights reserved.
Chapter 13: Hawke’s Bay Region13 Hawke’s Bay Regional Plan13.1 Regional overview13.2 Hawke’s Bay transmission system13.3 Hawke’s Bay demand13.4 Hawke’s Bay generation13.5 Hawke’s Bay significant maintenance work13.6 Future Hawke’s Bay projects summary and transmission configuration13.7 Changes since the 2011 <strong>Annual</strong> <strong>Planning</strong> <strong>Report</strong>13.8 Hawke’s Bay transmission capability13.9 Other regional items of interest13.10 Hawke’s Bay generation proposals and opportunities13.1 Regional overviewThis chapter details the Hawke’s Bay regional transmission plan. We base thisregional plan on an assessment of available data, and welcome feedback to improveits value to all stakeholders.Figure 13-1: Hawke’s Bay region<strong>2012</strong> <strong>Annual</strong> <strong>Planning</strong> <strong>Report</strong> © <strong>Transpower</strong> New Zealand Limited <strong>2012</strong>. All rights reserved. 203
Chapter 13: Hawke’s Bay RegionThe Hawke’s Bay region load includes a mix of significant provincial cities (Napier,Hastings and Gisborne), heavy industry (the Panpac Mill), and smaller rural servicecentres (Wairoa and Havelock North).We have assessed the Hawke’s Bay region’s transmission needs over the next 15years while considering longer-term development opportunities. Specifically, thetransmission network needs to be flexible to respond to a range of future service andtechnology possibilities, taking into consideration:the existing transmission networkforecast demandforecast generationequipment replacement based on condition assessment, andpossible technological development.13.2 Hawke’s Bay transmission systemThis section highlights the state of the Hawke’s Bay regional transmission network.The existing transmission network is set out geographically in Figure 13-1 andschematically in Figure 13-2.Figure 13-2: Hawke’s Bay transmission schematicTokomaru BayCENTRAL NORTH ISLANDWairakei110 kV11 kVTuaiGisborne50 kV110 kV110 kV11 kVWairoa11 kVWhirinaki220 kVKEYRedclyffe220kV CIRCUIT110kV CIRCUIT33 kV110 kV220 kV33 kVWhakatuSUBSTATION BUSTRANSFORMERTEE POINTLOADCAPACITORFernhill220 kVBONDED CIRCUITGENERATOR33 kV110 kVWaipawaCENTRAL NORTH ISLAND204<strong>2012</strong> <strong>Annual</strong> <strong>Planning</strong> <strong>Report</strong> © <strong>Transpower</strong> New Zealand Limited <strong>2012</strong>. All rights reserved.
Chapter 13: Hawke’s Bay Region13.2.1 Transmission into the regionTransmission into the region is via two 220 kV circuits from Wairakei that supply theWhirinaki and Whakatu loads directly, and via two 220/110 kV interconnectingtransformers at Redclyffe.Two 110 kV circuits also connect Fernhill to Waipawa in the south and are normallyopen at Waipawa.13.2.2 Transmission within the region220/110 kV interconnectionThe majority of the region’s load is supplied via the 220/110 kV transformers atRedclyffe. The transformer capacity may need to be increased as load grows, and/ornew generation is connected to the 110 kV transmission network.110 kV circuitsTransmission within the Hawke’s Bay region is predominantly at 110 kV. The twocircuits supplying Gisborne may require a rating increase within the forecast period.For new generation or load connections beyond that forecast in this APR, some of the110 kV lines may require capacity upgrade.13.2.3 Longer-term development pathThe two 220 kV circuits from Wairakei are expected to be adequate for the next 30-40years of regional load growth. Additional reactive support will be required over thisperiod, and the region will be on n security whenever one circuit is out of service formaintenance.The two 220 kV circuits may need to be thermally upgraded to export power from theregion during low load periods if there is a large increase in new generation. A new220 kV line from the Bunnythorpe area to the Hawke’s Bay region may be consideredif an increase in security is required.We expect the development of new generation in the Hawke’s Bay region to drive theneed for system upgrades.13.3 Hawke’s Bay demandThe after diversity maximum demand (ADMD) for the Hawke’s Bay region is forecastto grow on average by 1.0% annually over the next 15 years, from 320 MW in <strong>2012</strong> to369 MW by 2027. This is lower than the national average demand growth of 1.7%annually.Figure 13-3 shows a comparison of the 2011 and <strong>2012</strong> forecast 15-year maximumdemand (after diversity 104 ) for the Hawke’s Bay region. The forecasts are derivedusing historical data, and modified to account for customer information, whereappropriate. The power factor at each grid exit point is also derived from historicaldata, and is used to calculate the real power capacity for power transformer andtransmission line. See Chapter 4 for more information about demand forecasting.104 The after diversity maximum demand (ADMD) for the region will be less than the sum of theindividual grid exit point peak demands, as it takes into account the fact that the peak demand doesnot occur simultaneously at all the grid exit points in the region.<strong>2012</strong> <strong>Annual</strong> <strong>Planning</strong> <strong>Report</strong> © <strong>Transpower</strong> New Zealand Limited <strong>2012</strong>. All rights reserved. 205
Chapter 13: Hawke’s Bay RegionFigure 13-3: Hawke’s Bay region after diversity maximum demand forecastLoad (MW)400Hawkes Bay3803603403203002802602402011 APR Forecast220<strong>2012</strong> APR ForecastActual Peak2001997 1999 2001 2003 2005 2007 2009 2011 2013 2015 2017 2019 2021 2023 2025 2027Table 13-1 lists forecast peak demand (prudent growth) at each grid exit point for theforecast period, as required for the Grid Reliability <strong>Report</strong>.Table 13-1: Forecast annual peak demand (MW) at Hawke’s Bay grid exit points to 2027Grid exit pointPowerfactorNext 5 yearsPeak demand (MW)5-15 years out<strong>2012</strong> 2013 2014 2015 2016 2017 2019 2021 2023 2025 2027Fernhill 0.95 60 61 62 63 64 5 67 68 70 72 73Gisborne 0.98 49 50 51 53 54 55 58 61 63 65 67Redclyffe 0.97 70 76 77 78 79 80 83 85 87 89 90Tuai 0.98 1 1 1 1 1 1 1 1 1 1 1Wairoa 0.90 10 10 10 11 11 11 11 12 12 13 13Whirinaki 1.00 82 82 82 82 82 82 82 82 82 82 82Whakatu 0.96 95 96 98 99 101 102 105 108 111 114 11613.4 Hawke’s Bay generationThe Hawke’s Bay region’s generation capacity is 325 MW, of which up to 170 MW 105is normally available.Generation from Tuai, Kaitawa, and Piripaua hydro generation stations arecollectively referred to as the Waikaremoana Hydro Scheme, and connect to the Tuai110 kV bus.Embedded within the Wairoa distribution system are two 2.5 MW Waihi generators.During periods of low load, Wairoa can export up to 1 MW into the 110 kVtransmission network.105 The Whirinaki generation station is for emergency dispatch during dry year conditions or asotherwise determined by the Electricity Authority. Therefore, this generator is not counted as part ofthe region’s normal generation.206<strong>2012</strong> <strong>Annual</strong> <strong>Planning</strong> <strong>Report</strong> © <strong>Transpower</strong> New Zealand Limited <strong>2012</strong>. All rights reserved.
Chapter 13: Hawke’s Bay RegionTable 13-2 lists the generation forecast at each grid injection point for the forecastperiod, as required for the Grid Reliability <strong>Report</strong>. This includes all known andcommitted generation stations including those embedded within the relevant locallines company’s network (Unison or Eastland Networks). 106Table 13-2: Forecast annual generation capacity (MW) at Hawke’s Bay grid injectionpoints to 2027 (including existing and committed generation)Grid injectionpoint (location ifembedded)Next 5 yearsGeneration capacity (MW)5-15 years out<strong>2012</strong> 2013 2014 2015 2016 2017 2019 2021 2023 2025 2027Gisborne 1 4 4 4 4 4 4 4 4 4 4 4Gisborne (Matawai) 2 2 2 2 2 2 2 2 2 2 2Kaitawa 36 36 36 36 36 36 36 36 36 36 36Piripaua 42 42 42 42 42 42 42 42 42 42 42Redclyffe(Ravensdown)8 8 8 8 8 8 8 8 8 8 8Tuai 60 60 60 60 60 60 60 60 60 60 60Wairoa (Waihi) 5 5 5 5 5 5 5 5 5 5 5Whirinaki 155 155 155 155 155 155 155 155 155 155 155Whirinaki (Pan Pac) 13 13 13 13 13 13 13 13 13 13 131. Mobile diesel units are situated in the Gisborne and Tokomaru Bay areas.13.5 Hawke’s Bay significant maintenance workOur capital project and maintenance works are integrated to enable system issues tobe resolved if possible when assets are replaced or refurbished. Table 13-3 lists thesignificant maintenance-related work 107 proposed for the Hawke’s Bay region for thenext 15 years that may significantly impact related system issues or connectedparties.Table 13-3: Proposed significant maintenance workDescriptionFernhill supply transformersexpected end-of-life, and33 kV outdoor to indoor conversionTuai supply transformer expectedend-of-lifeWairoa supply transformersexpected end-of-lifeWhakatu 33 kV outdoor to IndoorconversionWhirinaki 11 kV Bus B and Cswitchboard replacementTentativeyear2018-2020<strong>2012</strong>-2014Related system issuesThe forecast load at Fernhill already exceeds thetransformer n-1 winter capacity. See Section13.8.5 for more information.<strong>2012</strong>-2014 No n-1 security at Tuai. Future investment will becustomer driven. See Section 13.8.9 for moreinformation.2015-2017 The forecast load at Wairoa may exceedtransformer n-1 summer capacity for low load powerfactor. See 13.8.10 for more information.2014-2016 No system issues are identified within the forecastperiod.2023-2024 No system issues are identified within the forecastperiod.13.6 Future Hawke’s Bay projects summary and transmission configurationTable 13-4 lists the projects to be carried out in the Hawke’s Bay region within thenext 15 years.106 Only generators with a capacity greater than 1 MW are listed. Generation capacity is rounded to thenearest megawatt.107 This may include replacement of the asset due to its condition assessment.<strong>2012</strong> <strong>Annual</strong> <strong>Planning</strong> <strong>Report</strong> © <strong>Transpower</strong> New Zealand Limited <strong>2012</strong>. All rights reserved. 207
Chapter 13: Hawke’s Bay RegionFigure 13-4 shows the possible configuration of Hawke’s Bay transmission in 2027,with new assets, upgraded assets, and assets undergoing significant maintenancewithin the forecast period.Table 13-4: Projects in the Hawkes Bay region up to 2027Site Projects StatusFernhillReplace supply transformers.Convert 33 kV outdoor switchgear to an indoor switchboard.Base CapexBase CapexGisborne–Tuai Upgrade Gisborne–Tuai conductor capacity. PossibleGisborneRecalibrate supply transformers’ metering parameters.New 110 kV capacitor bank.Base CapexPossibleRedclyffe Replace supply transformers with two 120 MVA units. CommittedTuai Replace supply transformer. Base CapexWairoa Replace supply transformers. Base CapexWhakatu Convert 33 kV outdoor switchgear to an indoor switchboard. Base CapexWhirinaki Replace 11 kV Bus B and C switchboards. Base CapexFigure 13-4: Possible Hawke’s Bay transmission configuration in 2027Tokomaru BayCENTRAL NORTH ISLANDWairakei110 kV11 kVTuai*50 kVGisborne110 kV110 kV11 kVWairoa11 kVWhirinaki220 kVRedclyffe33 kV220 kV110 kV33 kVKEYFernhill33 kV220 kVWhakatuNEW ASSETSUPGRADED ASSETSASSETS SCHEDULEDFOR REPLACEMENT*MINOR UPGRADE110 kVWaipawaCENTRAL NORTH ISLAND13.7 Changes since the 2011 <strong>Annual</strong> <strong>Planning</strong> <strong>Report</strong>Table 13-5 lists the specific issues that are either new or no longer relevant within theforecast period when compared to last year's report.208<strong>2012</strong> <strong>Annual</strong> <strong>Planning</strong> <strong>Report</strong> © <strong>Transpower</strong> New Zealand Limited <strong>2012</strong>. All rights reserved.
Chapter 13: Hawke’s Bay RegionTable 13-5: Changes since 2011IssuesGisborne supply capacityRedclyffe 110 kV transmission securityWhakatu supply transformer capacityChangeNew issue.Removed. Project to install Redclyffe 110 kV buscoupler and protection upgrade completed.New Issue.13.8 Hawke’s Bay transmission capabilityTable 13-6 summarises the issues involving the Hawke’s Bay region for the next 15years. For more information about a particular issue, refer to the listed sectionnumber.Table 13-6: Hawke’s Bay region transmission issuesSectionnumberIssueRegional13.8.1 Hawke’s Bay voltage quality13.8.2 Fernhill–Redclyffe 110 kV transmission capacity13.8.3 Redclyffe–Tuai 110 kV transmission capacity13.8.4 Redclyffe interconnecting transformer capacitySite by grid exit point13.8.5 Fernhill supply transformer capacity13.8.6 Gisborne 110 kV voltage quality13.8.7 Gisborne supply capacity13.8.8 Redclyffe supply transformer capacity13.8.9 Tuai supply security13.8.10 Wairoa supply transformer capacity13.8.11 Whakatu supply transformer capacity13.8.1 Hawke’s Bay voltage qualityProject status/purpose:This issue is for information onlyIssueThe Hawke’s Bay transmission network is primarily supplied from the 220 kVRedclyffe bus, which is in turn supplied from the grid backbone by two 220 kV circuitsfrom Wairakei. The 138 MW Waikaremoana hydro scheme connects to the 110 kVnetwork, which also supplies the region’s load.The loss of a 220 kV circuit at high load and minimal Waikaremoana generation canresult in low voltages at the:110 kV bus at Gisborne, and the issue progressively arises at other high voltagebuses as load increases, andsupply buses at Fernhill and Redclyffe, which do not have on-load tap changersSolutionThe low voltage risk is managed operationally by constraining-on generators atWaikaremoana so that the generators’ reactive support is available. As the Hawke’sBay load increases, a 220 kV circuit outage will require more Waikaremoanagenerators to be in service for reactive support.<strong>2012</strong> <strong>Annual</strong> <strong>Planning</strong> <strong>Report</strong> © <strong>Transpower</strong> New Zealand Limited <strong>2012</strong>. All rights reserved. 209
Chapter 13: Hawke’s Bay RegionWe are in discussions with Unison about the supply transformer replacement 108 atFernhill and Redclyffe. Replacing these transformers with on-load tap changingtransformers will resolve low voltages on the Fernhill and Redclyffe supply buses.We consider the issue can be resolved operationally within the forecast period.13.8.2 Fernhill–Redclyffe 110 kV transmission capacityProject status/purpose:This issue is for information onlyIssueThere are two 110 kV Fernhill–Redclyffe circuits, each rated at 51/62 MVA(summer/winter). During periods of high load and low Tuai generation, power flowsfrom Redclyffe to Tuai via the 110 kV:Redclyffe–Tuai circuits, andFernhill–Redclyffe circuits and Fernhill–Tuai circuit (as per the blue load arrows inFigure 13-5).In these situations, an outage of one Fernhill–Redclyffe circuit can overload the othercircuit.Figure 13-5: Power flow from Redclyffe to Tuai during high load and low Tuai generation110 kVTuai110 kVGisborne110 kVWairoaRedclyffe110 kV220 kVFernhill 110 kVSolutionOptions to relieve a remaining Fernhill–Redclyffe circuit from overloading include:constraining-on the Waikaremoana hydro generation with a minimum value thatcontrols the Fernhill–Redclyffe circuit power flows. Minimum generation for the<strong>2012</strong> winter peak is approximately 19 MW, increasing to approximately 52 MW in2027.unbonding the 110 kV Fernhill–Tuai circuits. This increases the impedance of theRedclyffe–Fernhill–Tuai path and reduces the power flow through the Fernhill–Redclyffe circuits. This option does not eliminate the requirement to constrain-onWaikaremoana generation but does reduce the level of minimum generation.108 The supply transformers at Fernhill and Redclyffe have an expected end-of-life within the next 10years and are scheduled for replacement within the next 5-10 years.210<strong>2012</strong> <strong>Annual</strong> <strong>Planning</strong> <strong>Report</strong> © <strong>Transpower</strong> New Zealand Limited <strong>2012</strong>. All rights reserved.
Chapter 13: Hawke’s Bay RegionThe initial application of the Investment Test indicates that the project to unbond theFernhill–Tuai circuit is not economically beneficial within the forecast period. Theestimated generation and demand growth in the region shows that this option is morelikely to have an economic benefit beyond the forecast period.13.8.3 Redclyffe–Tuai 110 kV transmission capacityProject status/purpose:This issue is for information onlyIssueThere are two 110kV Redclyffe–Tuai circuits, each rated at 57/70 MVA(summer/winter). During periods of low load and high Tuai generation, power flowsfrom Tuai to Redclyffe (as per the blue load arrows in Figure 13-6) via the 110 kV:Redclyffe–Tuai circuits, andFernhill–Tuai circuit.In these situations, an outage of the Fernhill–Tuai circuit can overload bothRedclyffe–Tuai circuits.Figure 13-6: Power flow from Tuai to Redclyffe during low load and high Tuai generation110 kVTuai110 kVGisborne110 kVWairoaRedclyffe110 kV220 kVFernhill110 kVSolutionThe 110 kV Redclyffe–Tuai circuit constraints are managed operationally by limitingthe maximum Waikaremoana hydro scheme generation.We consider the issue can be resolved operationally for the forecast period.13.8.4 Redclyffe interconnecting transformer capacityProject status/purpose:This issue is for information onlyIssueTwo 220/110 kV interconnecting transformers at Redclyffe supply the majority of theHawke’s Bay load (except the load at Whirinaki and Whakatu, which is supplied fromthe 220 kV transmission system). The transformers provide:<strong>2012</strong> <strong>Annual</strong> <strong>Planning</strong> <strong>Report</strong> © <strong>Transpower</strong> New Zealand Limited <strong>2012</strong>. All rights reserved. 211
Chapter 13: Hawke’s Bay Regiona nominal installed capacity of 160 MVA, andn-1 capacity of 114/120 MVA (summer/winter).An outage of either interconnecting transformer will overload the remainingtransformer during periods of:high load and minimal Waikaremoana generation, orlow load and high Waikaremoana generation.The peak 110 kV load is forecast to exceed the transformers’ n-1 winter capacity byapproximately 34 MW in <strong>2012</strong>, increasing to approximately 67 MW in 2027 (seeTable 13-7). The forecast assumes minimal Waikaremoana generation of 12 MW.Table 13-7: Redclyffe 220/110 kV transformer overload forecastGrid exit pointNext 5 yearsTransformer overload (MW)5-15 years out<strong>2012</strong> 2013 2014 2015 2016 2017 2019 2021 2023 2025 2027Redclyffe 34 37 38 42 45 47 52 57 61 64 67SolutionThe overload is presently managed operationally by transferring load (within Unison’snetwork) from the 110 kV transmission network to the 220 kV transmission network,and by constraining-on generation at Waikaremoana. As the Hawke’s Bay loadcontinues to grow, more Waikaremoana generation will need to be constrained-onmore frequently during an outage of an interconnecting transformer at Redclyffe.The application of the Investment Test shows that installing a third 220/110 kVtransformer or replacing the existing transformers with higher-rated units isuneconomic at present. The transformer loading can be managed operationally.13.8.5 Fernhill supply transformer capacityProject reference: FHL-POW_TFR-REPL-01Project status/purpose: Base Capex, replacementIndicative timing: 2018-2020Indicative cost band: AIssueTwo 110/33 kV transformers (rated at 30 MVA and 50 MVA) supply Fernhill’s load,providing:a nominal installed capacity of 80 MVA, andn-1 capacity of 35/35 MVA 109 (summer/winter).The peak load at Fernhill already exceeds the transformers’ n-1 winter capacity byapproximately 29 MW, and the overload is forecast to increase to approximately42 MW in 2027 (see Table 13-8).Table 13-8: Fernhill supply transformer overload forecastGrid exitpointPowerfactorNext 5 yearsTransformer overload (MW)5-15 years out<strong>2012</strong> 2013 2014 2015 2016 2017 2019 2021 2023 2025 2027Fernhill 0.95 29 29 30 31 32 33 35 37 39 40 42109 The transformers’ capacity is limited by the rating of the 33 kV overhead bus and LV bushings limits;with these limits resolved, the n-1 capacity will be 42/45 MVA (summer/winter).212<strong>2012</strong> <strong>Annual</strong> <strong>Planning</strong> <strong>Report</strong> © <strong>Transpower</strong> New Zealand Limited <strong>2012</strong>. All rights reserved.
Chapter 13: Hawke’s Bay RegionSolutionThe short-term operational solution is load transfer within the Unison networkfollowing a transformer outage.We have discussed with Unison the possible longer-term solutions, which includereplacing the 30 MVA transformer with an 80 MVA transformer.Both the existing single-phase supply transformers at Fernhill will approach theirexpected end-of-life within the next 5-10 years. In addition, we also plan to convertthe Fernhill 33 kV outdoor switchgear to an indoor switchboard within the next fiveyears.We will discuss with Unison the future supply options as well as the coordination ofthe transformer capacity upgrade with the transformer replacement work.13.8.6 Gisborne 110 kV voltage qualityProject status/purpose:This issue is for information onlyIssueThe Gisborne 110 kV bus voltage can fall below 99 kV when either one of theGisborne–Tuai 1 or 2 circuits is out of service, especially during high load, lowgeneration periods.SolutionThe short-term operational solutions are:for planned outages, dispatch the Waikaremoana hydro station to raise the local110 kV bus voltage to 116 kV (this is not a preferred long-term solution as it limitsthe maximum active power generation), orraise the 110 kV voltage at Redclyffe.A possible longer-term option includes installing additional 10 to 20 Mvar capacitorsat Gisborne.13.8.7 Gisborne supply capacityProject reference: Line capacity: GIS_TUI-TRAN-EHMT-01Transformer capacity: GIS-POW_TFR-EHMT-01Project status/purpose: Line capacity: possible, customer-specificTransformer capacity: Base Capex, minor enhancementIndicative timing: Line capacity: 2015Transformer capacity: 2023Indicative cost band: Line capacity: to be advisedTransformer capacity: AIssueThe Gisborne load is supplied by:two 110 kV circuits, each rated at 48/59 MVA (summer/winter) from Tuai, andtwo 110/50 kV transformers, providing:• a nominal installed capacity of 120 MVA, and• n-1 capacity of 63/63 MVA110 (summer/winter).The peak load at Gisborne is forecast to exceed the:110 The transformers’ capacity is limited by the metering equipment; with these limits resolved, the n-1capacity will be 73/77 MVA (summer/winter).<strong>2012</strong> <strong>Annual</strong> <strong>Planning</strong> <strong>Report</strong> © <strong>Transpower</strong> New Zealand Limited <strong>2012</strong>. All rights reserved. 213
Chapter 13: Hawke’s Bay Regioncircuits’ n-1 capacity from 2015, andtransformers’ n-1 winter capacity by 2 MW in 2023, increasing to approximately 6MW in 2027 (see Table 13-9).Table 13-9: Gisborne supply transformer overload forecastGrid exitpointPowerfactorNext 5 yearsTransformer overload (MW)5-15 years out<strong>2012</strong> 2013 2014 2015 2016 2017 2019 2021 2023 2025 2027Gisborne 0.98 0 0 0 0 0 0 0 0 2 4 6SolutionA short-term solution is to manage the load at Gisborne to within the circuits’ orsupply transformers’ n-1 capacity.A possible longer-term solution includes:thermally upgrade, or reconductor part or all of both Gisborne–Tuai circuits, andrecalibrating the supply transformers’ metering parameters, which will resolve theoverloading issue for the forecast period and beyond.13.8.8 Redclyffe supply transformer capacityProject reference: RDF-POW_TFR-EHMT-01Project status/purpose: Committed, customer-specificIndicative timing: Q3 2013Indicative cost band: BIssueTwo 110/33 kV transformers (rated at 40 MVA and 50 MVA) supply Redclyffe’s load,providing:a nominal installed capacity of 90 MVA, andn-1 capacity of 43/43 MVA 111 (summer/winter).The peak load at Redclyffe already exceeds the transformers’ n-1 winter capacity byapproximately 27 MW, and the overload is forecast to increase to approximately47 MW in 2027 (see Table 13-10).Table 13-10: Redclyffe supply transformer overload forecastGrid exitpointPowerfactorNext 5 yearsTransformer overload (MW)5-15 years out<strong>2012</strong> 2013 2014 2015 2016 2017 2019 2021 2023 2025 2027Redclyffe 0.97 27 33 34 35 36 37 40 42 44 46 47SolutionWe have entered into an agreement with Unison to replace the existing transformerswith two 120 MVA transformers that will provide a secure supply within the forecastperiod and beyond.13.8.9 Tuai supply securityProject status/purpose:This issue is for information only111 The transformers’ capacity is limited by LV circuit breaker and disconnector limits, followed byprotection and LV bushing limits of 48 MVA; with these limits resolved, the n-1 capacity will be 49/53MVA (summer/winter).214<strong>2012</strong> <strong>Annual</strong> <strong>Planning</strong> <strong>Report</strong> © <strong>Transpower</strong> New Zealand Limited <strong>2012</strong>. All rights reserved.
Chapter 13: Hawke’s Bay RegionIssueA single 110/11 kV, 2.2 MVA transformer supplies load at Tuai, resulting in no n-1security. This transformer is also approaching its expected end-of-life within the nextfive years.SolutionThe lack of n-1 security can be managed operationally. However, we will discusswith Eastland Network Limited the options for increasing security and coordinatingoutages to minimise supply interruptions when replacing this transformer.13.8.10 Wairoa supply transformer capacityProject status/purpose:This issue is for information onlyIssueTwo 110/11 kV transformers supply Wairoa‘s load, providing:a nominal installed capacity of 20 MVA, andn-1 capacity of 11/12 MVA (summer/winter).An outage of one transformer will cause the remaining transformer to exceed its n-1summer capacity by 1 MW in 2015, increasing to 3 MW in 2027 (see Table 13-11).Table 13-11: Wairoa supply transformer overload forecastGrid exitpointPowerfactorNext 5 yearsTransformer overload (MW)5-15 years out<strong>2012</strong> 2013 2014 2015 2016 2017 2019 2021 2023 2025 2027Wairoa 0.90 0 0 0 1 1 1 1 2 2 2 3SolutionEastland Network Limited can manage the issue operationally.Both Wairoa supply transformers are approaching their expected end-of-life within thenext five years. We will discuss with Eastland Network the appropriate timing andcapacity for the replacement transformers.Future investment will be customer driven.13.8.11 Whakatu supply transformer capacityProject status/purpose:This issue is for information onlyIssueTwo 220/33 kV transformers supply Whakatu‘s load, providing:a nominal installed capacity of 200 MVA, andn-1 capacity of 116/121 MVA (summer/winter).An outage of one transformer will cause the remaining transformer to exceed its n-1winter capacity by 3 MW in 2021, increasing to 11 MW in 2027 (see<strong>2012</strong> <strong>Annual</strong> <strong>Planning</strong> <strong>Report</strong> © <strong>Transpower</strong> New Zealand Limited <strong>2012</strong>. All rights reserved. 215
Chapter 13: Hawke’s Bay RegionTable 13-12).216<strong>2012</strong> <strong>Annual</strong> <strong>Planning</strong> <strong>Report</strong> © <strong>Transpower</strong> New Zealand Limited <strong>2012</strong>. All rights reserved.
Chapter 13: Hawke’s Bay RegionTable 13-12: Whakatu supply transformer overload forecastGrid exitpointPowerfactorNext 5 yearsTransformer overload (MW)5-15 years out<strong>2012</strong> 2013 2014 2015 2016 2017 2019 2021 2023 2025 2027Whakatu 0.96 0 0 0 0 0 0 0 3 6 9 11SolutionUnison can shift load between the Whakatu and Fernhill grid exit points.In addition, we are planning to convert the Whakatu 33 kV outdoor switchgear to anindoor switchboard within the next five years.Any future investment will be customer driven.13.9 Other regional items of interestThere are no other items of interest identified to date beyond those set out inSection 13.8. See Section 13.10 for information about generation proposals relevantto this region.13.10 Hawke’s Bay generation proposals and opportunitiesThis section details relevant regional issues for selected generation proposals underinvestigation by developers and in the public domain, or other generationopportunities.The maximum generation that can be connected at any substation depends onseveral factors and usually falls within a range. Generation developers shouldconsult with us at an early stage of their investigations to discuss connection issues.See our website for more information about connecting generation. 11213.10.1 Maximum regional generationAll generation in excess of the load is exported from the Hawke’s Bay region over the220 kV double-circuit line from Redclyffe to Wairakei. Each circuit is rated at478/583 MVA (summer/winter, subject to replacing some substation equipment), andthere is scope for thermally upgrading the circuits to approximately 690/760 MVA(summer/winter). Additional reactive power sources such as capacitors may berequired as these circuits are relatively long (137 kilometres), and they absorbreactive power when highly loaded.Generation connected to grid exit points on the 110 kV network in the Hawke’s Bayregion is exported via the Redclyffe interconnecting transformers. Eachinterconnecting transformer has a 24-hour post-contingency rating of 114/120 MVA(summer/winter).Estimates for maximum generation assume a North Island light load profile, andassume existing generation is high (Waikaremoana is generating 139 MW).For generation connected at the Redclyffe 220 kV bus, the maximum generation thatcan be injected under n-1 is approximately 500 MW, or approximately 550 MW if the220 kV circuit protection constraints are removed. The constraint is due to anoverload of the 220 kV Redclyffe–Wairakei circuit when the 220 kV Whirinaki–Wairakei circuit is out of service.For generation connected at the Redclyffe 110 kV bus, the maximum generation thatcan be injected under n-1 is approximately 30 MW. The constraint is due to an112 http://www.transpower.co.nz/connecting-new-generation.<strong>2012</strong> <strong>Annual</strong> <strong>Planning</strong> <strong>Report</strong> © <strong>Transpower</strong> New Zealand Limited <strong>2012</strong>. All rights reserved. 217
Chapter 13: Hawke’s Bay Regionoverload of the Redclyffe interconnecting transformer when the other interconnectingtransformer is out of service.13.10.2 Titiokura and Hawke’s Bay wind stations, and Tauhara geothermal stationMaungaharuru wind generation station (formerly known as Titiokura, and Hawke’sBay wind farms) is approximately 27 km from Whirinaki, with a capacity of up toapproximately 330 MW. A 220 kV double-circuit line traverses the site, and is themain supply to the Hawke’s Bay area from Wairakei.The proposed Tauhara geothermal power station in the Central North Island regionalso connects to one of the 220 kV circuits to Wairakei.There are no issues with connecting the wind and geothermal generation into thesame 220 kV circuits to Wairakei (see Chapter 11, Section 11.10.2).13.10.3 Additional generation connected to the 110 kV networkThere are a number of potential wind and hydro generation prospects that mayconnect into one or more of the 110 kV circuits in the region.The impact new generation has on circuit loading depends on the connection’slocation and configuration. For some connection locations and configurations,altering the hydro generation at Tuai removes the circuit overloads, although this mayadversely impact the energy market. To increase transmission capacity, the circuitswill need to be reconductored and/or the Fernhill–Tuai circuit unbonded.The Redclyffe 220/110 kV interconnecting transformer capacity may also need to beincreased to avoid overloading when there is high generation and low load, as powerflows from the 110 kV transmission network into the 220 kV transmission network.218<strong>2012</strong> <strong>Annual</strong> <strong>Planning</strong> <strong>Report</strong> © <strong>Transpower</strong> New Zealand Limited <strong>2012</strong>. All rights reserved.
Chapter 14: Wellington Region14 Wellington Regional Plan14.1 Regional overview14.2 Wellington transmission system14.3 Wellington demand14.4 Wellington generation14.5 Wellington significant maintenance work14.6 Future Wellington projects summary and transmission configuration14.7 Changes since the 2011 <strong>Annual</strong> <strong>Planning</strong> <strong>Report</strong>14.8 Wellington transmission capability14.9 Other regional items of interest14.10 Wellington generation proposals and opportunities14.1 Regional overviewThis chapter details the Wellington regional transmission plan. We base this regionalplan on an assessment of available data, and welcome feedback to improve its valueto all stakeholders.Figure 14-1: Wellington region<strong>2012</strong> <strong>Annual</strong> <strong>Planning</strong> <strong>Report</strong> © <strong>Transpower</strong> New Zealand Limited <strong>2012</strong>. All rights reserved. 219
Chapter 14: Wellington RegionThe Wellington region is the major load centre (comprising both residential andcentral business district loads) of the southern North Island. Other than the maincities making up the greater Wellington region, the area also covers the rural servicecentres, particularly in the Wairarapa.We have assessed the Wellington region’s transmission needs over the next 15 yearswhile considering longer-term development opportunities. Specifically, thetransmission network needs to be flexible to respond to a range of future service andtechnology possibilities, taking into consideration:the existing transmission networkforecast demandforecast generationequipment replacement based on condition assessment, andpossible technological development.14.2 Wellington transmission systemThis section highlights the state of the Wellington regional transmission network. Theexisting transmission network is set out geographically inFigure 14-1 and schematically in Figure 14-2.Figure 14-2: Wellington transmission schematicCENTRAL NORTH ISLANDMangahaoBunnythorpeParaparaumu110 kV33 kVCENTRAL NORTH ISLANDMangamaire110 kV33 kVPauatahanui33 kV110 kV110 kVMasterton33 kV110 kVGreytownUpper Hutt33 kV110 kVTakapuRoad33 kV220 kVSCSCHVDCSCSCHaywards110 kVSC SC SC SC11 kV220 kV33 kVWilton110 kVKaiwharawhara Melling11 kV33 kV11 kVGracefield 33 kV110 kV11 kVCentral Park33 kVKEY220kV CIRCUIT110kV CIRCUITSUBSTATION BUSTRANSFORMERTEE POINTLOADCAPACITORUNDERGROUND CABLE3 WDG TRANSFORMERSCSYNCH CONDENSORWest Wind33 kVHVDCREACTORHVDC LINK14.2.1 Transmission into the regionThe Wellington region is connected to the rest of the National Grid through 220 kVcircuits from Bunnythorpe and the HVDC inter-island link. It is a main corridor forthrough transmission between the North and South Islands. The loading of the220<strong>2012</strong> <strong>Annual</strong> <strong>Planning</strong> <strong>Report</strong> © <strong>Transpower</strong> New Zealand Limited <strong>2012</strong>. All rights reserved.
Chapter 14: Wellington Regioncircuits in the main corridor depends largely on HVDC power flow from the SouthIsland, and generation from the Central North Island.The North Island terminal of the HVDC link is at Haywards. The HVDC link cantransfer up to 666 MW to the South Island (this value highly depends on the load andgeneration in the Wellington region), and receive up to 700 MW from the South Island(with a 200 MW emergency capacity with pole 1B). We are carrying out a project toreplace Pole 1 of the inter-island HVDC link with a new pole in <strong>2012</strong>. The new pole(Pole 3), together with the existing Pole 2, will increase the capacity of the overallHVDC link to 1,000 MW from <strong>2012</strong>, and 1,200 MW from 2014. Once Pole 3 is built,Pole 1 will be fully decommissioned and removed.The Wellington region’s generation capacity is much lower than the local load,requiring power to be imported into the region.14.2.2 Transmission within the regionThe region has some of the higher load densities in the North Island, coupled withrelatively low levels of local generation.Transmission within the Wellington region comprises:220 kV circuits entering the region from Bunnythorpe110 kV circuits entering the region from MangamaireHVDC link supporting the 220 kV transmission network at Haywards, andinterconnecting transformers located at Haywards and Wilton.The <strong>2012</strong> Wellington regional plan considers the transmission network fromDecember <strong>2012</strong> onwards, when the HVDC link will comprise Pole 2 and Pole 3.The reactive support in the region is mainly provided from the Haywards substation,and some contribution from the West Wind generation station.14.2.3 Longer-term development pathIt is expected that no new major transmission lines will be required into the Wellingtonregion. However, reconductoring of some existing lines for increased capacity maybe required, depending on future generation developments within or outside theregion.Within the region, it is possible that additional circuit(s) and/or a new substation maybe required for increased security to Wellington city, if this is shown to beeconomically justified.In addition, there will be incremental upgrades within existing substations to increasesecurity of supply within the region, particularly to Wellington city.14.3 Wellington demandThe after diversity maximum demand (ADMD) for the Wellington region is forecast togrow on average by 1.4% annually over the next 15 years, from 756 MW in <strong>2012</strong> to934 MW by 2027. This is lower than the national average demand growth of 1.7%annually.Figure 14-3 shows a comparison of the 2011 and <strong>2012</strong> forecast 15-year maximumdemand (after diversity 113 ) for the Wellington region. The forecasts are derived usinghistorical data, and modified to account for customer information, where appropriate.The power factor at each grid exit point is also derived from historical data, and is113 The after diversity maximum demand (ADMD) for the region will be less than the sum of theindividual grid exit point peak demands, as it takes into account the fact that the peak demand doesnot occur simultaneously at all the grid exit points in the region.<strong>2012</strong> <strong>Annual</strong> <strong>Planning</strong> <strong>Report</strong> © <strong>Transpower</strong> New Zealand Limited <strong>2012</strong>. All rights reserved. 221
Chapter 14: Wellington Regionused to calculate the real power capacity for power transformer and transmission line.See Chapter 4 for more information about demand forecasting.Figure 14-3: Wellington region after diversity maximum demand forecastLoad (MW)1000Wellington9008007006005004002011 APR Forecast300<strong>2012</strong> APR ForecastActual Peak2001997 1999 2001 2003 2005 2007 2009 2011 2013 2015 2017 2019 2021 2023 2025 2027Table 14-1 lists the peak demand forecast (prudent growth) at each grid exit point forthe forecast period, as required for the Grid Reliability <strong>Report</strong>.Table 14-1: Forecast annual peak demand (MW) for Wellington grid exit points to 2027Grid exit pointPowerfactorNext 5 yearsPeak demand (MW)5-15 years out<strong>2012</strong> 2013 2014 2015 2016 2017 2019 2021 2023 2025 2027Central Park 11 kV 0.98 27 33 33 34 34 35 36 37 38 39 40Central Park 33 kV 0.98 175 174 177 181 184 188 196 203 209 216 220Gracefield 0.98 60 61 62 64 65 66 69 71 74 76 77Greytown 1 0.93 16 17 17 17 18 18 19 20 20 21 21Haywards 11 kV 0.99 23 24 24 24 25 25 26 27 28 29 30Haywards 33 kV 0.98 20 20 21 21 22 22 23 24 25 25 26Kaiwharawhara 0.97 43 44 45 46 47 48 50 52 53 55 56Masterton 1 0.97 51 52 53 54 55 56 59 61 63 64 66Melling 11 kV 0.98 30 31 31 32 33 33 35 36 37 38 39Melling 33 kV 0.99 50 51 52 53 54 55 57 60 61 63 64Pauatahanui 0.98 23 24 24 25 25 26 26 27 28 29 30Paraparaumu 0.98 68 69 70 71 71 72 74 76 77 79 81Takapu Road 0.99 103 105 107 110 112 114 119 123 128 132 137Upper Hutt 0.99 37 37 38 38 39 40 41 42 43 44 45Wilton 0.99 65 66 68 69 70 72 75 77 80 82 841. Customer expects strong growth in demand at the Greytown and Masterton grid exit points.222<strong>2012</strong> <strong>Annual</strong> <strong>Planning</strong> <strong>Report</strong> © <strong>Transpower</strong> New Zealand Limited <strong>2012</strong>. All rights reserved.
Chapter 14: Wellington Region14.4 Wellington generationThe Wellington region’s generation capacity is 165 MW, which is much lower than thelocal load. Most of the generation capacity is from wind stations, the largest beingWest Wind at 143 MW.Table 14-2 lists the generation forecast for each grid injection point for the forecastperiod, as required for the Grid Reliability <strong>Report</strong>. This includes all known andcommitted generation stations, including those embedded within the relevant locallines company’s network (Wellington Electricity Lines Limited, Powerco, andElectra). 114No new generation is known to be committed in the Wellington region for the forecastperiod.Table 14-2: Forecast annual generation capacity (MW) for Wellington grid injectionpoints to 2027 (including existing and committed generation)Grid injection point(location ifembedded)Central Park(Southern Landfill)Central Park(Wellington Hospital)Next 5 yearsGeneration capacity (MW)5-15 years out<strong>2012</strong> 2013 2014 2015 2016 2017 2019 2021 2023 2025 20271 1 1 1 1 1 1 1 1 1 18 8 8 8 8 8 8 8 8 8 8Greytown (Hau Nui) 9 9 9 9 9 9 9 9 9 9 9Masterton(Kourarau A and B)Haywards(Silverstream)1 1 1 1 1 1 1 1 1 1 13 3 3 3 3 3 3 3 3 3 3West Wind 143 143 143 143 143 143 143 143 143 143 143HVDC – Haywards220 kV 1 HVDCNorth Transfer1000 1000 1200 1200 1200 1200 1200 1200 1200 1200 12001. The fourth cable may be installed after 2017 as an additional stage in the HVDC development,increasing the HVDC link capacity to 1,400 MW.14.5 Wellington significant maintenance workOur capital project and maintenance works are integrated to enable system issues tobe resolved if possible when assets are replaced or refurbished. Table 14-3 lists thesignificant maintenance-related work 115 proposed for the Wellington region for thenext 15 years that may significantly impact related system issues or connectedparties.Table 14-3: Proposed significant maintenance workDescriptionCentral Park 110/33 kV supplytransformers expected end-oflifeCentral Park–Wilton 2 and 3circuits reconductoringGracefield 33 kV switchgearreplacementTentative year Related system issues<strong>2012</strong>-2014 The option to replace or to extend the existingtransformers’ operational lives is under investigation.See Section 14.8.2 for more information.2018-2019 Maintenance work. See Section 14.9.1 for moreinformation.2018-2019 No system issues are identified within the forecastperiod.114 Only generators with capacity greater than 1 MW are listed. Generation capacity is rounded to thenearest megawatt.115 This may include replacement of the asset due to its condition assessment.<strong>2012</strong> <strong>Annual</strong> <strong>Planning</strong> <strong>Report</strong> © <strong>Transpower</strong> New Zealand Limited <strong>2012</strong>. All rights reserved. 223
Chapter 14: Wellington RegionDescriptionGreytown 33 kV outdoor toindoor conversionTentative year Related system issues2019-2021 Resolving the metering and protection limits will solvethe transformers’ n-1 capacity issue for the forecastperiod. See Section 14.8.3 for more information.Haywards supply transformersexpected end-of-life, and33 kV outdoor to indoorconversion2013-20152015-2017The forecast loads connected at 33 kV and 11 kVbuses will exceed the transformers’ capacity from<strong>2012</strong>. See Section 14.8.4 for more information.Mangahao–Paraparaumucircuits reconductoringMasterton supply transformersexpected end-of-lifeMelling 110/33 kV supplytransformers expected end-oflifePauatahanui supply transformerT1 expected end-of-lifeTakapu Road outdoor to indoorconversionUpper Hutt supply transformersexpected end-of-life, and33 kV outdoor to indoorconversionWilton 110 kV busrationalisation, and 33 kVoutdoor to indoor conversion2017-2018 Permanent system split at Paraparaumu. SeeSection14.8.8 for more information.2011-2013 A project is underway to replace the transformers withtwo higher-rated units. See Section 14.8.6 for moreinformation.2020-2023 The forecast load will exceed the transformer’s n-1capacity from 2022 (assuming the metering limit isresolved). See Section 14.8.7 for more information.2019-2020 The forecast load will exceed the transformers' n-1capacity from <strong>2012</strong>. See Section 14.8.9 for moreinformation.<strong>2012</strong>-2014 Resolving the protection and metering limits will solvethe transformers’ n-1 capacity until 2014. See Section14.8.10 for more information.2027-20282013-2015<strong>2012</strong>-20142013-2015Resolving the protection and metering limits will solvethe transformer’s n-1 capacity for the forecast period.See Section 14.8.11 for more information.See Section 14.8.12 for more information.14.6 Future Wellington projects summary and transmission configurationTable 14-4 lists projects to be carried out in the Wellington region within the next 15years.Figure 14-4 shows the possible configuration of Wellington transmission in 2027, withnew assets, upgraded assets, and assets undergoing significant maintenance withinthe forecast period.Table 14-4: Projects in the Wellington region up to 2027Site Projects StatusCentral Park Replace 110/33 kV supply transformers. Base CapexCentral Park–WiltonReconductor Central Park–Wilton 2 and 3 circuits.Base CapexGracefield Replace 33 kV switchgear. Base CapexGreytownIncrease metering and protection limits on the supply transformers.Convert 33 kV outdoor switchgear to an indoor switchboard.Haywards HVDC Pole 3.Replace all Haywards supply transformers with two 110/33/11 kV units.Mangahao–ParaparaumuReconductor Mangahao–Paraparaumu circuits.Base CapexBase CapexCommittedBase CapexBase CapexMasterton Replace existing supply transformer with two higher-rated units. CommittedMellingParaparaumuIncrease metering and protection limits on the 110/33 kV and 110/11 kVsupply transformers, respectively.Replace 110/33 kV supply transformer.Install capacitors on the Paraparaumu 33 kV bus, an additional supplytransformer(s) at Paraparaumu, or a new grid exit point.Base CapexBase CapexPossiblePauatahanui Replace supply transformer T1. Base Capex224<strong>2012</strong> <strong>Annual</strong> <strong>Planning</strong> <strong>Report</strong> © <strong>Transpower</strong> New Zealand Limited <strong>2012</strong>. All rights reserved.
Chapter 14: Wellington RegionSite Projects StatusTakapu RoadUpper HuttWiltonResolve protection and metering limits on the supply transformers.Convert 33 kV outdoor switchgear to an indoor switchboard.Replace existing supply transformers with higher-rated units.Resolve protection and metering limits on the supply transformersReplace supply transformer.Convert 33 kV outdoor switchgear to an indoor switchboard.110 kV bus rationalisation.Convert 33 kV outdoor switchgear to an indoor switchboard.Resolve protection limits on the supply transformersInstall a new 220/110 kV interconnecting transformer.Base CapexBase CapexPossibleBase CapexBase CapexBase CapexBase CapexBase CapexBase CapexPossibleFigure 14-4: Possible Wellington transmission configuration in 2027CENTRAL NORTH ISLANDMangahaoOtakiBunnythorpe33 kVParaparaumu33 kV110 kV(1)CENTRAL NORTH ISLANDMangamaire110 kVPauatahanui33 kV110 kV110 kV*33 kV33 kVMasterton110 kVGreytown*Upper Hutt33 kV220 kV33 kVWilton*(2)110 kV110 kVTakapuRoadKaiwharawhara11 kV11 kV33 kVMelling33 kVCentral Park220 kV11 kVGracefield*SCSC SCSTCSCSC SC110 kVSTC110 kV33 kVHVDCSC SCHVDCHaywards11 kV33 kV110 kVKEYNEW ASSETSUPGRADED ASSETSASSETS SCHEDULEDFOR REPLACEMENTMINOR UPGRADE*(1) The transmission backbone section identifies twopossible development paths for the lower North Island:- upgrade existing lines, and- new transmission lineAlthough this diagram shows upgrading of the existinglines, it is not intended to indicate a preference as bothoptions are still being investigated.West Wind33 kV(2) Although this diagram shows the new Wellingtoninterconnecting transformer at Wilton, it is notintended to indicate a preference as various optionsare still being investigated.14.7 Changes since the 2011 <strong>Annual</strong> <strong>Planning</strong> <strong>Report</strong>Table 14-5 lists the specific issues that are either new or no longer relevant within theforecast period when compared to last year's report.Table 14-5: Changes since 2011IssueGreytown supply transformer capacityHaywards–Melling transmission capacityChangeNew issue.New issue.<strong>2012</strong> <strong>Annual</strong> <strong>Planning</strong> <strong>Report</strong> © <strong>Transpower</strong> New Zealand Limited <strong>2012</strong>. All rights reserved. 225
Chapter 14: Wellington Region14.8 Wellington transmission capabilityTable 14-6 summarises issues involving the Wellington region for the next 15 years.For more information about a particular issue, refer to the listed section number.Table 14-6: Wellington region transmission issuesSectionnumberIssueRegional14.8.1 Wellington regional transmission securitySite by grid exit point14.8.2 Central Park supply transformer capacity14.8.3 Greytown supply transformer capacity14.8.4 Haywards supply transformer capacity and security14.8.5 Kaiwharawhara supply capacity and security14.8.6 Masterton supply transformer capacity14.8.7 Melling supply capacity14.8.8 Paraparaumu transmission security and supply transformer capacity14.8.9 Pauatahanui supply transformer capacity14.8.10 Takapu Road supply transformer capacity14.8.11 Upper Hutt supply transformer capacity14.8.12 Wilton supply transformer capacity14.8.1 Wellington regional transmission securityProject reference: WIL-POW_TFR-DEV-03Project status/purpose: Possible, to meet the Grid Reliability Standard (core grid)Indicative timing: 2015-2020Indicative cost band: BIssueThe Wellington 110 kV transmission network is predominantly supplied by220/110 kV interconnecting transformers, with three transformers at Haywards andone transformer at Wilton.The three Haywards transformers have:a nominal installed capacity of 600 MVA, andn-1 capacity of 465/486 MVA (summer/winter).The Wilton transformer has:a nominal installed capacity of 250 MVA, andn-1 capacity of 293/306 MVA (summer/winter)The loading of these interconnecting transformers depends on the Wellingtonregional load, wind generation, and the HVDC transfer level and direction (north orsouth power flow).The worst contingency affecting the Wellington 110 kV supply capacity is the outageof the Wilton interconnecting transformer. In this case, the Haywards interconnectingtransformers will exceed their n-1 winter capacity from approximately 2015(depending on Wellington load, HVDC transfer magnitude, and direction).226<strong>2012</strong> <strong>Annual</strong> <strong>Planning</strong> <strong>Report</strong> © <strong>Transpower</strong> New Zealand Limited <strong>2012</strong>. All rights reserved.
Chapter 14: Wellington RegionSolutionWe are investigating options for a new 250 MVA transformer in the Wellingtontransmission network.14.8.2 Central Park supply transformer capacityProject reference: CPK-POW_TFR-DEV-01Project status/purpose: Base Capex, replacementIndicative timing: <strong>2012</strong>-2014Indicative cost band: CIssueThree 110/33 kV transformers (one rated at 120 MVA, and two rated at 100 MVA)supply Central Park’s 33 kV and 11 kV loads, providing:a total nominal installed capacity of 320 MVA, andn-1 capacity of 217/223 MVA 116 (summer/winter).The peak load at Central Park for the combined 33 kV and 11 kV load is forecast toexceed the transformers’ n-1 winter capacity by approximately 2 MW in 2015,increasing to approximately 45 MW in 2027 (see Table 14-7)Two 33/11 kV transformers supply Central Park’s 11 kV load, providing:a total nominal installed capacity of 50 MVA, andn-1 capacity of 29/29 MVA 117 (summer/winter).The peak load at Central Park 11 kV is forecast to exceed the transformers’ n-1winter capacity by approximately 3 MW in 2013, increasing to approximately 10 MWin 2027 (see Table 14-7).Table 14-7: Central Park supply transformer overload forecastGrid exitpointCentral Park110/33 kVCentral Park33/11 kVPowerfactorNext 5 yearsTransformer overload (MW)5-15 years out<strong>2012</strong> 2013 2014 2015 2016 2017 2019 2021 2023 2025 20270.98 0 0 0 2 6 11 19 27 34 41 450.98 0 3 4 4 5 5 6 7 8 9 10SolutionPossible solutions include the following.For the 110/33 kV supply transformer capacity issue:resolving the LV cable limit (will solve the issue until 2016)replacing the transformers with higher capacity units (see later), andlimiting the load to within the capacity of the transformers.For the 33/11 kV supply transformer capacity issue:operationally managing the transformer overload (resolving thetransformers’ protection limit will not solve the transformer overload issue),116 The transformers’ capacity is limited by the LV cable; with this limit resolved, the n-1 capacity will be217/228 MVA (summer/winter).117 The transformers’ capacity is limited by the LV protection equipment; with this limit resolved, the n-1capacity will be 29/30 MVA (summer/winter).<strong>2012</strong> <strong>Annual</strong> <strong>Planning</strong> <strong>Report</strong> © <strong>Transpower</strong> New Zealand Limited <strong>2012</strong>. All rights reserved. 227
Chapter 14: Wellington RegionThe two 100 MVA supply transformers at Central Park are approaching theirexpected end-of-life within the next five years. Options include extending thetransformers’ lives or replacing them with 120 MVA units. While 120 MVA units willincrease the supply capacity, on their own they will not resolve the capacity issue inthe long term.We will discuss future supply options with Wellington Electricity. Future investmentwill be customer driven.14.8.3 Greytown supply transformer capacityProject reference: GYT-POW_TFR-EHMT-01Project status/purpose: Base Capex, minor enhancementIndicative timing: 2016Indicative cost band: AIssueTwo 110/33 kV transformers supply Greytown’s load, providing:a total nominal installed capacity of 40 MVA, andn-1 capacity of 20/20 MVA 118 (summer/winter).The peak load at Greytown is forecast to exceed the transformers’ n-1 summercapacity by approximately 1 MW in 2016, increasing to approximately 4 MW in 2027(see Table 14-8).Table 14-8: Greytown supply transformer overload forecastGrid exitpointPowerfactorNext 5 yearsTransformer overload (MW)5-15 years out<strong>2012</strong> 2013 2014 2015 2016 2017 2019 2021 2023 2025 2027Greytown 0.93 0 0 0 0 1 1 2 2 3 4 4SolutionRecalibrating the metering will solve the overload issue until 2021, and resolving theprotection limit will solve the transformers’ n-1 capacity issue within the forecastperiod.In addition, we also plan to convert the Greytown 33 kV outdoor switchgear to anindoor switchboard within the next 5-10 years.14.8.4 Haywards supply transformer capacity and securityProject reference: HAY-POW_TFR-DEV-01Project status/purpose: Base Capex, replacementIndicative timing: 2014Indicative cost band: CIssueThe Haywards grid exit point supplies load at 33 kV and 11 kV.One 110/33 kV, 20 MVA transformer supplies the load at the 33 kV bus resulting inno n-1 security. This load can be back fed through the Wellington Electricity network.118 The transformers’ capacity is limited by metering equipment, followed by protection equipment(23 MVA), and tap changer (24 MVA) limits; with these limits resolved, the n-1 capacity will be26/27 MVA (summer/winter).228<strong>2012</strong> <strong>Annual</strong> <strong>Planning</strong> <strong>Report</strong> © <strong>Transpower</strong> New Zealand Limited <strong>2012</strong>. All rights reserved.
Chapter 14: Wellington RegionThe Haywards 33 kV peak load is forecast to exceed the transformer’s capacity byapproximately 1 MW in <strong>2012</strong>, increasing to approximately 7 MW in 2027 (see Table14-9).One 110/11 kV, 20 MVA transformer supplies the load at the 11 kV bus resulting inno n-1 security. Wellington Electricity can backfeed some load through their network,and the Haywards local service transformer.The Haywards 11 kV peak load is forecast to exceed the transformer’s capacity byapproximately 3 MW in <strong>2012</strong>, increasing to approximately 10 MW in 2027 (see Table14-9).Table 14-9: Haywards supply transformer overload forecastGrid exit pointPowerfactorTransformer overload (MW)Next 5 years5-15 years out<strong>2012</strong> 2013 2014 2015 2016 2017 2019 2021 2023 2025 2027Haywards 33 kV 0.98 1 1 2 2 2 3 4 5 5 6 7Haywards 11 kV 0.99 3 4 4 5 5 6 7 8 9 9 10SolutionWe are discussing future supply options with Wellington Electricity. The short-termsolution is to manage the load operationally. A possible long-term option is to replacethe supply transformers with two new 110/33/11 kV, 60 MVA transformers, providingn-1 security to both the 11 kV and 33 kV buses.Both supply transformers at Haywards are approaching their expected end-of-lifewithin the next five years. We will discuss the appropriate rating and timing of thereplacement transformers with Wellington Electricity.14.8.5 Kaiwharawhara supply capacity and securityProject status/purpose:This is for information onlyIssueThe Kaiwharawhara load is supplied by 119 :two 110 kV circuits, each rated at 56/66 MVA 120 (summer/winter) from Wilton, andtwo 110/11 kV supply transformers, providing:• a total nominal installed capacity of 70 MVA, and• n-1 capacity of 38/38 MVA 121 (summer/winter).Kaiwharawhara peak load occurs during the summer period. The Kaiwharawharasubstation is configured with no 110 kV bus (each transformer is connected to one110 kV circuit only in a transformer-feeder arrangement) and is operated with a split11 kV bus. Tripping either one of the transformer feeders will result in a loss ofsupply to half the load. If this load is transferred to the remaining transformer feeder,the total Kaiwharawhara peak load is forecast to exceed the:transformers’ n-1 summer capacity by approximately 10 MW in <strong>2012</strong>, increasingto approximately 22 MW in 2027 (see Table 14-10), and119 The permanent arrangement for Kaiwharawhara is described. There is a temporary, higher capacitytransformer at Kaiwharawhara, which does not affect the total load that can be supplied fromKaiwharawhara.120 The Kaiwharawhara–Wilton circuits are limited by the cable rating; with this limit resolved, the n-1capacity will be 56/68 MVA (summer/winter).121 The transformers’ capacity is limited by the 11 kV circuit breaker owned by the local distributioncompany; with this limit resolved, the n-1 capacity will be 42/44 MVA (summer/winter).<strong>2012</strong> <strong>Annual</strong> <strong>Planning</strong> <strong>Report</strong> © <strong>Transpower</strong> New Zealand Limited <strong>2012</strong>. All rights reserved. 229
Chapter 14: Wellington Regioncircuits’ n-1 summer capacity from 2017.Table 14-10: Kaiwharawhara supply transformer overload forecastGrid exit pointPowerfactorTransformer overload (MW)Next 5 years5-15 years out<strong>2012</strong> 2013 2014 2015 2016 2017 2019 2021 2023 2025 2027Kaiwharawhara 0.97 10 11 12 12 13 14 16 18 20 21 22SolutionWellington Electricity considers the issue can be managed operationally bytransferring excess load to other grid exit points through the distribution network.Future investment will be customer driven.14.8.6 Masterton supply transformer capacityProject reference: MST-POW_TFR-DEV-01Project status/purpose: Committed, customer-specificIndicative timing: Q3 <strong>2012</strong>Indicative cost band: BIssueTwo 110/33 kV transformers supply Masterton’s load, providing:a total nominal installed capacity of 60 MVA, andn-1 capacity of 36/36 MVA 122 (summer/winter).The peak load at Masterton is forecast to exceed the transformers’ n-1 wintercapacity by approximately 17 MW in <strong>2012</strong>, increasing to approximately 32 MW in2027 (see Table 14-11).Table 14-11: Masterton supply transformer overload forecastGrid exitpointPowerfactorNext 5 yearsTransformer overload (MW)5-15 years out<strong>2012</strong> 2013 2014 2015 2016 2017 2019 2021 2023 2025 2027Masterton 0.97 17 18 19 20 22 23 25 27 29 31 32SolutionWe have entered into an agreement with Powerco to replace the existingtransformers with two 60 MVA units. These will provide n-1 security at Masterton forthe forecast period and beyond.If a transformer failure occurs before commissioning of the new units, Powerco cantransfer some load as an interim operational measure.14.8.7 Melling supply capacityProject reference: Circuit capacity upgrade: HAY_MLG-TRAN-EHMT-01Resolve protection and metering limits: MLG-POW_TFR-EHMT-01Project status/purpose: Circuit capacity upgrade: possible, customer-specificResolve protection and metering limits: Base Capex, minor enhancementIndicative timing: Circuit capacity upgrade: 2023Resolve protection and metering limits: <strong>2012</strong>Indicative cost band: Circuit capacity upgrade: to be advisedResolve protection and metering limits: A122 The transformers’ capacity is limited by transformer bushings; with this limit resolved, the n-1capacity will be 37/40 MVA (summer/winter).230<strong>2012</strong> <strong>Annual</strong> <strong>Planning</strong> <strong>Report</strong> © <strong>Transpower</strong> New Zealand Limited <strong>2012</strong>. All rights reserved.
Chapter 14: Wellington RegionIssueThe Melling load is supplied by:two 110 kV circuits, each rated at 95/101 MVA (summer/winter) from Haywards.two 110/33 kV transformers supplying Melling’s 33 kV load, providing:• a total nominal installed capacity of 100 MVA, and• n-1 capacity of 52/52 MVA 123 (summer/winter).two 110/11 kV transformers supplying Melling’s 11 kV load, providing:• a total nominal installed capacity of 50 MVA, and• n-1 capacity of 30/30 MVA 124 (summer/winter).In terms of Melling’s peak load:the combined 33 kV and 11 kV load is forecast to exceed the circuits’ n-1 wintercapacity from 2023the 33 kV load is forecast to exceed the transformers’ n-1 winter capacity by2 MW in <strong>2012</strong>, increasing to approximately 16 MW in 2027 (see Table 14-12),andthe 11 kV load is forecast to exceed the transformers’ n-1 winter capacity by2 MW in <strong>2012</strong>, increasing to approximately 11 MW in 2027 (see Table 14-12).Table 14-12: Hayward–Melling circuit and Melling supply transformer overload forecastCircuits/Gridexit pointPowerfactorNext 5 yearsTransformer overload (MW)5-15 years out<strong>2012</strong> 2013 2014 2015 2016 2017 2019 2021 2023 2025 2027Hayward–Melling N/A 0 0 0 0 0 0 0 0 1 4 6Melling 33 kV 0.99 2 3 4 5 6 7 9 11 13 15 16Melling 11 kV 0.98 2 3 3 4 5 5 7 8 9 10 11SolutionPossible solutions include the following.For the 110 kV circuit capacity, use the short-term rating for the circuit, thermallyupgrade the circuits, or reconductor the line.For the 110/33 kV supply transformer capacity, resolving the metering limit willsolve the transformers’ n-1 winter capacity issue until 2022.For the 110/11 kV supply transformer capacity, resolving the protection limit willsolve the transformers’ n-1 winter capacity until 2014.We will discuss future supply options with Wellington Electricity. In the short term,one possible option is to operationally manage the issue by limiting the load atMelling to the supply transformers’ and circuit’s capacity. A possible longer-termsolution is to develop the distribution network to limit the load within the capacity ofthe circuits and transformers.In addition, both Melling 110/33 kV supply transformers have an expected end-of-lifewithin the next 5-10 years. We will discuss the appropriate rating and timing for thereplacement transformers with Wellington Electricity. Future investment will becustomer driven.123 The transformers’ capacity is limited by metering equipment; with this limit resolved, then-1 capacity will be 64/67 MVA (summer/winter).124 The transformers’ capacity is limited by HV protection equipment; with this limit resolved, the n-1capacity will be 32/34 MVA (summer/winter).<strong>2012</strong> <strong>Annual</strong> <strong>Planning</strong> <strong>Report</strong> © <strong>Transpower</strong> New Zealand Limited <strong>2012</strong>. All rights reserved. 231
Chapter 14: Wellington Region14.8.8 Paraparaumu transmission security and supply transformer capacityProject reference: PRM-POW_TFR-DEV-01Project status/purpose: Possible, to meet the Grid Reliability Standard (not core grid) and customerspecificIndicative timing: New capacitors: 2013A third supply transformer or new grid exit point: 2015Indicative cost band: New capacitors: AA third supply transformer: BA new grid exit point: CIssueThe Paraparaumu load is supplied by:two 110 kV circuits, each rated at 95/105 MVA (summer/winter), from TakapuRoad via Pauatahanui to Paraparaumutwo 110 kV circuits, each rated at 49/60 MVA (summer/winter), from Mangahao toParaparaumu, andtwo 110/33 kV supply transformers, providing:• a nominal installed capacity of 120 MVA, and• n-1 capacity of 70/74 MVA (summer/winter).A system split is permanently in place north of Paraparaumu. This prevents the110 kV circuits becoming a parallel path to the 220 kV Bunnythorpe–Haywardscircuits and consequently constraining those circuits. Paraparaumu substation is alsoconfigured with a split 110 kV bus.The issues at Paraparaumu involve the following:Paraparaumu’s forecast peak load will exceed the supply transformers’ n-1 wintercapacity by approximately 4 MW in <strong>2012</strong>, increasing to approximately 17 MW in2027 (see Table 14-13).An outage of one Paraparaumu–Pauatahanui–Takapu Road circuit will cause theremaining circuit to:• exceed the n-1 capacity of the Paraparaumu–Pauatahanui circuit sectionfrom <strong>2012</strong>, and• exceed the n-1 capacity of the Pauatahanui–Takapu Road circuit sectionfrom 2015.Table 14-13: Paraparaumu supply transformer overload forecastGrid exitpointPowerfactorNext 5 yearsTransformer overload (MW)5-15 years out<strong>2012</strong> 2013 2014 2015 2016 2017 2019 2021 2023 2025 2027Paraparaumu 0.98 4 5 5 6 7 8 10 11 13 15 17SolutionThe Paraparaumu peak load occurs for only a short period each day during winterevenings. Possible interim solutions include:post-contingency load reduction, oroperating the supply transformers at their short-term thermal ratings over theshort peak period, and/orinstalling capacitors at the Paraparaumu 33 kV bus.Possible long-term solutions include:an additional supply transformer (or transformers) at Paraparaumu, supplied fromthe Mangahao–Paraparaumu circuits, so the Paraparaumu load is divided intotwo grid exit points, or232<strong>2012</strong> <strong>Annual</strong> <strong>Planning</strong> <strong>Report</strong> © <strong>Transpower</strong> New Zealand Limited <strong>2012</strong>. All rights reserved.
Chapter 14: Wellington Regiona new grid exit point near Paraparaumu (Otaki) supplied from the Mangahao–Paraparaumu circuits. Some of the load at Paraparaumu can be transferred tothe new grid exit point.An additional supply transformer (or transformers) and/or a new grid exit point willallow some load to be supplied from the south via Pauatahanui from Takapu Road,while the rest is supplied from the north via Mangahao from Bunnythorpe. Followingsome contingencies during periods of high load, it will be necessary to transfer loadfrom the ‘north’ to the ‘south’ infeed to prevent some circuit overloading.Property issues are not anticipated for the new capacitors and/or additional supplytransformers at Paraparaumu because the existing substation has sufficient room toaccommodate the new equipment. However, designated land will be required for thenew grid exit point near Paraparaumu.We are discussing future supply options with Electra. Future investment will becustomer driven.14.8.9 Pauatahanui supply transformer capacityProject status/purpose:This is for information onlyIssueTwo 110/33 kV transformers supply Pauatahanui’s load, providing:a total nominal installed capacity of 40 MVA, andn-1 capacity of 22/24 MVA (summer/winter).The peak load at Pauatahanui is forecast to exceed the transformers’ n-1 wintercapacity by approximately 1 MW in <strong>2012</strong>, increasing to approximately 8 MW in 2027(see Table 14-14).Table 14-14: Pauatahanui supply transformer overload forecastGrid exitpointPowerfactorNext 5 yearsTransformer overload (MW)5-15 years out<strong>2012</strong> 2013 2014 2015 2016 2017 2019 2021 2023 2025 2027Pauatahanui 0.98 1 1 2 2 3 3 4 5 6 7 8SolutionOne supply transformer at Pauatahanui will approach its expected end-of-life withinthe next 5-10 years. We will discuss future supply options with Wellington Electricity.Future investment will be customer driven.14.8.10 Takapu Road supply transformer capacityProject reference: Increase protection and metering limits: TKR- POW_TFR-EHMT-01Upgrade transformer’s capacity: TKR-POW_TFR-DEV-01Project status/purpose: Increase protection and metering limits: Base Capex, minor enhancementUpgrade transformer’s capacity: possible, customer-specificIndicative timing: Increase protection and metering limits: Q4 <strong>2012</strong>Upgrade transformer’s capacity: to be advisedIndicative cost band: Increase protection and metering limits: AUpgrade transformer’s capacity: BIssueTwo 110/33 kV transformers supply Takapu Road’s load, providing:a total nominal installed capacity of 180 MVA, and<strong>2012</strong> <strong>Annual</strong> <strong>Planning</strong> <strong>Report</strong> © <strong>Transpower</strong> New Zealand Limited <strong>2012</strong>. All rights reserved. 233
Chapter 14: Wellington Regionn-1 capacity of 90/90 MVA 125 (summer/winter).The peak load at Takapu Road is forecast to exceed the transformers’ n-1 wintercapacity by approximately 17 MW in <strong>2012</strong>, increasing to approximately 51 MW in2027 (see Table 14-15)Table 14-15: Takapu Road supply transformer overload forecastGrid exitpointPowerfactorNext 5 yearsTransformer overload (MW)5-15 years out<strong>2012</strong> 2013 2014 2015 2016 2017 2019 2021 2023 2025 2027Takapu Road 0.99 17 19 22 24 26 28 33 38 42 47 51SolutionResolving the protection and metering equipment limits will solve the overload issueuntil 2014. We will discuss future options with Wellington Electricity. In the shortterm, we will manage the load operationally. Possible longer-term options include:replacing the existing supply transformers with two 120 MVA units and limit theload growth to the transformers’ n-1 capacityinstalling a third supply transformer, andtransferring load to another grid exit point.Future investment will be customer driven.In addition, we also plan to convert the Takapu Road 33 kV outdoor switchgear to anindoor switchboard within the next five years.14.8.11 Upper Hutt supply transformer capacityProject reference: UHT- POW_TFR-EHMT-01Project status/purpose: Base Capex, minor enhancementIndicative timing: 2013Indicative cost band: AIssueTwo 110/33 kV transformers supply Upper Hutt’s load, providing:a total nominal installed capacity of 80 MVA, andn-1 capacity of 38/38 MVA 126 (summer/winter).The peak load at Upper Hutt is forecast to exceed the transformers’ n-1 wintercapacity by approximately 1 MW in <strong>2012</strong>, increasing to approximately 9 MW in 2027(see Table 14-16).Table 14-16: Upper Hutt supply transformer overload forecastGrid exitpointPowerfactorNext 5 yearsTransformer overload (MW)5-15 years out<strong>2012</strong> 2013 2014 2015 2016 2017 2019 2021 2023 2025 2027Upper Hutt 0.99 1 1 2 2 3 3 5 6 7 8 9125 The transformers’ capacity is limited by protection, followed by metering equipment (110 MVA) limits;with these limits resolved, the n-1 capacity will be 111/116 MVA (summer/winter).126 The transformers’ capacity is limited by protection equipment, followed by the metering (41MVA)limits; with these limits resolved, the n-1 capacity will be 51/54 MVA (summer/winter).234<strong>2012</strong> <strong>Annual</strong> <strong>Planning</strong> <strong>Report</strong> © <strong>Transpower</strong> New Zealand Limited <strong>2012</strong>. All rights reserved.
Chapter 14: Wellington RegionSolutionResolving the protection equipment limit and recalibrating the metering parameterswill provide sufficient n-1 capacity for the forecast period.In addition, the Upper Hutt 33 kV outdoor switchgear will be converted to an indoorswitchboard within the next five years. Also, both the supply transformers have anexpected end-of-life at the end of the forecast period. We will discuss the rating andtiming for these replacement transformers with Wellington Electricity. Futureinvestment will be customer driven.14.8.12 Wilton supply transformer capacityProject reference: WIL- POW_TFR-EHMT-01Project status/purpose: Base Capex, minor enhancementIndicative timing: 2023Indicative cost band: AIssueTwo 220/33 kV transformers supply Wilton’s load, providing:a total nominal installed capacity of 200 MVA, andn-1 capacity of 82/82 MVA 127 (summer/winter).The peak load at Wilton is forecast to exceed the transformers’ n-1 winter capacity byapproximately 1 MW in 2023, increasing to approximately 5 MW in 2027 (see Table14-17).Table 14-17: Wilton supply transformer overload forecastGrid exitpointPowerfactorNext 5 yearsTransformer overload (MW)5-15 years out<strong>2012</strong> 2013 2014 2015 2016 2017 2019 2021 2023 2025 2027Wilton 0.99 0 0 0 0 0 0 0 0 1 3 5SolutionResolving the protection equipment limit will provide sufficient n-1 capacity for theforecast period.In addition, the Wilton 33 kV outdoor switchgear will be converted to an indoorswitchboard within the next five years. We will also investigate the options torationalise the Wilton 110 kV bus for better maintenance safety and increased Wiltonsupply security.14.9 Other regional items of interest14.9.1 Central Park supply security during maintenanceThere are three 110 kV Central Park–Wilton circuits that supply the Central Park load.There is no 110 kV bus at Central Park, so an outage of one circuit will cause the lossof one transformer connected in series with the circuit.Wellington Electricity has indicated concern over a lack of supply security at CentralPark. When a circuit is taken out of service for maintenance, a loss of another circuitduring high load periods will cause the third supply transformer to overload and trip,resulting in a total loss of supply.127 The transformers’ capacity is limited by protection, followed by cable (112 MVA) limits; with theselimits resolved, the n-1 capacity will be 116/121 MVA (summer/winter).<strong>2012</strong> <strong>Annual</strong> <strong>Planning</strong> <strong>Report</strong> © <strong>Transpower</strong> New Zealand Limited <strong>2012</strong>. All rights reserved. 235
Chapter 14: Wellington RegionThis issue is being addressed in the short term by installing a 110/33 kV specialprotection scheme at Central Park to automatically shed load. This issue can beaddressed in the long term by installing a 110 kV bus at Central Park.14.10 Wellington generation proposals and opportunitiesThis section details relevant regional issues for selected generation proposals underinvestigation by developers and in the public domain, or other generationopportunities.The maximum generation that can be connected at any substation depends onseveral factors and usually falls within a range. Generation developers shouldconsult with us at an early stage of their investigations to discuss connection issues.See our website for more information about connecting generation. 128See also Chapter 11, Section 11.10.3 for more information about connecting windgeneration in the Bunnythorpe/Wellington region.14.10.1 Generation connection options - generalMost of the transmission network in the region is used to supply load rather thanconnect generation. In general, there are no issues with connecting up to severalhundred megawatts of generation to these circuits. Higher generation levels reversethe power flow direction, and approach the circuits’ ratings. As a result, depending onwhere generation is located, some comparatively minor upgrades may be required,such as increasing the 220/110 kV interconnection capacity.However, the capacity of the core grid between regions may constrain the generation.14.10.2 Puketiro wind stationThis proposed wind generation station can connect to the 220 kV circuits betweenBunnythorpe and Haywards/Wilton. There are no regional transmission capacityissues with connecting this generation, although the capacity of the grid backbonemay sometimes limit generation.14.10.3 Long Gully wind stationA wind generation station at Long Gully embedded within the 33 kV distributionsystem at Central Park will not cause any connection issues.14.10.4 Generation connection to the 110 kV network in the Wairarapa areaThere is a 110 kV double-circuit line from Haywards to Upper Hutt, Greytown, andMasterton, and a single-circuit line from Masterton to Mangamaire and Woodville (inthe Central North Island region).The amount of generation that can be installed depends on its location along the110 kV line, and any line upgrades. Approximately 230 MW of generation canconnect at Masterton under normal operating conditions. Other generation locationsand upgrade options may result in maximum generation levels ranging fromapproximately 0 (zero)-230 MW.128 http://www.transpower.co.nz/connecting-new-generation.236<strong>2012</strong> <strong>Annual</strong> <strong>Planning</strong> <strong>Report</strong> © <strong>Transpower</strong> New Zealand Limited <strong>2012</strong>. All rights reserved.
Chapter 15: Nelson-Marlborough Region15 Nelson-Marlborough Regional Plan15.1 Regional overview15.2 Nelson-Marlborough transmission system15.3 Nelson-Marlborough demand15.4 Nelson-Marlborough generation15.5 Nelson-Marlborough significant maintenance work15.6 Future Nelson-Marlborough projects summary and transmission configuration15.7 Changes since the 2011 <strong>Annual</strong> <strong>Planning</strong> <strong>Report</strong>15.8 Nelson-Marlborough transmission capability15.9 Other regional items of interest15.10 Nelson-Marlborough generation proposals and opportunities15.1 Regional overviewThis chapter details the Nelson-Marlborough regional transmission plan. We basethis regional plan on an assessment of available data, and welcome feedback toimprove its value to all stakeholders.Figure 15-1: Nelson-Marlborough region<strong>2012</strong> <strong>Annual</strong> <strong>Planning</strong> <strong>Report</strong> © <strong>Transpower</strong> New Zealand Limited <strong>2012</strong>. All rights reserved. 237
Chapter 15: Nelson-Marlborough RegionThe Nelson-Marlborough region includes a mix of significant and growing provincialcities (Nelson, and Blenheim) together with smaller rural service centres.We have assessed the Nelson-Marlborough region’s transmission needs over thenext 15 years while considering longer-term development opportunities. Specifically,the transmission network needs to be flexible to respond to a range of future serviceand technology possibilities, taking into consideration:the existing transmission networkforecast demandforecast generationequipment replacement based on condition assessment, andpossible technological development.15.2 Nelson-Marlborough transmission systemThis section highlights the state of the Nelson-Marlborough regional transmissionnetwork. The existing transmission network is set out geographically in Figure 15-1and schematically in Figure 15-2.Figure 15-2: Nelson-Marlborough transmission schematicMotupipiUpper TakakaCobb66 kV33 kV66 kV66 kVMotueka11 kV66 kV110 kVKEY220kV CIRCUIT110kV CIRCUIT66 kVStoke220 kV33 kVBlenheim110 kV33 kV66kV CIRCUITSUBSTATION BUSTRANSFORMERLOADCAPACITOR110 kV3 WDG TRANSFORMERREACTORGENERATORWEST COASTKikiwaArgyleKikiwa15.2.1 Transmission into the regionThe Nelson-Marlborough region is connected to the rest of the National Grid via220 kV circuits from the Waitaki Valley with significant load off-take in the SouthCanterbury and Canterbury regions. Therefore, supply to the Nelson-Marlboroughregion is affected by transmission capacity from the Waitaki Valley.The region is predominantly supplied by three 220 kV circuits between the Islingtonand Kikiwa substations, with some generation from the hydro power stationsconnected at Cobb (which is strategic to the Golden Bay spur) and Argyle.15.2.2 Transmission within the regionThe transmission within the region comprises:220 kV circuits from Kikiwa to Stokeparallel 110 kV circuits forming a ‘triangle’ between Kikiwa, Stoke, and Blenheim238<strong>2012</strong> <strong>Annual</strong> <strong>Planning</strong> <strong>Report</strong> © <strong>Transpower</strong> New Zealand Limited <strong>2012</strong>. All rights reserved.
Chapter 15: Nelson-Marlborough Region220/110 kV and 110/66 kV interconnecting transformers at Stoke, anda 66 kV transmission spur supplying the Golden Bay area.The reactive power support in this region is provided from the 60 Mvar capacitors atStoke and 20.4 Mvar capacitors at Blenheim.15.2.3 Longer-term development pathThe two existing 220 kV Kikiwa–Stoke circuits have enough capacity to provide n-1security within the region for the next 20-30 years.As the Nelson-Marlborough region relies on generation several hundred kilometresaway, there will be an on-going need for investment in reactive support (such as theSTATCOM at Kikiwa and additional capacitors) to support the voltage.The 110 kV Blenheim–Argyle–Kikiwa line may need upgrading if there is more thanone significant new generator connected along the line, at Blenheim or embeddedbehind the Blenheim grid exit point.Increased 220/110 kV interconnecting transformer capacity will be required beyondthe forecast period at Kikiwa and/or Stoke. The capacity of the 110 kV Kikiwa–Stokecircuit may also need to be increased as this circuit is an important connectionbetween the 220/110 kV transformers at Kikiwa and Stoke.In the longer term, it may be economic to convert the section of 66 kV line from Stoketo Motueka to 110 kV. This conversion does not need to be investigated untilapproximately 2020, with possible implementation in approximately 2025.15.3 Nelson-Marlborough demandThe after diversity maximum demand (ADMD) for the Nelson-Marlborough region isforecast to grow on average by 1.4% annually over the next 15 years, from 243 MWin <strong>2012</strong> to 298 MW by 2027. This is lower than the national average demand growthof 1.7% annually.Figure 15-3 shows a comparison of the 2011 and <strong>2012</strong> forecast 15-year maximumdemand (after diversity 129 ) for the Nelson-Marlborough region. The forecasts arederived using historical data, and modified to account for customer information, whereappropriate. The power factor at each grid exit point is also derived from historicaldata, and is used to calculate the real power capacity for power transformer andtransmission line. See Chapter 4 for more information about demand forecasting.129 The after diversity maximum demand (ADMD) for the region will be less than the sum of theindividual grid exit point peak demands, as it takes into account the fact that the peak demand doesnot occur simultaneously at all the grid exit points in the region.<strong>2012</strong> <strong>Annual</strong> <strong>Planning</strong> <strong>Report</strong> © <strong>Transpower</strong> New Zealand Limited <strong>2012</strong>. All rights reserved. 239
Chapter 15: Nelson-Marlborough RegionFigure 15-3: Nelson-Marlborough region after diversity maximum demand forecastLoad (MW)300Nelson-Marlborough2802602402202001801601402011 APR Forecast120<strong>2012</strong> APR ForecastActual Peak1001997 1999 2001 2003 2005 2007 2009 2011 2013 2015 2017 2019 2021 2023 2025 2027Table 15-1 lists the peak demand forecast (prudent growth) for each grid exit point forthe forecast period, as required for the Grid Reliability <strong>Report</strong>.Table 15-1: Forecast annual peak demand (MW) at Nelson-Marlborough grid exit pointsto 2027Grid exit pointPowerfactorNext 5 yearsPeak demand (MW)5-15 years out<strong>2012</strong> 2013 2014 2015 2016 2017 2019 2021 2023 2025 2027Blenheim 0.98 80 82 84 86 88 90 94 98 102 106 110Motueka 0.98 20 21 21 21 22 22 22 23 24 24 25Motupipi 0.95 8 8 9 9 9 9 10 10 10 10 11Stoke 1 1.00 144 147 149 152 155 158 164 169 175 181 1861. Additional 4 MW load allowed at Stoke from <strong>2012</strong> for any migration of load from Canterbury due tothe earthquakes.15.4 Nelson-Marlborough generationThe Nelson-Marlborough region’s generation capacity is 56 MW, which is lower thanlocal demand, requiring power to be imported through the National Grid.Table 15-2 lists the generation forecast for each grid injection point for the forecastperiod, as required for the Grid Reliability <strong>Report</strong>. This includes all known generationstations, including those embedded within the relevant local lines company’s network(Network Tasman or Marlborough Lines). 130No new generation is known to be committed in the Nelson-Marlborough region forthe forecast period.130 Only generators with capacity greater than 1 MW are listed. Generation capacity is rounded to thenearest megawatt.240<strong>2012</strong> <strong>Annual</strong> <strong>Planning</strong> <strong>Report</strong> © <strong>Transpower</strong> New Zealand Limited <strong>2012</strong>. All rights reserved.
Chapter 15: Nelson-Marlborough RegionTable 15-2: Forecast annual generation capacity (MW) at Nelson-Marlborough gridinjection points to 2027 (including existing and committed generation)Grid injection point(location ifembedded)Argyle - Branch RiverSchemeNext 5 yearsGeneration capacity (MW)5-15 years out<strong>2012</strong> 2013 2014 2015 2016 2017 2019 2021 2023 2025 202711 11 11 11 11 11 11 11 11 11 11Cobb 32 32 32 32 32 32 32 32 32 32 32Blenheim(Lulworth Wind)Blenheim(Marlborough LinesDiesel)1 1 1 1 1 1 1 1 1 1 19 9 9 9 9 9 9 9 9 9 9Blenheim (Waihopai) 3 3 3 3 3 3 3 3 3 3 3Motupipi (Onekaka) 1 1 1 1 1 1 1 1 1 1 115.5 Nelson-Marlborough significant maintenance workOur capital project and maintenance works are integrated to enable system issues tobe resolved if possible when assets are replaced or refurbished. Table 15-3 lists thesignificant maintenance related work 131 proposed for the Nelson-Marlborough regionfor the next 15 years that may significantly impact related system issues or connectedparties.Table 15-3: Proposed significant maintenance workDescriptionBlenheim supply transformersexpected end-of-lifeBlenheim 33 kV capacitorbanks replacementStoke 11 kV capacitor bankreplacementStoke 110/66 kVinterconnecting transformerexpected end-of-lifeStoke supply transformersexpected end-of-life, and33 kV outdoor to indoorconversionTentative year Related system issues2018-2020 The option to replace or extend transformer life is underinvestigation.2015-2017 See Chapter 6 for information about the Upper SouthIsland voltage issue. The rating of replacementcapacitors is yet to be determined.2014-2016 See Chapter 6 for information about the Upper SouthIsland voltage issue. The rating of replacementcapacitors is yet to be determined.2019-2021 Upgrading the transformer’s capacity is one of thepossible options to resolve the transformer overloadingissue. See Section 15.8.2 for more information<strong>2012</strong>-2014 The supply transformer replacement work is currentlyunderway. See Section 15.8.7 for more information.15.6 Future Nelson-Marlborough projects summary and transmissionconfigurationTable 15-4 lists projects to be carried out in the Nelson-Marlborough region within thenext 15 years.Figure 15-4 shows the possible configuration of Nelson-Marlborough transmission in2027, with new assets, upgraded assets, and assets undergoing significantmaintenance within the forecast period.131 This may include replacement of the asset due to its condition assessment.<strong>2012</strong> <strong>Annual</strong> <strong>Planning</strong> <strong>Report</strong> © <strong>Transpower</strong> New Zealand Limited <strong>2012</strong>. All rights reserved. 241
Chapter 15: Nelson-Marlborough RegionTable 15-4: Projects in the Nelson-Marlborough region up to 2027Site Projects StatusBlenheimReplace supply transformers.Replace 33 kV capacitor banks.Base CapexBase CapexBrightwater New grid exit point. PossibleMotuekaUpgrade supply transformer branch limiting components.New capacitors.Base CapexPossibleMotueka-Stoke Upgrade conductor capacities. PossibleMotupipi New capacitor. PossibleRiwaka New grid exit point. PreferredStokeNew 110/66 kV interconnecting transformer.Replace 110/66 kV interconnecting transformer.Replace 220/33 kV supply transformers with two higher-rated units.Convert 33 kV outdoor switchgear to an indoor switchboard.Replace 11 kV capacitor banks.PreferredBase CapexCommittedBase CapexBase CapexFigure 15-4: Possible Nelson-Marlborough transmission configuration in 2027MotupipiUpper TakakaCobb66 kV33 kV66 kV66 kVRiwaka66 kV 33 kV*66 kVMotueka11 kV110 kVKEY66 kVStoke220 kV33 kV110 kVNEW ASSETSUPGRADED ASSETSASSETS SCHEDULEDFOR REPLACEMENTMINOR UPGRADE*Brightwater33 kV220 kVBlenheim33 kV110 kVKikiwaArgyleWEST COASTKikiwa15.7 Changes since the 2011 <strong>Annual</strong> <strong>Planning</strong> <strong>Report</strong>Table 6-1 lists the specific issues that are either new or no longer relevant within theforecast period when compared to last year's report.Table 15-5: Changes Since 2011IssuesStoke 220/110 kV interconnecting transformer capacityKikiwa–Stoke 110 kV transmission capacityChangeNew issue.New issue.15.8 Nelson-Marlborough transmission capabilityTable 15-6 summarises issues involving the Nelson-Marlborough region for the next15 years. For more information about a particular issue, refer to the listed sectionnumber.242<strong>2012</strong> <strong>Annual</strong> <strong>Planning</strong> <strong>Report</strong> © <strong>Transpower</strong> New Zealand Limited <strong>2012</strong>. All rights reserved.
Chapter 15: Nelson-Marlborough RegionTable 15-6: Nelson-Marlborough region transmission issuesSectionnumberIssueRegional15.8.1 Stoke 220/110 kV interconnecting transformer capacity15.8.2 Stoke 110/66 kV interconnecting transformer capacitySite by grid exit point15.8.3 Cobb–Motueka 66 kV transmission capacity15.8.4 Motueka supply transformer capacity15.8.5 Motupipi single supply security15.8.6 Kikiwa–Stoke 110 kV transmission capacity15.8.7 Stoke supply transformer capacity15.8.1 Stoke 220/110 kV interconnecting transformer capacityProject reference: STK-POW_TFR-DEV-01Project status/purpose: Resolving station equipment limits: Base Capex, minor enhancementIndicative timing: 2020Indicative cost band: AIssueA single 220/110 kV interconnecting transformer at Stoke provides a 110 kVinterconnection to the Nelson-Marlborough region. This transformer has:a nominal installed capacity of 150 MVA, andn-1 capacity of 160/160 132 MVA (summer/winter).The Stoke 220/110 kV transformer is effectively operating in parallel with the150 MVA interconnecting transformer at Kikiwa. An outage of the Kikiwa transformerresults in the Stoke transformer supplying the Nelson-Marlborough and West Coastregions 133 and may cause the Stoke transformer to overload. The loading on theStoke transformer depends on the generation in the Nelson-Marlborough and WestCoast regions.SolutionIn the short term, this issue will be managed operationally via generationrescheduling and load management. Removing station equipment constraints on theinterconnecting transformer and managing the generation level in the Nelson-Marlborough and West Coast regions will resolve the issue for the forecast period.In the longer term, a second 220/110 kV transformer may be required at Kikiwa.15.8.2 Stoke 110/66 kV interconnecting transformer capacityProject reference:Project status/purpose:Indicative timing:Indicative cost band:STK-POW_TFR-EHMT-02Preferred, customer-specificTo be advisedB132 The transformer’s capacity is limited by 110 kV disconnectors; with this limit resolved, the n-1capacity will be 180/188 MVA (summer/winter).133 The normal operating arrangement is only Kikiwa T2 (150 MVA) provides a 110 kV interconnectionto the West Coast region, and Kikiwa T1 (50 MVA) supplies the local 11 kV load.<strong>2012</strong> <strong>Annual</strong> <strong>Planning</strong> <strong>Report</strong> © <strong>Transpower</strong> New Zealand Limited <strong>2012</strong>. All rights reserved. 243
Chapter 15: Nelson-Marlborough RegionIssueThe Golden Bay loads at the Motueka and Motupipi grid exit points are supplied by:a single 23 MVA 110/66/11 kV transformer at Stoke, andthe Cobb generation station.With no Cobb generation, the peak load at Golden Bay is forecast to exceed theStoke transformer’s continuous rating by approximately 5 MW in <strong>2012</strong>, increasing toapproximately 11 MW in 2027 (see Table 15-7).Table 15-7: Stoke 110/66 kV transformer overload forecastGrid exitpointPowerfactorNext 5 yearsTransformer overload (MW)5-15 Years out<strong>2012</strong> 2013 2014 2015 2016 2017 2019 2021 2023 2025 2027Golden Bay 0.98 5 5 6 6 7 7 8 9 10 11 11SolutionThe short-term operational solution requires Cobb to generate at a minimum output toavoid overloading the Stoke transformer.We are discussing longer-term solutions with Network Tasman and Trustpower. Thepreferred option is to install a 40 MVA transformer in parallel with the existinginterconnecting transformer. This (in conjunction with some generation from Cobb)will provide secure supply to the Golden Bay area for the forecast period and beyond.Installing a second Stoke 110/66 kV interconnecting transformer does not raiseproperty issues as the existing substation has sufficient room to accommodate thenew transformer.Future investment will be customer driven.15.8.3 Cobb–Motueka 66 kV transmission capacityProject status/purpose:This issue is for information onlyIssueThe three circuits connecting Cobb, Motueka and Upper Takaka include the:Cobb–Motueka 2 circuit rated at 21/26 MVA (summer/winter)Motueka–Upper Takaka 1 circuit rated at 21/25 MVA (summer/winter), andCobb–Upper Takaka 1 circuit rated at 29/35 MVA (summer/winter).An outage of one of the Cobb–Motueka 2, Motueka–Upper Takaka 1 orCobb–Upper Takaka 1 circuits will limit the Cobb generation station’s output.SolutionThe issue is managed operationally with an automatic generation runback scheme toconstrain Cobb generation to match the remaining circuit’s rating. This is consideredadequate and future investment will be customer driven.15.8.4 Motueka supply transformer capacityProject reference: Upgrade protection: MOT-POW_TFR_PTN-EHMT-01New capacitors: MOT-C_BANKS-DEV-01New grid exit point: MOT-SUBEST-DEV-01Project status/purpose: Upgrade protection: Base Capex, minor enhancementNew capacitors and grid exit point: preferred, customer-specificIndicative timing: Upgrade protection: <strong>2012</strong>244<strong>2012</strong> <strong>Annual</strong> <strong>Planning</strong> <strong>Report</strong> © <strong>Transpower</strong> New Zealand Limited <strong>2012</strong>. All rights reserved.
Chapter 15: Nelson-Marlborough RegionIndicative cost band:New capacitors: 2013New grid exit point: 2016Upgrade new capacitor: ANew grid exit point: CIssueTwo 66/11 kV transformers supply Motueka’s load, providing:a total nominal installed capacity of 40 MVA, andn-1 capacity of 21/21 MVA 134 (summer/winter).The peak load at Motueka is forecast to exceed the transformers’ n-1 winter capacityby approximately 2 MW in <strong>2012</strong>, increasing to approximately 7 MW in 2027 (seeTable 15-8).Table 15-8: Motueka supply transformer overload forecastGrid exitpointPowerfactorNext 5 yearsTransformer overload (MW)5-15 years out<strong>2012</strong> 2013 2014 2015 2016 2017 2019 2021 2023 2025 2027Motueka 0.98 2 2 3 3 3 4 4 5 5 6 7SolutionWe have discussed future supply options with Network Tasman. We will raise theprotection limit to provide a short-term solution. The preferred long-term developmentoption involves:installing capacitors at Motueka, which extends the transformer’s real powercapacity, andestablishing a new grid exit point near Riwaka, connecting to the 66 kVStoke–Upper Takaka lines.Installing new capacitor banks does not raise new property issues as the existingsubstation has sufficient room to accommodate the new equipment. NetworkTasman has designated land for the new Riwaka grid exit point.15.8.5 Motupipi single supply securityProject status/purpose:This issue is for information onlyIssueMotupipi is supplied by a single 66 kV circuit from Upper Takaka, which means it hasno n-1 security. The forecast load growth at Motupipi will not exceed the presentcircuit rating for the forecast period and beyond.Motupipi’s point of connection is the 66 kV line termination, so the loading of thesupply transformer rests with the customer.SolutionThe lack of n-1 security can be managed operationally. However, we will discussoptions for increasing security with Network Tasman. Future investment will becustomer driven.134 The transformers’ capacity is limited by protection limit, followed by the bus section limit of 23 MVA,and cable limit of 24 MVA; with these limits resolved, the n-1 capacity will be 24/25 MVA(summer/winter).<strong>2012</strong> <strong>Annual</strong> <strong>Planning</strong> <strong>Report</strong> © <strong>Transpower</strong> New Zealand Limited <strong>2012</strong>. All rights reserved. 245
Chapter 15: Nelson-Marlborough Region15.8.6 Kikiwa–Stoke 110 kV transmission capacityProject reference: KIK_STK-TRAN-EHMT-01Project status/purpose: Possible, to meet the Grid Reliability Standard (not core grid)Indicative timing: Beyond 2020Indicative cost band: To be advisedIssueThere are two 110 kV circuits connecting the Nelson-Marlborough and West Coastregions:Kikiwa–Stoke 3 circuit rated at 56/68 MVA (summer/winter), andKikiwa–Argyle–Blenheim–Stoke 1 circuit rated at 56/68 MVA (summer/winter).An outage of a Stoke 220/110 kV interconnecting transformer results in Nelson-Marlborough region supply from the interconnection at Kikiwa, via the two 110 kVcircuits. The Kikiwa–Stoke 3 circuit may overload when Nelson-Marlborough regionload is high coupled with low local generation.SolutionThis issue can be managed operationally by constraining generation levels at Cobband Argyle. A longer-term solution is to thermally upgrade the Kikiwa–Stoke 110 kVcircuit.15.8.7 Stoke supply transformer capacityProject reference: Replace transformer: STK-POW_TFR-EHMT-01New grid exit point: STK-SUBEST-DEV-01Project status/purpose: Replace transformer: committed, replacementNew grid exit point: possible, customer-specificIndicative timing: Replace transformer: <strong>2012</strong>-2014New grid exit point: 2015Indicative cost band: Replace transformer: CNew grid exit point: CIssueThree 220/33 kV transformers supply Stoke’s load, providing:a total nominal installed capacity of 150 MVA, andn-1 capacity of 114/114 MVA 135 (summer/winter).The peak load at Stoke already exceeds the transformers’ n-1 winter capacity, andthe overload is forecast to increase to approximately 76 MW in 2027 (see Table15-9).Table 15-9: Stoke supply transformer overload forecastGrid exitpointPowerfactorNext 5 yearsTransformer overload (MW)5-15 years out<strong>2012</strong> 2013 2014 2015 2016 2017 2019 2021 2023 2025 2027Stoke 1.00 33 36 39 42 45 48 53 59 65 70 76SolutionThe supply transformers are made up of single-phase units with a contracted on-sitespare, allowing replacement within 8-14 hours following a unit failure.135 The transformers’ capacity is limited by protection equipment; with this limit resolved, then-1 capacity will be 124/133 MVA (summer/winter).246<strong>2012</strong> <strong>Annual</strong> <strong>Planning</strong> <strong>Report</strong> © <strong>Transpower</strong> New Zealand Limited <strong>2012</strong>. All rights reserved.
Chapter 15: Nelson-Marlborough RegionWe are replacing the existing transformers with two 120 MVA units with a postcontingency rating of 143 MVA, which gives an additional 29 MVA n-1 capacity. Thetransformer overloading issue can be resolved initially by operational measures and,in the longer term, by a new grid exit point at Brightwater connected to the 220 kVKikiwa–Stoke circuits. Network Tasman has designated land for a new grid exit point.The existing single-phase supply transformers at Stoke are approaching their end-oflifewithin the next five years. We also plan to convert the Stoke 33 kV outdoorswitchgear to an indoor switchboard. The replacement of these transformers and the33 kV outdoor to indoor conversion will be coordinated.15.9 Other regional items of interest15.9.1 Golden Bay voltage quality and transmission securityProject reference:Project status/purpose:Indicative timing:Indicative cost band:New capacitor: MOT-C_BANKS-DEV-01Upgrade conductor: STK_UTK-TRAN-EHMT-01Possible, customer-specificTo be advisedNew capacitor: AUpgrade conductor: to be advisedIssueTwo 66 kV circuits connect Cobb generation to the transmission grid. Disconnectionof Cobb generation from the grid during a planned maintenance outage of the Cobb–Upper Takaka 1 circuit and loss of the Cobb–Motueka–Stoke 2 circuit, causes lowvoltage and transmission security issues at Golden Bay.SolutionPossible development options include:installing capacitors at Motueka and/or Motupipi for voltage support, and reducingvoltage step post contingency, orupgrading the limiting conductor on the Stoke–Upper Takaka A and B lines.Installation of capacitor banks at Motueka will also help to extend the Motueka supplytransformers’ n-1 real power capacity for the forecast period and beyond (see Section15.8.4).15.10 Nelson-Marlborough generation proposals and opportunitiesThis section details relevant regional issues for selected generation proposals underinvestigation by developers and in the public domain, or other generationopportunities.The maximum generation that can be connected depends on several factors andusually falls within a range. Generation developers should consult with us at an earlystage of their investigations to discuss connection issues. See our website for moreinformation about connecting generation. 13615.10.1 Maximum regional generationMaximum generation estimates assume a light South Island load profile, and thathigh generation in the Nelson-Marlborough region (with Cobb generating 27 MW).136 http://www.transpower.co.nz/connecting-new-generation.<strong>2012</strong> <strong>Annual</strong> <strong>Planning</strong> <strong>Report</strong> © <strong>Transpower</strong> New Zealand Limited <strong>2012</strong>. All rights reserved. 247
Chapter 15: Nelson-Marlborough RegionFor generation connected at the Stoke 220 kV bus, the maximum generation that canbe injected under n-1 is approximately 380 MW. The constraint is due to the 220 kVKikiwa–Stoke circuit overloading when the other circuit is out of service.Generation up to approximately 150 MW can be connected at the Blenheim 110 kVbus, or to the two 110 kV Blenheim–Stoke circuits. Higher levels of generation(approximately 170 MW generation injection under n-1) requires a protection upgradeon the Blenheim–Stoke 1 circuit. Further increases require a thermal upgrade of the110 kV Blenheim–Argyle–Kikiwa circuit.15.10.2 Generation on the Blenheim–Argyle–Kikiwa circuitBlenheim–Argyle–Kikiwa is a single 110 kV circuit rated at 56/68 MVA. Themaximum generation that can be connected to this circuit depends on the location ofthe connection. With all circuits in service, approximately 50 MW can be connected,in addition to the existing generation injected at Argyle. Generation levels above thiswill need to be embedded within the Marlborough Lines network. Generationrestrictions may also be needed for some outages. Alternatively, increasing therating of the circuit is also technically possible.15.10.3 Generation connection to the 66 kV networkThe existing Cobb hydro generation station is already connected to the 66 kVtransmission network, and its output must occasionally be constrained if a circuit isout of service or to prevent overloading of the Stoke 110/66 kV transformer.Approximately 10 MW of additional generation can be connected if controls areinstalled to automatically reduce generation for some outages, and the Stoke110/66 kV transformer capacity is increased. The 66 kV transmission lines have avariety of conductor types and ratings. Thermally upgrading or replacing the sectionswith the lowest capacities allows an additional 15-30 MW of generation before theremaining sections require upgrading.248<strong>2012</strong> <strong>Annual</strong> <strong>Planning</strong> <strong>Report</strong> © <strong>Transpower</strong> New Zealand Limited <strong>2012</strong>. All rights reserved.
Chapter 16: West Coast Region16 West Coast Regional Plan16.1 Regional overview16.2 West Coast transmission system16.3 West Coast demand16.4 West Coast generation16.5 West Coast significant maintenance work16.6 Future West Coast projects summary and transmission configuration16.7 Changes since the 2011 <strong>Annual</strong> <strong>Planning</strong> <strong>Report</strong>16.8 West Coast transmission capability16.9 Other regional items of interest16.10 West Coast generation proposals and opportunities16.1 Regional overviewThis chapter details the West Coast regional transmission plan. We base thisregional plan on an assessment of available data, and welcome feedback to improveits value to all stakeholders.Figure 16-1: West Coast region<strong>2012</strong> <strong>Annual</strong> <strong>Planning</strong> <strong>Report</strong> © <strong>Transpower</strong> New Zealand Limited <strong>2012</strong>. All rights reserved. 249
Chapter 16: West Coast RegionThe West Coast region includes a mix of provincial towns (Dobson, Greymouth,Hokitika), and smaller, lower-growth rural localities.We have assessed the West Coast region’s transmission needs over the next 15years while considering longer-term development opportunities. Specifically, thetransmission network needs to be flexible to respond to a range of future service andtechnology possibilities, taking into consideration:the existing transmission networkforecast demandforecast generationequipment replacement based on condition assessment, andpossible technological development.16.2 West Coast transmission systemThis section highlights the state of the West Coast regional transmission network.The existing transmission network is set out geographically in Figure 16-1 andschematically in Figure 16-2.Figure 16-2: West Coast transmission schematic16.2.1 Transmission into the regionThe West Coast region is connected to the National Grid via a 220/110 kVinterconnection at Kikiwa and two 66 kV circuits from Coleridge. The 220/110 kVinterconnection at Kikiwa is effectively operating in parallel with the transformer atStoke.250<strong>2012</strong> <strong>Annual</strong> <strong>Planning</strong> <strong>Report</strong> © <strong>Transpower</strong> New Zealand Limited <strong>2012</strong>. All rights reserved.
Chapter 16: West Coast RegionThe regional generation is lower than the regional demand. Most of the regional loadis supplied from remote generation in the Waitaki Valley, with significant load off-takein the South Canterbury and Canterbury regions.16.2.2 Transmission within the regionThe transmission within the region:comprises 110 kV and 66 kV transmission circuits, with two 110/66 kVinterconnecting transformers at Dobsonconnects to the rest of the National Grid through two 220/110 kV interconnectingtransformers at Kikiwa (one on standby) and two 66 kV circuits at Coleridge, andderives reactive support from a STATCOM at Kikiwa and capacitor banks atGreymouth and Hokitika.Most of the assets at Orowaiti, Reefton, Atarau, Greymouth, and Hokitika are ownedby the associated local lines company (Westpower or Buller Network).The West Coast load is mostly supplied from the northern infeed, with power flowingthrough the region via the:110 kV circuits from Kikiwa to Dobson via Inangahua, and110 kV spur from Inangahua to Westport via Orowaiti.The second 110 kV Inangahua–Reefton–Dobson circuit and a new interconnectingtransformer at Dobson were recently commissioned to reinforce the 110 kVtransmission network from the northern infeed.Some loads are fed from the south via low capacity 66 kV circuits from Coleridge,which also provide significant support to the region.16.2.3 Longer-term development pathThe 220/110 kV interconnection at Kikiwa is effectively operating in parallel with thetransformer at Stoke. In the longer term, transformer capacity needs to be increasedat Kikiwa and/or Stoke to meet load growth and transmission security requirements tothe West Coast region.Possible transmission reinforcement via a third 110 kV circuit connecting betweenKikiwa and Inangahua, additional reactive support, 66 kV transmissionreconfiguration (Kawhaka bonding), and Dobson–Greymouth capacity upgrades maybe required to support the load growth and transmission security in the West Coastregion in the longer term.The above system developments may also be required for generation developments.If there is a significant increase in generation, then some of the circuits betweenKikiwa and Inangahua may need to be operated at 220 kV.16.3 West Coast demandThe after diversity maximum demand (ADMD) for the West Coast region is forecast togrow on average by 2.7% annually over the next 15 years, from 70 MW in <strong>2012</strong> to104 MW by 2027. This is higher than the national average demand growth of 1.7%annually.Figure 16-3 shows a comparison of the 2011 and <strong>2012</strong> forecast 15-year maximumdemand (after diversity 137 ) for the West Coast region. The forecasts are derivedusing historical data, and modified to account for customer information, where137 The after diversity maximum demand (ADMD) for the region will be less than the sum of theindividual grid exit points peak demands, as it takes into account the fact that the peak demand doesnot occur simultaneously at all the grid exit points in the region.<strong>2012</strong> <strong>Annual</strong> <strong>Planning</strong> <strong>Report</strong> © <strong>Transpower</strong> New Zealand Limited <strong>2012</strong>. All rights reserved. 251
Chapter 16: West Coast Regionappropriate. The power factor at each grid exit point is also derived from historicaldata, and is used to calculate the real power capacity for power transformer andtransmission line. See Chapter 4 for more information about demand forecasting.Figure 16-3: West Coast region after diversity maximum demand forecastLoad (MW)140West Coast1201008060402011 APR Forecast20<strong>2012</strong> APR ForecastActual Peak01997 1999 2001 2003 2005 2007 2009 2011 2013 2015 2017 2019 2021 2023 2025 2027Table 16-1 lists forecast peak demand (prudent growth) for each grid exit point in theWest Coast region for the forecast period, as required for the Grid Reliability <strong>Report</strong>.Table 16-1: Forecast annual peak demand (MW) at West Coast grid exit points to 2027Grid exitpointPowerfactorNext 5 yearsPeak demand (MW)5-15 years out<strong>2012</strong> 2013 2014 2015 2016 2017 2019 2021 2023 2025 2027Arthur’s Pass 0.99 0.5 0.5 0.5 0.5 0.5 0.5 0.5 0.5 0.5 0.5 0.5Atarau 1 1.00 1.0 11.0 11.0 11.0 11.0 11.0 11.0 11.0 11.0 11.0 11.0Castle Hill 1.00 0.9 0.9 0.9 0.9 0.9 0.9 0.9 0.9 0.9 0.9 0.9Dobson 2 0.98 16.0 16.3 16.6 20.9 21.2 21.5 26.1 26.6 27.2 27.7 28.0Greymouth 0.98 15.0 15.3 15.6 15.9 16.2 16.6 17.2 17.8 18.4 18.9 19.3Hokitika 3 0.98 16.8 17.0 19.8 20.0 20.3 20.5 21.0 21.5 21.9 22.4 22.7Kikiwa 0.99 3.0 3.0 3.0 3.0 3.0 3.0 3.0 3.0 3.0 3.0 3.0Kumara 0.95 2.0 2.0 2.0 2.0 2.0 2.0 2.0 2.0 2.0 2.0 2.0Murchison 0.99 3.0 3.0 3.0 3.0 3.0 3.0 3.0 3.0 3.0 3.0 3.0Orowaiti 4 1.00 11.0 19.2 19.3 19.5 19.7 19.9 20.2 20.5 20.9 21.2 21.4Otira 0.78 0.9 0.9 0.9 0.9 0.9 1.9 1.9 1.9 1.9 1.9 1.9Reefton 0.99 11.0 11.2 11.4 11.7 11.9 12.1 12.6 13.1 13.5 13.9 14.2Westport 0.96 10.2 10.3 10.5 10.6 10.8 10.9 11.3 11.6 11.9 12.2 12.41. The customer advised of a possible load increase in 2013.2. The customer advised of a possible load increase in 2015 and 2019.3. The customer advised of a possible load increase in 2014.4. The customer advised of a possible new load in 2013.252<strong>2012</strong> <strong>Annual</strong> <strong>Planning</strong> <strong>Report</strong> © <strong>Transpower</strong> New Zealand Limited <strong>2012</strong>. All rights reserved.
Chapter 16: West Coast Region16.4 West Coast generationThe West Coast region’s generation capacity is 20 MW, which is lower than the localdemand and the deficit is imported through the National Grid.Table 16-2 lists the generation forecast for each grid injection point in the West Coastregion for the forecast period, as required for the Grid Reliability <strong>Report</strong>. This includesall known generation stations including those embedded within the relevant local linescompany’s network (Westpower, Buller Networks, Network Tasman, or Orion) 138 .Kumara does not have significant water storage but is expected to supply a minimumof 2 MW during summer peaks. The construction of the 6 MW Amethyst hydroproject is currently underway and is expected to be operational by 2013.Table 16-2: Forecast annual generation capacity (MW) at West Coast grid injectionpoints to 2027 (including existing and committed generation)Grid injectionpoint (location ifembedded)Next 5 yearsGeneration capacity (MW)5-15 years out<strong>2012</strong> 2013 2014 2015 2016 2017 2019 2021 2023 2025 2027Dobson (Arnold) 3 3 3 3 3 3 3 3 3 3 3Hokitika(Amethyst)Hokitika (McKaysCreek)Hokitika (Wahapo-Okarito Forks)0 6 6 6 6 6 6 6 6 6 61 1 1 1 1 1 1 1 1 1 13 3 3 3 3 3 3 3 3 3 3Kumara (Kumara1 10 10 10 10 10 10 10 10 10 10 10and Dillmans)Kumara (HokitikaDiesel)3 3 3 3 3 3 3 3 3 3 31. Kumara and Dillmans share the same water and are offered into the market as a single 10 MWgenerator.16.5 West Coast significant maintenance workOur capital project and maintenance works are integrated to enable system issues tobe resolved if possible when assets are replaced or refurbished. Table 16-3 lists thesignificant maintenance-related work 139 proposed for the West Coast region for thenext 15 years that may significantly impact related system issues or connectedparties.Table 16-3: Proposed significant maintenance workDescription Tentative year Related system issuesArthur’s Pass supplytransformer expected end-oflifeCastle Hill supply transformerexpected end-of-lifeMurchison supply transformerexpected end-of-life2013-2015 No n-1 security at Arthur’s Pass. Future investmentwill be customer-driven. See Section 16.8.2 for moreinformation.<strong>2012</strong>-2014 No n-1 security at Castle Hill. Future investment willbe customer-driven. See Section 16.8.5 for moreinformation.2016-2018 No n-1 security at Murchison. Future investment willbe customer-driven. See Section 16.8.7 for moreinformation.138 Only generators with capacity greater than 1 MW are listed. Generation capacity is rounded to thenearest megawatt.139 This may include replacement of the asset due to its condition assessment.<strong>2012</strong> <strong>Annual</strong> <strong>Planning</strong> <strong>Report</strong> © <strong>Transpower</strong> New Zealand Limited <strong>2012</strong>. All rights reserved. 253
Chapter 16: West Coast Region16.6 Future West Coast projects summary and transmission configurationTable 16-4 lists projects to be carried out in the West Coast region within the next 15years.Figure 16-4 shows the possible configuration of West Coast transmission in 2027,with new assets, upgraded assets and assets undergoing significant maintenancewithin the forecast period.Table 16-4: Projects in the West Coast region up to 2027Site Projects StatusArthur’s Pass Replace supply transformer. Base CapexCastle Hill Replace supply transformer. Base CapexDobsonInangahua–Murchison–KikiwaResolve protection limits on the supply transformers.Replace supply transformers with higher-rated units.Install new capacitors.Increase the line thermal capacity.Base CapexPossiblePossiblePossibleKikiwa Replace Kikiwa T1 with a higher-rated unit. PossibleMurchison Replace supply transformer. Base CapexFigure 16-4: Possible West Coast transmission configuration in 2027NELSON - MARLBOROUGHStoke Argyle Stoke110 kVSTC11 kVWaimangaroa110 kV220 kVKikiwaWestport110 kVOrowaiti110 kVInangahua11 kVMurchisonIslingtonCANTERBURY11 kV 110 kVGreymouthAtarau110 kV11 kV33 kVReefton11 kV66 kV*Dobson33 kV66 kVKEYHokitika11 kV66 kVKumaraNEW ASSETSUPGRADED ASSETSASSETS SCHEDULEDFOR REPLACEMENTMINOR UPGRADE*66 kVOtira66 kV66 kVArthur’s PassCastle Hill66 kVColeridgeCANTERBURY16.7 Changes since the 2011 <strong>Annual</strong> <strong>Planning</strong> <strong>Report</strong>Table 16-5 lists the specific issues that are either new or no longer relevant within theforecast period when compared to last year's report.254<strong>2012</strong> <strong>Annual</strong> <strong>Planning</strong> <strong>Report</strong> © <strong>Transpower</strong> New Zealand Limited <strong>2012</strong>. All rights reserved.
Chapter 16: West Coast RegionTable 16-5: Changes since 2011IssuesWest Coast 110 kV and 66 kV transmissionsecurityKikiwa interconnecting transformer capcityWest Coast low voltageHokitika transmission capacityChangeRemoved. This is no longer an issue with thecommissioning of Hokitika capacitors and thesecond Dobson–Reefton circuit.New issue.New issue.New issue.16.8 West Coast transmission capabilityTable 16-6 summarises issues involving the West Coast region for the next 15 years.For more information about a particular issue, refer to the listed section number.Table 16-6: West Coast region transmission issuesSectionnumberIssueRegional16.8.1 Inangahua–Murchison–Kikiwa transmission capacity16.8.2 Kikiwa interconnecting transformer capacity16.8.3 West Coast low voltageSite by grid exit point16.8.4 Arthur’s Pass transmission and supply security16.8.5 Castle Hill transmission and supply security16.8.6 Dobson supply transformer capacity16.8.7 Hokitika transmission capacity16.8.8 Murchison transmission and supply security16.8.9 Otira supply security16.8.1 Inangahua–Murchison–Kikiwa transmission capacityProject context:Modelled project in the West Coast Grid Upgrade Plan (approved in July2008). Commission cost recovery approval has not yet been sought.Project reference: IGH_KIK-TRAN-EHMT-01Project status/purpose: Possible, to meet the Grid Reliability Standard (not core grid)Indicative timing: 2017Indicative cost band: Thermal upgrade: ASpecial protection scheme: To be advisedIssueThere are two parallel 110 kV circuits between Inangahua and Kikiwa, which includethe:110 kV Inangahua–Murchison–Kikiwa circuit, rated at 56/68 MVA(summer/winter), and110 kV Inangahua–Kikiwa 2 circuit, rated at 92/101 MVA (summer/winter).An outage of the 110 kV Inangahua–Kikiwa 2 circuit will cause:the parallel 110 kV Inangahua–Murchison–Kikiwa circuit to overload fromapproximately 2017, andlow voltage at the West Coast 110 kV bus from approximately 2021 (see Section16.8.3 for more information).<strong>2012</strong> <strong>Annual</strong> <strong>Planning</strong> <strong>Report</strong> © <strong>Transpower</strong> New Zealand Limited <strong>2012</strong>. All rights reserved. 255
Chapter 16: West Coast RegionSolutionPossible options to resolve the transmission capacity issue include:thermally upgrading the 110 kV Inangahua–Murchison–Kikiwa circuit, ora special protection scheme to trip load post-contingency.The preferred option is to thermally upgrade the 110 kV Inangahua–Murchison–Kikiwa circuit. However, initial application of the Grid Investment Test indicates thatthis option has no overall economic benefit. We are investigating other options toresolve this issue.See 16.8.3 for possible options to resolve the low voltage issue.Easements may be required for some parts of the thermal upgrade project.16.8.2 Kikiwa interconnecting transformer capacityProject status/purpose:This issue is for information onlyIssueThere are two 220/110 kV interconnecting transformers at Kikiwa, T1 and T2 rated at50 MVA and 150 MVA, respectively. The normal operating arrangement is to haveKikiwa T1 supply the local 11 kV load only and Kikiwa T2 provide a 110 kVinterconnection to the West Coast region. Kikiwa T2 also operates in parallel with a150 MVA interconnecting transformer at Stoke (Nelson-Marlborough region) due tothe 110 kV network connections between them.The loss of one 150 MVA interconnecting transformer at Stoke will cause the Kikiwainterconnecting transformer to overload under certain conditions, including acombination of:regional peak loads, andlow generation in the West Coast and Nelson-Marlborough regions.SolutionThis issue can be managed operationally by Cobb and Kumara generation within theforecast period. <strong>Transpower</strong> will work with the generators to manage this constraint.A possible longer-term option is to replace Kikiwa T1 with a higher-rated transformerand operate in parallel with Kikiwa T2 and the interconnecting transformer at Stoke.16.8.3 West Coast low voltageProject reference: WCST-REA_SUP-DEV-01Project status/purpose: Possible, to meet the Grid Reliability Standard (not core grid)Indicative timing: 2021Indicative cost band: New capacitors: ASpecial protection scheme: To be advisedIssueLow voltage will occur at the Atarau 110 kV bus following an outage of a:110 kV Inangahua–Kikiwa 2 circuit from 2021, orKikiwa T2 interconnecting transformer from 2024.The low voltage issue progressively arises at other buses with increasing load in theWest Coast region.256<strong>2012</strong> <strong>Annual</strong> <strong>Planning</strong> <strong>Report</strong> © <strong>Transpower</strong> New Zealand Limited <strong>2012</strong>. All rights reserved.
Chapter 16: West Coast RegionSolutionWe are investigating options to mitigate the low voltage issues. A local voltagequality agreement may be appropriate in the short term for 110 kV voltages. Possibletransmission solutions include:installing new capacitors at West Coasta special protection scheme to shed load post contingency, andreplacing Kikiwa T1 with a higher-rated transformer and operate in parallel withthe Kikiwa T2 interconnecting transformer (this option also resolves the Kikiwainterconnecting transformer capacity issue described in Section 16.8.2).16.8.4 Arthur’s Pass transmission and supply securityProject status/purpose:This issue is for information onlyIssueThe two circuits supplying Arthur’s Pass do not have circuit breakers at Arthur’s Pass.A fault on either circuit will cause a loss of supply to Arthur’s Pass, resulting in no n-1security.Additionally, a single 66/11 kV, 3 MVA transformer supplies load at Arthur’s Passresulting in no n-1 security. This transformer is also approaching its expected end-oflifewithin the next five years.SolutionThe lack of n-1 security can be managed operationally. There is a non-contractedon-site spare transformer, allowing possible replacement within 8-14 hours followinga unit failure (if the spare unit is available). However, we will discuss options withOrion for increasing security and coordinating outages to minimise supplyinterruptions when replacing this transformer.16.8.5 Castle Hill transmission and supply securityProject status/purpose:This issue is for information onlyIssueThe two circuits supplying Castle Hill do not have line protection to clear faults. Afault on either circuit will cause a loss of supply to Castle Hill, resulting in no n-1security.Additionally, a single 66/11 kV, 3.75 MVA transformer supplies load at Castle Hillresulting in no n-1 security. This transformer is also approaching its expected end-oflifewithin the next five years.SolutionThe lack of n-1 security can be managed operationally. There is a non-contractedon-site spare transformer, allowing possible replacement within 8 to 14 hoursfollowing a unit failure (if the spare unit is available). However, we will discuss withOrion options for increasing security and coordinating outages to minimise supplyinterruptions when replacing this transformer.16.8.6 Dobson supply transformer capacityProject reference:Project status/purpose:Upgrade protection: DOB-POW_TFR_PTN-EHMT-01Upgrade transformer capacity: DOB-POW_TFR-EHMT-01Upgrade protection: Base Capex, minor enhancementUpgrade transformer capacity: possible, customer-specific<strong>2012</strong> <strong>Annual</strong> <strong>Planning</strong> <strong>Report</strong> © <strong>Transpower</strong> New Zealand Limited <strong>2012</strong>. All rights reserved. 257
Chapter 16: West Coast RegionIndicative timing: Upgrade protection: 2014Upgrade transformer capacity: 2015-2017Indicative cost band: Upgrade protection: AUpgrade transformer capacity: BIssueTwo 66/33 kV transformers supply Dobson’s load, providing:a nominal installed capacity of 40 MVA, andn-1 capacity of 17/17 MVA 140 (summer/winter).The peak load at Dobson is forecast to exceed the transformers’ n-1 winter capacityby approximately 1 MW in 2014, increasing to approximately 12 MW in 2027 (seeTable 16-7). This forecast makes the assumption that Arnold generation is 3 MW. IfArnolad generation decreases, the issue may arise earlier.Table 16-7: Dobson supply transformer overload forecastGrid exitpointPowerfactorNext 5 yearsTransformer overload (MW)5-15 years out<strong>2012</strong> 2013 2014 2015 2016 2017 2019 2021 2023 2025 2027Dobson 0.98 0 0 1 5 5 6 10 11 11 12 12SolutionResolving the transformers’ protection and LV cable limits will provide sufficient n-1capacity until 2018. We will look into raising the protection limits which will resolvethe overload issue until 2015.Possible longer-term options include increasing the embedded generation at Dobsonwhich we are discussing with Westpower and Trustpower. Operational measures orreplacing the existing supply transformers with two 40 MVA units are also possiblelonger-term options.Future investment will be customer driven.16.8.7 Hokitika transmission capacityProject status/purpose:This issue is for information onlyIssueTwo circuits supply the Hokitika grid exit point:Hokitika–Kumara rated at 27/32 MVA (summer/winter), andHokitika–Otira rated at 27/32 MVA (summer/winter)An outage of one circuit will cause the other to exceed its thermal capacity whenKumara generation is low.The 66 kV line from Coleridge to Kumara is predominantly strung with a copperconductor, and therefore cannot be thermally upgraded.SolutionThis issue can be managed operationally by Kumara generation within the forecastperiod.140 The transformers’ capacity is limited by protection equipment, followed by the LV cable (21 MVA)limits; with these limits resolved, the n-1 capacity will be 22/23 MVA (summer/winter).258<strong>2012</strong> <strong>Annual</strong> <strong>Planning</strong> <strong>Report</strong> © <strong>Transpower</strong> New Zealand Limited <strong>2012</strong>. All rights reserved.
Chapter 16: West Coast Region<strong>Transpower</strong> is also investigating an option to upgrade the 66 kV transmission networkby bonding the copper circuits around Hokitika and Kumara, resulting in two highercapacitycircuits to Hokitika.16.8.8 Murchison transmission and supply securityProject status/purpose:This issue is for information onlyIssueThe two circuits supplying Murchison do not have any circuit breakers at Murchison.A fault on either circuit will cause a loss of Murchison’s supply resulting in no n-1security.There is a short loss of supply whenever the circuits supplying Murchison areswitched for maintenance.Additionally, a single 110/11 kV, 5 MVA transformer supplies load at Murchisonresulting in no n-1 security. This transformer has an expected end-of-life within theforecast period.SolutionThe lack of n-1 security can be managed operationally. We are investigating optionsto mitigate loss of supply to Murchison during switching for line maintenance. We willalso discuss options with Network Tasman for increasing security and coordinatingoutages to minimise supply interruptions when replacing the Murchison supplytransformer.16.8.9 Otira supply securityProject status/purpose:This issue is for information onlyIssueA single 66/11 kV, 2.5 MVA transformer supplies load at Otira resulting in no n-1security. Load growth is not forecast to exceed the transformer rating within theforecast period.SolutionThere is a non-contracted on-site spare transformer, allowing possible replacementwithin 8-14 hours following a unit failure (if the spare unit is available). The lack ofn-1 security can be managed operationally.16.9 Other regional items of interestThere are no other items of interest identified to date beyond those set out inSection 16.8. See Section 16.10 for information about generation proposals relevantto this region.16.10 West Coast generation proposals and opportunitiesThis section details relevant regional issues for selected generation proposals underinvestigation by developers and in the public domain, or other generationopportunities.The maximum generation that can be connected depends on several factors andusually falls within a range. Generation developers should consult with us at an early<strong>2012</strong> <strong>Annual</strong> <strong>Planning</strong> <strong>Report</strong> © <strong>Transpower</strong> New Zealand Limited <strong>2012</strong>. All rights reserved. 259
Chapter 16: West Coast Regionstage of their investigations to discuss connection issues. See our website for moreinformation about connecting generation. 14116.10.1 Maximum regional generationMaximum generation estimates assume a South Island light load profile and that thegeneration in the West Coast region is high (with Kumara generating 10 MW).For generation connected at the Kikiwa 220 kV bus, the maximum generation thatcan be injected under n-1 is approximately 800 MW. The constraint is the Islington–Kikiwa 3 circuit when either one of the other two circuits connecting Islington andKikiwa is out of service.The estimate for maximum generation injection at the Kikiwa 110 kV bus and theInangahua 110 kV bus assumes West Coast load of 53 MW, and the maximumgeneration that can be injected under n and n-1 is approximately:285 MW and 135 MW, respectively, at the Kikiwa 110 kV bus, with the constraintbeing due to the Kikiwa interconnecting transformer overloading, and 110 kVKikiwa–Stoke circuit overloading when the Kikiwa interconnecting transformer isout of service.165 MW and 95 MW, respectively, at the Inangahua 110 kV bus, with theconstraint being due to the 110 kV Inangahua–Murchison–Kikiwa 1 circuitoverloading under an n condition, and under an n-1 condition when the otherInangahua–Kikiwa 2 circuit is out of service.Depending on the point of connection, generation connection on the West Coast66 kV transmission network may be constrained by several low capacity 66 kVcircuits.16.10.2 Generation connected to the Waimangaroa 110 kV busTwo circuits connect Waimangaroa to Inangahua and the rest of the National Grid.The Inangahua–Waimangaroa 1 circuit is rated at 101/111 MVA (summer/winter),and has a higher rating than the Inangahua–Waimangaroa 2 circuit, which is rated at56/68 (summer/winter). There is also a lower rating circuit connecting betweenInangahua and Kikiwa.Depending on the amount of generation connected at the Waimangaroa 110 kV bus,it may be necessary to:join the Waimangaroa 110 kV businstall a special protection scheme to allow unconstrained generation injection,and/orincrease the circuit capacity between Waimangaroa, Inangahua, and Kikiwa.141 http://www.transpower.co.nz/connecting-new-generation.260<strong>2012</strong> <strong>Annual</strong> <strong>Planning</strong> <strong>Report</strong> © <strong>Transpower</strong> New Zealand Limited <strong>2012</strong>. All rights reserved.
Chapter 17: Canterbury Region17 Canterbury Regional Plan17.1 Regional overview17.2 Canterbury transmission system17.3 Canterbury demand17.4 Canterbury generation17.5 Canterbury significant maintenance work17.6 Future Canterbury projects summary and transmission configuration17.7 Changes since the 2011 <strong>Annual</strong> <strong>Planning</strong> <strong>Report</strong>17.8 Canterbury transmission capability17.9 Other regional items of interest17.10 Canterbury generation proposals and opportunities17.1 Regional overviewThis chapter details the Canterbury regional transmission plan. We base this regionalplan on an assessment of available data, and welcome feedback to improve its valueto all stakeholders.Figure 17-1: Canterbury region<strong>2012</strong> <strong>Annual</strong> <strong>Planning</strong> <strong>Report</strong> © <strong>Transpower</strong> New Zealand Limited <strong>2012</strong>. All rights reserved. 261
Chapter 17: Canterbury RegionThe Canterbury region load includes Christchurch together with smaller rurallocalities.We have assessed the Canterbury region’s transmission needs over the next 15years while considering longer-term development opportunities. Specifically, thetransmission network needs to be flexible to respond to a range of future service andtechnology possibilities, taking into consideration:the existing transmission networkforecast demandforecast generationequipment replacement based on condition assessment, andpossible technological development.17.2 Canterbury transmission systemThis section highlights the state of the Canterbury regional transmission network. Theexisting transmission network is set out geographically in Figure 17-1 andschematically in Figure 17-2.Figure 17-2: Canterbury transmission schematicKEYNELSON - MARLBOURGHKikiwaKikiwa66 kV66 kV 33 kVKaikoura220kV CIRCUIT66kV CIRCUITSUBSTATION BUSTRANSFORMERTEE POINT33 kVCulverdenLines company assets1 May <strong>2012</strong>LOADCAPACITORWaipara33 kV3 WDG TRANSFORMERREACTORGENERATORSC SYNCHRONOUS CONDENSERsvc STATIC VAR COMPENSATORWEST COASTOtira Castle HillAshley66 kV11 kV66 kVSouthbrook33 kV66 kV66 kV Papanui11 kV11 kV66 kVKaiapoiLines company assets1 June <strong>2012</strong>Middleton66 kV Addington11 kVColeridge66 kV11 kV66 kV 33 kVHororata66 kVSCSCSVCIslingtonSVC11 kV66 kV33 kV220 kVBromley220 kV11 kV66 kVTekapo BLivingstoneSOUTH CANTERBURYTwizelAshburton66 kV66 kV220 kV33 kV33 kVSpringston17.2.1 Transmission into the regionThe Canterbury region has some of the highest load densities in the South Island,coupled with relatively low levels of local generation. As Canterbury’s peak electricitydemand is supplied by generation located in the South Canterbury region,transmission is necessary to keep power flowing into and through the region to thetop of the South Island.262<strong>2012</strong> <strong>Annual</strong> <strong>Planning</strong> <strong>Report</strong> © <strong>Transpower</strong> New Zealand Limited <strong>2012</strong>. All rights reserved.
Chapter 17: Canterbury Region17.2.2 Transmission within the regionFrom the Waitaki Valley, the region is supplied by four 220 kV transmission circuits,three from Twizel and one from Livingstone. The transmission network within thisregion comprises 220 kV and 66 kV transmission circuits, with 220 kV to 66 kVinterconnections at Islington, Bromley, Culverden 142 , and Waipara.There are eight 220/66 kV interconnecting transformers: two at Bromley, three atIslington, two at Waipara, and one at Culverden.Reactive support for the region (and grid backbone) is provided by:synchronous condensers, static var compensators, and capacitor banks atIslingtoncapacitor banks at Bromley, anda single 33 Mvar capacitor at Southbrook.We have a number of projects planned or underway to support demand growth andsupply security in the Canterbury region.We have improved the dynamic voltage support and reactive power management inthe region, and the upper South Island by installing a new static var compensator(SVC) at Islington, and a reactive power controller in the Christchurch area.17.2.3 Longer-term development pathWe are investigating transmission capacity enhancement and future reactive supportrequirements in the Canterbury and Upper South Island to increase both thermalconstraints and voltage stability limits. This is to ensure that the Canterbury hassecure transmission into and through the region, as demand continues to grow.Beyond the next 30 years, new transmission capacity may be required into theCanterbury region. The new capacity may be provided by a new 220 kV line, HVDCtap-off or the refurbishment of the existing lines. New generation in the Upper SouthIsland or demand-side response may defer transmission investment.17.3 Canterbury demandThe after diversity maximum demand (ADMD) for the Canterbury region is forecast togrow on average by 2.0% annually over the next 15 years, from 817 MW in <strong>2012</strong> to1,103 MW by 2027. This is higher than the national average demand growth of 1.7%annually. The Christchurch earthquakes during 2011 caused a 10-15% reduction inpeak demand. The extreme snow storm during the winter of 2011 masked thereduction in demand, and winter load in <strong>2012</strong> is expected to be down given normalwinter conditions. When the Christchurch earthquake recovery plan becomes clearerour forecast will be adjusted accordingly.Figure 17-3 shows a comparison of the 2011 and <strong>2012</strong> forecast 15-year maximumdemand (after diversity 143 ) for the Canterbury region. The forecasts are derived usinghistorical data, and modified to account for customer information, where appropriate.The power factor at each grid exit point is also derived from historical data, and isused to calculate the real power capacity for power transformer and transmission line.See Chapter 4 for more information about demand forecasting.142 At Culverden, the 220 kV to 66 kV interconnection is done in two stages, via:two 220/33 kV transformers, stepping down the voltage to supply the local load, andone 33/66 kV transformer stepping the voltage back up to 66 kV to supply Kaikoura.143 The after diversity maximum demand (ADMD) for the region will be less than the sum of theindividual grid exit point peak demands, as it takes into account the fact that the peak demand doesnot occur simultaneously at all the grid exit points in the region.<strong>2012</strong> <strong>Annual</strong> <strong>Planning</strong> <strong>Report</strong> © <strong>Transpower</strong> New Zealand Limited <strong>2012</strong>. All rights reserved. 263
Chapter 17: Canterbury RegionFigure 17-3: Canterbury region after diversity maximum demand forecastLoad (MW)1200Canterbury110010009008007006002011 APR Forecast500<strong>2012</strong> APR ForecastActual Peak4001997 1999 2001 2003 2005 2007 2009 2011 2013 2015 2017 2019 2021 2023 2025 2027Table 17-1 lists forecast peak demand (prudent growth) for each grid exit point for theforecast period, as required for the Grid Reliability <strong>Report</strong>.Table 17-1: Forecast annual peak demand (MW) at Canterbury grid exit points to 2027Grid exit pointPowerfactorNext 5 yearsPeak demand (MW)5-15 years out<strong>2012</strong> 2013 2014 2015 2016 2017 2019 2021 2023 2025 2027Addington 11 kV -1 1 0.99 35 37 38 40 41 41 42 35 36 37 38Addington 11 kV -2 1 0.99 25 26 27 28 28 29 29 24 25 26 26Addington 66 kV 1 0.99 133 138 142 145 148 150 149 136 139 143 146Ashburton 33 kV 2 0.92 55 56 29 29 30 15 16 8 9 9 9Ashburton 66 kV 2 0.92 133 137 149 154 158 167 176 187 194 201 207Ashley 3 0.87 12 12 13 22 23 23 24 25 26 27 28Bromley 11 kV 0.99 56 58 60 61 62 63 61 63 65 67 69Bromley 66 kV 1 1.00 171 183 188 194 198 199 209 294 301 308 315Coleridge 0.99 1 1 1 1 1 1 1 1 1 1 1Culverden 33 kV 4 0.97 21 21 22 25 26 27 28 29 30 31 32Culverden 66 kV 0.99 10 10 10 11 11 11 12 12 12 13 13Hororata 33 kV 5 0.95 31 25 25 25 26 19 19 20 20 21 21Hororata 66 kV 5 0.96 27 42 32 32 36 44 44 45 46 46 47Islington 33 kV 0.97 73 75 76 78 79 81 84 87 89 92 94Islington 66 kV 6 0.99 128 129 135 152 154 156 159 162 165 168 171Islington 66 kV –1 0.99 113 112 112 113 114 115 118 82 83 84 86PapanuiKaiapoi 0.99 29 29 30 30 31 32 33 34 35 36 37Middleton 0.97 30 31 31 32 33 33 35 36 37 38 39Southbrook 3,7 0.95 43 45 46 39 40 41 43 45 47 49 51Springston 33 kV 5 0.99 43 34 34 36 38 33 34 35 36 37 38264<strong>2012</strong> <strong>Annual</strong> <strong>Planning</strong> <strong>Report</strong> © <strong>Transpower</strong> New Zealand Limited <strong>2012</strong>. All rights reserved.
Chapter 17: Canterbury RegionGrid exit pointPowerfactorNext 5 yearsPeak demand (MW)5-15 years out<strong>2012</strong> 2013 2014 2015 2016 2017 2019 2021 2023 2025 2027Springston 66 kV 5 0.99 21 32 48 49 50 58 61 64 66 69 72Waipara 33 kV 8 0.96 13 13 14 14 14 22 23 23 24 24 24Waipara 66 kV 0.97 12 13 13 13 13 14 14 15 15 16 161. The customer has indicated load shifts planned for 2020 from Addington 11 kV, Addington 66 kV,Papanui 11 kV and Papanui 66 kV to Bromley 66 kV.2. This forecast includes allowance for strong growth including some migration of load fromChristchurch, load switching between Ashburton 33 kV and Ashburton 66 kV and a staged migrationfrom Ashburton 33 kV over 2014 to 2021.3. Ashley load will increase from 2015, with the addition load transferred from Southbrook.4. The customer indicates an expected irrigation load increase in 2015.5. The customer provided this forecast.6. The customer advised the step change to Islington 66 kV in 2015 is due to the creation of a newzone sub "Waimakariri" which will pick up some load from Papanui 11 kV and Islington 33 kV.7. The customer indicates an expected irrigation load increase in <strong>2012</strong>.8. The customer indicates an expected irrigation load increase in 2017.17.4 Canterbury generationThe Canterbury region’s generation capacity is 79 MW, which is lower than localdemand and the deficit is imported through the National Grid from the Waitaki valley.Table 17-2 lists the generation forecast for each grid injection point for the forecastperiod, as required for the Grid Reliability <strong>Report</strong>. This includes all known andcommitted generation stations including those embedded within the relevant locallines company’s network (Electricity Ashburton, Orion or Mainpower). 144No new generation is known to be committed in the Canterbury region for the forecastperiod.Table 17-2: Forecast annual generation capacity (MW) at Canterbury grid injectionpoints to 2027 (including existing and committed generation)Grid injection point(location ifembedded)Next 5 yearsGeneration capacity (MW)5-15 years out<strong>2012</strong> 2013 2014 2015 2016 2017 2019 2021 2023 2025 2027Ashburton (Highbank) 25 25 25 25 25 25 25 25 25 25 25Ashburton (Montalto) 2 2 2 2 2 2 2 2 2 2 2Bromley (City Waste) 3 3 3 3 3 3 3 3 3 3 3Bromley (QE2 diesel) 4 4 4 4 4 4 4 4 4 4 4Coleridge 45 45 45 45 45 45 45 45 45 45 4517.5 Canterbury significant maintenance workOur capital project and maintenance works are integrated to enable system issues tobe resolved if possible when assets are replaced or refurbished.Table 17-3 lists the significant maintenance-related work 145 proposed for theCanterbury region that may significantly impact related system issues or connectedparties over the next 15 years.144 Only generators with a capacity greater than 1 MW are listed. Generation capacity is rounded to thenearest megawatt.145 This may include replacement of the asset due to its condition assessment.<strong>2012</strong> <strong>Annual</strong> <strong>Planning</strong> <strong>Report</strong> © <strong>Transpower</strong> New Zealand Limited <strong>2012</strong>. All rights reserved. 265
Chapter 17: Canterbury RegionTable 17-3: Proposed significant maintenance workDescriptionTentative year Related system issuesAddington 11 kV switchboard No.2replacementAddington supply transformersexpected end-of-life<strong>2012</strong>-20142023-2024Orion is planning reconfiguring its 11 kVdistribution system, which will be co-ordinatedwith the switchboard replacement. See Section17.9.4 for more information.Ashley supply transformersexpected end-of-lifeBromley 220/66 kV transformersexpected end-of-lifeBromley 66/11 kV transformer’sexpected end-of-lifeBromley 11 kV reactordecommissionHororata 33 kV outdoor to indoorconversionIslington T3 and T7 interconnectingtransformers expected-end-of-lifeIslington 33 kV outdoor to indoorconversionKaiapoi 11 KV switchgearreplacementSpringston 33 kV outdoor to indoorconversionWaipara 33 kV outdoor to indoorconversion2016-2018 The forecast load at Ashley exceeds thetransformers’ n-1 capacity from <strong>2012</strong>. SeeSection 17.8.3 for more information.2018-2020 The forecast load at Bromley exceeds thetransformers’ n-1 capacity from <strong>2012</strong>. SeeSection 17.8.4 for more information.2022-2024 No system issues are identified within theforecast period.2013-2014 No system issues are identified within theforecast period.2018-2020 No system issues are identified within theforecast period.2022-20232017-2019The peak load is forecast to exceed thetransformers’ n-1 capacity from 2019. SeeSection 17.8.1 for more information.2019-2020 No system issues are identified within theforecast period.2015-2017 No system issues are identified within theforecast period.2016-2018 No system issues are identified within theforecast period.17.6 Future Canterbury projects summary and transmission configurationTable 17-4 lists projects to be carried out in the Canterbury region within the next 15years.Figure 17-4 shows the possible configuration of Canterbury transmission in 2027,with new assets, upgraded assets, and assets undergoing significant maintenancewithin the forecast period.Table 17-4: Projects in the Canterbury region up to 2027Site Projects StatusAddingtonReplace 11 kV switchboard No.2.Replace T5, T6, and T7 supply transformers.Base CapexBase CapexAshburton Install new 220/66 kV supply transformer. PreferredAshley Replace existing supply transformers with higher-rated units. Base CapexBromleyInstall new 220/66 kV transformer.Replace existing 220/66 kV transformers.Replace existing 66/11 kV supply transformers.Dismantle 11 kV reactor.CommittedBase CapexBase CapexBase CapexCulverdenReplace 220/33 kV transformers with higher-rated 220/66 kVtransformers.PossibleHororata Convert 33 kV outdoor switchgear to an indoor switchboard. Base CapexIslingtonInstall new 220/66 kV interconnecting transformer.Replace existing 220/66 kV interconnecting transformers.Convert 33 kV outdoor switchgear to an indoor switchboard.PossibleBase CapexBase CapexKaiapoi Replace 11 kV switchgear Base CapexSouthbrook Resolve supply transformers’ branch component limits. Possible266<strong>2012</strong> <strong>Annual</strong> <strong>Planning</strong> <strong>Report</strong> © <strong>Transpower</strong> New Zealand Limited <strong>2012</strong>. All rights reserved.
Chapter 17: Canterbury RegionSite Projects StatusSpringstonInstall two new 66 kV feeders.Convert 33 kV outdoor switchgear to an indoor switchboard.New 220/66 kV grid exit point.PossibleBase CapexPossibleWaipara Convert 33 kV outdoor switchgear to an indoor switchboard. Base CapexFigure 17-4: Possible Canterbury transmission configuration in 2027NELSON - MARLBOURGHKikiwaKikiwa33 kVKEYNEW ASSETSUPGRADED ASSETSASSETS SCHEDULEDFOR REPLACEMENTMINOR UPGRADE*66 kVCulverdenWaipara33 kV66 kVAshley66 kVSouthbrook11 kV 33 kV*66 kVWEST COASTOtira Castle HillKaiapoi66 kV11 kVMiddletonAddington66 kV11 kVColeridge66 kV11 kV66 kV 33 kVHororata66 kVSVCIslingtonSVC11 kV66 kV33 kV220 kV11 kV66 kV220 kVBromleyTekapo BLivingstoneSOUTH CANTERBURYTwizel66 kVAshburton66 kV33 kVSpringston220 kV33 kV17.7 Changes since the 2011 <strong>Annual</strong> <strong>Planning</strong> <strong>Report</strong>Table 17-5 lists the specific issues that are either new or no longer relevant within theforecast period when compared to last year's report.Table 17-5: Changes since 2011IssuesAshley supply transformer capacityCulverden supply transformer capacityHororata supply transformer capacityKaikoura supply security and transformer capacityChangeNew issue.New issue.New issue.Removed. These assets will be transferredto Mainpower on 1 May <strong>2012</strong>.17.8 Canterbury transmission capabilityTable 17-6 summarises issues involving the Canterbury region for the next 15 years.For more information about a particular issue, refer to the listed section number.<strong>2012</strong> <strong>Annual</strong> <strong>Planning</strong> <strong>Report</strong> © <strong>Transpower</strong> New Zealand Limited <strong>2012</strong>. All rights reserved. 267
Chapter 17: Canterbury RegionTable 17-6: Canterbury region transmission issuesSectionnumberIssueRegional17.8.1 Islington 220/66 kV transformer capacitySite by grid exit point17.8.2 Ashburton 220/66 kV supply transformer capacity17.8.3 Ashley supply transformer capacity17.8.4 Bromley 220/66 kV transformer capacity and voltage quality17.8.5 Coleridge supply transformer security17.8.6 Culverden supply transformer capacity17.8.7 Hororata supply transformer capacity and voltage quality17.8.8 Southbrook supply transformer capacity17.8.9 Springston transmission capacity17.8.10 Waipara supply transformer security17.8.1 Islington 220/66 kV transformer capacityProject reference: ISL-POW_TFR-DEV-01Project status/purpose: New 220/66 kV grid exit point: possible, customer specificA fourth 220/66 kV transformer: to meet the Grid Reliability Standard (coregrid)Indicative timing: New 220/66 kV grid exit point: about 2020A fourth 220/66 kV transformer: to be advisedIndicative cost band: New 220/66 kV grid exit point: CA fourth 220/66 kV transformer: BIssueThree 220/66 kV interconnecting transformers at Islington supply the loads for NorthCanterbury, Christchurch, and Springston, providing:a total nominal installed capacity of 650 MVA, andn-1 capacity of 504/532 MVA (summer/winter).The peak load at the Islington 66 kV bus is forecast to exceed the transformers’winter n-1 capacity from 2019. The forecast assumes Coleridge generation is13 MW.SolutionA staged development plan was developed in discussion with Orion. The plan’s firststage increases the 220/66 kV transformer capacity at Bromley, and transfers loadfrom Islington to Bromley in 2019 (see Section 17.8.4). Additional longer-termdevelopment options being investigated include:establishing a new 220/66 kV grid exit point south of Christchurch (seeSection 17.9.2), which will also resolve the Springston transmission line capacityissue (see Section 17.8.9) 146 .installing a fourth 220/66 kV interconnecting transformer at Islington. This doesnot raise new property issues, as the existing substation has sufficient room toaccommodate a new transformer. However, installing a new transformer willincrease the fault level at Islington, downstream substations, and associatedsupply buses, which would then need resolution.146 Acquisition of substation land is required for establishing a new 220/66 kV southern grid exit point.268<strong>2012</strong> <strong>Annual</strong> <strong>Planning</strong> <strong>Report</strong> © <strong>Transpower</strong> New Zealand Limited <strong>2012</strong>. All rights reserved.
Chapter 17: Canterbury Region17.8.2 Ashburton 220/66 kV supply transformer capacityProject reference: New 220/66 kV transformer: ASB-POW_TFR-DEV-02New grid exit point: ASB-SUBEST-DEV-01Project status/purpose: New 220/66 kV transformer: preferred, customer-specificNew grid exit point: possible, customer-specificIndicative timing: New 220/66 kV transformer: 2015New grid exit point: approximately 2020Indicative cost band: New 220/66 kV transformer: ANew grid exit point: to be advisedIssueTwo 220/66 kV transformers supply Ashburton’s 66 kV load, providing:a total nominal installed capacity of 220 MVA, andn-1 capacity of 120/126 MVA (summer/winter).The Ashburton 66 kV bus is connected to embedded generation at Highbank andMontalto, which may export power to the National Grid during periods of low demand.The peak load connected to the Ashburton 66 kV bus is forecast to exceed thetransformers’ n-1 summer capacity by approximately 11 MW in <strong>2012</strong>, increasing toapproximately 84 MW in 2027 (see Table 17-7).Table 17-7: Ashburton 220/66 kV supply transformer overload forecastGrid exit pointPowerfactorTransformer overload (MW)Next 5 years5-15 years out<strong>2012</strong> 2013 2014 2015 2016 2017 2019 2021 2023 2025 2027Ashburton (66 kV) 0.92 11 14 27 31 35 44 53 64 71 78 84SolutionThe preferred option is to install a third 220/66 kV, 120 MVA supply transformer. Thiswill address the transformers’ n-1 capacity issue. As an interim measure, the loadcan be secured by transferring load to the Ashburton 33 kV transmission networkand/or utilising the embedded generation.In the longer term, load will be transferred to a new grid exit point (see Section17.9.1).17.8.3 Ashley supply transformer capacityProject reference: ASY-POW_TFR-DEV-01Project status/purpose: Base Capex, replacementIndicative timing: 2015Indicative cost band: AIssueTwo 66/11 kV transformers supply Ashley’s load, providing:a total nominal installed capacity of 20 MVA, andn-1 capacity of 11/12 MVA (summer/winter).The peak load at Ashley is forecast to exceed the transformers’ n-1 winter capacity byapproximately 2 MW in <strong>2012</strong>, increasing to approximately 18 MW in 2027 (see Table17-8).<strong>2012</strong> <strong>Annual</strong> <strong>Planning</strong> <strong>Report</strong> © <strong>Transpower</strong> New Zealand Limited <strong>2012</strong>. All rights reserved. 269
Chapter 17: Canterbury RegionTable 17-8: Ashley supply transformer overload forecastGrid exitpointPowerfactorNext 5 yearsTransformer overload (MW)5-15 years out<strong>2012</strong> 2013 2014 2015 2016 2017 2019 2021 2023 2025 2027Ashely 0.87 2 3 3 12 13 14 15 16 16 17 18SolutionThe existing supply transformers are approaching their expected end-of-life within thenext five years. We are discussing with Mainpower the appropriate rating and timingfor the replacement transformers. A longer-term solution involves replacing theexisting transformers with two 40 MVA units.17.8.4 Bromley 220/66 kV transformer capacity and voltage qualityProject reference: BRY-POW_TFR-DEV-01Project status/purpose: Committed, customer-specificIndicative timing: <strong>2012</strong>-2013Indicative cost band: B (cost band for one transformer)IssueTwo 220/66 kV transformers supply Bromley’s 66 kV and 11 kV loads, providing:a total nominal installed capacity of 200 MVA, andn-1 capacity of 116/125 MVA (summer/winter).The load on the transformers is radially connected, enabling them to be analysed assupply transformers.The peak load at Bromley is forecast to exceed the transformers’ n-1 winter capacityby approximately 80 MW in <strong>2012</strong>, increasing to approximately 229 MW in 2027 (seeTable 17-9).Orion advises that some load from Papanui and Addington will be shifted to Bromleyin 2020. This will adversely affect the voltage quality at the Bromley 220 kV and66 kV buses for an outage of the 220 kV Bromley–Islington circuit from 2020.Table 17-9: Bromley interconnecting transformer overload forecastGrid exit pointPowerfactorNext 5 yearsTransformer overload (MW)5-15 years out<strong>2012</strong> 2013 2014 2015 2016 2017 2019 2021 2023 2025 2027Bromley (66 kV) 1.00 80 93 99 106 111 113 121 203 211 220 229SolutionFollowing discussions with Orion, a new 220/66 kV transformer with on-load tapchanger is being installed in parallel with the two existing transformers. This will befollowed by replacing the two existing transformers with higher rated units in 2019.Both Bromley transformers have an expected end-of-life within the next 5-10 years.Installing capacitors at the Bromley transformer’s tertiary winding will resolve the lowvoltage issue.Installing a new 220/66 kV transformer and capacitors does not raise any propertyissues, as the existing substation has sufficient room to accommodate the newequipment.270<strong>2012</strong> <strong>Annual</strong> <strong>Planning</strong> <strong>Report</strong> © <strong>Transpower</strong> New Zealand Limited <strong>2012</strong>. All rights reserved.
Chapter 17: Canterbury Region17.8.5 Coleridge supply transformer securityProject status/purpose:This issue is for information onlyIssueA single 66/11 kV, 2.5 MVA three phase supply transformer supplies the load atColeridge, resulting in no n-1 security.SolutionThere is an off-site spare transformer that can take several days to install. Orionaccepts this level of security. Future investment will be customer driven.17.8.6 Culverden supply transformer capacityProject reference:Project status/purpose:Indicative timing:Indicative cost band:CUL-POW_TFR-DEV-01Possible, customer-specificTo be advisedTo be advisedIssueTwo 220/33 kV transformers supply the load at Culverden and Kaikoura, providing:a total nominal installed capacity of 60 MVA, andn-1 capacity of 31/32 MVA (summer/winter).The peak load at Culverden and Kaikoura is forecast to exceed the supplytransformers’ n-1 summer capacity by approximately 1 MW in 2014, increasing toapproximately 12 MW in 2027 (see Table 17-10).Table 17-10: Culverden supply transformer overload forecastGrid exitpointPowerfactorNext 5 yearsTransformer overload (MW)5-15 years out<strong>2012</strong> 2013 2014 2015 2016 2017 2019 2021 2023 2025 2027Culverden 0.97 0 0 1 4 5 6 7 9 10 11 12SolutionWe are discussing options with Mainpower. Operational measures are expected tobe sufficient in the short term. Longer-term options include replacing the existingsupply transformers with higher capacity units and changing the operating voltage to220/66 kV. Future investment will be customer driven.17.8.7 Hororata supply transformer capacity and voltage qualityProject status/purpose:This issue is for information onlyIssueHororata is supplied from:Islington by two 66 kV Hororata–Islington circuits, each rated at 59/62 MVA(summer/winter), andColeridge and the West Coast by two 66 kV Coleridge–Hororata circuits, eachrated at 30/37 MVA (summer/winter).With low Coleridge generation (three of the five machines out of service), the summern-1 capacity of the 66 kV Hororata–Islington circuits is limited to 56 MW to avoid lowvoltages at the Hororata 66 kV bus.<strong>2012</strong> <strong>Annual</strong> <strong>Planning</strong> <strong>Report</strong> © <strong>Transpower</strong> New Zealand Limited <strong>2012</strong>. All rights reserved. 271
Chapter 17: Canterbury RegionTwo 66/33 kV transformers supply Hororata 33 kV load, providing:a total nominal capacity of 34 MVA, andn-1 capacity of 23/23 MVA 147 (summer/winter).Hororata’s load peaks in summer. The peak load at Hororata 33 kV is forecast toexceed the transformers’ n-1 summer capacity by approximately 11 MW in <strong>2012</strong> (seeTable 17-11).Table 17-11: Hororata supply transformer overload forecastGrid exit pointPowerfactorTransformer overload (MW)Next 5 years5-15 years out<strong>2012</strong> 2013 2014 2015 2016 2017 2019 2021 2023 2025 2027Hororata (33 kV) 0.95 11 5 5 5 6 0 0 0 0 1 1SolutionThere is a low voltage intertrip scheme installed at Hororata to manage the Hororatavoltage quality constraint in the short term. We have discussed the supply options forthe ‘Plains’ area (supplied from Springston and Hororata) with Orion.The supply transformer capacity issue can be managed operationally in the shortterm by shifting load to Hororata 66 kV bus. In the longer term, Orion will shift loadfrom the 33 kV to the 66 kV, which will remove the overload issue.Future investment will be customer driven.17.8.8 Southbrook supply transformer capacityProject reference:Project status/purpose:Indicative timing:Indicative cost band:SBK-TRAN-DEV-01Possible, customer-specificTo be advisedTo be advisedIssueTwo 66/33 kV transformers supply Southbrook’s load, providing:a total nominal installed capacity of 80 MVA, andn-1 capacity of 47/47 MVA 148 (summer/winter).Southbrook’s load peaks in summer. The peak load at Southbrook is forecast toexceed the transformers’ n-1 summer capacity by approximately 1 MW in 2013. Theoverload will decrease when Mainpower transfers some load from the Southbrook33 kV bus to the 66 kV bus. However, the Southbrook load will exceed thetransformers’ n-1 summer capacity again by approximately 2 MW in 2021, increasingto approximately 8 MW in 2027 (see Table 17-12).Table 17-12: Southbrook supply transformer overload forecastGrid exitpointPowerfactorNext 5 yearsTransformer overload (MW)5-15 years out<strong>2012</strong> 2013 2014 2015 2016 2017 2019 2021 2023 2025 2027Southbrook 0.95 0 1 2 0 0 0 0 2 4 6 8147 The transformers’ capacity is limited by bus section rating; with this limit resolved, the n-1 capacitywill be 23/24 MVA (summer/winter).148 The transformers’ capacity is limited by circuit breaker and disconnector, followed by the LV cable(49 MVA) and protection equipment (50 MVA) limits; with these limits resolved, the n-1 capacity willbe 55/57 MVA (summer/winter).272<strong>2012</strong> <strong>Annual</strong> <strong>Planning</strong> <strong>Report</strong> © <strong>Transpower</strong> New Zealand Limited <strong>2012</strong>. All rights reserved.
Chapter 17: Canterbury RegionSolutionThe issue can be managed operationally. Alternatively, resolving all transformers’branch component limits will solve the overloading issue until 2027. Mainpowerintends to transfer some load from the Southbrook 33 kV bus to 66 kV. This can beachieved by establishing two new 66 kV feeders from Southbrook. We arediscussing the options with Mainpower. Future investment will be customer driven.17.8.9 Springston transmission capacityProject status/purpose:This issue is for information onlyIssueTwo 66 kV Islington–Springston circuits supply Springston’s load, providing:a total nominal installed capacity of 110/121 MVA (summer/winter), andn-1 capacity of 55/61 MVA (summer/winter).Springston’s load peaks in summer. The peak load at Springston is forecast toexceed the circuits’ n-1 summer capacity from <strong>2012</strong>.SolutionIn the short term, Orion can transfer load between Springston and Hororata followinga contingency.Longer-term solutions include the following:during 2011, Orion installed new 66 kV capacity in the area from Islington, whichwill relieve the loading on the existing circuits in the short term; (they intend toprogressively extend the 66 kV capacity in the area to reduce load on Springstonover the next 10 years), anda new 220/66 kV grid exit point south of Christchurch to remove load fromSpringston (see Section 17.9.2).In addition, we also plan to convert Springston 33 kV outdoor switchyard to an indoorswitchboard within the next 5-10 years.17.8.10 Waipara supply transformer securityProject status/purpose:This issue is for information onlyIssueA single 66/33 kV, 16 MVA transformer supplies load at Waipara resulting in no n-1security.SolutionMainpower is capable of transferring load from their 33 kV to their 66 kV network, andhas indicated it will continue with the present level of security. Future investment willbe customer driven.17.9 Other regional items of interest17.9.1 New Ashburton grid exit pointWe are investigating a second Ashburton grid exit point to supply the distribution loadto the west of Ashburton. The connection configuration for the new grid exit point isvia two transformer feeders connected to the 220 kV Islington–Livingstone and<strong>2012</strong> <strong>Annual</strong> <strong>Planning</strong> <strong>Report</strong> © <strong>Transpower</strong> New Zealand Limited <strong>2012</strong>. All rights reserved. 273
Chapter 17: Canterbury RegionIslington–Tekapo B circuits. The new grid exit point will be required in about 4-10years time.17.9.2 New southern grid exit point for OrionWe are investigating one or two new 220/66 kV grid exit points for Orion south ofChristchurch. The new grid exit point may connect to the 220 kV Islington–Livingstone circuit, the Islington–Tekapo B circuit, or both. The new grid exit point(s)will be required by about 2020.17.9.3 Decommissioning of Bromley 30 Mvar reactorBromley has a 30 Mvar reactor connected to the tertiary of the T5 220/66/11 kVtransformer. It is used to prevent high 220 kV voltages throughout the South Islandduring light load conditions. Following the commissioning of the second Islington SVCand the Kikiwa STATCOM, the reactor will be decommissioned in 2011.17.9.4 Decommissioning two Addington 66/11 kV transformersOrion is planning a staged development of their 11 kV distribution system suppliedfrom Addington, which will reduce the 11 kV load at Addington.Two 66/11 kV transformers (T2 and T3) are relatively new three-phase units and willremain. The other three transformers (T5, T6, and T7) are made up of single-phaseunits, and are scheduled for replacement by approximately 2023. Followingdiscussions with Orion, the intention is to decommission T5 in approximately 2013and decommission T6 and T7 in approximately 2019. The Addington 11 kV load willbe limited to within the capacity of the two remaining transformers (n-1 capacity of39/40 MVA summer/winter).In addition, the Addington 11 kV No. 2 indoor switchboard is scheduled forreplacement in approximately <strong>2012</strong>. The configuration of the replacementswitchboard will be compatible with the longer-term site developments.17.9.5 Fonterra load connection at HororataFonterra has constructed a new 5.5 MW dairy processing plant at Darfield in 2011/12,and planning for an additional 6 MW expansion in 2013. Further upgrades may berequired in the future. The existing plant is connected to the Orion 33 kV subtransmissionnetwork supplied from Hororata 33 kV bus.This step load will adversely affect the voltage quality at Hororata. We are discussingoptions with Orion to increase the security of supply and resolve the low voltage issueat Hororata.17.10 Canterbury generation proposals and opportunitiesThis section details relevant regional issues for selected generation proposals underinvestigation by developers and in the public domain, or other generationopportunities.The maximum generation that can be connected depends on several factors andusually falls within a range. Generation developers should consult with us at an earlystage of their investigations to discuss connection issues. See our website for moreinformation about connecting generation. 149149 http://www.transpower.co.nz/connecting-new-generation.274<strong>2012</strong> <strong>Annual</strong> <strong>Planning</strong> <strong>Report</strong> © <strong>Transpower</strong> New Zealand Limited <strong>2012</strong>. All rights reserved.
Chapter 17: Canterbury Region17.10.1 Maximum regional generationThe Canterbury region has some of the highest load densities in the South Island,coupled with relatively low levels of local generation. Therefore, there is no practicallimit to the maximum generation that can be connected within the region. However,there will be limits on the maximum generation that can be connected at a substationor along an existing line due to the rating of the existing circuits.17.10.2 Mount Cass wind stationThere is a proposal to install a 60 MW (approximately) wind station at Mount Cass,which can be connected to the Waipara 66 kV bus without any restrictions when alltransmission assets are in service. Generation greater than 60 MW will requireautomatic controls to limit generation following some outages, to prevent circuits fromoverloading.17.10.3 Inland Canterbury wind sitesWind maps show that inland Canterbury has good wind resources for windgeneration, but most of the area is distant from significant transmission.There are two 66 kV Islington–Hororata circuits rated at 60/63 MVA, and twoHororata–Coleridge circuits rated at 30/37 MVA (reconductoring a section of whichincreases this rating to 48/53 MVA). It is possible to connect over 100 MW ofgeneration if connected directly to the Hororata 66 kV bus or up to approximately therating of a single circuit if the generation is connected onto a circuit.Hundreds of megawatts of generation can be connected to the 220 kV Islington–Kikiwa circuits north of Christchurch. The maximum generation depends on thelocation of the connection point, and the number of circuits it is connected to.There is some spare capacity south of Christchurch to connect generation into the220 kV Islington–Livingstone circuit. The primary purpose of this circuit is to supplyloads in and north of Christchurch. Connecting too much generation to this circuit willoverload it, and reduce the amount of load that can be supplied in and north ofChristchurch. Approximately 400 MW can be connected (more if the circuit sectionfrom the Rangitata River to Islington is thermally upgraded).<strong>2012</strong> <strong>Annual</strong> <strong>Planning</strong> <strong>Report</strong> © <strong>Transpower</strong> New Zealand Limited <strong>2012</strong>. All rights reserved. 275
Chapter 18: South Canterbury Region18 South Canterbury Regional Plan18.1 Regional overview18.2 South Canterbury transmission system18.3 South Canterbury demand18.4 South Canterbury generation18.5 South Canterbury significant maintenance work18.6 Future South Canterbury projects summary and transmission configuration18.7 Changes since the 2011 <strong>Annual</strong> <strong>Planning</strong> <strong>Report</strong>18.8 South Canterbury transmission capability18.9 Other regional items of interest18.10 South Canterbury generation proposals and opportunities18.1 Regional overviewThis chapter details the South Canterbury regional transmission plan. We base thisregional plan on an assessment of available data, and welcome feedback to improveits value to all stakeholders.Figure 18-1: South Canterbury region276<strong>2012</strong> <strong>Annual</strong> <strong>Planning</strong> <strong>Report</strong> © <strong>Transpower</strong> New Zealand Limited <strong>2012</strong>. All rights reserved.
Chapter 18: South Canterbury RegionThe South Canterbury region includes Timaru and Oamaru (both predominantlyservice centres for the surrounding region) and agricultural industries (Bells Point,Black Point, Studholme, Temuka, and Waitaki).We have assessed the South Canterbury region’s transmission needs over the next15 years while considering longer-term development opportunities. Specifically, thetransmission network needs to be flexible to respond to a range of future service andtechnology possibilities, taking into consideration:the existing transmission networkforecast demandforecast generationequipment replacement based on condition assessment, andpossible technological development.18.2 South Canterbury transmission systemThis section highlights the state of the South Canterbury regional transmissionnetwork. The existing transmission network is set out geographically in Figure 18-1and schematically in Figure 18-2.Figure 18-2: South Canterbury transmission schematicCANTERBURYIslingtonAshburtonTekapo A33 kV110 kV11 kV220 kVOhau ATekapo B220 kVTwizel33 kV 220 kVOhau C220 kV220 kVBenmoreOhau B220 kVCromwellNasebyOTAGO - SOUTHLAND110 kV11 kVAlburyWaitakiBlack Point220 kV110 kV11 kV33 kVAviemoreLivingstone220 kV220 kVBells Pond110 kVOamaru110 kV33 kV220 kVGlenavyTemuka33 kV110 kV110 kV11 kVTimaru* Note: Studholme split is110 kV closed during peak dairy11 kV season (October-April)StudholmeKEY220kV CIRCUIT110kV CIRCUITSUBSTATION BUSTRANSFORMERTEE POINTLOADCAPACITORGENERATOR<strong>2012</strong> <strong>Annual</strong> <strong>Planning</strong> <strong>Report</strong> © <strong>Transpower</strong> New Zealand Limited <strong>2012</strong>. All rights reserved. 277
Chapter 18: South Canterbury Region18.2.1 Transmission into the regionSeveral major 220 kV lines serve the South Canterbury region, connecting it toChristchurch and the upper South Island to the north, and the Otago Southlandregion to the south.This region contributes a major portion of the generation in the South Island, feedingthe 220 kV transmission network from the Tekapo, Ohau, and Waitaki Valleygeneration stations. Peak load in the region (approximately 150 MW in 2011) isapproximately 10% of the region’s generation capacity, so the need for transmissioncapacity into the region is driven by generation export requirements, and the need totransfer power from the lower South Island to the upper South Island.18.2.2 Transmission within the regionThe South Canterbury regional transmission network comprises 220 kV and 110 kVtransmission circuits, with interconnecting transformers at Timaru and Waitaki. Allsignificant loads in the South Canterbury region are supplied via the 110 kVtransmission network running up the east coast from Oamaru to Temuka.The 110 kV transmission network is normally split at Studholme, but this split isclosed during the peak dairy season (October-April) to increase the supply security.The split creates two radial feeds incorporating the:Timaru 220/110 kV interconnecting transformer banks supplying Timaru, Albury,Tekapo A and Temuka, andWaitaki 220/110 kV interconnecting transformer banks supplying Studholme,Bells Pond, Black Point, and Oamaru.Up to 25 MW of generation is injected directly into the 110 kV transmission networkfrom Tekapo A.Much of the 110 kV transmission network is reaching its capacity, as are theinterconnecting transformers at Timaru. This is mainly due to growth associated withthe dairy industry, and irrigation in particular.We have a number of investigations and projects planned or underway to support thedemand growth and supply security in the South Canterbury region. These include:the Lower Waitaki Reliability project, upgrading supply security to the areabetween the Waitaki, Oamaru and Studholme grid exit points, andsupply security upgrades at Timaru and Temuka.18.2.3 Longer-term development pathThe investigations underway include long-term development plans for the area. Thisis likely to include new 220 kV connections to offload the highly loaded 110 kVtransmission network.Some demand response may be appropriate to allow the economic connection oflarge rural loads such as irrigation.18.3 South Canterbury demandThe after diversity maximum demand (ADMD) for the South Canterbury region isforecast to grow on average by 3.4% annually over the next 15 years, from 194 MWin <strong>2012</strong> to 303 MW by 2027. This is higher than the national average demand growthof 1.7% annually.278<strong>2012</strong> <strong>Annual</strong> <strong>Planning</strong> <strong>Report</strong> © <strong>Transpower</strong> New Zealand Limited <strong>2012</strong>. All rights reserved.
Chapter 18: South Canterbury RegionFigure 18-3 shows a comparison of the 2011 and <strong>2012</strong> forecast 15-year maximumdemand (after diversity 150 ) for the South Canterbury region. The forecasts arederived using historical data, and modified to account for customer information, whereappropriate. The power factor at each grid exit point is also derived from historicaldata, and is used to calculate the real power capacity for power transformer andtransmission line. See Chapter 4 for more information about demand forecasting.Figure 18-3: South Canterbury region after diversity maximum demand forecastLoad (MW)400South Canterbury3503002502001501002011 APR Forecast50<strong>2012</strong> APR ForecastActual Peak01997 1999 2001 2003 2005 2007 2009 2011 2013 2015 2017 2019 2021 2023 2025 2027Table 18-1 lists forecast peak demand (prudent growth) for each grid exit point for theforecast period, as required for the Grid Reliability <strong>Report</strong>.Table 18-1: Forecast annual peak demand (MW) at South Canterbury grid exit points to2027Grid exit pointPowerfactorNext 5 yearsPeak demand (MW)5-15 years out<strong>2012</strong> 2013 2014 2015 2016 2017 2019 2021 2023 2025 2027Albury 0.91 4 4 4 4 4 4 5 5 5 5 5Bells Pond 1 0.95 8 8 17 17 17 17 17 17 17 17 17Black Point 1 0.92 12 20 21 22 23 23 24 24 24 24 24Oamaru 1 0.92 44 46 62 65 68 69 73 75 77 78 80St Andrews 1 0.95 0 0 0 0 0 35 45 45 45 45 45Studholme 1 0.94 17 18 25 26 28 33 36 38 38 39 39Tekapo A 1.00 6 6 6 7 7 7 8 9 9 9 9Temuka 0.96 65 68 70 73 75 78 87 92 97 102 106Timaru 2 0.96 71 72 81 81 82 82 83 84 85 86 87Twizel 1.00 6 6 6 6 7 7 7 7 7 8 8Waitaki 3 0.95 7 7 7 11 11 11 17 17 22 22 231. The customer and Covec (an independent consultant) provided the new load forecast. The forecastincludes major new irrigation and manufacturing loads.150 The after diversity maximum demand (ADMD) for the region will be less than the sum of theindividual grid exit point peak demands, as it takes into account the fact that the peak demand doesnot occur simultaneously at all the grid exit points in the region.<strong>2012</strong> <strong>Annual</strong> <strong>Planning</strong> <strong>Report</strong> © <strong>Transpower</strong> New Zealand Limited <strong>2012</strong>. All rights reserved. 279
Chapter 18: South Canterbury RegionGrid exit pointPowerfactorNext 5 yearsPeak demand (MW)5-15 years out<strong>2012</strong> 2013 2014 2015 2016 2017 2019 2021 2023 2025 20272. The forecast includes step-change information provided by the customer.3. The customer indicates an expected irrigation load increase in 2015, 2019, and 2023.18.4 South Canterbury generationThe South Canterbury region’s generation capacity is 1,746 MW. This represents amajor portion of total South Island generation and significantly exceeds local demand.Surplus generation is exported via the National Grid to other demand centres in theSouth Island, and via the HVDC link to the North Island.Table 18-2 lists the generation forecast for each grid injection point in the SouthCanterbury region for the forecast period, as required for the Grid Reliability <strong>Report</strong>.This includes all known and committed generation stations including those embeddedwithin the relevant local lines company’s network (either Network Waitaki or AlpineEnergy). 151No new generation is known to be committed in the South Canterbury region for theforecast period.Table 18-2: Forecast annual generation capacity (MW) at South Canterbury grid injectionpoints to 2027 (including existing and committed generation)Grid injection point(location ifembedded)Generation capacity (MW)Next 5 years5-15 years out<strong>2012</strong> 2013 2014 2015 2016 2017 2019 2021 2023 2025 2027Albury (Opuha) 8 8 8 8 8 8 8 8 8 8 8Aviemore 220 220 220 220 220 220 220 220 220 220 220Benmore 540 540 540 540 540 540 540 540 540 540 540Ohau A 264 264 264 264 264 264 264 264 264 264 264Ohau B 212 212 212 212 212 212 212 212 212 212 212Ohau C 212 212 212 212 212 212 212 212 212 212 212Tekapo A 25 25 25 25 25 25 25 25 25 25 25Tekapo B 160 160 160 160 160 160 160 160 160 160 160Waitaki 105 105 105 105 105 105 105 105 105 105 10518.5 South Canterbury significant maintenance workOur capital project and maintenance works are integrated to enable system issues tobe resolved if possible when assets are replaced or refurbished. Table 18-3 lists thesignificant maintenance-related work 152 proposed for the South Canterbury region forthe next 15 years that may significantly impact related system issues or connectedparties.Table 18-3: Proposed significant maintenance workDescriptionAlbury supply transformerexpected end-of-lifeTentativeyearRelated system issues2016-2018 No n-1 security at Albury. Future investment will becustomer driven. See Section 18.8.5 for moreinformation.151 Only generators with capacity greater than 1 MW are listed. Generation capacity is rounded to thenearest megawatt.152 This may include replacement of the asset due to its condition assessment.280<strong>2012</strong> <strong>Annual</strong> <strong>Planning</strong> <strong>Report</strong> © <strong>Transpower</strong> New Zealand Limited <strong>2012</strong>. All rights reserved.
Chapter 18: South Canterbury RegionDescriptionStudholme supply transformerexpected end-of-lifeStudholme 11 kV switchboardreplacementTimaru 110 kV busrationalisation and busprotection upgradeTimaru supply transformers T2and T3 expected end-of-lifeTwizel 33 kV outdoor to indoorconversionWaitaki interconnectingtransformers expected end-oflifeTentativeyearRelated system issues2014-2016 Load at Studholme exceeds the supply transformers’n-1 capacity. See Section 18.8.11 for more information.2014-2016 The switchboard needs to be replaced with new supplytransformers.<strong>2012</strong>-2015 The 110 kV rationalisation and protection work needs tobe coordinated with the supply and interconnectingtransformer development work at Timaru. See Sections18.8.2 and 18.8.14 for more information.2017-2019 The load at Timaru exceeds the supply transformers’n-1 capacity. See Section 18.8.14 for more information.2018-2020 No system issues are identified within the forecastperiod.2015-2019 The options to replace the interconnecting transformersare related to the Lower Waitaki Valley Reliabilityproject. See Sections 18.8.1 and 18.8.4 for moreinformation.18.6 Future South Canterbury projects summary and transmissionconfigurationTable 18-4 lists projects to be carried out in the South Canterbury region within thenext 15 years.Figure 18-4 shows the possible configuration of South Canterbury transmission in2027, with new assets, upgraded assets, and assets undergoing significantmaintenance within the forecast period.Table 18-4: Projects in the South Canterbury region up to 2027Site Projects StatusAlbury Replace supply transformer. Base CapexBenmore–TwizelGeraldineUpgrade circuit thermal capacity (see Chapter 6, Section 6.6.3 formore information).New switching station (see Chapter 6, Section 6.6.1 for moreinformation).PossiblePossibleOamaru Upgrade supply transformer branch limiting components. PossibleStudholmeReplace existing supply transformers with higher-rated units.Replace 11 kV switchboard.PossibleBase CapexSt Andrews New grid exit point. PossibleTekapo A Resolve protection limits on 11/33 kV supply transformer. Base CapexTemuka–Timaru Upgrade circuit thermal capacity. PossibleTemuka Install a new supply transformer. PossibleTimaruInstall a 110 kV bus coupler and upgrade 110 kV bus protection.Rationalise 110 kV bus.Install additional interconnecting transformer(s).Upgrade supply transformer capacity.PossibleBase CapexPossiblePossibleTwizel Convert 33 kV outdoor switchgear to indoor. Base CapexWaitakiClutha-UpperWaitaki LineProjectReplace interconnecting transformers.Install a second 11/33 kV supply transformer.Upgrade 11/33 kV supply transformer.Replace the following circuits with duplex conductor:220 kV Aviemore–Benmore 1 and 2 circuits.220 kV Aviemore–Waitaki–Livingstone 1 circuits.220 kV Livingstone–Naseby–Roxburgh 1 circuits.220 kV Clyde–Roxburgh 1 and 2 circuits (Otago-Southlandregion).Base CapexPossiblePossibleCommitted<strong>2012</strong> <strong>Annual</strong> <strong>Planning</strong> <strong>Report</strong> © <strong>Transpower</strong> New Zealand Limited <strong>2012</strong>. All rights reserved. 281
Chapter 18: South Canterbury RegionSite Projects StatusLower WaitakiValley ReliabilityProjectThermal upgrade the 220 kV Cromwell–Twizel 1 and 2 circuits.(See Chapter 6, Section 6.6.3 for more information).Possible options include the following.Build a new 110 kV line between Livingstone and Oamaru,Build a new 110 kV Glenavy switching station.Reconductor/thermally upgrade the 110 kV circuits betweenWaitaki, Oamaru and Timaru.Install capacitors at Oamaru.PossibleFigure 18-4: Possible South Canterbury transmission configuration in 2027CANTERBURYIslingtonAshburtonTekapo A33 kV*110 kV11 kVTekapo B220 kV110 kV220 kVGeraldineTemuka33 kV220 kVOhau A33 kV Twizel220 kVOhau C220 kV220 kVBenmoreOhau B220 kV11 kV220 kVAviemore11 kVAlburySt Andrews220 kV11 kV220 kV220 kV110 kVWaitaki11 kVBlack PointStudholme**110 kV33 kVBells Pond KEY110 kVGlenavyNEW ASSETS**110 kV110 kV110 kV11 kVTimaruUPGRADED ASSETSASSETS SCHEDULEDFOR REPLACEMENT*MINOR UPGRADELivingstoneCromwellNasebyOTAGO - SOUTHLAND220 kV110 kV***33 kV110 kVOamaru** This diagram shows severalpossible upgrade paths for theSouth Canterbury region.18.7 Changes since the 2011 <strong>Annual</strong> <strong>Planning</strong> <strong>Report</strong>Table 18-5 lists the specific issues that are either new or no longer relevant within theforecast period when compared to last year's report.Table 18-5: Changes since 2011IssuesAlbury supply transformer capacity.Tekapo A transformer capacityChangeNew issue.New issue.282<strong>2012</strong> <strong>Annual</strong> <strong>Planning</strong> <strong>Report</strong> © <strong>Transpower</strong> New Zealand Limited <strong>2012</strong>. All rights reserved.
Chapter 18: South Canterbury Region18.8 South Canterbury transmission capabilityTable 18-6 summarises issues involving the South Canterbury region for the next 15years. For more information about a particular issue, refer to the listed sectionnumber.Table 18-6: South Canterbury region transmission issuesSectionnumberIssueRegional18.8.1 Oamaru–Waitaki voltage quality and transmission security18.8.2 Timaru interconnecting transformer capacity18.8.3 Timaru 110 kV transmission security18.8.4 Waitaki 220/110 kV interconnecting transformer capacitySite by grid exit point18.8.5 Albury single supply security and supply transformer capacity18.8.6 Albury and Tekapo A transmission security18.8.7 Bells Pond single supply security18.8.8 Black Point single supply security18.8.9 Oamaru supply transformer capacity18.8.10 Studholme single supply security18.8.11 Studholme supply transformer capacity18.8.12 Tekapo A supply security and supply transformer capacity18.8.13 Temuka transmission security and supply transformer capacity18.8.14 Timaru supply transformer capacity18.8.15 Waitaki single supply security and supply transformer capacity18.8.1 Oamaru–Waitaki voltage quality and transmission securityProject context:Lower Waitaki Valley ReliabilityProject reference: Reactive support: OAM-C_BANKS-DEV-01Upgrade transmission capacity: LWTK-TRAN-DEV-01Project status/purpose: Reactive support: possible, customer-specificUpgrade transmission capacity: possible, to meet the Grid Reliability Standard(not core grid)Indicative timing: Reactive support: Between <strong>2012</strong> and 2017Upgrade transmission capacity: post <strong>2012</strong>Indicative cost band: Reactive support: AUpgrade transmission capacity: CIssueTwo 110 kV circuits from Waitaki supply the Oamaru, Black Point, Bells Pond, andStudholme grid exit points, which include the:Oamaru–Black Point–Waitaki 1 circuit (which supplies Black Point via a teeconnection), andOamaru–Studholme–Bells Pond–Waitaki 2 circuit (which supplies the Bells Pondand Studholme loads from tee connections).The underlying load growth forecast for this area is considerably higher than thenational average. The growth is mainly due to irrigation and dairy industry. There isalso a possible major new industrial load at Oamaru.<strong>2012</strong> <strong>Annual</strong> <strong>Planning</strong> <strong>Report</strong> © <strong>Transpower</strong> New Zealand Limited <strong>2012</strong>. All rights reserved. 283
Chapter 18: South Canterbury RegionVoltageThe load at these four grid exit points peaks in summer. The voltage at the Oamaru110 kV bus can fall below 0.9 pu with the loss of the:Oamaru–Black Point–Waitaki circuit, orOamaru–Studholme–Bells Pond–Waitaki circuit.There is also a voltage quality issue with a large voltage step immediately followingthe outage of either circuit. There are no steady state voltage problems at Oamaru33 kV, due to the range of the supply transformer on-load tap changers.In the medium-term, there are voltage stability issues. These may occur from:2014 if the large industrial load connects at Oamaru, or2017 with underlying Oamaru load growth but no additional step load at Oamaru.OverloadingThermal overloads occur by:summer <strong>2012</strong> on one Glenavy–Oamaru circuit section following an outage of theparallel circuitsummer <strong>2012</strong> on the Bells Pond–Waitaki section during an outage of theOamaru–Black Point–Waitaki circuit or any of the Twizel–Timaru–Ashburtoncircuits, andsummer <strong>2012</strong> on the Black Point–Waitaki section during an outage of theOamaru–Studholme–Bells Pond–Waitaki circuit.SolutionWe are investigating a range of short-term options. The solution may include one ormore of the following:load management at the Oamaru and Waitaki Valley grid exit pointsimplementing system splitsinstalling reactive support at Oamarupost-contingency load shedding at Oamaru, andimplementing variable line ratings.Having a Wider Voltage Agreement at 110 kV buses may be appropriate in the shortterm. In the medium term, the voltage issues at Oamaru can be resolved by installingapproximately 30 Mvar of reactive support at Oamaru. This also providesapproximately 7 MW additional capacity on the Glenavy–Oamaru circuits.We are discussing the preferred options with the local lines companies (NetworkWaitaki and Alpine Energy).Additional reactive support will be required in the longer-term, however, the reactivesupport’s size and the location will depend on the development undertaken to resolvethe capacity issue. A range of long-term options is being investigated to resolve thecapacity issue, including:establishing a new switching station at Glenavyreconductoring and thermally upgrading the existing 110 kV circuits, and/orbuilding a new 110 kV Livingstone–Oamaru line, ora new grid exit point supplying load in the Ngapara area west of Oamaru.A major driver of the transmission upgrade is the possible major new industrial load atOamaru. We do not expect to propose major upgrades in the short-term, unless thisload becomes committed.284<strong>2012</strong> <strong>Annual</strong> <strong>Planning</strong> <strong>Report</strong> © <strong>Transpower</strong> New Zealand Limited <strong>2012</strong>. All rights reserved.
Chapter 18: South Canterbury RegionEasements may be required for the line upgrade work, and will be required for anynew lines.18.8.2 Timaru interconnecting transformer capacityProject reference: Load shifting: See Section 18.8.14Interconnecting transformer capacity: TIM-POW_TFR-EHMT-02Project status/purpose: Load shifting: See Section 18.8.14Interconnecting transformer capacity: possible, to meet the Grid ReliabilityStandard (not core grid). We anticipate seeking approval from the CommerceCommission in third quarter of <strong>2012</strong>.Indicative timing: Interconnecting transformer capacity: to be advisedIndicative cost band: Interconnecting transformer capacity: CIssueTwo 220/110 kV interconnecting transformers at Timaru supply the loads at Timaru,Temuka, Albury and Tekapo A, providing:a total nominal installed capacity of 240 MVA, andn-1 capacity of 122/125 MVA 153 (summer/winter).An outage of one transformer may cause the other transformer to exceed its n-1capacity from <strong>2012</strong>, if Tekapo A is not generating. In addition, some developmentoptions for the Lower Waitaki Valley area may increase the loading on thesetransformers, one of which is supplying Studholme from Timaru instead of Waitaki(see Sections 18.8.1 and 18.8.10).SolutionThe options to address this issue include one or more of the following:peak load management or load shedding110 kV reactive support to reduce reactive power flow through the Timaruinterconnecting transformersshifting the Timaru supply bus load from the 110 kV to the 220 kV side of theTimaru interconnecting transformers (see also Section 18.8.14), andincreasing installed capacity using one of several possible configurations of theexisting and new interconnecting transformers.18.8.3 Timaru 110 kV transmission securityProject reference: TIM-BUSC-DEV-01Project status/purpose: Possible, to meet the Grid Reliability Standard (not core grid)Indicative timing: 2013-2014Indicative cost band: AIssueThe Timaru 110 kV bus supplies the entire loads at Timaru and Temuka, andconnects directly to Albury and Tekapo A via a single 110 kV circuit. At present, a110 kV bus fault at Timaru will cause a total loss of supply to substations at Timaruand Temuka, disconnect Tekapo A and Albury from the Grid, and possibly cause anoutage at Studholme (depending on the status of the Studholme split).SolutionWe will investigate the economic benefit of installing a 110 kV bus coupler at Timaru,to provide n-1 protection for 110 kV bus faults.153 The transformers’ winter capacity is limited by protection equipment; with this limit resolved, the n-1capacity will be 122/127 MVA (summer/winter).<strong>2012</strong> <strong>Annual</strong> <strong>Planning</strong> <strong>Report</strong> © <strong>Transpower</strong> New Zealand Limited <strong>2012</strong>. All rights reserved. 285
Chapter 18: South Canterbury Region18.8.4 Waitaki 220/110 kV interconnecting transformer capacityProject reference: WTK-POW_TFR-REPL-01Project status/purpose: Base Capex, replacementIndicative timing: 2014-2019Indicative cost band: BIssueTwo 220/110 kV interconnecting transformers (T23 and T24) at Waitaki supply theWaitaki 110 kV loads at Black Point, Bells Pond, Oamaru, and Studholme, providing:a total nominal installed capacity of 130 MVA, andn-1 capacity of 80/85 MVA (summer/winter).The loading on the two transformers is unequal because of the system configuration(no 110 kV bus at Waitaki and only Oamaru is connected to both circuits). Thesetransformers have a higher capacity than the circuits they supply, so they are not thefirst constraint. However, under some upgrade scenarios the capacity of the 110 kVWaitaki–Oamaru circuits (as well as the load placed on them) will exceed theinterconnecting transformers’ n-1 capacity.In addition, the tap changers on these transformers are unable to be operated due totheir condition. This exacerbates voltage issues on the Lower Waitaki 110 kVtransmission system (see Section 18.8.1).SolutionThese transformers have an expected end-of-life within the next 10 years. The needto increase the interconnection capacity in conjunction with the necessarymaintenance work will depend on the preferred option from the Lower Waitaki ValleyReliability investigation (see Section 18.8.1).18.8.5 Albury single supply security and supply transformer capacityProject status/purpose:This issue is for information onlyIssueA single 110/11 kV, 5 MVA transformer supplies load at Albury resulting in no n-1security.In addition, Albury is connected to embedded generation at Opuha, which may exportpower to the National Grid during periods of low demand.The peak load at Albury is forecast to exceed the transformer’s summer capacity byapproximately 1 MW in 2023, only increasing slightly until 2027 (see Table 18-7).Table 18-7: Albury supply transformer overload forecastGrid exitpointPowerfactorNext 5 yearsTransformer overload (MW)5-15 years out<strong>2012</strong> 2013 2014 2015 2016 2017 2019 2021 2023 2025 2027Albury 0.91 0 0 0 0 0 0 0 0 1 1 1SolutionAlpine Energy can supply Albury’s load from Timaru after a short loss of supply, andconsiders the issue can be managed operationally for the forecast period. Futureinvestment will be customer driven.286<strong>2012</strong> <strong>Annual</strong> <strong>Planning</strong> <strong>Report</strong> © <strong>Transpower</strong> New Zealand Limited <strong>2012</strong>. All rights reserved.
Chapter 18: South Canterbury RegionAn additional consideration is that this supply transformer has an expected end-of-lifewithin the next 10 years. We will discuss options with Alpine Energy for increasingsupply security and coordinating outages to minimise supply interruptions whenreplacing this transformer.18.8.6 Albury and Tekapo A transmission securityProject status/purpose:This issue is for information onlyIssueA single 110 kV Tekapo A–Albury–Timaru circuit connects Tekapo A, Albury, andOpuha to the National Grid. If the circuit trips, demand located at Albury and TekapoA will lose supply, and generation located at Tekapo A and Opuha will disconnectfrom the National Grid.SolutionAlbury and Tekapo A demand may be restored by local Opuha and Tekapo Ageneration. Alpine Energy considers the issue can be managed operationally for theforecast period. Future investment will be customer driven.18.8.7 Bells Pond single supply securityProject reference:Project status/purpose:Indicative timing:Indicative cost band:BPD-BUSC-DEV-01Possible, customer-specificTo be advisedTo be advisedIssueBells Pond has a single 110 kV circuit connected to an Oamaru–Waitaki circuit,resulting in no n-1 security.SolutionAlpine Energy has requested a higher security level. We are discussing possibleoptions with Alpine Energy, which include:building a 110 kV bus at Bells Pondconnection to the other 110 kV Oamaru–Waitaki circuit, anda new grid exit point connected to the Islington–Livingstone circuit.18.8.8 Black Point single supply securityProject status/purpose:This issue is for information onlyIssueBlack Point has a single 110 kV circuit connected to an Oamaru–Waitaki circuit,resulting in no n-1 security.SolutionNetwork Waitaki has not requested a higher security level and there are currently noplans to increase supply security at this grid exit point. Future investment will becustomer driven.18.8.9 Oamaru supply transformer capacityProject reference:OAM-POW_TFR-EHMT-01<strong>2012</strong> <strong>Annual</strong> <strong>Planning</strong> <strong>Report</strong> © <strong>Transpower</strong> New Zealand Limited <strong>2012</strong>. All rights reserved. 287
Chapter 18: South Canterbury RegionProject status/purpose: Base Capex, minor enhancementIndicative timing: 2013Indicative cost band: AIssueTwo 110/33 kV transformers supply Oamaru’s load, providing:a total nominal installed capacity of 120 MVA, andn-1 capacity of 62/62 MVA 154 (summer/winter).The peak load at Oamaru is forecast to exceed the transformers’ n-1 summercapacity by approximately 12 MW in 2014, increasing to approximately 30 MW in2027 (see Table 18-8).Table 18-8: Oamaru supply transformer overload forecastGrid exitpointPowerfactorNext 5 yearsTransformer overload (MW)5-15 years out<strong>2012</strong> 2013 2014 2015 2016 2017 2019 2021 2023 2025 2027Oamaru 0.92 0 0 12 15 18 19 23 25 27 28 30SolutionThe 110 kV circuits supplying these transformers have a lower capacity than thetransformers (see Section 18.8.1). Therefore, the transformers are not the firstconstraint on Oamaru load.Resolving the protection limits will provide sufficient n-1 capacity until 2016. Futureinvestment will be customer driven.18.8.10 Studholme single supply securityProject status/purpose:See Section 18.8.1 for more informationIssueThe Studholme–Timaru circuit is split during the off-peak dairy season (May toSeptember), and Studholme is supplied by the Oamaru–Studholme–Bells Pond–Waitaki circuit. This reduces losses that occur when power flows through the 110 kVsystem from Waitaki to Timaru. In the event of a fault on the Oamaru–Studholme–Bells Pond–Waitaki circuit, the supply automatically transfers to the Studholme–Timaru line. This results in approximately 25 seconds loss of supply at Studholmebefore the switching occurs.However, a brief loss of supply to the local dairy factory at Studholme can causesignificant economic losses, so the split is closed during the peak dairy season(October to April).As load increases in the Lower Waitaki area, closing the split will create overloadingissues on the Waitaki–Bells Pond section of the Oamaru–Studholme–Bells Pond–Waitaki circuit. We expect to be unable to close the split during peak summer loadperiods from 2014.SolutionWe are investigating options to increase supply security at Studholme. The long-termsolution will be part of the Lower Waitaki Reliability project (see Section 18.8.1).154 The transformers’ capacity is limited by protection equipment limits, followed by the circuit breaker(71 MVA) limits; with these limits resolved, the n-1 capacity will be 72/76 MVA (summer/winter).288<strong>2012</strong> <strong>Annual</strong> <strong>Planning</strong> <strong>Report</strong> © <strong>Transpower</strong> New Zealand Limited <strong>2012</strong>. All rights reserved.
Chapter 18: South Canterbury Region18.8.11 Studholme supply transformer capacityProject reference:Project status/purpose:Indicative timing:Indicative cost band:STU-POW_TFR-EHMT-01Possible, customer-specificUpgrade transformer capacity: 2014 (subject to Alpine Energy agreement)New grid exit point: to be advisedUpgrade transformer capacity: BNew grid exit point: CIssueTwo 110/11 kV transformers supply Studholme’s load, providing:a total nominal installed capacity of 20 MVA, andn-1 capacity of 11/12 MVA (summer/winter).The peak load at Studholme already exceeds the transformers’ n-1 summer capacity,and the overload is forecast to increase to approximately 74 MW in 2027 (see Table18-9). However, part of this increase is due to a single load from a proposed irrigationscheme in 2017. This may be supplied from a new grid exit point in the area north ofStudholme.Table 18-9: Studholme supply transformer overload forecastGrid exitpointPowerfactorNext 5 yearsTransformer overload (MW)5-15 years out<strong>2012</strong> 2013 2014 2015 2016 2017 2019 2021 2023 2025 2027Studholme 0.94 7 8 15 16 17 58 71 73 73 74 74Studholme has an unusual 110 kV bus arrangement, where the two transformershave no dedicated 110 kV circuit breakers. This means that both supply transformerswill be tripped to clear a transformer fault, causing a loss of supply at Studholme.Supply can be restored after the faulted transformer is disconnected.SolutionWe are discussing possible solutions with Alpine Energy, which include:replacing the existing transformers with higher-rated units, andbuilding a new grid exit point north of Studholme near St Andrews (if the newirrigation load is committed) on the 220 kV Islington–Livingstone circuit, andtransferring some of the Studholme load.Acquisition of substation land will be required for establishing a new grid exit point.An additional consideration is that both Studholme supply transformers areapproaching their expected end-of-life within the next five years. If an agreement toproceed with the transformer upgrade has not been made prior to the need forreplacement, we will discuss the transformer capacity upgrade project with AlpineEnergy in conjunction with the replacement work.18.8.12 Tekapo A supply security and supply transformer capacityProject status/purpose:This issue is for information onlyIssueA single 110/11 kV, 35 MVA transformer in series with a single 11/33 kV, 10 MVA 155transformer supplies load at Tekapo resulting in no n-1 security.155 The transformer’s protection limit of 7 MVA and metering equipment limit of 8 MVA prevent the fullnominal installed capacity being available.<strong>2012</strong> <strong>Annual</strong> <strong>Planning</strong> <strong>Report</strong> © <strong>Transpower</strong> New Zealand Limited <strong>2012</strong>. All rights reserved. 289
Chapter 18: South Canterbury RegionThe peak load at Tekapo A is forecast to exceed the transformer’s winter capacity byapproximately 1 MW in 2019, increasing to approximately 2 MW in 2027 (see Table18-10).Table 18-10: Tekapo A supply transformer overload forecastGrid exitpointPowerfactorNext 5 yearsTransformer overload (MW)5-15 years out<strong>2012</strong> 2013 2014 2015 2016 2017 2019 2021 2023 2025 2027Tekapo A 1.00 0 0 0 0 0 0 1 1 2 2 2SolutionAlpine Energy considers the issue can be managed operationally for the forecastperiod. Resolving the protection limits will provide sufficient capacity for the durationof the forecast period. Future investment will be customer driven.18.8.13 Temuka transmission security and supply transformer capacityProject reference:Project status/purpose:Indicative timing:Indicative cost band:Additional transformer: TMK-POW_TFR-DEV-02Upgrade circuit capacity: TIM_TMK-TRAN-EHMT-01Possible, customer-specificTo be advisedAdditional transformer: BUpgrade circuit capacity: BIssueTwo 110 kV Timaru–Temuka circuits, each rated at 70/77 MVA (summer/winter),supply the Temuka 33 kV load.An outage of one of these circuits will cause the other circuit to exceed its thermalcapacity from <strong>2012</strong> during summer peak demand periods. Also, there is no 110 kVbus at Temuka. Therefore, a circuit outage will also result in the loss of the110/33 kV supply transformer connected to this circuit.At Temuka, two 110/33 kV transformers supply the 33 kV load, providing:a total nominal installed capacity of 108 MVA, andn-1 capacity of 61/63 MVA (summer/winter).The peak load at Temuka is forecast to exceed the transformers’ n-1 summercapacity by approximately 12 MW in <strong>2012</strong>, increasing to approximately 53 MW in2027 (see Table 18-11).Table 18-11: Temuka supply transformer overload forecastGrid exitpointPowerfactorNext 5 yearsTransformer overload (MW)5-15 years out<strong>2012</strong> 2013 2014 2015 2016 2017 2019 2021 2023 2025 2027Temuka 0.96 12 14 16 19 21 24 33 38 43 48 53SolutionWe are discussing options with Alpine Energy. A long-term solution involves:paralleling the existing transformers and installing a new 120 MVA transformer,andupgrading the 110 kV circuits between Timaru and Temuka, ora new connection to the 220 kV Islington–Waitaki circuits, west of Temuka.290<strong>2012</strong> <strong>Annual</strong> <strong>Planning</strong> <strong>Report</strong> © <strong>Transpower</strong> New Zealand Limited <strong>2012</strong>. All rights reserved.
Chapter 18: South Canterbury RegionThe addition of a new transformer will not raise new property issues as it can beimplemented within the existing substation boundary. However, upgrading thecapacity of the 110 kV Temuka–Timaru circuits may require easements.A long-term solution will depend on whether there is likely to be further growth at theClandeboye dairy factory, which accounts for more than half the demand at this gridexit point.18.8.14 Timaru supply transformer capacityProject reference: TIM-POW_TFR-EHMT-01Project status/purpose: Possible, customer-specificIndicative timing: 2014Indicative cost band: CIssueThree 110/11 kV transformers supply Timaru’s load, providing:a total nominal installed capacity of 77 MVA (one 27 MVA and two 25 MVA), andn-1 capacity of 54/56 MVA (summer/winter).The peak load at Timaru already exceeds the transformers’ n-1 winter capacity, andthe overload is forecast to increase to approximately 34 MW in 2027 (see Table 18-12).Table 18-12: Timaru supply transformer forecast overloadGrid exitpointPowerfactorNext 5 yearsTransformer overload (MW)5-15 years out<strong>2012</strong> 2013 2014 2015 2016 2017 2019 2021 2023 2025 2027Timaru 0.96 18 19 28 28 29 29 30 31 32 33 34There is a non-contracted spare transformer unit on site, allowing possiblereplacement within 8-14 hours following a unit failure (if the spare unit is available).Alpine Energy can also transfer some load from Timaru following a transformer fault.SolutionWe are discussing the options with Alpine Energy, including:replacing the existing three 110/11 kV supply transformers with three 40 MVAunits, andinstalling two 220/33 kV, 120 MVA supply transformers and a new 33 kVswitchboard, and retaining some or all of the 110/11 kV transformers. Thesolution will also affect the loading on the Timaru interconnecting transformers(see Section 18.8.2), and these two issues need to be resolved together.An additional consideration is that Timaru supply transformers have an expected endof-lifewithin the next 5-10 years. We will discuss options with Alpine Energy forincreasing supply security at Timaru.No property issues are anticipated, as it is likely that either option can beimplemented within the existing substation boundary.18.8.15 Waitaki single supply security and supply transformer capacityProject reference:Project status/purpose:Indicative timing:Indicative cost band:WTK-POW_TFR-EHMT-01Possible, customer-specificInstall a second supply transformer: to be advisedIncrease transformer capacity by adding fans and pumps: 2014Install a second supply transformer: A<strong>2012</strong> <strong>Annual</strong> <strong>Planning</strong> <strong>Report</strong> © <strong>Transpower</strong> New Zealand Limited <strong>2012</strong>. All rights reserved. 291
Chapter 18: South Canterbury RegionIncrease transformer capacity by adding fans and pumps: AIssueA single 11/33 kV, 5.5 MVA transformer supplies load at Waitaki resulting in no n-1security.Network Waitaki can supply some of the Waitaki load from Twizel after a short loss ofsupply. However, the peak Waitaki load is forecast to exceed the continuous supplytransformer capacity by approximately 2 MW in <strong>2012</strong>, increasing to approximately18 MW in 2027 (see Table 18-13). Network Waitaki has requested options forsecurity and capacity enhancements.Table 18-13: Waitaki supply transformer overload forecastGrid exitpointPowerfactorNext 5 yearsTransformer overload (MW)5-15 years out<strong>2012</strong> 2013 2014 2015 2016 2017 2019 2021 2023 2025 2027Waitaki 0.95 2 2 2 6 6 7 12 12 17 18 18SolutionWe are investigating options with Network Waitaki to increase capacity and securityof supply in the area.A possible solution to increase the security of supply involves installing a secondsupply transformer.Possible options to resolve the capacity issues include:transferring 2 MW of load to another grid exit point, delaying the issue until 2014,orincreasing the capacity of the supply transformer.18.9 Other regional items of interestThere are no other items of interest identified to date beyond those set out inSection 18.8. See Section 18.10 for more information about specific generationproposals relevant to this region.18.10 South Canterbury generation proposals and opportunitiesThis section details relevant regional issues for selected generation proposals underinvestigation by developers and in the public domain, or other generationopportunities.The maximum generation that can be connected depends on several factors andusually falls within a range. Generation developers should consult with us at an earlystage of their investigations to discuss connection issues. See our website for moreinformation about connecting generation. 15618.10.1 North Bank projectThe proposed North Bank hydro project, located on the north bank of the WaitakiRiver, consists of two hydro generation stations with total generation capacity ofapproximately 265 MW.The proposed connection option is one generation station connecting to the 110 kVGlenavy–Waitaki ‘A’ line, and the other generation station connecting to the 220 kV156 http://www.transpower.co.nz/connecting-new-generation.292<strong>2012</strong> <strong>Annual</strong> <strong>Planning</strong> <strong>Report</strong> © <strong>Transpower</strong> New Zealand Limited <strong>2012</strong>. All rights reserved.
Chapter 18: South Canterbury RegionRoxburgh–Islington ‘A’ line. It is likely that the Lower Waitaki Valley grid upgradeplan may have some effect on the generation dispatch for the power stationconnecting to the 110 kV line. At times, depending on the connection configuration,some generation may be constrained post-contingency. The generation connectionconfiguration is yet to be finalised.18.10.2 Wind generationThere are no issues with connecting wind or other generation at existing substationswithin the Waitaki Valley at 220 kV.Connecting too much generation to one of the four circuits to Christchurch may causeit to overload and reduce the total amount of load that can be supplied across all fourcircuits.The maximum generation that can be connected varies with the point of connectionand the circuit. Connections close to the Waitaki Valley enable the most generation,approximately equal to the circuit rating. The best case location and circuit willenable 400-700 MW of generation. The worst case location and circuit will notsupport the dispatch of generation.Unless the 110 kV Tekapo A–Albury–Timaru circuit is upgraded, there is limitedopportunity to connect new generation because of the existing generation atTekapo A, and the Opuha generation embedded at Albury.The other 110 kV circuits in the South Canterbury region can support generationconnections up to or slightly higher than the circuit rating.<strong>2012</strong> <strong>Annual</strong> <strong>Planning</strong> <strong>Report</strong> © <strong>Transpower</strong> New Zealand Limited <strong>2012</strong>. All rights reserved. 293
Chapter 19: Otago-Southland Region19 Otago-Southland Regional Plan19.1 Regional overview19.2 Otago-Southland transmission system19.3 Otago-Southland demand19.4 Otago-Southland generation19.5 Otago-Southland significant maintenance work19.6 Future Otago-Southland projects summary and transmission configuration19.7 Changes since the 2011 <strong>Annual</strong> <strong>Planning</strong> <strong>Report</strong>19.8 Otago-Southland transmission capability19.9 Other regional items of interest19.10 Otago-Southland generation proposals and opportunities19.1 Regional overviewThis chapter details the Otago-Southland regional transmission plan. We base thisregional plan on an assessment of available data, and welcome feedback to improveits value to all stakeholders.Figure 19-1: Otago-Southland region294<strong>2012</strong> <strong>Annual</strong> <strong>Planning</strong> <strong>Report</strong> © <strong>Transpower</strong> New Zealand Limited <strong>2012</strong>. All rights reserved.
Chapter 19: Otago-Southland RegionThe Otago-Southland region includes a mix of significant provincial cities (Dunedinand Invercargill) together with smaller rural localities (Queenstown and Wanaka), andthe largest electricity consumer in New Zealand, Tiwai Point Aluminium Smelter.We have assessed the Otago-Southland region’s transmission needs over the next15 years while considering longer-term development opportunities. Specifically, thetransmission network needs to be flexible to respond to a range of future service andtechnology possibilities, taking into consideration:the existing transmission networkforecast demandforecast generationequipment replacement based on condition assessment, andpossible technological development.19.2 Otago-Southland transmission systemThis section highlights the state of the Otago-Southland regional transmissionnetwork. The existing transmission network is set out geographically in Figure 19-1and schematically in Figure 19-2.Figure 19-2: Otago-Southland transmission schematicSOUTH CANTERBURYTwizelCromwell220 kV33 kVNasebySOUTH CANTERBURYLivingstoneFrankton33 kV220 kV33 kV110 kV220 kVClyde33 kVPalmerston33 kVRoxburgh110 kV220 kVManapouri110 kV33 kV110 kV220 kVThreeMile Hill220 kVHalfway Bush220 kVNorth Makarewa220 kV33 kV110 kVGore33 kVBrydone110 kV 11 kV110 kV33 kVEdendale220 kV 33 kVSouth Dunedin110 kVBerwick110 kVKEY33 kV220kV CIRCUITBalclutha110kV CIRCUIT33kV CIRCUITSUBSTATION BUS220 kVTRANSFORMER33 kVInvercargill3 WDG TRANSFORMERTEE POINTLOADTiwai220 kVCAPACITORGENERATOR19.2.1 Transmission into the regionThere are issues with the transmission capacity to transfer power into or out of theOtago-Southland region.When Otago-Southland generation is high, transmission capacity from Roxburgh mayconstrain generation dispatch within the region for some outages. With low Otago-Southland generation, the transmission capacity of the circuits from Twizel and<strong>2012</strong> <strong>Annual</strong> <strong>Planning</strong> <strong>Report</strong> © <strong>Transpower</strong> New Zealand Limited <strong>2012</strong>. All rights reserved. 295
Chapter 19: Otago-Southland RegionLivingstone to Roxburgh may exceed their thermal ratings to supply the deficit powerto the region.Under the Clutha-Upper Waitaki Lines Project (formerly known as Lower South IslandFacilitating Renewables), we have committed to upgrading the Clyde–Roxburgh andAviemore–Waitaki–Livingstone circuits by 2014. By mid 2013, we will review thetiming for the delivery of the remaining sections, namely:reconductoring the Livingstone–Naseby–Roxburgh, Aviemore–Benmore circuits,andthermally upgrading the Cromwell–Twizel circuits.See Chapter 6, Section 6.6.3 for more information.19.2.2 Transmission within the regionThe transmission within the Otago-Southland region comprises 220 kV and 110 kVtransmission circuits with interconnecting transformers located at Cromwell, HalfwayBush, Roxburgh and Invercargill.Capacitors are installed at North Makarewa to improve the system voltage andvoltage stability performance. There are also capacitors on the supply bus atBrydone for power factor correction and system voltage.The region can be divided into four load centres.The Southland 220 kV region, comprising Tiwai, Invercargill, and NorthMakarewa substations, is predominantly supplied from Manapouri, or via the220 kV Invercargill–Roxburgh circuits at times of low Manapouri generation.The Dunedin region, comprising South Dunedin, Halfway Bush and Palmerston,is predominantly supplied via Three Mile Hill.The Southland 110 kV network is supplied via the three interconnectingtransformers at Halfway Bush, Roxburgh, and Invercargill.The Central Otago area represents load supplied from Cromwell and Frankton viathe Cromwell interconnecting transformers.The 110 kV transmission network within the Otago-Southland region predominantlycomprises low-capacity circuits supplying the smaller centres within the region. Bothcapacity and voltage issues arise during outages. In addition, most of thetransformers connected to the 110 kV transmission network are older, single-phaseunits, with an expected end-of-life within the next 20 years.We have committed to implementing the Lower South Island Reliability Project toincrease the capacity of the 110 kV and 220 kV transmission network within theregion. It addresses existing issues and provides the foundation for future upgradeswhen required. The project includes a new 220/110 kV interconnection at the Goresubstation, replacing the Roxburgh 220/110 kV transformer with a higher rated unit,and a series capacitor on a North Makarewa–Three Mile Hill circuit. See Chapter 6,Section 6.6.4 for more information.19.2.3 Longer-term development pathThe Lower South Island Reliability Project addresses existing issues and provides thefoundation for future upgrades when required, which will potentially include additionalreactive support and increased line compensation.19.3 Otago-Southland demandThe after diversity maximum demand (ADMD) for the Otago-Southland region isforecast to grow on average by 0.8% annually over the next 15 years, from 1,107 MW296<strong>2012</strong> <strong>Annual</strong> <strong>Planning</strong> <strong>Report</strong> © <strong>Transpower</strong> New Zealand Limited <strong>2012</strong>. All rights reserved.
Chapter 19: Otago-Southland Regionin <strong>2012</strong> to 1,247 MW by 2027. This is lower than the national average demandgrowth of 1.7% annually.Figure 19-3 shows a comparison of the 2011 and <strong>2012</strong> forecast 15-year maximumdemand (after diversity 157 ) for the Otago-Southland region. The forecasts are derivedusing historical data, and modified to account for customer information, whereappropriate. The power factor at each grid exit point is also derived from historicaldata, and is used to calculate the real power capacity for power transformer andtransmission line. See Chapter 4 for more information about demand forecasting.Figure 19-3: Otago-Southland region after diversity maximum demand forecastLoad (MW)1500Otago-Southland140013001200110010009002011 APR Forecast<strong>2012</strong> APR ForecastActual Peak8001997 1999 2001 2003 2005 2007 2009 2011 2013 2015 2017 2019 2021 2023 2025 2027Table 19-1: lists forecast peak demand (prudent growth) for each grid exit point forthe forecast period, as required for the Grid Reliability <strong>Report</strong>.Table 19-1: Forecast annual peak demand (MW) at Otago-Southland grid exit points to2027Grid exit pointPowerfactorNext 5 yearsPeak demand (MW)5-15 years out<strong>2012</strong> 2013 2014 2015 2016 2017 2019 2021 2023 2025 2027Balclutha 0.97 31 31 32 32 33 34 35 36 37 39 39Brydone 1 0.79 12 12 12 12 12 12 12 12 12 12 12Cromwell 1.00 34 35 37 38 40 41 44 46 49 52 54Clyde 0.95 11 11 11 12 12 12 13 13 14 14 14Edendale 1 0.98 31 32 33 34 38 39 41 44 46 48 50Frankton 0.99 57 58 60 62 64 65 69 72 75 79 82Gore 1 0.97 34 40 61 62 82 83 84 86 87 88 89Halfway Bush -1 0.99 120 121 123 109 111 112 116 119 121 124 126157 The after diversity maximum demand (ADMD) for the region will be less than the sum of theindividual grid exit point peak demands, as it takes into account the fact that the peak demand doesnot occur simultaneously at all the grid exit points in the region.<strong>2012</strong> <strong>Annual</strong> <strong>Planning</strong> <strong>Report</strong> © <strong>Transpower</strong> New Zealand Limited <strong>2012</strong>. All rights reserved. 297
Chapter 19: Otago-Southland RegionGrid exit pointPowerfactorNext 5 yearsPeak demand (MW)5-15 years out<strong>2012</strong> 2013 2014 2015 2016 2017 2019 2021 2023 2025 2027Halfway Bush -2 0.99 111 113 114 115 117 118 121 124 126 129 131Invercargill 0.99 103 105 108 110 112 114 118 123 127 131 136Naseby 1.00 33 34 35 35 36 37 38 40 41 42 43North Makarewa 0.99 57 58 59 61 62 63 66 68 70 72 73Palmerston 0.97 10 10 10 11 11 11 12 12 12 13 13South Dunedin 0.99 77 78 79 96 97 98 100 102 104 107 109Tiwai 0.97 640 640 640 645 650 655 665 675 685 690 6901. Step-change information identified through customer discussions and from the Covec (anindependent consultant) forecast study prior to publishing the 2011 <strong>Annual</strong> <strong>Planning</strong> <strong>Report</strong>. Theforecast includes potential major new manufacturing loads.19.4 Otago-Southland generationThe Otago-Southland region’s generation capacity is 1,831 MW. 158 This generationusually contributes a major portion of the total South Island generation and exceedslocal demand. Surplus generation is exported over the National Grid to other demandcentres in the South Island.Table 19-2 lists the generation forecast for each grid injection point for the forecastperiod, as required for the Grid Reliability <strong>Report</strong>. This includes all known andcommitted generation stations, including those embedded within the relevant locallines company’s network (PowerNet, OtagoNet, or Aurora). 159Table 19-2: Forecast annual generation capacity (MW) at Otago-Southland grid injectionpoints to 2027 (including existing and committed generation)Grid injection point(location if embedded)Generation capacity (MW)Next 5 years5-15 years out<strong>2012</strong> 2013 2014 2015 2016 2017 2019 2021 2023 2025 2027Clyde 432 432 432 432 432 432 432 432 432 432 432Manapouri 840 840 840 840 840 840 840 840 840 840 840Roxburgh 320 320 320 320 320 320 320 320 320 320 320Balclutha (Mt. Stuart) 8 8 8 8 8 8 8 8 8 8 8Berwick/Halfway Bush(Waipori andMahinerangi)8436843684368436Clyde (Fraser) 3 3 3 3 3 3 3 3 3 3 3Clyde (Horseshoe Bendhydro and wind)42424242Clyde (Talla Burn) 3 3 3 3 3 3 3 3 3 3 3Clyde (Teviot andKowhai)Cromwell (RoaringMeg)1121121121128436421128436421124 4 4 4 4 4 4 4 4 4 4Frankton (Wye Creek) 1 1 1 1 1 1 1 1 1 1 1Halfway Bush (DeepStream)5 5 5 5 5 5 5 5 5 5 5843642112843642112843642112843642112843642112158 This excludes the resource consent applications for the Clyde and Roxburgh generation stationcapacity increases.159 Only generators with a capacity greater than 1 MW are listed. Generation capacity is rounded to thenearest megawatt.298<strong>2012</strong> <strong>Annual</strong> <strong>Planning</strong> <strong>Report</strong> © <strong>Transpower</strong> New Zealand Limited <strong>2012</strong>. All rights reserved.
Chapter 19: Otago-Southland RegionGrid injection point(location if embedded)Generation capacity (MW)Next 5 years5-15 years out<strong>2012</strong> 2013 2014 2015 2016 2017 2019 2021 2023 2025 2027Naseby (Falls Dam) 1 1 1 1 1 1 1 1 1 1 1Naseby (Paerau) 10 10 10 10 10 10 10 10 10 10 10North Makarewa(Monowai)North Makarewa (WhiteHills)7 7 7 7 7 7 7 7 7 7 758 58 58 58 58 58 58 58 58 58 5819.5 Otago-Southland significant maintenance workOur capital project and maintenance works are integrated to enable system issues tobe resolved if possible when assets are replaced or refurbished. Table 19-3 lists thesignificant maintenance-related work 160 proposed for the Otago-Southland region forthe next 15 years that may significantly impact related system issues or connectedparties.Table 19-3: Proposed significant maintenance workDescriptionBalclutha 33 kV outdoor to indoorconversionEdendale 110/33 kV supplytransformers expected end-of-lifeGore 110/33 kV supply transformersexpected end-of-life, and33 kV outdoor to indoor conversionHalfway Bush interconnectingtransformer expected end-of-lifeTentativeyearRelated system issues2013-2015 Addition of capacitors incorporated into the LowerSouth Island reliability Project will be installed at thesame time. See Section 19.8.1 for more information.2027-2029 The forecast load at Edendale exceeds thetransformer n-1 capacity from 2013. See Section19.8.5 for more information.2025-20272016-2018We will investigate the timing and rating of thereplacement transformers. See Section 19.8.7 formore information.2014-2016 This work will be coordinated with the replacementof the supply transformers to minimize outages.Halfway Bush 110/33 kV supplytransformer expected end-of-life33 kV outdoor to indoor conversion220/33 kV supply transformerexpected end-of-life2015-20172016-20172024-2026The Halfway Bush load already exceeds thetransformer’s n-1 capacity. The overloading issue iscurrently managed operationally. This work will becoordinated with the replacement of theinterconnecting transformers. See Section 19.8.8for more information.Invercargill interconnectingtransformer expected end-of-lifeNorth Makarewa 220 kV capacitorbank replacementNaseby 220/33 kV supplytransformers replacement and33 kV outdoor to indoor conversionPalmerston supply transformerexpected end-of-life, and 33 kVoutdoor to indoor conversionRoxburgh interconnectingtransformer replacement2013-2015 The transformer replacement is incorporated intothe Lower South Island Reliability Project. SeeSection 19.8.1 for more information.2020-2022 Increasing the rating of the capacitor banks will beinvestigated as part of the replacement. See Section19.8.1 for more information.2018-2020 The forecast load at Naseby exceeds thetransformer n-1 capacity from 2014. We willinvestigate the timing and rating of the replacementtransformers. See Section 19.8.10 for moreinformation.2016-2018 No n-1 security at Palmerston. Discussion aboutfuture supply security at Palmerston is currentlyunderway. See Section 19.8.12 for moreinformation.<strong>2012</strong>-2015 We have committed to replace this transformer witha higher-rated unit as part of the Lower South IslandReliability Project. See Section 19.8.2 for moreinformation.160 This may include replacement of the asset due to its condition assessment.<strong>2012</strong> <strong>Annual</strong> <strong>Planning</strong> <strong>Report</strong> © <strong>Transpower</strong> New Zealand Limited <strong>2012</strong>. All rights reserved. 299
Chapter 19: Otago-Southland RegionDescriptionSouth Dunedin 220/33 kV supplytransformer expected end-of-life,and 33 kV outdoor to indoorconversionTentativeyear2024-20262014-2015Related system issuesResolving the metering and protection limits willsolve the transformers’ n-1 capacity issue for theforecast period. See Section 19.8.14 for moreinformation.19.6 Future Otago-Southland projects summary and transmissionconfigurationTable 19-4 lists projects to be carried out in the Otago-Southland region within thenext 15 years.Figure 19-4 shows the possible configuration of Otago-Southland transmission in2027, with new assets, upgraded assets, and assets undergoing significantmaintenance within the forecast period.Table 19-4: Projects in the Otago-Southland region up to 2027Site Projects StatusBalcluthaClyde–RoxburghUpgrade supply transformer branch limiting components.Convert 33 kV outdoor switchgear to an indoor switchboard.Install 33 kV capacitors.Increase 220 kV circuit capacities by duplexing the lines connectingClyde and Roxburgh.Base CapexBase CapexCommittedCommittedCromwell Upgrade supply transformer branch limiting components. Base CapexCromwell–FranktonCromwell–TwizelEdendaleFranktonGoreHalfway BushInvercargillLivingstone–NasebyNaseby–RoxburghNasebyNorth Makarewa–Three Mile HillNorth MakarewaPalmerstonThermally upgrade the circuits.Increase 220 kV circuit capacities by thermally upgrade the linesconnecting Cromwell and Twizel.Upgrade cable on the supply transformers.Resolve protection and replace supply transformers.Upgrade supply transformer branch limiting components.Increase supply transformer capacities by adding pumps.Install two 220/110 kV interconnecting transformers.Replace supply transformers.Convert 33 kV outdoor switchgear to an indoor switchboard.Replace two 110/33 kV supply transformers with one 220/33 kV unit.Replace 220/33 kV supply transformer.Replace 220/110 kV interconnecting transformer.Convert 33 kV outdoor switchgear to an indoor switchboard.Replace 220/110 kV transformer with a higher-rated unit.Upgrade supply transformer metering equipment.Increase the 220 kV circuit capacity by duplexing the line connectingLivingstone and Naseby.Increase the 220 kV circuit capacity by duplexing the line connectingNaseby and Roxburgh.Replace supply transformers.Convert 33 kV outdoor switchgear to an indoor switchboard.Install series capacitor on one of the North Makarewa–Three MileHill circuits.Replace shunt capacitors.Replace 220/33 kV transformers with 220/66 kV units.Replace supply transformer.Convert 33 kV outdoor switchgear to an indoor switchboard.PossibleCommittedPossibleBase CapexBase CapexPossibleCommittedBase CapexBase CapexBase CapexBase CapexBase CapexBase CapexPossibleBase CapexCommittedCommittedBase CapexBase CapexCommittedBase CapexPossibleBase CapexBase CapexRoxburgh Replace 220/110 kV transformer with a higher-rated unit. CommittedSouth DunedinUpgrade supply transformer metering equipment.Replace 220/33 kV T1 supply transformer.Convert 33 kV outdoor switchgear to an indoor switchboard.Base CapexBase CapexBase Capex300<strong>2012</strong> <strong>Annual</strong> <strong>Planning</strong> <strong>Report</strong> © <strong>Transpower</strong> New Zealand Limited <strong>2012</strong>. All rights reserved.
Chapter 19: Otago-Southland RegionFigure 19-4: Possible Otago-Southland transmission configuration in 2027SOUTH CANTERBURYTwizelCromwell*220 kV33 kVNasebySOUTH CANTERBURYLivingstoneFrankton33 kV*110 kV33 kV220 kV220 kV33 kVClydePalmerston33 kVRoxburgh110 kVManapouri220 kV110 kV110 kV33 kV220 kVThreeMile Hill220 kVHalfway Bush220 kV*66 kV110 kVGore33 kV220 kV 33 kVSouth Dunedin110 kVBerwickNorth Makarewa220 kV110kV*Brydone110 kV 11 kV*110 kV33 kVEdendale220 kV33 kVInvercargill*110 kV33 kVBalcluthaKEYNEW ASSETSUPGRADED ASSETSASSETS SCHEDULEDFOR REPLACEMENTMINOR UPGRADE*Tiwai220 kV19.7 Changes since the 2011 <strong>Annual</strong> <strong>Planning</strong> <strong>Report</strong>Table 19-5 lists the specific issues that are either new or no longer relevant within theforecast period when compared to last year's report.Table 19-5: Changes Since 2011IssuesBalclutha supply transformer capacityNaseby supply transformer capacityPalmerston supply transformer capacityChangeNew issue.New issue.New issue.19.8 Otago-Southland transmission capabilityTable 19-6 summarises issues involving the Otago-Southland region for the next 15years. For more information about a particular issue, refer to the listed sectionnumber.Table 19-6: Otago-Southland region transmission issuesSectionnumberIssueRegional19.8.1 Southland transmission capacity and low voltage19.8.2 Roxburgh interconnecting transformer capacitySite by grid exit point19.8.3 Balclutha supply transformer capacity<strong>2012</strong> <strong>Annual</strong> <strong>Planning</strong> <strong>Report</strong> © <strong>Transpower</strong> New Zealand Limited <strong>2012</strong>. All rights reserved. 301
Chapter 19: Otago-Southland RegionSectionnumberIssue19.8.4 Cromwell supply transformer capacity19.8.5 Edendale supply transformer capacity19.8.6 Frankton transmission and supply security19.8.7 Gore supply transformer capacity19.8.8 Halfway Bush supply transformer capacity19.8.9 Invercargill supply transformer capacity19.8.10 Naseby supply transformer capacity19.8.11 North Makarewa supply transformer capacity19.8.12 Palmerston supply security and supply transformer capacity19.8.13 Palmerston transmission security19.8.14 South Dunedin supply transformer capacity19.8.15 Waipori transmission security19.8.1 Southland transmission capacity and low voltageProject context:Lower South Island ReliabilityProject reference: STLD-TRAN-EHMT-01Project status/purpose: Committed, to meet the Grid Reliability Standard (core grid)Indicative timing: <strong>2012</strong>-2015Indicative cost band: EIssueThe 220 kV Southland transmission network forms a geographical triangle linking thesubstations at Roxburgh, Halfway Bush and Invercargill. At each corner of thistriangle, a 220/110 kV interconnecting transformer supplies the 110 kV network.The 110 kV network features a similar geographical triangle between Roxburgh,Halfway Bush, and Gore, with a single 110 kV circuit from Gore to Brydone,Edendale, and Invercargill.This configuration can result in 110 kV network overloading and low voltages. At thetimes when Manapouri generation is low, the 220 kV network may also overload.OverloadingSome of the Southland 110 kV circuits and/or interconnecting transformers mayoverload for an outage of:some of the Southland 110 kV circuitsone of the 220 kV Invercargill–Roxburgh circuits, orone of the 220 kV Roxburgh–Three Mile Hill circuits.A 220 kV Invercargill–Roxburgh circuit may also overload for an outage of the parallelcircuit.The severity of these overloads depends on Roxburgh, Manapouri, and Waiporigeneration at the time of the outage.Low voltagesAn outage of some of the Southland transmission circuits or interconnectingtransformers may result in low voltages at Palmerston, Halfway Bush, Balclutha,Gore, and Edendale.302<strong>2012</strong> <strong>Annual</strong> <strong>Planning</strong> <strong>Report</strong> © <strong>Transpower</strong> New Zealand Limited <strong>2012</strong>. All rights reserved.
Chapter 19: Otago-Southland RegionAn outage of the 110 kV Balclutha–Berwick–Halfway Bush circuit may result in lowvoltage at Balclutha and Gore.SolutionThe overloading issues can be managed operationally by regulating the amount ofgeneration at Manapouri, Waipori and Roxburgh. The extent to which generationmay need to be regulated will depend on the generation dispatched in the SouthIsland at the time. In addition, some load can be transferred from the Halfway Bush110 kV bus to the 220 kV bus, and some low voltage problems can be resolved usingthe existing transformer off-load tap changers.We have committed to implementing the Lower South Island Reliability Project toincrease the transmission capacity between Roxburgh and Invercargill. Thedevelopment plans include the following.Install Special Protection Schemes to allow sufficient build time.Replace the existing Roxburgh 220/110 kV interconnecting transformer with a150 MVA unit (see also Section 19.8.2).Replace the existing Invercargill 220/110 kV interconnecting transformer with a100 MVA unit.Install shunt capacitors for reactive support at Balclutha.Install a new 220/110 kV interconnection point comprising two 220/110 kVtransformers at Gore, and a two kilometre 220 kV double-circuit line connectedfrom the Gore substation to the 220 kV North Makarewa–Three Mile Hill line.Install a series capacitor on one of the North Makarewa–Three Mile Hillcircuits. 16119.8.2 Roxburgh interconnecting transformer capacityProject context:This project forms part of Lower South Island Reliability Project.See Section 19.8.1IssueThe loading on the 220/110 kV interconnecting transformer at Roxburgh mainlydepends on generation levels at the Roxburgh 110 kV bus, and the load supplied bythe Southland 110 kV transmission network.During low generation on the Roxburgh 110 kV bus, the Roxburgh interconnectingtransformer may overload with an outage of:the 220/110 kV interconnecting transformer at Halfway Bushthe 110 kV Balclutha–Berwick circuitone of the 220 kV Invercargill–Roxburgh circuits, orone of the 220 kV Roxburgh–Three Mile Hill circuits.The Roxburgh interconnecting transformer may also overload following an outage forsome instances of high generation on the Roxburgh 110 kV bus.SolutionThe interim solution is to operationally manage the loading on the interconnectingtransformer by regulating the generation on the Roxburgh 110 kV bus to prevent theinterconnecting transformer’s overload. The extent of the interconnecting transformeroverload depends on the generation dispatched in the South Island at the time.161 We are reviewing the appropriate timing of the series capacitor. A decision is expected by the end of<strong>2012</strong> with tentative commissioning by 2016.<strong>2012</strong> <strong>Annual</strong> <strong>Planning</strong> <strong>Report</strong> © <strong>Transpower</strong> New Zealand Limited <strong>2012</strong>. All rights reserved. 303
Chapter 19: Otago-Southland RegionWe have committed to replace the Roxburgh interconnecting transformer with a150 MVA unit. This longer-term solution forms part of the Lower South IslandReliability Project.19.8.3 Balclutha supply transformer capacityProject reference: BAL-POW_TFR_PTN-EHMT-01Project status/purpose: Upgrade protection: Base Capex, minor enhancementIndicative timing: <strong>2012</strong>-2013Indicative cost band: AIssueTwo 110/33 kV transformers supply Balclutha’s load, providing:a total nominal installed capacity of 60 MVA, andn-1 capacity of 31/31 MVA 162 (summer/winter).The peak load at Balclutha is forecast to exceed the transformers’ n-1 winter capacityby approximately 3 MW in <strong>2012</strong>, increasing to approximately 11 MW in 2027 (seeTable 19-7).Table 19-7: Balclutha supply transformer overload forecastGrid exitpointPowerfactorNext 5 yearsTransformer overload (MW)5-15 years out<strong>2012</strong> 2013 2014 2015 2016 2017 2019 2021 2023 2025 2027Balclutha 0.97 3 3 4 4 5 6 7 8 9 10 11SolutionThe overloading issues can be managed operationally, but we will study thepossibility of resolving the protection limit, which will solve the issue until 2014. Theinstallation of new capacitors at 33 kV (as part of the Lower South Island ReliabilityProject) will release some additional capacity. This work is planned for 2013-2015 incoordination with the 33 kV outdoor switchgear to an indoor switchboard conversion,which could remove some of the other transformer branch limiting components.19.8.4 Cromwell supply transformer capacityProject reference: CML-POW_TFR-EHMT-01Project status/purpose: Base Capex, minor enhancementIndicative timing: 2019Indicative cost band: AIssueTwo 220/110/33 kV transformers (rated at 73 MVA 163 and 50 MVA) supply Cromwell’s33 kV loads, with:a total nominal installed capacity of 123 MVA, andn-1 capacity of 41/41 MVA 164 (summer/winter).162 The transformer’s capacity is limited by the protection limit, followed by the metering limit of 34 MVA,and circuit breaker limit of 37 MVA; with these limits resolved the n-1 capacity will be 37/39 MVA(summer/winter).163 This is a bank of two transformers connected in parallel, and operated as a single unit, with the33 kV transformer windings providing a combined nominal installed capacity of 73 MVA.164 The transformer’s capacity is limited by the protection limit, followed by the current transformer,circuit breaker and disconnector limit of 46 MVA, and a bus section limit of 50 MVA; with these limitsresolved, the n-1 capacity will be 65/68 MVA (summer/winter).304<strong>2012</strong> <strong>Annual</strong> <strong>Planning</strong> <strong>Report</strong> © <strong>Transpower</strong> New Zealand Limited <strong>2012</strong>. All rights reserved.
Chapter 19: Otago-Southland RegionThe peak load at Cromwell is forecast to exceed the transformers’ n-1 winter capacityby approximately 3 MW in 2019, increasing to approximately 13 MW in 2027 (seeTable 19-8).Table 19-8: Cromwell supply transformer overload forecastGrid exitpointPowerfactorNext 5 yearsTransformer overload (MW)5-15 years out<strong>2012</strong> 2013 2014 2015 2016 2017 2019 2021 2023 2025 2027Cromwell 1.0 0 0 0 0 0 0 3 5 8 11 13SolutionResolving the protection limit will provide sufficient n-1 capacity until 2020.Upgrading other transformer branch limiting components will resolve the issue for theforecast period and beyond. Future investment will be customer driven.19.8.5 Edendale supply transformer capacityProject reference: Upgrade protection and transformer capacity: EDN-POW_TFR-EHMT-01Upgrade cable: EDN-POW_TFR-EHMT-01Project status/purpose: Upgrade protection/transformer capacity: Base Capex, minorenhancement/replacementUpgrade cable: possible, customer-specificIndicative timing: Upgrade cable and protection: <strong>2012</strong>Upgrade transformer capacity: 2017Indicative cost band: Upgrade cable and protection: AUpgrade transformer capacity: BIssueTwo 110/33 kV transformers supply Edendale’s load, providing:a total nominal installed capacity of 60 MVA, andn-1 capacity of 32/32 MVA 165 (summer/winter).The peak load at Edendale is forecast to exceed the n-1 winter capacity byapproximately 1 MW in 2013, increasing to approximately 17 MW in 2027 (see Table19-9).Table 19-9: Edendale supply transformer overload forecastGrid exitpointPowerfactorNext 5 yearsTransformer overload (MW)5-15 years out<strong>2012</strong> 2013 2014 2015 2016 2017 2019 2021 2023 2025 2027Edendale 0.98 0 1 2 3 4 5 8 10 12 15 17SolutionResolving the cable and protection limits will provide sufficient n-1 capacity until 2017.We will discuss future supply options with PowerNet, including:operational management by transferring or limiting the load to within thecapability of the supply transformer, orreplacing the existing transformers with two higher-rated units.In addition, both supply transformers at Edendale have an expected end-of-life at theend of the forecast period. We will discuss the rating and timing for the replacementtransformers with PowerNet. Future investment will be customer driven.165 The transformers’ capacity is limited by the cable and protection limit; with these limits resolved, then-1 capacity will be 34/36 MVA (summer/winter).<strong>2012</strong> <strong>Annual</strong> <strong>Planning</strong> <strong>Report</strong> © <strong>Transpower</strong> New Zealand Limited <strong>2012</strong>. All rights reserved. 305
Chapter 19: Otago-Southland Region19.8.6 Frankton transmission and supply securityProject reference: Upgrade protection and metering: FKN-POW_TFR-EHMT-01Upgrade line thermal capacity: CML_FKN-TRAN-EHMT-01Upgrade transformer capacity: FKN-POW_TFR-EHMT-02Project status/purpose: Upgrade protection and metering: Base Capex, minor enhancementUpgrade line and transformer capacities: possible, customer-specificIndicative timing: Upgrade line thermal capacity: 2019Upgrade protection and metering, and transformer capacity: 2022Indicative cost band: Upgrade line thermal capacity: to be advisedUpgrade protection and metering: AUpgrade transformer capacity: AIssueTwo 110 kV Cromwell–Frankton circuits supply Frankton’s load, providing:a total nominal installed capacity of 127/155 MVA (summer/winter), andn-1 capacity of 63/76 MVA 166 (summer/winter).Two 110/33 kV transformers (rated at 66 MVA 167 and 85 MVA) supply Frankton’sload, providing:a total nominal installed capacity of 151 MVA, andn-1 capacity of 80/80 MVA 168 (summer/winter).There is no 110 kV bus at Frankton. A fault on either a circuit or Frankton supplytransformer will cause both the circuit and supply transformer to be taken out ofservice.The peak load at Frankton is forecast to exceed the circuits’ n-1 winter thermalcapacity from approximately 2019, and the transformers’ n-1 winter capacity byapproximately 1 MW in 2023, increasing to approximately 8 MW in 2027 (see Table19-10).Table 19-10: Frankton supply transformer and Cromwell–Frankton circuit overloadforecastGrid exit pointFrankton supplytransformerCromwell–Frankton circuitsPowerfactorTransformer/circuit overload (MW)Next 5 years5-15 years out<strong>2012</strong> 2013 2014 2015 2016 2017 2019 2021 2023 2025 20270.99 0 0 0 0 0 0 0 0 1 4 80.99 0 0 0 0 0 0 2 5 8 12 15SolutionWe will discuss future supply options with Aurora closer to the time the issue arises.Possible options are:thermally upgrading the Cromwell–Frankton circuitsresolving the protection limit and recalibrating metering parameters on the newlycommissioned transformer at Frankton, andincreasing the thermal capacity of the two older supply transformers by addingpumps.166 The circuits’ capacity is limited by a line trap; with this limit resolved, the n-1 capacity will be63/77 MVA (summer/winter).167This is a bank of two transformers connected in parallel, and operated as a single unit, providing atotal nominal installed capacity of 66 MVA.168 The transformer’s capacity is limited by the protection limit, followed by the metering (82 MVA) andLV cable (90 MVA) limits; with these limits resolved, the n-1 capacity will be 113/119 MVA(summer/winter).306<strong>2012</strong> <strong>Annual</strong> <strong>Planning</strong> <strong>Report</strong> © <strong>Transpower</strong> New Zealand Limited <strong>2012</strong>. All rights reserved.
Chapter 19: Otago-Southland RegionEasements on some small parts of the line may be required for the thermal upgradework.Future investment will be customer driven.19.8.7 Gore supply transformer capacityProject reference: GOR-POW_TFR-REPL-01Project status/purpose: Base Capex, replacementIndicative timing: 2014Indicative cost band: Replace transformers with higher-rated units: AIssueTwo 110/33 kV transformers supply Gore’s load, providing:a total nominal installed capacity of 60 MVA, andn-1 capacity of 37/39 MVA (summer/winter).The peak load at Gore is forecast to exceed the transformers’ n-1 winter capacity byapproximately 19 MW in 2014, increasing to approximately 47 MW in 2027 (seeTable 19-11).Table 19-11: Gore supply transformer overload forecastGrid exitpointPowerfactorNext 5 yearsTransformer overload (MW)5-15 years out<strong>2012</strong> 2013 2014 2015 2016 2017 2019 2021 2023 2025 2027Gore 0.97 0 0 19 20 40 41 42 44 45 46 47SolutionWe will discuss future supply options with PowerNet, including:load projections and developments in the areamanaging the load to within the capability of the existing transformers, orreplacing the existing transformers with two higher-rated units.In addition, we also plan to convert the Gore 33 kV outdoor switchgear to an indoorswitchboard within the next five years.The solutions do not raise property issues as the existing substation has sufficientroom to accommodate the transformers and an indoor switchboard.19.8.8 Halfway Bush supply transformer capacityProject reference: HWB-POW_TFR-REPL-01Project status/purpose: Base Capex, replacementIndicative timing: 2017-2025Indicative cost band: To be advisedIssueThree transformers supply Halfway Bush’s 33 kV load, comprising:two 110/33 kV transformers, each with nominal capacity of 50 MVA, and n-1capacity of 54/57 MVA (summer/winter), andone 220/33 kV transformer, with a nominal capacity of 100 MVA, and n-1capacity of 112/112 MVA 169 (summer/winter).169 The transformers’ capacity is limited by a protection limit; with this limit resolved, the n-1 capacity willbe 124/131 MVA (summer/winter).<strong>2012</strong> <strong>Annual</strong> <strong>Planning</strong> <strong>Report</strong> © <strong>Transpower</strong> New Zealand Limited <strong>2012</strong>. All rights reserved. 307
Chapter 19: Otago-Southland RegionWe operate the 33 kV bus split with:both 110/33 kV transformers connected in parallel supplying one bus section, andthe 220/33 kV transformer supplying the other bus section, resulting in nocontinuous n-1 supply security.The 33 kV bus split can be closed during an outage of any one of the three supplytransformers supplying the 33 kV load. This provides an n-1 capacity of107/114 MVA (summer/winter) for an outage of the 220/33 kV transformer.The peak load at Halfway Bush is forecast to exceed the transformers’ n-1 wintercapacity by approximately 17 MW in <strong>2012</strong>, increasing to approximately 25 MW in2027 (see Table 19-12).Table 19-12: Halfway Bush supply transformer overload forecastGrid exitpointHalfway Bush-1 & -2PowerfactorNext 5 yearsTransformer overload (MW)5-15 years out<strong>2012</strong> 2013 2014 2015 2016 2017 2019 2021 2023 2025 20270.99 17 19 20 7 8 10 13 17 20 23 25The Halfway Bush supply transformer loading may be reduced by:transferring load between the Halfway Bush 110 kV and 220 kV buses with the33 kV bus split, and/orincreasing the output from Waipori generation injecting into the Halfway Bush33 kV bus, and/ortransferring up to 5 MW via Aurora’s distribution network to South Dunedin.SolutionWe are investigating closing the 33 kV bus permanently. This requires the 33 kV faultlevel, load sharing between the transformers, and the 33 kV bus voltage set-point andvoltage control to be checked for satisfactory system operation.All three supply transformers have an expected end-of-life within the forecast period.After discussions with Aurora we are intending to replace the two 110/33 kV,50 MVA supply transformers with a single 220/33 kV, 120 MVA supply transformer by2017. The old 220/33 kV, 100 MVA supply transformer will be replaced with a120 MVA unit by 2025. Converting the 33 kV outdoor switchgear to an indoorswitchboard is also scheduled to be carried out within the next five years, and we areco-ordinating this with some of Aurora’s feeder rationalization projects.Future investment will be customer driven.19.8.9 Invercargill supply transformer capacityProject reference: INV-POW_TFR-EHMT-01Project status/purpose: Base Capex, minor enhancementIndicative timing: 2013Indicative cost band: AIssueTwo 220/33 kV transformers supply Invercargill’s load, providing:a total nominal installed capacity of 240 MVA, andn-1 capacity of 105/105MVA 170 (summer/winter).170 The transformers’ capacity is limited by metering equipment; with this limit resolved, then-1 capacity will be 155/162 MVA (summer/winter).308<strong>2012</strong> <strong>Annual</strong> <strong>Planning</strong> <strong>Report</strong> © <strong>Transpower</strong> New Zealand Limited <strong>2012</strong>. All rights reserved.
Chapter 19: Otago-Southland RegionThe peak load at Invercargill is forecast to exceed the transformers’ n-1 wintercapacity by approximately 2 MW in 2013, increasing to approximately 33 MW in 2027(see Table 19-13).Table 19-13: Invercargill supply transformer overload forecastGrid exitpointPowerfactorNext 5 yearsTransformer overload (MW)5-15 years out<strong>2012</strong> 2013 2014 2015 2016 2017 2019 2021 2023 2025 2027Invercargill 0.99 0 2 5 7 9 11 16 20 24 29 33SolutionRecalibrating the metering parameters at Invercargill will solve the issue within theforecast period.19.8.10 Naseby supply transformer capacityProject reference: NSY-POW_TFR_EHMT-01Project status/purpose: Possible, customer-specificIndicative timing: 2014-2020Indicative cost band: AIssueTwo 220/33 kV transformers supply Naseby’s load, providing:a total nominal installed capacity of 70 MVA, andn-1 capacity of 35/35 MVA (summer/winter).The peak load at Naseby is forecast to exceed the transformers’ n-1 summer capacityby approximately 1 MW in 2014, increasing to approximately 9 MW in 2027 (seeTable 19-14).Table 19-14: Naseby supply transformer overload forecastGrid exitpointPowerfactorNext 5 yearsTransformer overload (MW)5-15 years out<strong>2012</strong> 2013 2014 2015 2016 2017 2019 2021 2023 2025 2027Naseby 1.0 0 0 1 1 2 3 4 6 7 8 9SolutionWe will discuss future supply options with PowerNet, which include:managing the load to within the capability of the existing transformers, orreplacing the existing transformers with two higher-rated units.In addition, both transformers are scheduled for replacement within the next 5-10years and converting the 33 kV outdoor switchgear to an indoor switchboard is alsoscheduled to be carried out at around the same time. We will discuss the rating andtiming for the replacement transformers with PowerNet, and co-ordinate the outdoorto indoor conversion project with the replacement work.Future investment will be customer driven.19.8.11 North Makarewa supply transformer capacityProject reference: NMA-POW_TFR-EHMT-01Project status/purpose: Possible, customer-specificIndicative timing: 2019Indicative cost band: To be advised<strong>2012</strong> <strong>Annual</strong> <strong>Planning</strong> <strong>Report</strong> © <strong>Transpower</strong> New Zealand Limited <strong>2012</strong>. All rights reserved. 309
Chapter 19: Otago-Southland RegionIssueTwo 220/33 kV transformers supply North Makarewa’s load, providing:a total nominal installed capacity of 120 MVA, andn-1 capacity of 67/67 MVA 171 (summer/winter).The peak load at North Makarewa is forecast to exceed the transformers’ n-1 wintercapacity by approximately 3 MW in 2021, increasing to approximately 8 MW in 2027(see Table 19-15).Table 19-15: North Makarewa supply transformer overload forecastGrid exitpointNorthMakarewaPowerfactorNext 5 yearsTransformer overload (MW)5-15 years out<strong>2012</strong> 2013 2014 2015 2016 2017 2019 2021 2023 2025 20270.99 0 0 0 0 0 0 0 3 5 7 8SolutionWe have discussed future supply options with PowerNet and they intend to replacethe two existing 220/33 kV supply transformers with new 220/66 kV units by 2019.Future investment will be customer driven.19.8.12 Palmerston supply security and supply transformer capacityProject status/purpose:This issue is for information onlyIssueA single 110/33 kV, 10 MVA supply transformer comprising three single-phase unitssupplies the load at Palmerston, resulting in no n-1 security. This transformer alsohas an expected end-of-life within the next five years.The peak load at Palmerston is forecast to exceed the transformer’s capacity byapproximately 1 MW in <strong>2012</strong>, increasing to approximately 4 MW in 2027 (see Table19-16).Table 19-16: Palmerston supply transformer overload forecastGrid exitpointPowerfactorNext 5 yearsTransformer overload (MW)5-15 years out<strong>2012</strong> 2013 2014 2015 2016 2017 2019 2021 2023 2025 2027Palmerston 0.97 1 1 1 1 1 2 2 3 3 3 4SolutionThere is a non-contracted spare on-site unit providing backup after a unit failure, withreplacement taking 8-14 hours. A limited amount of load can also be back-fedthrough the OtagoNet transmission network.We are discussing future development options with OtagoNet. Converting thetransmission to Palmerston to 33 kV (see Section 19.8.13) avoids the need to replacethe Palmerston 110/33 kV supply transformer and improves the security of supply.Future investment will be customer driven.171 The transformers’ capacity is limited by an LV cable limit, followed by the circuit breaker (69 MVA)and disconnector (71 MVA) limits; with these limits resolved, the n-1 capacity will be 76/79 MVA(summer/winter).310<strong>2012</strong> <strong>Annual</strong> <strong>Planning</strong> <strong>Report</strong> © <strong>Transpower</strong> New Zealand Limited <strong>2012</strong>. All rights reserved.
Chapter 19: Otago-Southland Region19.8.13 Palmerston transmission securityProject status/purpose:This issue is for information onlyIssueTwo 110 kV circuits supply Palmerston’s load, which include the:Halfway Bush–Palmerston 1 circuit, andHalfway Bush–Palmerston 2 circuit.Neither circuit has a circuit breaker at Palmerston, preventing the two circuits fromnormally operating in parallel. The Halfway Bush–Palmerston 2 circuit is normallyopen and the loss of the Halfway Bush–Palmerston 1 circuit will result in a short lossof supply to Palmerston until the other circuit can be put into service. Consequently,Palmerston has no continuous n-1 supply security.SolutionThe issue can be managed operationally. One possible option is to operate bothcircuits at 33 kV, and reconfigure the distribution network to provide continuous n-1security at Palmerston.Future investment will be customer driven.19.8.14 South Dunedin supply transformer capacityProject reference: SDN-POW_TFR-EHMT-01Project status/purpose: Base Capex, minor enhancementIndicative timing: 2015Indicative cost band: AIssueTwo 220/33 kV transformers supply South Dunedin’s load, providing:a total nominal installed capacity of 200 MVA, andn-1 capacity of 81/81 MVA 172 (summer/winter).The peak load at South Dunedin is forecast to exceed the transformers’ n-1 wintercapacity by approximately 16 MW in 2015, increasing to approximately 30 MW in2027 (see Table 19-17).Table 19-17: South Dunedin supply transformer overload forecastGrid exit pointPowerfactorNext 5 yearsTransformer overload (MW)5-15 years out<strong>2012</strong> 2013 2014 2015 2016 2017 2019 2021 2023 2025 2027South Dunedin 0.99 0 0 0 16 17 18 20 23 25 27 30SolutionRecalibrating the metering parameters at South Dunedin resolves the issue within theforecast period.In addition:the South Dunedin 33 kV outdoor switchyard will be converted to an indoorswitchboard within the next five years. If appropriate, we will resolve the meteringlimits during the conversion work.172 The transformers’ capacity is limited by metering equipment, followed by the protection limit of110 MVA; with these limits resolved, the n-1 capacity will be 132/139 MVA (summer/winter).<strong>2012</strong> <strong>Annual</strong> <strong>Planning</strong> <strong>Report</strong> © <strong>Transpower</strong> New Zealand Limited <strong>2012</strong>. All rights reserved. 311
Chapter 19: Otago-Southland RegionThe South Dunedin T1 supply transformer has an expected end-of-life in the next10-15 years. We will discuss the rating and timing for the replacementtransformer with Aurora.19.8.15 Waipori transmission securityProject status/purpose:This issue is for information onlyIssueWaipori generation injects into the Berwick 110 kV bus. The 110 kV Balclutha–Berwick and Berwick–Halfway Bush circuits presently have no line protection at theBerwick end, and both circuits will trip in the event of a line fault. This will disconnectWaipori generation from the National Grid, resulting in no n-1 connection security.SolutionTrustpower has not requested a higher security level and there are no plans toincrease supply security at this grid injection point. Future investment will becustomer driven. If n-1 connection security is eventually required, then lineprotection, together with the associated 110 kV current transformers and a voltagetransformer at Berwick, will need to be installed.19.9 Other regional items of interestThere are no other items of interest identified to date beyond those set out inSection 19.8. See Section 19.10 for more information about specific generationproposals relevant to this region.19.10 Otago-Southland generation proposals and opportunitiesThis section details relevant regional issues for selected generation proposals thatare under investigation by developers and in the public domain, or other generationopportunities.The maximum generation that can be connected depends on several factors andusually falls within a range. Generation developers should consult with us at an earlystage of their investigations to discuss connection issues. See our website for moreinformation about connecting generation. 17319.10.1 Maximum regional generationOtago-Southland is a generation-rich region. Surplus generation export isconstrained by the 220 kV Naseby–Roxburgh–Livingstone circuit ratings. At times,existing generation needs to be constrained under light load conditions to avoidoverloading of the 220 kV Naseby–Roxburgh–Livingstone circuit under both normaloperating conditions and during contingent events (see Chapter 6 for moreinformation).We have committed to implementing the Clutha-Upper Waitaki Lines Project toreinforce the Twizel and Livingstone circuits to Roxburgh. This in turn increases thegeneration export capability to the region, which enables new generationconnections.173 http://www.transpower.co.nz/connecting-new-generation.312<strong>2012</strong> <strong>Annual</strong> <strong>Planning</strong> <strong>Report</strong> © <strong>Transpower</strong> New Zealand Limited <strong>2012</strong>. All rights reserved.
Chapter 19: Otago-Southland Region19.10.2 Mahinerangi wind stationExpansion of the Mahinerangi wind generation station beyond stage 1 can beaccommodated on the National Grid via the two 110 kV Halfway Bush–Roxburghcircuits.Only relatively minor upgrades within the Otago-Southland region are required toenable the connection of over 200 MW of Mahinerangi generation. Potentialupgrades include increasing the Roxburgh 220/110 kV transformer capacity (anapproved project that is part of the Lower South Island Reliability Project), a thermalupgrade of part of the two 110 kV Roxburgh–Halfway Bush circuits, and increasingthe Halfway Bush 220/110 kV transformer capacity. Some or all of these upgradesmay not be required, depending on the staged development of the wind station, loadgrowth, and the economic level of trade-off between Mahinerangi generation,Waipori, and generation connections to the Roxburgh 110 kV bus.19.10.3 Edendale–Gore wind stationsThere are a number of wind generation prospects in the area to the south-east of theline between Edendale and Gore.One option is to connect wind generation to the relatively low capacity 110 kV singlecircuitline that runs between the Invercargill and Halfway Bush substations, whichconnects through the Edendale, Brydone, and Gore substations. This 110 kV linecannot be thermally upgraded. Approximately 100-120 MW of wind generation canbe connected at a substation (or less if at a new connection point along the line), butwill need to be constrained for outages of circuits within the region.Another option is to connect the wind generation stations to the 220 kV double-circuitNorth Makarewa–Three Mile Hill line. Approximately 350 MW of generation can beconnected, but parts of the line will need to be thermally upgraded.<strong>2012</strong> <strong>Annual</strong> <strong>Planning</strong> <strong>Report</strong> © <strong>Transpower</strong> New Zealand Limited <strong>2012</strong>. All rights reserved. 313
Appendix A: Grid Reliability <strong>Report</strong>Appendix AGrid reliability reportA.1 Ten year forecast of demand at each grid exit point12.76 <strong>Transpower</strong> to publish grid reliability report12.76(1) <strong>Transpower</strong> must publish a grid reliability report setting out:12.76(1)(a)a forecast of demand at each grid exit point over the next ten yearsThe table below provides a forecast of demand at each grid exit point. These canalso be viewed within the respective regional plans in Chapters 7-19.Table A.1: Ten year forecast of demand at each grid exit pointPrudent peak demand(MW) forecast<strong>2012</strong> 2013 2014 2015 2016 2017 2018 2019 2020 2021 2022NORTHLANDAlbany 33 kV 160 165 170 175 180 186 191 197 203 207 211Albany 110 kV (WairauRoad)160 165 170 175 180 186 191 197 203 207 211Bream Bay 45 46 46 47 48 49 49 52 53 53 54Dargaville 13 13 14 14 14 14 15 15 15 16 16Henderson 130 134 138 142 146 151 155 160 165 168 171Hepburn Road 165 170 175 180 186 191 197 203 209 213 218Kensington 70 71 73 74 75 77 78 79 80 82 83Maungatapere 33 kV 54 55 56 57 59 60 61 62 64 65 66Maungatapere 110 kV 63 65 66 68 70 71 73 75 77 78 80Maungaturoto 18 18 18 19 19 19 20 20 20 21 21Silverdale 80 82 85 87 90 93 96 98 101 103 105Wellsford 35 36 37 38 39 40 41 42 43 43 44Region peak 910 937 959 982 1010 1036 1060 1079 1107 1122 1144Region demand atisland peak886 914 931 938 963 988 1005 1015 1033 1046 1061AUCKLANDBombay 33 kV 25 26 26 27 14 14 14 14 0 0 0Bombay 110 kV 51 52 53 54 69 70 72 73 89 90 92Glenbrook 33 kV 32 33 33 34 35 35 36 37 38 38 39Glenbrook NZ Steel 116 116 120 120 120 120 120 120 120 120 120Hobson Street 0 0 126 130 134 137 141 144 148 150 153Mangere 33 kV 115 119 122 126 129 133 137 141 146 149 152Mangere 110 kV 55 55 55 55 55 55 55 55 55 55 55Meremere 14 14 15 15 0 0 0 0 0 0 0Mt Roskill 22 kV 130 134 138 142 146 151 155 160 165 168 171Mt Roskill 110 kV –Kingsland66 68 70 72 74 76 78 80 82 83 84Otahuhu 66 69 71 73 75 77 80 82 84 86 89314<strong>2012</strong> <strong>Annual</strong> <strong>Planning</strong> <strong>Report</strong> © <strong>Transpower</strong> New Zealand Limited <strong>2012</strong>. All rights reserved.
Appendix A: Grid Reliability <strong>Report</strong>Prudent peak demand(MW) forecast<strong>2012</strong> 2013 2014 2015 2016 2017 2018 2019 2020 2021 2022Pakuranga 163 167 171 174 178 182 185 189 192 196 200Penrose 22 kV 50 52 53 55 56 58 60 62 63 65 66Penrose 33 kV 300 309 318 328 338 348 358 369 380 388 395Penrose 110 kV -Liverpool StreetPenrose 110 kV - QuayStreet238 246 126 130 134 137 141 144 148 150 1530 0 0 0 0 0 0 0 0 0 0Takanini 125 129 133 137 141 145 149 154 158 162 165Wiri 82 85 87 90 92 95 98 101 104 106 108Region peak 1535 1569 1605 1637 1680 1723 1762 1787 1819 1849 1878Region demand atisland peak1429 1468 1499 1515 1540 1576 1605 1623 1653 1674 1697WAIKATOCambridge 38 39 39 40 40 41 42 42 43 43 38Hamilton 11 kV 47 48 49 25 0 0 0 0 0 0 0Hamilton 33 kV 148 151 154 182 212 216 221 225 230 234 238Hamilton NZR 8 8 8 8 8 8 8 8 8 8 8Hangatiki 30 31 31 32 33 33 34 35 35 36 36Hinuera 47 48 42 43 44 45 46 47 48 49 50Huntly 25 25 26 26 42 43 43 44 45 45 46Kopu 50 52 53 55 56 58 60 62 63 65 66Piako 0 28 28 29 30 31 32 33 34 35 35Putaruru 0 0 7 8 8 8 8 8 8 9 9Te Kowhai 105 110 112 117 120 122 124 127 129 131 133Te Awamutu 37 37 38 39 39 40 41 41 42 43 44Waihou 67 41 43 44 45 47 48 49 51 52 53Waikino 41 42 44 45 46 48 49 50 52 53 54Whakamaru 11 11 11 11 12 12 12 12 13 13 13Region peak 501 521 535 545 549 568 580 586 600 605 614Region demand atisland peak454 467 478 487 513 526 538 548 561 570 580BAY OF PLENTYEdgecumbe 65 67 70 72 75 77 80 83 86 88 90Kaitimako 22 27 34 35 36 37 38 39 41 41 42Kawerau Horizon 21 21 22 23 23 24 24 25 26 26 26Kawerau T6-T9 90 90 90 90 90 90 90 90 90 90 90Kawerau T11/ T14 85 85 85 85 85 85 85 85 85 85 85Kinleith 11 kV 85 85 85 85 85 85 85 85 85 85 85Kinleith 33 kV 28 29 29 30 30 31 32 32 33 33 34Lichfield 9 9 9 9 9 9 9 9 9 9 9Mt Maunganui 33 kV 72 74 76 74 76 79 81 84 86 88 90Owhata 16 16 17 17 17 18 18 18 19 19 19Papamoa 0 0 0 10 10 10 10 10 10 10 10<strong>2012</strong> <strong>Annual</strong> <strong>Planning</strong> <strong>Report</strong> © <strong>Transpower</strong> New Zealand Limited <strong>2012</strong>. All rights reserved. 315
Appendix A: Grid Reliability <strong>Report</strong>Prudent peak demand(MW) forecast<strong>2012</strong> 2013 2014 2015 2016 2017 2018 2019 2020 2021 2022Rotorua 11 kV 35 35 36 36 36 36 37 37 37 38 38Rotorua 33 kV 42 42 43 43 43 44 44 44 45 45 46Tauranga 11 kV 30 31 26 27 28 28 29 30 30 31 32Tauranga 33 kV 88 91 93 96 99 102 105 108 112 114 116Tarukenga 11 kV 12 12 12 13 13 13 13 13 14 14 14Te Kaha 2 2 2 2 2 2 2 2 2 2 2Te Matai 33 34 35 31 32 33 34 35 36 37 38Waiotahi 10 10 11 11 11 11 12 12 12 12 13Region peak 564 573 579 580 590 605 613 619 630 636 642Region demand atisland peak552 554 564 573 585 598 608 618 629 623 629CENTRAL NORTH ISLANDBunnythorpe 33 kV 110 112 114 117 119 121 124 126 129 131 133Bunnythorpe NZR 8 8 8 8 8 8 8 8 8 8 8Dannevirke 15 15 16 16 16 17 17 17 18 18 18Linton 75 77 78 80 81 83 85 86 88 89 91Mangamaire 12 12 13 13 13 13 14 14 14 14 15Mangahao 39 40 41 41 42 43 44 45 46 46 47Marton 16 16 17 17 17 18 18 18 19 19 19Mataroa 8 8 8 9 9 9 9 9 9 10 10National Park 8 8 8 8 8 8 8 8 8 9 9Ohaaki 6 6 6 6 6 6 6 7 7 7 7Ohakune 11 11 9 10 10 10 10 11 11 11 11Ongarue 11 11 11 11 11 11 11 11 12 12 12Tokaanu 11 11 11 11 11 11 12 12 12 12 12Tangiwai 11 kV 44 44 47 47 48 48 49 49 50 50 51Tangiwai NZR 10 10 10 10 10 10 10 10 10 10 10Woodville 4 4 4 4 5 5 5 5 5 5 5Waipawa 22 23 23 24 24 25 25 26 26 27 27Wairakei 50 51 52 53 54 55 56 57 59 60 60Region peak 334 342 348 352 357 360 364 365 365 370 371Region demand atisland peak286 298 305 307 317 328 334 337 345 349 355TARANAKIBrunswick 43 44 45 46 47 48 48 49 50 51 52Carrington Street 62 63 65 66 67 69 70 71 73 74 75Huirangi 28 29 29 30 30 31 32 32 33 33 34Hawera 32 33 33 34 35 35 36 37 38 38 39Hawera (Kupe) 12 12 12 12 12 12 12 12 12 12 12Motunui 9 9 9 9 9 9 9 9 9 9 9Moturoa 22 23 23 24 25 25 26 27 27 28 28Opunake 11 11 11 12 12 12 12 13 13 13 13Stratford 33 kV 31 32 32 32 33 33 34 34 35 35 36316<strong>2012</strong> <strong>Annual</strong> <strong>Planning</strong> <strong>Report</strong> © <strong>Transpower</strong> New Zealand Limited <strong>2012</strong>. All rights reserved.
Appendix A: Grid Reliability <strong>Report</strong>Prudent peak demand(MW) forecast<strong>2012</strong> 2013 2014 2015 2016 2017 2018 2019 2020 2021 2022Stratford 220 kV 11 11 11 12 12 12 12 13 13 13 13Taumarunui 11 11 11 11 11 11 11 11 11 11 11Wanganui 50 51 52 53 54 55 56 57 59 60 60Waverley 4 4 4 4 4 4 4 4 4 4 5Region peak 218 223 227 229 232 236 239 240 242 243 245Region demand atisland peak214 218 222 224 228 232 234 235 237 238 240HAWKE’S BAYFernhill 60 61 62 63 64 65 66 67 68 68 69Gisborne 49 50 52 53 54 55 57 58 60 61 62Redclyffe 70 76 77 78 79 80 82 83 84 85 86Tuai 1 1 1 1 1 1 1 1 1 1 1Wairoa 10 10 10 11 11 11 11 12 12 12 12Whirinaki 82 82 82 82 82 82 82 82 82 82 82Whakatu 95 96 98 99 101 102 104 105 107 108 110Region peak 318 322 327 330 333 339 343 346 351 354 356Region demand atisland peak284 293 297 299 306 314 319 321 326 329 334WELLINGTONCentral Park 11 kV 27 33 33 34 34 35 35 36 37 37 38Central Park 33 kV 175 174 177 181 184 188 192 196 200 203 206Gracefield 60 61 62 64 65 66 68 69 70 71 72Greytown 16 17 17 17 18 18 19 19 19 20 20Haywards 11 kV 23 24 24 24 25 25 26 26 27 27 28Haywards 33 kV 20 20 21 21 22 22 23 23 23 24 24Kaiwharawhara 43 44 45 46 47 48 49 50 51 52 52Masterton 51 52 53 54 55 56 57 59 60 61 62Melling 11 kV 30 31 31 32 33 33 34 35 35 36 36Melling 33 kV 50 51 52 53 54 55 56 57 59 60 60Pauatahanui 23 24 24 25 25 26 26 26 27 27 28Paraparaumu 68 69 70 71 71 72 73 74 75 76 77Takapu Road 103 105 107 110 112 114 116 119 121 123 125Upper Hutt 37 37 38 38 39 40 40 41 41 42 42Wilton 65 66 68 69 70 72 73 75 76 77 79Region peak 755 768 783 799 809 821 833 841 856 865 874Region demand atisland peak707 730 743 748 768 788 802 808 823 832 844NELSON-MARLBOROUGHBlenheim 80 82 84 86 88 90 92 94 96 98 100Motueka 20 21 21 21 22 22 22 22 23 23 23Motupipi 8 8 9 9 9 9 9 10 10 10 10Stoke 144 147 149 152 155 158 161 164 166 169 172<strong>2012</strong> <strong>Annual</strong> <strong>Planning</strong> <strong>Report</strong> © <strong>Transpower</strong> New Zealand Limited <strong>2012</strong>. All rights reserved. 317
Appendix A: Grid Reliability <strong>Report</strong>Prudent peak demand(MW) forecast<strong>2012</strong> 2013 2014 2015 2016 2017 2018 2019 2020 2021 2022Region peak 244 248 254 258 260 266 268 270 272 275 278Region demand atisland peak210 214 217 221 226 229 231 234 233 236 239WEST COASTArthur’s Pass 0.5 0.5 0.5 0.5 0.5 0.5 0.5 0.5 0.5 0.5 0.5Atarau 1.0 11.0 11.0 11.0 11.0 11.0 11.0 11.0 11.0 11.0 11.0Castle Hill 0.9 0.9 0.9 0.9 0.9 0.9 0.9 0.9 0.9 0.9 0.9Dobson 16.0 16.3 16.6 20.9 21.2 21.5 25.8 26.1 26.4 26.6 26.9Greymouth 15.0 15.3 15.6 15.9 16.2 16.6 16.9 17.2 17.6 17.8 18.1Hokitika 16.8 17.0 19.8 20.0 20.3 20.5 20.8 21.0 21.3 21.5 21.7Kikiwa 3.0 3.0 3.0 3.0 3.0 3.0 3.0 3.0 3.0 3.0 3.0Kumara 2.0 2.0 2.0 2.0 2.0 2.0 2.0 2.0 2.0 2.0 2.0Murchison 3.0 3.0 3.0 3.0 3.0 3.0 3.0 3.0 3.0 3.0 3.0Orowaiti 11.0 19.2 19.3 19.5 19.7 19.9 20.0 20.2 20.4 20.5 20.7Otira 0.9 0.9 0.9 0.9 0.9 1.9 1.9 1.9 1.9 1.9 1.9Reefton 11.0 11.2 11.4 11.7 11.9 12.1 12.4 12.6 12.9 13.1 13.3Westport 10.2 10.3 10.5 10.6 10.8 10.9 11.1 11.3 11.4 11.6 11.7Region peak 62 67 73 76 78 80 82 84 86 88 90Region demand atisland peak47 59 57 61 62 63 67 68 68 69 69CANTERBURYAddington 11 kV -1 35 37 38 40 41 41 42 42 35 35 36Addington 11 kV -2 25 26 27 28 28 29 29 29 24 24 25Addington 66 kV 133 138 142 145 148 150 152 149 135 136 138Ashburton 33 kV 55 56 29 29 30 15 16 16 8 8 9Ashburton 66 kV 133 137 149 154 158 167 171 176 184 187 190Ashley 12 12 13 22 23 23 24 24 25 25 26Bromley 11 kV 56 58 60 61 62 63 61 61 62 63 64Bromley 66 kV 171 183 188 194 198 199 203 209 291 294 297Coleridge 1 1 1 1 1 1 1 1 1 1 1Culverden 33 kV 21 21 22 25 26 27 27 28 29 29 29Culverden 66 kV 10 10 10 11 11 11 11 12 12 12 12Hororata 33 kV 31 25 25 25 26 19 19 19 20 20 20Hororata 66 kV 27 42 32 32 36 44 44 44 45 45 46Islington 33 kV 73 75 76 78 79 81 82 84 86 87 88Islington 66 kV 128 129 135 152 154 156 158 159 161 162 164Islington 66 kV -Papanui 113 112 112 113 114 115 117 118 81 82 82Kaiapoi 29 29 30 30 31 32 32 33 33 34 34Middleton 30 31 31 32 33 33 34 35 35 36 36Southbrook 43 45 46 39 40 41 42 43 44 45 46Springston 33 kV 43 34 34 36 38 33 34 34 35 35 36Springston 66 kV 21 32 48 49 50 58 60 61 63 64 65318<strong>2012</strong> <strong>Annual</strong> <strong>Planning</strong> <strong>Report</strong> © <strong>Transpower</strong> New Zealand Limited <strong>2012</strong>. All rights reserved.
Appendix A: Grid Reliability <strong>Report</strong>Prudent peak demand(MW) forecast<strong>2012</strong> 2013 2014 2015 2016 2017 2018 2019 2020 2021 2022Waipara 33 kV 13 13 14 14 14 22 22 23 23 23 23Waipara 66 kV 12 13 13 13 13 14 14 14 15 15 15Region peak 808 837 860 887 917 941 958 976 995 1010 1023Region demand atisland peak792 821 848 864 882 894 907 924 953 966 978SOUTH CANTERBURYAlbury 4 4 4 4 4 4 5 5 5 5 5Bells Pond 8 8 17 17 17 17 17 17 17 17 17Black Point 12 20 21 22 23 23 24 24 24 24 24Oamaru 44 46 62 65 68 69 71 73 75 75 76St Andrews 0 0 0 0 0 35 45 45 45 45 45Studholme 17 18 25 26 28 33 34 36 37 38 38Tekapo A 6 6 6 7 7 7 8 8 8 9 9Temuka 65 68 70 73 75 78 85 87 90 92 94Timaru 71 72 81 81 82 82 83 83 84 84 85Twizel 6 6 6 6 7 7 7 7 7 7 7Waitaki 7 7 7 11 11 11 12 17 17 17 17Region peak 190 199 213 227 233 261 277 292 298 301 305Region demand atisland peak138 146 172 176 179 197 205 208 210 212 213OTAGO-SOUTHLANDBalclutha 31 31 32 32 33 34 34 35 36 36 37Brydone 12 12 12 12 12 12 12 12 12 12 12Cromwell 34 35 37 38 40 41 42 44 45 46 48Clyde 11 11 11 12 12 12 12 13 13 13 13Edendale 31 32 33 34 38 39 40 41 43 44 45Frankton 57 58 60 62 64 65 67 69 70 72 74Gore 34 40 61 62 82 83 84 84 85 86 86Halfway Bush -1 120 121 123 109 111 112 114 116 117 119 120Halfway Bush -2 111 113 114 115 117 118 119 121 122 124 125Invercargill 103 105 108 110 112 114 116 118 121 123 125Naseby 33 34 35 35 36 37 38 38 39 40 40North Makarewa 57 58 59 61 62 63 64 66 67 68 69Palmerston 10 10 10 11 11 11 11 12 12 12 12South Dunedin 77 78 79 96 97 98 99 100 101 102 103Tiwai 640 640 640 645 650 655 660 665 670 675 680Region peak 1107 1114 1129 1142 1152 1165 1178 1190 1201 1209 1216Region demand atisland peak1057 1069 1090 1106 1139 1151 1162 1175 1176 1190 1<strong>2012</strong>012 <strong>Annual</strong> <strong>Planning</strong> <strong>Report</strong> © <strong>Transpower</strong> New Zealand Limited <strong>2012</strong>. All rights reserved. 319
Appendix A: Grid Reliability <strong>Report</strong>A.2 Ten year forecast of supply at each grid injection point12.76 <strong>Transpower</strong> to publish grid reliability report12.76(1) <strong>Transpower</strong> must publish a grid reliability report setting out:12.76(1)(b)a forecast of supply at each grid injection point over the next ten yearsThe table below provides a forecast of supply at each grid injection point. These canalso be viewed within the respective regional plans in Chapters 7-19.Table A.2: Ten year forecast of generation capacity at each grid injection pointGrid injection point(location if embedded)<strong>2012</strong> 2013 2014 2015 2016 2017 2018 2019 2020 2021 2022NORTHLANDAlbany (Rosedale) 3 3 3 3 3 3 3 3 3 3 3Kaikohe (Ngawha) 27 27 27 27 27 27 27 27 27 27 27Maungatapere (Wairua) 5 5 5 5 5 5 5 5 5 5 5Silverdale (Redvale) 10 10 10 10 10 10 10 10 10 10 10AUCKLANDGlenbrook 112 112 112 112 112 112 112 112 112 112 112Mangere (WatercareMangere)7 7 7 7 7 7 7 7 7 7 7Otahuhu B CCGT 380 380 380 380 380 380 380 380 380 380 380Otahuhu (GreenmountLandfill)Penrose (AucklandHospital)5 5 5 5 5 5 5 5 5 5 54 4 4 4 4 4 4 4 4 4 4Southdown CCGT 170 170 170 170 170 170 170 170 170 170 170Takanini (Whitford Landfill) 3 3 3 3 3 3 3 3 3 3 3WAIKATOArapuni 197 197 197 197 197 197 197 197 197 197 197Atiamuri 84 84 84 84 84 84 84 84 84 84 84Huntly 1448 1448 1448 1448 1448 1448 1448 1448 1448 1448 1448Karapiro 90 90 90 90 90 90 90 90 90 90 90Maraetai 360 360 360 360 360 360 360 360 360 360 360Mokai 112 112 112 112 112 112 112 112 112 112 112Ohakuri 112 112 112 112 112 112 112 112 112 112 112Te Kowhai (Te Rapa) 44 44 44 44 44 44 44 44 44 44 44Te Kowhai (Te Uku) 64 64 64 64 64 64 64 64 64 64 64Waipapa 51 51 51 51 51 51 51 51 51 51 51Whakamaru 100 100 100 100 100 100 100 100 100 100 100BAY OF PLENTYAniwhenua 25 25 25 25 25 25 25 25 25 25 25320<strong>2012</strong> <strong>Annual</strong> <strong>Planning</strong> <strong>Report</strong> © <strong>Transpower</strong> New Zealand Limited <strong>2012</strong>. All rights reserved.
Appendix A: Grid Reliability <strong>Report</strong>Grid injection point(location if embedded)<strong>2012</strong> 2013 2014 2015 2016 2017 2018 2019 2020 2021 2022Edgecumbe (Bay Milk) 10 10 10 10 10 10 10 10 10 10 10Kawerau (BOPE) 6 6 6 6 6 6 6 6 6 6 6Kawerau (TPP) 37 37 37 37 37 37 37 37 37 37 37Kawerau - KAG 105 105 105 105 105 105 105 105 105 105 105Kawerau (KA24) 9 9 9 9 9 9 9 9 9 9 9Kawerau (Norske Skog) 25 25 25 25 25 25 25 25 25 25 25Kinleith 28 28 28 28 28 28 28 28 28 28 28Matahina 72 72 72 72 72 72 72 72 72 72 72Mount Maunganui (BallanceAgri)7 7 7 7 7 7 7 7 7 7 7Rotorua (Fletcher Forests) 3 3 3 3 3 3 3 3 3 3 3Rotorua (Wheao, Flaxy,Kaingaroa)24 24 24 24 24 24 24 24 24 24 24Tauranga (Kaimai) 42 42 42 42 42 42 42 42 42 42 42CENTRAL NORTH ISLANDAratiatia 78 78 78 78 78 78 78 78 78 78 78Bunnythorpe (Tararua WindStage 2)Linton (Tararua Wind Stage1)36 36 36 36 36 36 36 36 36 36 3632 32 32 32 32 32 32 32 32 32 32Linton (Totara Road) 1 1 1 1 1 1 1 1 1 1 1Mangahao 37 37 37 37 37 37 37 37 37 37 37Nga Awa Purua 140 140 140 140 140 140 140 140 140 140 140Nga Awa Purua -Ngatamariki0 110 110 110 110 110 110 110 110 110 110Ohaaki 46 46 46 46 46 46 46 46 46 46 46Ongarue (Mokauiti, Kuratauand Wairere Falls)13 13 13 13 13 13 13 13 13 13 13Poihipi 51 51 51 51 51 51 51 51 51 51 51Rangipo 120 120 120 120 120 120 120 120 120 120 120Tararua Wind Central(Tararua Stage 3)Tararua Wind Central (TeRere Hau)93 93 93 93 93 93 93 93 93 93 9349 49 49 49 49 49 49 49 49 49 49Te Mihi 0 0 166 166 166 166 166 166 166 166 166Tokaanu 240 240 240 240 240 240 240 240 240 240 240Wairakei 161 161 109 109 109 109 109 109 109 109 109Wairakei (Hinemaiaia) 7 7 7 7 7 7 7 7 7 7 7Wairakei (Rotokawa) 35 35 35 35 35 35 35 35 35 35 35Wairakei (Te Huka) 23 23 23 23 23 23 23 23 23 23 23Woodville - Te Apiti 90 90 90 90 90 90 90 90 90 90 90TARANAKICarrington St (Mangorei) 5 5 5 5 5 5 5 5 5 5 5Hawera - Kiwi Dairy(Whareroa)70 70 70 70 70 70 70 70 70 70 70<strong>2012</strong> <strong>Annual</strong> <strong>Planning</strong> <strong>Report</strong> © <strong>Transpower</strong> New Zealand Limited <strong>2012</strong>. All rights reserved. 321
Appendix A: Grid Reliability <strong>Report</strong>Grid injection point(location if embedded)<strong>2012</strong> 2013 2014 2015 2016 2017 2018 2019 2020 2021 2022Hawera – Patea 31 31 31 31 31 31 31 31 31 31 31Hawera (Patearoa) 2 2 2 2 2 2 2 2 2 2 2Huirangi (Mangahewa) 9 9 9 9 9 9 9 9 9 9 9Huirangi (Motukawa) 5 5 5 5 5 5 5 5 5 5 5Kapuni 25 25 25 25 25 25 25 25 25 25 25Motunui Deviation (MPP) 0 100 100 100 100 100 100 100 100 100 100Stratford 385 385 385 385 385 385 385 385 385 385 385Stratford peaking plant 200 200 200 200 200 200 200 200 200 200 200Stratford (Stratford AustralPacific)1 1 1 1 1 1 1 1 1 1 1HAWKES BAYGisborne 4 4 4 4 4 4 4 4 4 4 4Gisborne (Matawai) 2 2 2 2 2 2 2 2 2 2 2Kaitawa 36 36 36 36 36 36 36 36 36 36 36Piripaua 42 42 42 42 42 42 42 42 42 42 42Redclyffe (Ravensdown) 8 8 8 8 8 8 8 8 8 8 8Tuai 60 60 60 60 60 60 60 60 60 60 60Wairoa (Waihi) 5 5 5 5 5 5 5 5 5 5 5Whirinaki 155 155 155 155 155 155 155 155 155 155 155Whirinaki (Pan Pac) 13 13 13 13 13 13 13 13 13 13 13WELLINGTONCentral Park (SouthernLandfill)Central Park (WellingtonHospital)1 1 1 1 1 1 1 1 1 1 18 8 8 8 8 8 8 8 8 8 8Greytown (Hau Nui) 9 9 9 9 9 9 9 9 9 9 9Masterton (Kourarau Aand B)1 1 1 1 1 1 1 1 1 1 1Haywards (Silverstream) 3 3 3 3 3 3 3 3 3 3 3West Wind 143 143 143 143 143 143 143 143 143 143 143NELSON-MARLBOROUGHArgyle - Branch RiverScheme11 11 11 11 11 11 11 11 11 11 11Cobb 32 32 32 32 32 32 32 32 32 32 32Blenheim (Lulworth Wind) 1 1 1 1 1 1 1 1 1 1 1Blenheim(Marlborough Lines Diesel)9 9 9 9 9 9 9 9 9 9 9Blenheim (Waihopai) 3 3 3 3 3 3 3 3 3 3 3Motupipi (Onekaka) 1 1 1 1 1 1 1 1 1 1 1WEST COASTDobson (Arnold) 3 3 3 3 3 3 3 3 3 3 3Hokitika (Amethyst) 0 6 6 6 6 6 6 6 6 6 6322<strong>2012</strong> <strong>Annual</strong> <strong>Planning</strong> <strong>Report</strong> © <strong>Transpower</strong> New Zealand Limited <strong>2012</strong>. All rights reserved.
Appendix A: Grid Reliability <strong>Report</strong>Grid injection point(location if embedded)<strong>2012</strong> 2013 2014 2015 2016 2017 2018 2019 2020 2021 2022Hokitika (McKays Creek) 1 1 1 1 1 1 1 1 1 1 1Hokitika (Wahapo-OkaritoForks)Kumara (Kumara andDillmans)3 3 3 3 3 3 3 3 3 3 310 10 10 10 10 10 10 10 10 10 10Kumara (Hokitika Diesel) 3 3 3 3 3 3 3 3 3 3 3CANTERBURYAshburton (Highbank) 25 25 25 25 25 25 25 25 25 25 25Ashburton (Montalto) 2 2 2 2 2 2 2 2 2 2 2Bromley (City Waste) 3 3 3 3 3 3 3 3 3 3 3Coleridge 45 45 45 45 45 45 45 45 45 45 45SOUTH CANTERBURYAlbury (Opuha) 8 8 8 8 8 8 8 8 8 8 8Aviemore 220 220 220 220 220 220 220 220 220 220 220Benmore 540 540 540 540 540 540 540 540 540 540 540Ohau A 264 264 264 264 264 264 264 264 264 264 264Ohau B 212 212 212 212 212 212 212 212 212 212 212Ohau C 212 212 212 212 212 212 212 212 212 212 212Tekapo A 25 25 25 25 25 25 25 25 25 25 25Tekapo B 160 160 160 160 160 160 160 160 160 160 160Waitaki 105 105 105 105 105 105 105 105 105 105 105OTAGO-SOUTHLANDClyde 432 432 432 432 432 432 432 432 432 432 432Manapouri 840 840 840 840 840 840 840 840 840 840 840Roxburgh 320 320 320 320 320 320 320 320 320 320 320Balclutha (Mt. Stuart) 8 8 8 8 8 8 8 8 8 8 8Berwick/Halfway Bush(Waipori and Mahinerangi)84368436843684368436843684368436843684368436Clyde (Fraser) 3 3 3 3 3 3 3 3 3 3 3Clyde (Horseshoe Bendhydro and wind)4242424242424242424242Clyde (Talla Burn) 3 3 3 3 3 3 3 3 3 3 3Clyde (Teviot and Kowhai) 112112112112112112112112112112112Cromwell (Roaring Meg) 4 4 4 4 4 4 4 4 4 4 4Frankton (Wye Creek) 1 1 1 1 1 1 1 1 1 1 1Halfway Bush (DeepStream)5 5 5 5 5 5 5 5 5 5 5Naseby (Falls Dam) 1 1 1 1 1 1 1 1 1 1 1Naseby (Paerau) 10 10 10 10 10 10 10 10 10 10 10North Makarewa (Monowai) 7 7 7 7 7 7 7 7 7 7 7North Makarewa (WhiteHills Wind Farm)58 58 58 58 58 58 58 58 58 58 58<strong>2012</strong> <strong>Annual</strong> <strong>Planning</strong> <strong>Report</strong> © <strong>Transpower</strong> New Zealand Limited <strong>2012</strong>. All rights reserved. 323
Appendix A: Grid Reliability <strong>Report</strong>A.3 Issues impacting on N-1 supply12.76 <strong>Transpower</strong> to publish grid reliability report12.76(1) <strong>Transpower</strong> must publish a grid reliability report setting out:12.76(1)(c) whether the power system is reasonably expected to meet the N-1criterion, including in particular whether the power system would be ina secure state at each grid exit point, at all times over the next tenyears.12.76(1)(d)proposals for addressing any matters identified in accordance with rule12.76(1)(c).The issues impacting n-1 are listed in the table below together with the projectsresolving those issues. Details on both issues and projects are available fromChapters 6-19 of this document.324<strong>2012</strong> <strong>Annual</strong> <strong>Planning</strong> <strong>Report</strong> © <strong>Transpower</strong> New Zealand Limited <strong>2012</strong>. All rights reserved.
Appendix A: Grid Reliability <strong>Report</strong>Table A.3: Backbone issues and resolving projectsIssue affecting n-1 Projects Indicative timing(June year)Project referencesInvestment proposal toCC (Forecast Juneyears)InvestmentpurposeUpper North Islandvoltage stabilityUpper North Island reactive support – Stage 2Upper North Island reactive support – Post-NIGUP2011/12-2014/15To be advisedUPNI-REA_SUP-DEV-02UPNI-REA_SUP-DEV-03ApprovedQ2 <strong>2012</strong>/13To meet GRSTo meet GRSUpper North IslandtransmissioncapacityTaranakitransmissioncapacityA new 220/400 kV double-circuit transmission line from Pakuranga toWhakamaru.See Chapter 6 for more information.Re-tune generator excitation systems and/or install power systemstabilisers.2011/12 NIGU-TRAN-DEV-01 Approved To meet GRSTo be advised TRNK-GEN_PSS-DEV-01 NA MinorenhancementUpper South Islandvoltage stabilityStage 1 – a sixth bus coupler at Islington.Stage 2 - Install additional shunt reactive support around Islington andBromley, or bus the existing circuits between Waitaki Valley and Islingtonwhere they converge near Geraldine.See Chapter 6 for more information.2015/162016/17ISL-BUS_SEC-EHMT-01WTKV-REA_PWRS-DEV-01GRD-BUSG_TRAN-DEV-01Q2 <strong>2012</strong>/13Q2 2013/14To meet GRSTo meet GRSUpper South IslandtransmissioncapacityTransmissioncapacity south ofRoxburghOptions include:an HVDC tap-off from the existing line north of Christchurch, anda new transmission line to Ashburton or Islington.See Chapter 6 for more information.The projects include:Install special protection schemes on the 220 kV and 110 kV network.Replace interconnecting transformers at Roxburgh and Invercargill.A new 220/110 kV interconnection at Gore.Install capacitor banks at Balclutha.Install a series capacitor on one of the North Makarewa–Three Mile Hillcircuits.See Chapter 6 for more information.To be advised UPSI-TRAN-DEV-01 To be advised To meet GRS<strong>2012</strong>/13-2014/15 LWSI-TRAN-EHMT-01 Approved To meet GRS<strong>2012</strong> <strong>Annual</strong> <strong>Planning</strong> <strong>Report</strong> © <strong>Transpower</strong> New Zealand Limited <strong>2012</strong>. All rights reserved. 325
Appendix A: Grid Reliability <strong>Report</strong>A.4: Regional issues and resolving projectsRegion Issue affecting n-1 Projects Indicativetiming(June year)Project referencesInvestmentproposal to CC(Forecast Juneyears)InvestmentpurposeNorthlandHenderson interconnectingtransformer capacity(Issue arises from 2023)New grid exit point at Wairau Road.Replace limiting switchgear on theHenderson T1 if required.2013/142023/24WRR-SUBEST-DEV-01HEN-POW_TFR_DIS-EHMT-01NANACustomer-specificMinor enhancementHenderson–Wellsfordtransmission capacity(Issue arises from 2024)Marsden interconnectingtransformer capacity(Issue arises from 2023)North Auckland and theNorthland regiontransmission capacityNorth of Hendersontransmission capacity(Issue already exists)North of Huapaitransmission security(Issue already exists)North of Marsden lowvoltage(Issue arises from 2013)Upper North Island voltageinstability for grid backbonecontingenciesAutomatic split the 110 kV network betweenHenderson and Maungatapere or thermalupgrade the Henderson–Wellsford circuits.Install a 3 rd 220/110 kV transformer, andconvert the 220 kV and 110 kV buses tothree zones.North Auckland and Northland project(NAaN).North Auckland and Northland project(NAaN) provides a 2 nd 220 kV connectionsinto Albany from the south.Splitting Huapai 220 kV bus once the NAaNproject is complete.Additional voltage support at Kaitaia orMaungatepere.Upper North Island reactive support (seeChapter 6).2024/25 HEN-MPE-TRAN-EHMT-01 To be advised To meet GRS2023/24 MDN-POW_TFR-DEV-01 To be advised To meet GRSQ2 2013/14 ALB_PAK-TRAN-DEV-01 Approved To meet GRSNA NA NA NAQ2 2013/14 HPI-BUSC-DEV-01 NA Minor enhancementTo be advised MDN-C_BANKS-DEV-01 NA To meet GRSand/or customerspecificSee backbone See backbone See backbone See backboneAlbany supply transformercapacity(Issue arises from 2023)Resolve protection and circuit breaker limits. 2023/24 ALB-POW_TFR_EHMT-01 NA Minor enhancementBream Bay supply Resolve protection limits. 2021/22 BRB-POW_TFR_PTN-EHMT-01 NA Minor enhancement326<strong>2012</strong> <strong>Annual</strong> <strong>Planning</strong> <strong>Report</strong> © <strong>Transpower</strong> New Zealand Limited <strong>2012</strong>. All rights reserved.
Appendix A: Grid Reliability <strong>Report</strong>Region Issue affecting n-1 Projects Indicativetiming(June year)Project referencesInvestmentproposal to CC(Forecast Juneyears)Investmentpurposetransformer capacity(Issue arises from 2021)Dargaville transmissionsecurity(Issue already exists)<strong>Transpower</strong> will discuss the timing andcapacity of the Maungatapere supplytransformers replacement with Northpower.<strong>2012</strong>/13-2014/15MPE-POW_TFR-EHMT-01 NA ReplacementDargaville supplytransformer capacity(Issue arises from <strong>2012</strong>)Henderson supplytransformer capacity(Issue arises from <strong>2012</strong>)Kaikohe–Maungatapere 110kV transmission capacity(Issue arises from 2014)Issue can be managed operationally,followed by adding fans and/or pumps.Issue can be managed operationally.Longer term solution is to install a thirdsupply transformer.Issue can be managed operationally.Longer term solution is to thermal upgrade110 kV Kaikohe–Maungatapere circuits.2013/14 DAR-POW-TFR-EHMT-01 NA Customer-specificTo be advised HEN-POW_TFR-EHMT-01 NA Customer-specificTo be advised KOE_MPE-TRAN-EHMT-01 NA Customer-specificKensington transmissionsecurity and supplytransformer capacity(Supply transformer capacityissue already exists,transmission security issuearrises from 2016)Issue can be managed operationally.Longer term solution is to replace supplytransformers and upgrade the 33 kVswitchboard, and upgrade branch limitingcomponents on the Kensington–Maungatapere circuits.NATo be advisedNAKEN-SUB-EHMT-01NANANACustomer-specificMaungatapere supplytransformer capacityIssue can be managed operationally.(Issue already exists)NA NA NA NAMaungaturoto supplytransformer capacity(Issue arises from 2019)Silverdale supplytransformer capacity(Issue arises from 2023)Resolve the protection and metering limits. 2019/20 MTO-POW_TFR_PTN-EHMT-01 NA Minor enhancementResolve the metering limits. 2023/24 SVL-POW_TFR_PTN-EHMT-01 NA Minor enhancementWellsford supply transformercapacity<strong>Transpower</strong> is investigation removing theprotection limit.<strong>2012</strong>/13 WEL-POW_TFR-EHMT-01 NA Minor enhancement<strong>2012</strong> <strong>Annual</strong> <strong>Planning</strong> <strong>Report</strong> © <strong>Transpower</strong> New Zealand Limited <strong>2012</strong>. All rights reserved. 327
Appendix A: Grid Reliability <strong>Report</strong>Region Issue affecting n-1 Projects Indicativetiming(June year)Project referencesInvestmentproposal to CC(Forecast Juneyears)Investmentpurpose(Issue already exists)AucklandAuckland region voltagequalityUpper North Island Reactive Support andNorth Island Grid Upgrade (see Chapter 6).See backbone See backbone See backbone To meet GRSNorth Auckland andNorthland regionaltransmission securityInstall new 220 kV cables betweenPakuranga, Penrose and Albany.Q2 2013/14 ALB_PAK-TRAN-DEV-01 Approved To meet GRSOtahuhu interconnectingtransformer capacityHobson Street supplysecurity(Issue arises from 2014)Issue can be managed operationally. NA NA NA NANew substation at Hobson Street. 2013/14 HOB-SUBEST-DEV-01 NA Customer-specificMangere supply transformercapacity(Issue arises from <strong>2012</strong>)Mount Roskill supplytransformer capacity(Issue arises from 2014)Otahuhu supply transformercapacity(Issue arises from <strong>2012</strong>)Otahuhu–Wiri 110 kVtransmission capacity(Issue arises from 2011)Penrose 220 kVtransmission securityLimit the peak load to the transformercapacity and/or increase the transformerprotection limits which will resolve the issueuntil 2018.Remove the circuit breaker and protectionlimits will resolve the issue until 2019.Limit the peak load to the transformercapacity, or add a third supply transformer,or replace with existing transformers withhigher-rated units.Several options being investigated, they are:A new cable from Otahuhu connecting to anew 110/33 kV transformer at Wiri.A new 110/33 kV transformer at Otahuhuand a new 33 kV cable to WiriReconductor Otahuhu–Wiri circuit.A new 220/110 kV connection at Bombayand supply Wiri from here and a 110 kVbus at Wiri.The issue will be managed operationallybefore the commissioning of a new 220 kVQ4 2011/12 MNG-POW_TFR_PTN-01 NA Minor enhancement2014/15 ROS-POW_TFR-EHMT-01 NA Customer-specificTo be advised OTA-POW_TFR-EHMT-01 NA Customer-specificTo be advised OTA_WIR-TRAN-DEV-01 NA To be advised2013/14 PAK_PEN-TRAN-DEV-01 Approved To meet GRS328<strong>2012</strong> <strong>Annual</strong> <strong>Planning</strong> <strong>Report</strong> © <strong>Transpower</strong> New Zealand Limited <strong>2012</strong>. All rights reserved.
Appendix A: Grid Reliability <strong>Report</strong>Region Issue affecting n-1 Projects Indicativetiming(June year)Project referencesInvestmentproposal to CC(Forecast Juneyears)Investmentpurpose(Issue already exists)cable connecting Pakuranga and Penrose.Otahuhu–Penrose 110 kVtransmission capacity(Issue arises from 2020)Resolve the constraint on the terminal spansat Otahuhu and Penrose substations.Longer-term solutions include replaceOtahuhu T2 & T4 with higher impedancetransformers, or upgrade the Otahuhu–Penrose circuit capacity.2020/21To be advisedOTA_PEN-TRAN-EHMT-01OTA_PEN-TRAN-DEV-01NATo be advisedMinor enhancementTo meet GRSPenrose 33 kV supplytransformer capacity(Issue already exists)Limit the peak load to the transformercapacity.NA NA NA NATakanini supply transformercapacity(Issue arises from <strong>2012</strong>)Remove protection constraints will delay theoverload until 2014.Upgrade the circuit breaker and busbarrating will resolve the issue within theforecast period.<strong>2012</strong>/132014/15TAK-POW_TFR-EHMT-01TAK-SUBEST-EHMT-01NANAMinor enhancementCustomer-specificWiri supply transformercapacity(Issue arises from 2019)Remove protection constraints will delay theoverload until 2020.Longer term options will be limit the peakload to the transformer capacity or replaceexisting transformers with higher-rated units.2019/202020/21WIR-POW_TFR_PTN-EHMT-01WIR-POW_TFR-EHMT-01NANAMinor enhancementCustomer-specificWiri Tee transmissioncapacity(Issue already exists)Likely to be resolved by Otahuhu–Wirisolution.To be advised OTA_WIR-TRAN-DEV-01 NA To be advisedWaikatoArapuni–Hamilton 110 kVtransmission capacity(Issue already exists)Issue can be managed operationally. NA NA NA NAArapuni–Kinleith 110 kVtransmission capacity(Issue already exists)Hamilton interconnectingtransformer capacity(Issue already exists)Possible short-term options are:System splitsSpecial protection scheme, orKinleith 110 kV bus reconfigurationIssue can be managed operationally in theshort-term.The longer term option is to install a new2020/21-2026/27NA2025/26ARI_KIN-TRAN-EHMT-01 <strong>2012</strong>/13 To meet GRSNANANAHAM-POW_TFR-DEV-01To be advised To meet GRS<strong>2012</strong> <strong>Annual</strong> <strong>Planning</strong> <strong>Report</strong> © <strong>Transpower</strong> New Zealand Limited <strong>2012</strong>. All rights reserved. 329
Appendix A: Grid Reliability <strong>Report</strong>Region Issue affecting n-1 Projects Indicativetiming(June year)Project referencesInvestmentproposal to CC(Forecast Juneyears)Investmentpurposeinterconnecting transformer.Hamilton–Waihou 110 kVtransmission capacity(Issue arises from 2016)Issue can be managed operationally in theshort-term.Longer term options are to construct a newHamilton–Waihou or upgrade existingHamilton–Waihou circuits.NA2016/17NAHAM_WHU-TRAN-DEV-01NANACustomer-specificCustomer-specificWaihou–Waikino–Kopu spurlow voltage(Issue already exists)Install capacitors, either on the grid or withinthe distribution network, orinstall supply transformers with onload tapchangers.2014/15-2016/172013/14-2014/15VLYS-REA_PWS-DEV-01 2014/15 To meet GRSCambridge supplytransformer capacity(Issue already exists)Upgrade bus section and protection limits. <strong>2012</strong>/13-2013/14CBG-SUBEST-EHMT-01 NA Customer-specificHamilton supply transformercapacity(Issue already exists)Increase the rating of the two existing TeKowhai transformer by installing radiatorsand fans and transfer load to Te Kowhai.Longer term options are to install a third220/33 kV supply transformer at Hamilton orat Te Kowhai.<strong>2012</strong>/132017/18TWH-POW_TFR-EHMT-01HAM-SUBEST-DEV-01NANACustomer-specificCustomer-specificHangatiki supply transformercapacity(Issue already exists)Contracted spare unit on site.Longer-term options are replace existingtransformers with two 40 MVA units.2014-15 HTI-POW_TFR-REPL-01 NA ReplacementHinuera supply transformercapacity(Issue already exists)New grid exit point at Putaruru, andreplace the 30 MVA with a 60 MVA unit.2014/15To be advisedPTR-SUBEST-DEV-01HIN-POW_TFR-EHMT-01NANACustomer-specificCustomer-specificHinuera transmissionsecurity(Issue already exists)New grid exit point at Putaruru. 2014/15 PTR-SUBEST-DEV-01 NA Customer-specificKopu supply transformercapacity(Issue already exists)Reomove the protection constraints willresolve the issue until 2018.Q2 <strong>2012</strong>/13 KPU-POW_TFR_PTN-EHMT-01 NA Minor enhancementMaraetai–Whakamaru Issue can be managed operationally by an NA NA NA NA330<strong>2012</strong> <strong>Annual</strong> <strong>Planning</strong> <strong>Report</strong> © <strong>Transpower</strong> New Zealand Limited <strong>2012</strong>. All rights reserved.
Appendix A: Grid Reliability <strong>Report</strong>Region Issue affecting n-1 Projects Indicativetiming(June year)Project referencesInvestmentproposal to CC(Forecast Juneyears)Investmentpurposetransmission capacity(Issue already exists)existing generation runback scheme.Te Awamutu supplytransformer capacity(Issue arises from 2015)Resolve the protection limits. 2015/16 TMU-POW_TFR_PTN-EHMT-01 NA Minor enhancementTe Awamutu transmissionsecurity(Issue already exists)A second transmission circuit either fromHangatiki or Karapiro.2014/15 HTI_TMU-TRAN-DEV-01 NA Customer-specificWaihou supply transformercapacity(Issue already exists)New grid exit point at Piako, andreplace the supply transformers with higherratedunits.<strong>2012</strong>/132022/23-2026/27PAO-SUBEST-DEV-01WHU-POW_TFR-REPL-01NANACustomer-specificreplacementWaikino supply transformercapacity(Issue arises from <strong>2012</strong>)Issue can be managed operationally.Longer-term option includes increase thesupply transformers’ capacity.NA2020/21NAWKO-POW_TFR- REPL-01NANANAreplacementBay of PlentyTarukenga interconnectingtransformer capacityThermally upgrade the Kaitimako–Tarukengacircuits and change the operating voltagefrom 110 kV to 220 kV and install two220/110 kV, 150 MVA transformers atKaitimako.A third 220/110 kV interconnectingtransformer at Kaitimako.Q2 <strong>2012</strong>/132017/18KMO_TRK-TRAN-EHMT-01KMO-POW_TFR-DEV-01ApprovedTo be advisedTo meed GRSTo meed GRSTauranga and MountMaunganui transmissionsecurity(Issue arises from 2013 andfrom 2018)New grid exit point at Papamoa. To be advised PPM-SUBEST-DEV-01 NA Customer-specificEdgecumbe supplytransformer capacity(Issue already exists)Upgrade protection limit, andreplace transformers with higher-rated units.<strong>2012</strong>/13To be advisedEDG-POW_TFR_PTN-EHMT-01EDG-POW_TFR-EHMT-01NANAMinor enhancementCustomer-specificKaitimako supply security(Issue already exists)Issue can be managed operationally. NA NA NA NA<strong>2012</strong> <strong>Annual</strong> <strong>Planning</strong> <strong>Report</strong> © <strong>Transpower</strong> New Zealand Limited <strong>2012</strong>. All rights reserved. 331
Appendix A: Grid Reliability <strong>Report</strong>Region Issue affecting n-1 Projects Indicativetiming(June year)Project referencesInvestmentproposal to CC(Forecast Juneyears)InvestmentpurposeKinleith–Tarukenga 110 kVtransmission capacity(Issue already exists)Issue can be managed operationally. NA NA NA NAKinleith 110/33 kV supplytransformer capacity(Issue arises from <strong>2012</strong>)Replace the 20 MVA supply transformer witha 40 MVA unit.2015/16 KIN-POW_TFR-EHMT-01 NA Customer-specificMount Maunganui supplytransformer capacity(Issue arises from 2019)Issue can be managed operationally. NA NA NA NAOkere–Te Matai 110 kVtransmission capacity(Issue already exists)Owhata supply transformercapacity(Issue already exists)Thermally upgrading the Kaitimako–Tarukenga circuits and changing theoperating voltage from 110 kV to 220 kV andinstall two 220/110 kV, 150 MVAtransformers at Kaitimako will alleviate theissue until 2023.Increase the existing transformers capacity.Three options are currently under reviewed.Q2 <strong>2012</strong>/13 KMO_TRK-TRAN-EHMT-01 Approved To meet GRS2014/15 OWH-POW_TFR-EHMT-01 NA Customer-specificRotorua supply transformercapacity(Issue arises from <strong>2012</strong>)Increase 110/11 kV supply transformercapacity or transfer some 11 kV load to the33 kV bus and Owhata.2013/14-2014/15ROT-POW_TFR-EHMT-01 NA Customer-specificRotorua transmissionsecurity(Issue already exists)Issue can be managed operationally in theshort-term.In the longer term, thermally upgrade theRotorua–Tarukenga circuits.NA2014/15NAROT_TRK-TRAN-EHMT-01NANANACustomer-specificTarukenga supply security(Issue already exists)Tauranga 11 kV supplytransformer capacity(Issue arises from <strong>2012</strong>)Issue can be managed operationally. NA NA NA NAIssue can be managed operationally. NA NA NA NATauranga 33 kV supply The transformer capacity issue will be NA NA NA NA332<strong>2012</strong> <strong>Annual</strong> <strong>Planning</strong> <strong>Report</strong> © <strong>Transpower</strong> New Zealand Limited <strong>2012</strong>. All rights reserved.
Appendix A: Grid Reliability <strong>Report</strong>Region Issue affecting n-1 Projects Indicativetiming(June year)Project referencesInvestmentproposal to CC(Forecast Juneyears)Investmentpurposetransformer capacity(Issue arises from 2017)resolved when the limiting component on thesupply transformer is removed on completionof the 33 kV indoor switchboard project.Te Matai supply transformercapacity(Issue arises in 2014, thefrom 2019)Issue can be managed operationally. NA NA NA NAWaiotahi supply transformercapacity(Issue arises from <strong>2012</strong>)Replace the existing transformers with twohigher-rated units.2019/20 WAI-POW_TFR-REPL-01 NA ReplacementWaiotahi and Te Kahasupply security(Issue already exists)Issue can be managed operationally. NA NA NA NACentral NorthIslandBunnythorpe interconnectingtransformer capacity(Issue aready exists)Issue can be managed operationally in theshort-term.In the longer term, replace the existingtransformers with higher-rated units.2014/15-2016/17BPE-POW_TFR-EHMT-01 To be advised To meet GRSBunnythorpe–Mataroa 110kV transmission capacity(Issue already exists)Short-term, the issue can be resolved bymanaging HVDC north power flow orincreasing Arapuni generation, or openingthe Arapuni–Ongarue circuit.Longer term, to install either series reactorsor phase shifting transformers.NATo be advisedNABPE_MTR-TRAN-EHMT-01NA2013/14NATo meet GRSBunnythorpe–Woodville 110kV transmission capacity(Issue already exists)Short-term, the issue can be managedoperationally.Longer-term, install an SPS to automaticallyopen the Mangamaire–Woodville circuit,reconductor the Bunnythorpe–Woodvillecircuits with higher-rated conductors, orconvert the Bunnythorpe–Woodville circuitsto 220 kV operation.NA2013/142015/16-2020/21NABPE_WDV-TRAN-EHMT-01NA2013/14NATo meet GRSBunnythorpe supplytransformer capacity(Issue arises from <strong>2012</strong>)Issue can be managed operationally. NA NA NA NA<strong>2012</strong> <strong>Annual</strong> <strong>Planning</strong> <strong>Report</strong> © <strong>Transpower</strong> New Zealand Limited <strong>2012</strong>. All rights reserved. 333
Appendix A: Grid Reliability <strong>Report</strong>Region Issue affecting n-1 Projects Indicativetiming(June year)Project referencesInvestmentproposal to CC(Forecast Juneyears)InvestmentpurposeLinton supply transformercapacity(Issue arises from 2015)Mangahao supplytransformer capacity(Issue arises from <strong>2012</strong>)Marton supply transformercapacity(Issue arises from 2023)Mataroa supply security(Issue already exists)National Park transmissionand supply transformersecurity(Issue already exists)Ohakune supply transformersecurity and capacity(Issue arises from 2011)Ongarue supply transformersecurity(Issue already exists)Tokaanu supply transformersecurity(Issue already exists)Issue can be managed operationally. NA NA NA NAIssue can be managed operationally. NA NA NA NAResolve metering limits. 2023/24 MTN-POW_TFR-EHMT-01 NA Minor enhancementIssue can be managed operationally. NA NA NA NAIssue can be managed operationally. NA NA NA NAA new feeder from Tangiwai. <strong>2012</strong>/2013 TNG-SUBEST-DEV-01 NA Customer-specificIssue can be managed operationally. NA NA NA NAIssue can be managed operationally. NA NA NA NAWaipawa supply capacityand security(Security issue alreadyexists, and capacity issuearises from 2015)Resolve the metering and protection limits onthe 110/33 kV transformers.Issue can be managed operationally for lackof n-1 security for 11 kV load.2015/16NAWPW-POW_TFR_PTN-EHMT-01NANANAMinor enhancementNATaranakiNorth Taranaki transmissioncapacity and low voltagePossible options are: 2015/16- TRNK-TRAN-EHMT-01 To be advised To meet GRS334<strong>2012</strong> <strong>Annual</strong> <strong>Planning</strong> <strong>Report</strong> © <strong>Transpower</strong> New Zealand Limited <strong>2012</strong>. All rights reserved.
Appendix A: Grid Reliability <strong>Report</strong>Region Issue affecting n-1 Projects Indicativetiming(June year)issues(Issue already exists)Brunswick supply security(Issue already exists)A second transformer at New Plymouth.Convert 220 kV New Plymouth–Stratfordcircuits to 110 kV operation.Constraining on generation.Upgrade terminating spans capacity on theCarrington Street–Stratford circuitsReplace Huirangi supply transformers withtransformers with on load tap changers.2020/21Project referencesInvestmentproposal to CC(Forecast Juneyears)InvestmentpurposeAdd a second transformer. 2017/18 BRK-POW_TFR-DEV-01 NA Customer-specificCarrington Street supplytransformer capacity(Issue arises from <strong>2012</strong>)Upgrade protection equipment, andupgrade the LV bus section, disconnectorsand current transformers.<strong>2012</strong>/13 CST-POW_TFR_PTN-EHMT-01CST-POW_TFR-EHMT-01NANAMinor enhancementCustomer-specificHawera voltage quality(Issue already exists)Install reactive support at Hawera, orcontract for aditional reactive support, orinstall under-voltage load sheddingcapability.2015/16-2020/21HWA-C_BANKS-DEV-01 To be advised To meet GRSHawera (Kupe) supplysecurity(Issue already exists)Issue can be managed operationally. NA NA NA NAHawera supply transformercapacity(Issue arises from 2013)Issue can be managed operationally in theshort-term.Longer term option is to replace the existingtransformers with two 50 MVA units.NA NA NA NAHuirangi supply transformercapacity(Issue arises from <strong>2012</strong>)Issue can be managed operationally in theshort-term.Longer term option is to replace existingsupply transformers with two 50 MVA units.NA2018/2019NAHUI-POW_TFR-REPL-01NANANAReplacementOpunake supply transformercapacity(Issue arises from 2019)Resolve the metering and protection limits. 2019/20 OPK_POW-TFR-EHMT-01 NA Minor enhancementStratford supply transformercapacityReplace the supply transformers with two 40MVA units.<strong>2012</strong>/13-2014/15SFD-POW_TFR-REPL-01 NA Replacement<strong>2012</strong> <strong>Annual</strong> <strong>Planning</strong> <strong>Report</strong> © <strong>Transpower</strong> New Zealand Limited <strong>2012</strong>. All rights reserved. 335
Appendix A: Grid Reliability <strong>Report</strong>Region Issue affecting n-1 Projects Indicativetiming(June year)Project referencesInvestmentproposal to CC(Forecast Juneyears)Investmentpurpose(Issue already exists)Hawkes BayWanganui supplytransformer capacity(Issue already exists)Waverly supply security(Issue already exists)Hawke’s Bay voltage quality(Issue already exists)Fernhill–Redclyffe 110 kVtransmission capacity(Issue already exists)Redclyffe–Tuai 110 kVtransmission capacity(Issue already exists)Possible options are:Replace existing transformers with two 80MVA units.New 110 kV feeders from Wanganui.Install new supply transformer atBrunswick.2013/14-2015/16WGN-POW_TFR-REPL-01 NA ReplacementIssue can be managed operationally. NA NA NA NAIssue can be managed operationally. NA NA NA NAIssue can be managed operationally. NA NA NA NAIssue can be managed operationally. NA NA NA NARedclyffe interconnectingtransformer capacity(Issue already exists)Issue can be managed operationally bytransfer load from the 110 kV network to the220 kV network and constraining-ongeneration at Waikaremoana.NA NA NA NAFernhill supply transformercapacity(Issue already exists)Replace the 30 MVA with an 80 MVA unit. 2018/19 FHL-POW_TFR-REPL-01 NA ReplacementGisborne 110 kV voltagequalityIssue can be managed operationally.Longer term option is to install newcapacitors at Gisborne.To be advised To be advised To be advised To meet GRSGisborne supply capacity(Issue arises from 2015)Thermally upgrade, or reconductor part or allof both Gisborne–Tuai circuits, andrecalibrate Gisborne supply transformers’2015/162023/24GIS_TUI-TRAN-EHMT-01GIS-POW_TFR-EHMT-01NANACustomer-specificMinor enhancement336<strong>2012</strong> <strong>Annual</strong> <strong>Planning</strong> <strong>Report</strong> © <strong>Transpower</strong> New Zealand Limited <strong>2012</strong>. All rights reserved.
Appendix A: Grid Reliability <strong>Report</strong>Region Issue affecting n-1 Projects Indicativetiming(June year)Project referencesInvestmentproposal to CC(Forecast Juneyears)Investmentpurposemetering parameters.Redclyffe supply transformercapacity(Issue already exists)Replace supply transformers with two 120MVA units.Q1 2013/14 RDF-POW_TFR-EHMT-01 NA Customer-specificTuai supply security(Issue already exists)Wairoa supply transformercapacity(Issue arises from 2015)Whakatu supply transformercapacity(Issue arises from 2021)Issue can be managed operationally. NA NA NA NAIssue can be managed operationally. NA NA NA NAIssue can be managed operationally. NA NA NA NAWellingtonWellington regionaltransmission security(Issue arises from 2015)Install a second 250 MVA interconnectingtransformer.2015/16-2020/21WIL-POW_TFR-DEV-03 To be advised To meet GRSCentral Park supplytransformer capacity(110/33 kV transformercapacity issue arises from2015)(33/11 kV transformercapcity issue arises from2013)Replace 110/33 kV transformers with 120MVA units or to extend the transformers’lives.33/11 kV transformer overload issue can bemanaged operationally.<strong>2012</strong>/13-2013/14CPK-POW_TFR-DEV-01 NA ReplacementGreytown supply transformercapacity(Issue arises from 2016)Resolve metering and protection limits. 2016/17 GYT-POW_TFR-EHMT-01 NA Minor enhancementHaywards supplytransformer capacity andsecurity(Issue arises from <strong>2012</strong>)Replace with two 110/33/11 kV 60 MVAsupply transformers.2013/2014 HAY-POW_TFR-DEV-01 NA ReplacementKaiwharawhara transmission Issue can be managed operationally. NA NA NA NA<strong>2012</strong> <strong>Annual</strong> <strong>Planning</strong> <strong>Report</strong> © <strong>Transpower</strong> New Zealand Limited <strong>2012</strong>. All rights reserved. 337
Appendix A: Grid Reliability <strong>Report</strong>Region Issue affecting n-1 Projects Indicativetiming(June year)Project referencesInvestmentproposal to CC(Forecast Juneyears)Investmentpurposeand supply security, andsupply transformer capacity(Issue already exists)Masterton supplytransformer capacity(Issue already exists)Replace existing transformers with two60 MVA units.<strong>2012</strong>/13 MST-POW_TFR-DEV-01 NA Customer-specificMelling supply capacity(Hayward–Melling circuitcapacity issue arises from2023)(110/33 kV and 110/11 kVtransformer capacity issuesarise from <strong>2012</strong>)Hayward–Melling: use the short term ratingfor the circuit, thermally upgrade the circuits,or reconductor the line.110/33 kV: recalibrate the metering will deferthe issue until 2022.110/11 kV: resolve HV protection limit willdefer the issue until 2014. <strong>Transpower</strong> willdiscuss future supply options with WellingtonElectricity.2023/242011/12HAY_MLG-TRAN-EHMT-01MLG-POW_TFR-EHMT-01NANACustomer-specificMinor enhancementParaparaumu transmissionsecurity and supplytransformer capacity(Issue already exists)Interim, post-contingency load reduction, usesupply transformer’s short-term thermalratings, or install capacitors on theParaparaumu 33 kV bus.Long term, additional supply transformer or anew grid exit point.<strong>2012</strong>/132014/15PRM-C_BANKS-DEV-01PRM-POW_TFR-DEV-01To be advisedNATo meet GRSCustomer-specificPauatahanui supplytransformer capacity(Issue arises from <strong>2012</strong>)Options will be discussed with WellingtonElectricity.To be advised To be advised NA Customer-specificTakapu Road supplytransformer capacity(Issue already exists)Resolve protection and metering limits willdefer the issue until 2014.Long term option is to increase the supplytransformer capacity.Q2 <strong>2012</strong>/13To be advisedTKR-POW_TFR-EHMT-01TKR-POW_TFR-DEV-01NANAMinor enhancementCustomer-specificUpper Hutt supplytransformer capacity(Issue arises from <strong>2012</strong>)Wilton supply transformercapacityResolve protection and metering limits. Q2 2013/14 UHT-POW_TFR-EHMT-01 NA Minor enhancementResolve protection limits. 2023/24 WIL-POW_TFR-EHMT-01 NA Minor enhancement338<strong>2012</strong> <strong>Annual</strong> <strong>Planning</strong> <strong>Report</strong> © <strong>Transpower</strong> New Zealand Limited <strong>2012</strong>. All rights reserved.
Appendix A: Grid Reliability <strong>Report</strong>Region Issue affecting n-1 Projects Indicativetiming(June year)Project referencesInvestmentproposal to CC(Forecast Juneyears)Investmentpurpose(Issue arises from 2023)Nelson-MarlboroughStoke 220/10 kVinterconnecting transformercapacity(Issue arises from 2020)Resolve the station equipment constraints,and managed operationally via generationrescheduling and load management.2020/21 STK-POW_TFR-DEV-01 NA Minor enhancementStoke 110/66 kVinterconnecting transformercapacity(Issue arises from <strong>2012</strong>)Install a second interconnecting transformer. To be advised STK-POW_TFR-EHMT-02 NA Customer-specificCobb–Motueka 66 kVtransmission capacity(Issue already exists)Issue can be managed operationally usingan automatic generation runback scheme.NA NA NA NAMotueka supply transformercapacity(Issue arises from 2011)Resolve the protection limits, followed byinstall capacitors at Motueka, andestablish a new grid exit point near Riwaka.<strong>2012</strong>/132013/142016/17MOT-POW_TFR-EHMT-01MOT-C_BANKS-DEV-01MOT-SUBEST-DEV-01NANANAMinor enhancementCustomer-specificCustomer-specificMotupipi single supplysecurity(Issue already exists)Issue can be managed operationally. NA NA NA NAKikiwa–Stoke 110 kVtransmission capacity(Issue arises from 2020)Issue can be managed operationally.Longer term option is to thermally upgradethe Kikiwa–Stoke 110 kV circuit.Beyond2020/21KIK_STK-TRAN-EHMT-01 To be advised To meet GRSStoke supply transformercapacity(Issue already exists)Replace existing supply transformers withtwo 120 MVA units, followed byestablish a new grid exit point at Brightwater.<strong>2012</strong>/13-2013/142015/16STK-POW_TFR-EHMT-01STK-SUBEST-DEV-01NANACustomer-specificCustomer-specificWest CoastInangahua–Murchison–Kikiwa transmission capacity(Issue arises from 2017)Thermal upgrade the Inangahua–Murchison–Kikiwa circuit, or a special protectionscheme to trip load post contingency.2017/18 IGH_KIK-TRAN-EHMT-01 To be advised To meet GRSKikiwa interconnectingtransformer capacityIssue can be managed operationally. NA NA NA NAWest Coast low voltageInstall additional capacitors, or a specialprotection scheme to trip load post2020/21 WCST-REA_SUP-DEV-01 To be advised To meet GRS<strong>2012</strong> <strong>Annual</strong> <strong>Planning</strong> <strong>Report</strong> © <strong>Transpower</strong> New Zealand Limited <strong>2012</strong>. All rights reserved. 339
Appendix A: Grid Reliability <strong>Report</strong>Region Issue affecting n-1 Projects Indicativetiming(June year)Project referencesInvestmentproposal to CC(Forecast Juneyears)Investmentpurpose(Issue arises from 2021)contingency, or replace Kikiwa T1 with ahigher-rated unit.Arthur’s Pass transmissionand supply security(Issue already exists)Castle Hill transmission andsupply security(Issue already exists)Issue can be managed operationally. NA NA NA NAIssue can be managed operationally. NA NA NA NADobson supply transformercapacityUpgrade protection will defer the issue until2015.Longer term options are operationalmeasures or replace the existingtransformers with higher-rated units.Q4 2013/142015/16-2017/18DOB-POW_TFR_PTN-EHMT-01DOB-POW_TFR-EHMT-01NANAMinor enhancementCustomer-specificHokitika transmissioncapacityIssue can be managed operationally.Longer term option is to implement theKawaka bonding project.NA NA NA NAMurchison transmission andsupply security(Issue already exists)Otira supply security(Issue already exists)Issue can be managed operationally. NA NA NA NAIssue can be managed operationally. NA NA NA NACanterburyIslington 220/66 kVtransformer capacity(Issue arises in 2019)Options include:establish a new 220/66 kV grid exit pointsouth of Christchurch, andinstall a fourth 220/66 kV interconnectingtransformer at Islington.2020/21To be advisedISL-POW_TFR-DEV-01 To be advised To be advisedAshburton supplytransformer capacity(Issue already exists)Install a third 220/66 kV transformer. 2014/15 ASB-POW_TFR-DEV-02 NA Customer-specificAshley supply transformercapacityReplace the existing 66/11 kV transformerswith two 40 MVA units.2015/16 ASY-POW_TFR-REPL-01 NA Replacement340<strong>2012</strong> <strong>Annual</strong> <strong>Planning</strong> <strong>Report</strong> © <strong>Transpower</strong> New Zealand Limited <strong>2012</strong>. All rights reserved.
Appendix A: Grid Reliability <strong>Report</strong>Region Issue affecting n-1 Projects Indicativetiming(June year)Project referencesInvestmentproposal to CC(Forecast Juneyears)InvestmentpurposeSouthCanterburyBromley 220/66 kVtransformer capacity andvoltage quality(Issue already exists)Coleridge supply transformersecurity(Issue already exists)Culverden supplytransformer capacity(Issue arises from 2014)Hororata supply transformercapacity and voltage quality(Issue already exists)Southbrook supplytransformer capacity(Issue arises from 2013)Springston transmissionsecurity(Issue already exists)Waipara single supplysecurity(Issue already exists)Oamaru–Waitaki voltagequality and transmissionsecurity(Issue arises from summer<strong>2012</strong>)Install one 220/66 kV transformer, then asecond and third transformer at later date.<strong>2012</strong>/13-2013/14BRY-POW_TFR-DEV-01 NA Customer-specificIssue can be managed operationally. NA NA NA NAIssue can be managed operationally in theshort term.Longer term options include increasing theexisting supply transformers capacity andchanging the operating voltage to 220/66 kVtransformers,To be advised CUL-POW_TFR-DEV-01 NA Customer-specificIssue can be managed operationally. NA NA NA NATransfer load from 33 kV to 66 kV bus byestablishing two new 66 kV feeders fromSouthbrook.Short-term: transfer load to Hororata.Long-term: shift load via distribution networkor establish a new 220/66 kV grid exit pointsouth of Christchurch.To be advised SBK-TRAN-DEV-01 NA Customer-specificNATo be advisedNATo be advisedIssue can be managed operationally. NA NA NA NAUpgrade transmission capacity (severaloptions are being investigated).Install reactive support at Oamaru.Post <strong>2012</strong>/13<strong>2012</strong>/13-2017/18LWTK-TRAN-DEV-01OAM-C_BANKS-DEV-01NANATo be advisedNANACustomer-specificTo meet GRSCustomer-specificTimaru interconnecting Increase interconnecting transformer To be advised TIM-POW_TFR-EHMT-02 Q1 <strong>2012</strong>/13 To meet GRS<strong>2012</strong> <strong>Annual</strong> <strong>Planning</strong> <strong>Report</strong> © <strong>Transpower</strong> New Zealand Limited <strong>2012</strong>. All rights reserved. 341
Appendix A: Grid Reliability <strong>Report</strong>Region Issue affecting n-1 Projects Indicativetiming(June year)Project referencesInvestmentproposal to CC(Forecast Juneyears)Investmentpurposetransformer capacity(Issue alreadt exists)capacity.Timaru 110 kV transmissionsecurity(Issue already exists)Install a 110 kV bus coupler. 2013/14 TIM-BUSC-DEV-01 To be advised To meet GRSWaitaki 220/110 kVinterconnecting transformercapacity(Issue already exists)The need to increase the interconnectioncapacity will depend on the preferred optionform the Lower Waitaki Valley Reliabilityinvestigation.2014/15-2018/19WTK-POW_TFR-REPL-01 NA ReplacementAlbury single supply securityand supply transformercapacity(Security issue alreadyexists, and capacity issuearises from 2023)Albury and Tekapo Atransmission security(Issue already exists)Issue can be managed operationally. NA NA NA NAIssue can be managed operationally. NA NA NA NABells Pond single supplysecurity(Issue already exists)Possible options include building a 110 kVbus at Bells Pond, connection to the other110 kV circuit, and a new grid exit point.To be advised BPD-BUSC-DEV-01 NA Customer-specificBlack Point single supplysecurity(Issue already exists)Oamaru supply transformercapacity(Issue arises from 2014)Issue can be managed operationally. NA NA NA NAResolve protection limits. 2013/14 OAM-POW_TFR-EHMT-01 NA Minor enhancementStudholme single supplysecurity(Issue already exists)The long term solution will be part of theLower Waitaki reliability project.see above see above see above see aboveStudholme supply Replace with higher-rated units, and 2014/15 STU-POW_TFR-EHMT-01 NA Customer-specific342<strong>2012</strong> <strong>Annual</strong> <strong>Planning</strong> <strong>Report</strong> © <strong>Transpower</strong> New Zealand Limited <strong>2012</strong>. All rights reserved.
Appendix A: Grid Reliability <strong>Report</strong>Region Issue affecting n-1 Projects Indicativetiming(June year)transformer capacity(Issue already exists)Project referencesInvestmentproposal to CC(Forecast Juneyears)Investmentpurposetransfer load to a new grid exit point. To be advised To be advised NA Customer-specificTekapo A supply securityand supply transformercapacity(Security issue alreadyexists, and capacity issuearises from 2019)Resolve protection and metering limits. 2019/20 NA NA Minor enhancementTemuka transmissionsecurity and supplytransformer capacity(Issue already exists)Install a new 120 MVA transformer, upgradethe 110 kV Timaru–Temuka circuits, or anew connection to the 220 kV Islington–Waitaki circuits, west of Temuka.To be advisedTMK-POW_TFR-DEV-02TIM_TMK-TRAN-EHMT-01NACustomer-specificTimaru supply transformercapacity(Issue arises from <strong>2012</strong>)Replace the existing transformers with three40 MVA units, or install two 220/33 kVtransformers, new 33 kV switchboard andtransfer some loads from 11 kV to 33 kV.2014/15 TIM-POW_TFR-EHMT-01 NA Customer-specificWaitaki single supplysecurity and supplytransformer capacity(Issue already exists)Install a second supply transformer toresolve supply security issue.Transfer load within lines company’snetwork, or increase supply transformer’scapacity by adding fans and pumps to solvesupply capacity issue.To be advised2013/14WTK-POW_TFR-EHMT-01 NA Customer-specificOtago-SouthlandSouthland transmissioncapacity and low voltageProjects include:An SPS to delay large investment and toallow sufficient build time.Replace Roxburgh and Invercargillinterconnecting transformers with highercapacityunits.Install shunt capacitors at Balclutha.Install a new 220/110 kV interconnection atGore.Install a series capacitor on one of theNorth Makarewa–Three Mill Hill circuit.2011/12-2014/15STLD-TRAN-EHMT-01 Approved To meet GRSRoxburgh interconnecting Part of Lower South Island Reliability project. See above See above See above See above<strong>2012</strong> <strong>Annual</strong> <strong>Planning</strong> <strong>Report</strong> © <strong>Transpower</strong> New Zealand Limited <strong>2012</strong>. All rights reserved. 343
Appendix A: Grid Reliability <strong>Report</strong>Region Issue affecting n-1 Projects Indicativetiming(June year)transformer capacityProject referencesInvestmentproposal to CC(Forecast Juneyears)InvestmentpurposeBalclutha supply transformercapacity(Issue arises from <strong>2012</strong>)Cromwell supply transformercapacity(Issue arises from 2019)Edendale supply transformercapacity(Issue arises from 2013)Resolve protection limits will defer the issueuntil 2014. New capacitors (part of theLower South Island Reliability project) willrelief some additional capacity.Resolve protection limits will defer the issueuntil 2020.Limit the load within the capability of thesupply transformer, or resolve the cable andprotection limits will defer the issue until2017 and replace the supply transformerswith two higher-rated units.<strong>2012</strong>/13-2013/14BAL-POW_TFR_EHMT-01 NA Minor enhancement2019/20 CML-POW_TFR-EHMT-01 NA Minor enhancementNA<strong>2012</strong>/13NAEDN-POW_TFR-EHMT-01NANANACustomer-specificFrankton transmission andsupply security(Issue arises from 2019)Thermally upgrade the Cromwell–Franktoncircuits, and increase the protection andmetering limits on Frankton T4 transformer,and increase Frankton T2A & T2B supplytransformers’ capacities by adding pumps.2019/202022/232022/23CML_FKN-TRAN-EHMT-01FKN-POW_TFR-EHMT-01FKN-POW_TFR-EHMT-02NANANACustomer-specificMinor enhancementCustomer-specificGore supply transformercapacity(Issue arises from 2014)Halfway Bush supplytransformer capacity(Issue already exists)Invercargill supplytransformer capacity(Issue arises from 2013)Naseby supply transformercapacity(Issue arises from 2014)Replace with two higher-rated units. 2014/15 GOR-POW_TFR-REPL-01 NA ReplacementReplace two 110/33 kV transformer with one220/33 kV 120 MVA unit, andreplace 220/33 kV transformer with one 120MVA unit.2017/182025/26HWB-POW_TFR-REPL-01 NA ReplacementRecalibrate metering parameters. <strong>2012</strong>/13 INV-POW_TFR-EHMT-01 NA Minor enhancementIssue can be managed operationally, orreplace the existing transformers with twohigher-rated units.2014/15-2019/20NSY-POW_TFR_EHMT-01 NA Customer-specific344<strong>2012</strong> <strong>Annual</strong> <strong>Planning</strong> <strong>Report</strong> © <strong>Transpower</strong> New Zealand Limited <strong>2012</strong>. All rights reserved.
Appendix A: Grid Reliability <strong>Report</strong>Region Issue affecting n-1 Projects Indicativetiming(June year)Project referencesInvestmentproposal to CC(Forecast Juneyears)InvestmentpurposeNorth Makarewa supplytransformer capacity(Issue arises from 2021)Replace 220/33 kV transformers with two220/66 kV units.2018/19 NMA-POW_TFR-EHMT-01 NA Customer-specificPalmerston single supplysecurity(Issue already exists)Palmerston transmissionsecurity(Issue already exists)South Dunedin supplytransformer capacity(Issue arises from 2015)Waipori transmissionsecurity(Issue already exists)Issue can be managed operationally. NA NA NA NAIssue can be managed operationally. NA NA NA NARecalibrate metering parameters 2014/15 SDN-POW_TFR-EHMT-01 NA Minor enhancementIssue can be managed operationally. NA NA NA NA<strong>2012</strong> <strong>Annual</strong> <strong>Planning</strong> <strong>Report</strong> © <strong>Transpower</strong> New Zealand Limited <strong>2012</strong>. All rights reserved. 345
Appendix B: Grid Economic Investment <strong>Report</strong>Appendix BGrid Economic Investment <strong>Report</strong>12.115(1) <strong>Transpower</strong> must publish a grid economic investment report onwhether there are investments that it considers, other than theinvestments identified under clause 12.114 (Investmens to meet thegrid reliability standards), could be made in respect of theinterconnection assets.Issues impacting economic operation of the New Zealand electricity system are listed in the table below, together with the projects resolving thoseissues. Details on both issues and projects are available from Chapters 6-19 of this document.Table B.1: Backbone economic investmentsIssue Projects Indicative timing(June year)Project referencesForecastsubmission date(June years)Wairakei Ring circuittransmission capacityA new 220 kV double circuit transmission line between Wairakei and Whakamaru. 2013/14 WKM_WRK-TRAN-DEV-01 ApprovedCentral North Islandtransmission capacityTranche 1, range of options includes:limit power flow on the 110 kV regional networkreconductor Tokaanu–Whakamaru circuits, andthermal upgrade or reconductor Bunnythorpe–Tangiwai–Rangipo circuits.Tranche 2, range of options includes:reconductor Bunnythorpe–Tokaanu circuitsprovide new transmission capacity between Bunnythorpe and Whakamarua new line in the Taranaki area, from Taumarunui to Whakamaru, andLower North Island wide System Protection Scheme.Install reactive support.To be advised CNI-TRAN-EHMT-01 2013/14Kawerau 110 kVgeneration constraintReplace Kawerau T12 with a 250 MVA 10% impedance transformer. Interimsolution is 110 kV grid reconfigurations.2013/14<strong>2012</strong>/13-2013/14KAW-POW_TFR-DEV-01EDG_MAT-TRAN-DEV-01SubmittedTaranaki transmissioncapacityRange of options includes:thermal upgrade and/or reconductor the Brunswick–Stratford circuitsTo be advised TRNK-TRAN-EHMT-01 To be advised346<strong>2012</strong> <strong>Annual</strong> <strong>Planning</strong> <strong>Report</strong> © <strong>Transpower</strong> New Zealand Limited <strong>2012</strong>. All rights reserved.
Appendix B: Grid Economic Investment <strong>Report</strong>Issue Projects Indicative timing(June year)reconductor the Huntly–Stratford circuits, anda new line between Taumarunui and Whakamaru.Project referencesForecastsubmission date(June years)Transmission capacitybetween Bunnythorpe andHaywardsReplace the conductor on the 220 kV Bunnythorpe–Haywards 1 and 2 circuits. <strong>2012</strong>/13-2018/19 BPE_HAY-TRAN-EHMT-01 SubmittedInsufficient transmissioncapacity through theWaitaki Valley, andbetween Roxburgh andthe Waitaki ValleyThe project includes:thermally upgrading the 220 kV Cromwell–Twizel 1 & 2 circuitsreconductoring the following 220 kV circuits with duplex conductor:Aviemore–Waitaki–Livingstone circuits.Aviemore–Benmore 1 and 2 circuits.Clyde–Roxburgh 1 and 2 circuits, andLivingstone–Naseby and Naseby–Roxburgh circuitsUpgrade the capacity of the 220 kV Benmore–Twizel 1 circuit.To be advised2014/15To be advised2013/14To be advisedTo be advisedLWSI-TRAN-DEV-01BEN_TWZ-TRAN-EHMT-01ApprovedTo be advisedTransmission capacitybetween North and SouthIslandsHVDC projects includes:Pole 3 - Stage 1 and Stage 2Increase the HVDC line ratingHVDC link expansion Stage 3<strong>2012</strong>/13-2013/14To be advised2017/18HVDC-TRAN-DEV-01HVDC-TRAN-DEV-02HVDC-TRAN-DEV-03ApprovedTo be advised2014/15Table B.2: Regional economic investmentsRegion Issue Project Indicative Timing(June years)Project ReferenceForecastSubmission date(June years)TaranakiStratford–Hawera–Waverly–Wanganui110 kV transmission capacityReplace conductor on the 110 kV circuitsbetween Stratford and WanganuiQ2 <strong>2012</strong>/13 SFD_WGN-TRAN-EHMT-01 Approved<strong>2012</strong> <strong>Annual</strong> <strong>Planning</strong> <strong>Report</strong> © <strong>Transpower</strong> New Zealand Limited <strong>2012</strong>. All rights reserved. 347
Appendix C: Fault LevelsAppendix CFault LevelsThe Connection Code contained in Schedule 8 to the Benchmark Agreement requires<strong>Transpower</strong>:4.2(g)to publish annually a 10 year forecast of the expected minimum andmaximum fault level at each customer point of service.Calculated fault levels are very dependent on the assumptions used in the calculationand the method of calculation. The calculation of minimum fault levels depends onwhat generation is assumed to be dispatched and what grid assets are out of service.Minimum fault levels have limited meaning unless the assumptions made in thecalculation of the minimum fault level are understood. Minimum fault levels can beused for ensuring the coordination of protection relays between asset owners.Protection coordination has very important consequences for power system securityand safety of people and assets. Accordingly, we are not going to publish minimumfault levels which may be misunderstood and used in a way that threatens securityand safety. We encourage connected parties to talk with us in matters concerningprotection coordination.Table C.2 lists the maximum three-phase fault current for all points of service. TableC.3 lists the maximum single-phase to ground fault current for the 220 kV and 110 kVpoints of service. In both tables, the listed value is the initial RMS symmetrical shortcircuit current ( ) as defined by IEC 60909 2001.The 10 year forecast of maximum fault levels is based on information currently knownby <strong>Transpower</strong>. The values in the tables should be regarded as being indicative only.We have modelled committed future transmission upgrades and generation projectsusing the best information we have at this time. We know that towards the end of the10 year period, there may be additional transmission upgrades and additionalgeneration required to meet the power and energy requirements of New Zealand.We do not know exactly the nature or location of these future transmission upgradesand new generation. The maximum fault level at a point of service may also changewhere the number of supply transformers are increased or replaced as part of aService Change to meet load growth or provide supply security.Therefore, the maximum short-circuit currents listed should not be relied upon forspecifying short-circuit requirements for new substation equipment. The forecast faultlevels provide an early warning of when plant capability may be exceeded.Accordingly, while <strong>Transpower</strong> endeavours to forecast fault levels accurately, thelevels may change for a number of reasons and <strong>Transpower</strong> does not accept liabilityfor other parties reliance on the fault values contained in the forecast. <strong>Transpower</strong>encourages asset owners to consult with us for detailed information on maximumfault levels at specific sites relating to new equipment connection.The Connection Code (5.1(h)) puts an obligation on <strong>Transpower</strong> and the customer toensure its equipment does not cause the maximum short circuit power and currentlimits in Appendix B Table B2 of the Connection Code to be exceeded on or nearby tothe grid. Table C.1 shows the short circuit power and limits in Table B2 of AppendixB of the Connection Code. Note that the fault levels at some buses are already nearor exceed these values.348<strong>2012</strong> <strong>Annual</strong> <strong>Planning</strong> <strong>Report</strong> © <strong>Transpower</strong> New Zealand Limited <strong>2012</strong>.All rights reserved.
Appendix C: Fault LevelsTable C.1: Maximum short-circuit power and current limitsNominal voltage(kV)Maximum short-circuit power and current limits(MVA)(kA)220 12,000 31.5110 6,000 31.566 1,800 1650 1,350 1633 1,400 2522 950 2511 475 25We calculated maximum fault levels in Tables C.2 and C.3 using the 2001 IEC 60909method. The values are the initial RMS symmetrical short circuit levels.The fault levels have been calculated using the following basis:All generating units are assumed to be in service.A full representation of the existing transmission grid, directly connectedgeneration and embedded generation above 1 MW known to us. The existingwind farms are assumed to provide only full load current into a fault.Motor loads are not modelled.The breaker time is 0.1 seconds and the fault clearing time is 1 second.The fault impedence is zero ohms.Future committed changes to the power system including transmission upgradesand new generation detailed in this APR. We represented new transmission linesin the model with electrical parameters estimated from the best matches withexisting lines of the same conductor type. We have represented committedgeneration in our power system model with their electrical parameters scaledfrom the latest example which their type is known to us. We based the timing ofthese connections on open discussion with the asset owner, and from thegenerator’s website. The actual commissioning date may vary.Table C.2: Ten year forecast of three-phase maximum fault levels,of service(kA) of each pointGrid exit pointNORTHLANDPoint ofservice<strong>2012</strong> 2013 2014 2015 2016 2017 2018 2019 2020 2021 2022Albany ALB0331 19.2 19.2 20.6 20.7 20.8 21.2 21.2 21.2 21.6 21.6 21.6Albany ALB1101 12.3 12.3 14.0 14.2 14.3 14.9 14.9 14.9 15.5 15.5 15.6Albany ALB2201 9.9 9.9 13.1 13.3 13.5 14.7 14.8 14.8 16.0 16.0 16.1Bream Bay BRB0331 10.3 10.3 10.5 10.5 10.6 11.6 11.6 11.6 11.7 11.7 11.8Bream Bay BRB2201 5.0 5.0 5.4 5.4 5.5 7.9 8.0 8.0 8.1 8.1 8.7Dargaville DAR0111 4.8 4.8 4.8 4.8 4.8 4.9 4.9 4.9 4.9 4.9 4.9Henderson HEN0331 18.7 18.7 19.2 19.3 19.4 19.7 19.7 19.7 20.0 20.0 20.0Henderson HEN1101 20.0 20.1 22.3 22.7 23.0 24.5 24.7 24.7 26.4 26.6 27.0Henderson HEN2201 13.0 13.0 15.1 15.4 15.7 17.0 17.3 17.3 18.9 19.0 19.0Hepburn Road HEP0331 21.1 21.2 21.8 21.9 22.0 22.3 22.4 22.4 22.8 22.9 23.0Hepburn Road HEP1101 18.7 18.7 20.5 20.8 21.0 22.1 22.3 22.3 23.7 24.0 24.7Huapai HPI2201 10.6 10.6 12.7 13.0 13.1 14.7 14.8 14.8 16.0 16.0 16.1Kensington KEN0331 9.4 9.4 9.5 9.5 9.6 10.0 10.1 10.1 10.2 10.3 10.3Marsden MDN1101 7.7 7.7 8.1 8.1 8.2 10.0 10.0 10.0 10.1 10.1 10.7<strong>2012</strong> <strong>Annual</strong> <strong>Planning</strong> <strong>Report</strong> © <strong>Transpower</strong> New Zealand Limited <strong>2012</strong>.All rights reserved. 349
Appendix C: Fault LevelsGrid exit pointPoint ofservice<strong>2012</strong> 2013 2014 2015 2016 2017 2018 2019 2020 2021 2022Marsden MDN2201 5.0 5.1 5.4 5.5 5.5 7.9 7.9 7.9 8.1 8.1 9.0Maungatapere MPE0331 7.8 7.9 8.0 8.0 8.0 8.3 8.3 8.3 8.4 8.5 8.5Maungatapere MPE1101 6.8 6.8 7.1 7.1 7.1 8.1 8.1 8.1 8.5 8.7 8.7Maungaturoto MTO0331 4.6 4.6 4.7 4.7 4.7 4.8 4.8 4.8 4.8 4.8 4.8Maungaturoto MTO1101 6.7 6.7 7.0 7.0 7.0 8.0 8.0 8.0 8.4 8.6 8.5Maungaturoto MTO1102 6.7 6.7 7.0 7.0 7.0 8.0 8.0 8.0 8.3 8.6 8.5Silverdale SVL0331 17.0 17.0 18.2 18.2 18.3 18.6 18.6 18.6 18.9 18.9 18.9Wairau Road WRD0331 12.2 12.2 19.8 19.9 20.0 20.3 20.4 20.4 20.7 20.7 20.7Wellsford WEL0331 7.6 7.6 7.7 7.7 7.7 7.9 7.9 7.9 8.2 8.2 8.2AUCKLANDBombay BOB0331 9.1 9.1 9.1 9.2 9.2 9.2 9.2 9.2 9.2 9.2 9.2Bombay BOB1102 11.1 11.0 11.2 11.3 11.4 11.4 11.5 11.5 11.7 11.7 11.7Drury DRY2201 14.5 14.6 15.3 15.7 15.9 16.3 16.3 16.8 17.5 18.2 19.5Glenbrook GLN0331 16.0 16.0 16.1 16.2 16.2 16.3 16.3 16.3 16.4 16.5 17.1Glenbrook GLN0332 16.6 16.6 16.7 16.7 16.7 16.7 16.7 16.7 16.8 16.8 17.0Glenbrook GLN2201 11.2 11.2 11.6 11.8 11.9 12.1 12.1 12.4 12.8 13.1 16.1Mangere MNG0331 14.8 14.8 15.1 15.1 15.2 15.4 15.4 15.4 15.6 15.6 15.7Mangere MNG1101 17.1 17.2 18.2 18.5 18.6 19.8 19.8 20.1 21.0 21.3 21.7Mt Roskill ROS0221 21.8 21.8 22.2 22.3 22.4 22.6 22.6 22.7 22.9 23.0 23.2Mt Roskill ROS1101 17.9 17.9 19.4 19.7 19.9 20.7 20.9 21.1 22.3 22.6 23.5Otahuhu OTA0221 26.8 26.8 27.2 27.3 27.4 27.5 27.6 27.6 28.0 28.0 28.0Otahuhu OTA1101 18.2 18.2 19.3 19.6 19.8 20.9 20.9 21.3 22.3 22.6 23.0Otahuhu OTA1102 24.6 24.2 26.2 26.7 27.1 27.7 28.0 28.2 30.2 30.2 30.3Otahuhu OTA2201 20.1 20.2 22.6 23.4 24.0 24.9 25.4 26.0 29.8 29.8 29.8Otahuhu B OTC2201 20.1 20.2 22.6 23.4 24.0 24.9 25.4 26.0 29.8 29.8 29.8Pakuranga PAK0331 16.5 25.2 25.8 26.0 26.1 26.3 26.3 26.4 26.9 26.9 26.9Penrose PEN0221 21.0 21.3 21.6 21.6 21.7 21.8 21.8 21.8 22.1 22.1 22.1Penrose PEN0331 32.0 32.8 33.8 34.1 34.4 34.7 34.8 34.9 35.9 35.9 35.9Penrose PEN1101 22.8 22.0 25.0 25.6 25.9 26.6 26.9 27.0 29.0 29.0 29.0Penrose PEN2201 16.1 17.6 19.7 20.4 20.9 21.7 22.1 22.4 25.2 25.2 25.2Southdown SWN2201 17.0 17.1 18.7 19.3 19.7 20.5 20.8 21.3 23.5 23.5 23.5Takanini TAK0331 17.6 17.6 17.8 21.3 21.3 21.4 21.4 21.5 21.7 21.7 21.7Wiri WIR0331 19.5 19.5 19.8 19.9 19.9 20.0 20.1 20.1 20.4 20.4 20.4WAIKATOArapuni ARI1101 11.8 11.9 11.7 11.7 11.9 11.9 12.0 12.2 12.3 12.4 12.3Atiamuri ATI2201 17.1 17.8 18.1 18.1 18.4 18.4 25.6 25.7 25.8 25.8 25.8Cambridge CBG0111 22.4 22.4 22.4 22.4 22.4 22.4 22.4 22.4 22.5 22.5 22.4Hamilton HAM0111 13.4 13.4 13.4 13.4 13.4 13.4 13.4 13.4 13.4 13.4 13.4Hamilton HAM0331 21.3 21.3 21.3 21.4 21.4 21.5 21.4 21.5 21.5 21.6 21.6Hamilton HAM1101 15.2 15.2 15.2 15.3 15.5 15.5 15.5 15.7 15.7 15.7 15.7Hamilton HAM2201 13.4 13.4 13.5 13.7 13.9 13.9 13.9 14.1 14.2 14.3 14.2Hangatiki HTI0331 5.0 5.0 4.9 4.9 5.1 5.1 5.1 5.1 5.1 5.1 5.1350<strong>2012</strong> <strong>Annual</strong> <strong>Planning</strong> <strong>Report</strong> © <strong>Transpower</strong> New Zealand Limited <strong>2012</strong>.All rights reserved.
Appendix C: Fault LevelsGrid exit pointPoint ofservice<strong>2012</strong> 2013 2014 2015 2016 2017 2018 2019 2020 2021 2022Rotorua ROT0331 9.6 9.6 8.9 8.9 9.4 9.4 9.8 9.9 9.9 9.9 9.9Rotorua ROT1101 8.3 8.4 6.9 6.9 8.9 8.9 10.0 10.1 10.1 10.1 10.1Rotorua ROT1102 7.9 8.0 6.5 6.5 7.1 7.1 8.0 8.1 8.1 8.1 8.1Tarukenga TRK0111 10.9 10.9 10.6 10.6 10.7 10.7 10.9 10.9 10.9 10.9 10.9Tarukenga TRK1101 17.3 17.6 11.8 11.8 13.4 13.4 17.3 17.6 17.6 17.6 17.6Tarukenga TRK2201 10.8 11.1 11.0 11.0 11.3 11.3 29.1 29.2 29.3 29.3 29.3Tauranga TGA0111 14.4 14.4 14.4 14.4 14.4 14.4 15.7 15.7 15.7 15.7 15.7Tauranga TGA0331 13.3 13.3 13.3 13.3 13.4 13.4 16.3 16.3 16.3 16.4 16.4Te Kaha TKH0111 0.8 0.8 0.8 0.8 0.8 0.8 0.8 0.8 0.8 0.8 0.8Te Kaha TKH0501 0.3 0.3 0.3 0.3 0.3 0.3 0.3 0.3 0.3 0.3 0.3Te Matai TMI0331 7.5 7.5 7.5 7.5 7.6 7.6 8.3 8.4 8.4 8.4 8.4Te Matai TMI1101 6.5 6.6 6.5 6.5 6.7 6.7 9.2 9.2 9.2 9.2 9.2Waiotahi WAI0111 8.5 8.5 8.5 8.5 8.6 8.6 8.6 8.6 8.7 8.7 8.7CENTRAL NORTH ISLANDAratiatia ARA2201 16.2 17.9 18.5 20.7 21.3 21.3 22.6 22.7 22.8 22.8 22.8Bunnythorpe BPE0331 15.8 15.9 15.9 16.0 16.0 16.0 16.1 16.3 16.3 16.3 16.4Bunnythorpe BPE1101 12.6 12.8 12.9 13.1 13.1 13.1 13.3 13.7 13.7 13.7 13.8Bunnythorpe BPE2201 12.2 12.6 12.6 13.1 13.1 13.2 13.8 14.8 14.8 14.8 15.2Dannevirke DVK0111 16.2 16.3 16.3 16.3 16.3 16.3 16.4 16.4 16.4 16.4 16.4Linton LTN0331 8.8 8.8 8.9 8.9 8.9 8.9 8.9 9.0 9.0 9.0 9.0Linton LTN0332 8.7 8.8 8.8 8.8 8.8 8.8 8.9 9.0 9.0 9.0 9.1Linton LTN2201 8.7 8.9 8.9 9.2 9.2 9.2 9.5 9.9 9.9 9.9 10.1Linton LTN2202 8.9 9.1 9.2 9.7 9.7 9.7 10.3 11.4 11.5 11.5 12.0Mangahao MHO0331 9.0 9.0 9.0 9.0 9.0 9.0 9.0 9.0 9.1 9.1 9.1Mangamaire MGM0331 4.6 4.6 4.6 4.6 4.6 4.6 4.6 4.6 4.6 4.6 4.6Mangamaire MGM1101 4.8 4.8 4.8 4.9 4.9 4.9 4.9 4.9 4.9 4.9 5.0Marton MTN0331 6.6 6.6 6.6 6.6 6.6 6.6 6.6 6.7 6.7 6.7 6.7Marton MTN1101 5.2 5.3 5.3 5.3 5.3 5.3 5.3 5.4 5.4 5.4 5.5Marton MTN1102 5.2 5.3 5.3 5.3 5.3 5.3 5.3 5.4 5.4 5.4 5.4Mataroa MTR0331 3.6 3.6 3.6 3.6 3.6 3.6 3.6 3.6 3.6 3.6 3.6National Park NPK0331 1.6 1.6 1.6 1.6 1.6 1.6 1.6 1.6 1.6 1.6 1.6Nga Awa Purua NAP2201 15.7 17.1 18.0 19.9 20.4 20.4 21.8 22.0 22.0 22.0 22.0Ohaaki OKI0331 2.3 2.3 2.3 2.3 2.3 2.3 2.3 2.3 2.3 2.3 2.3Ohaaki OKI2201 13.3 14.2 14.7 16.0 16.3 16.7 17.8 17.8 17.9 17.9 17.9Ohakune OKN0111 4.7 4.7 4.7 4.7 4.7 4.7 4.7 4.7 4.7 4.7 4.7Ongarue ONG0331 2.6 2.6 2.6 2.6 2.6 2.6 2.6 2.6 2.6 2.6 2.6Poihipi PPI2201 14.2 16.5 17.0 22.9 23.6 23.6 25.2 25.4 25.5 25.5 25.4Rangipo RPO2201 6.7 6.8 7.1 7.2 7.2 7.3 7.4 7.4 7.4 7.4 7.4Tangiwai TNG0111 19.7 19.7 19.8 19.8 19.8 19.8 19.9 19.9 19.9 19.9 19.9Tangiwai TNG2201 5.0 5.0 5.1 5.1 5.1 5.2 5.2 5.2 5.2 5.2 5.2Tararua WindCentral TWC2201 8.5 8.6 8.6 8.9 9.0 9.0 9.4 10.1 10.1 10.1 10.4Tokaanu TKU0331 3.8 3.8 3.8 3.8 3.8 3.8 3.8 3.8 3.8 3.8 3.8352<strong>2012</strong> <strong>Annual</strong> <strong>Planning</strong> <strong>Report</strong> © <strong>Transpower</strong> New Zealand Limited <strong>2012</strong>.All rights reserved.
Appendix C: Fault LevelsGrid exit pointPoint ofservice<strong>2012</strong> 2013 2014 2015 2016 2017 2018 2019 2020 2021 2022Tokaanu TKU2201 11.6 11.7 11.9 12.1 12.2 12.2 12.4 12.5 12.5 12.5 12.5Tokaanu TKU2202 11.6 11.7 11.9 12.1 12.2 12.2 12.4 12.5 12.5 12.5 12.5Waipawa WPW0111 4.2 4.2 4.2 4.2 4.2 4.2 4.2 4.2 4.2 4.2 4.2Waipawa WPW0331 4.8 4.8 4.8 4.8 4.8 4.8 4.8 4.8 4.8 4.8 4.8Wairakei WRK0331 21.3 21.6 21.7 22.0 22.1 22.1 22.2 22.2 22.2 22.2 22.2Wairakei WRK2201 19.8 22.4 23.4 27.2 28.2 28.3 30.7 31.0 31.1 31.1 31.1Woodville WDV0111 10.1 10.1 10.1 10.1 10.1 10.1 10.1 10.1 10.1 10.1 10.2Woodville WDV1101 7.5 7.6 7.6 7.7 7.7 7.7 7.8 7.9 7.9 7.9 8.0TARANAKIBrunswick BRK0331 8.9 9.0 9.0 9.0 9.0 9.0 9.1 9.1 9.1 9.1 9.1Brunswick BRK2201 10.1 10.4 10.4 10.9 11.0 11.0 11.4 11.4 11.4 11.4 11.5CarringtonStreet CST0331 12.7 13.4 13.4 13.6 13.6 13.6 13.7 13.7 14.2 14.0 14.0Hawera HWA0331 8.0 8.1 8.1 8.1 8.2 8.2 8.2 8.2 8.2 8.2 8.2Hawera HWA0332 4.7 4.7 4.7 4.7 4.7 4.7 4.7 4.7 4.8 4.8 4.8Hawera HWA1101 7.4 7.6 7.6 7.6 7.7 7.7 7.7 7.7 7.9 7.9 7.9Hawera HWA1102 7.4 7.6 7.6 7.6 7.7 7.7 7.7 7.7 7.9 7.9 7.9Huirangi HUI0331 6.0 6.2 6.2 6.2 6.2 6.2 6.3 6.3 6.4 6.3 6.3Huirangi HUI1101 7.8 9.3 9.3 9.6 9.7 9.7 9.9 9.9 10.6 10.2 10.2Kapuni KPA1101 5.4 5.5 5.5 5.6 5.6 5.6 5.7 5.7 5.7 5.7 5.7Motunui MNI1101 7.2 9.3 9.3 9.5 9.6 9.6 9.7 9.7 10.2 9.9 9.9New Plymouth NPL0331 10.1 10.4 10.4 10.6 10.6 10.6 10.7 10.7 11.0 10.9 10.9New Plymouth NPL1101 11.2 12.7 12.7 13.3 13.5 13.5 13.9 13.9 16.2 15.2 15.2New Plymouth NPL2201 8.5 9.2 9.2 10.0 10.2 10.2 10.9 10.9 11.0 10.9 10.9Opunake OPK0331 4.3 4.3 4.3 4.4 4.4 4.4 4.4 4.4 4.4 4.4 4.4Stratford SFD0331 7.4 7.4 7.4 7.5 7.5 7.5 7.5 7.5 7.5 7.5 7.5Stratford SFD1101 11.8 12.3 12.3 12.8 13.0 13.0 13.3 13.3 13.4 13.3 13.3Stratford SFD2201 12.7 13.5 13.5 15.6 16.1 16.1 17.8 17.8 17.8 17.8 17.8Taumarunui TMN2201 4.2 4.3 4.3 4.4 4.4 4.4 4.4 4.4 4.4 4.4 4.4Wanganui WGN0331 6.4 6.4 6.4 6.4 6.4 6.4 6.4 6.5 6.5 6.5 6.5Wanganui WGN1101 5.1 5.2 5.2 5.2 5.2 5.2 5.2 5.3 5.4 5.4 5.4Waverley WVY0111 2.7 2.7 2.7 2.7 2.7 2.7 2.8 2.8 2.8 2.8 2.8Waverley WVY1101 4.2 4.5 4.5 4.5 4.5 4.5 4.5 4.5 5.2 5.2 5.2HAWKE’S BAYFernhill FHL0331 9.1 9.2 9.2 9.2 9.2 9.3 9.3 9.3 9.3 9.3 9.3Fernhill FHL1101 6.6 6.7 6.7 6.7 6.8 6.8 6.8 6.9 6.9 6.9 6.9Gisborne GIS0501 3.5 3.6 3.6 3.6 3.6 3.6 3.6 3.6 3.6 3.6 3.6Gisborne GIS1101 2.2 2.2 2.2 2.2 2.2 2.2 2.2 2.2 2.2 2.2 2.2Redclyffe RDF0331 9.5 9.5 9.5 9.6 9.6 9.6 9.6 9.6 9.6 9.7 9.7Redclyffe RDF1101 7.4 7.5 7.6 7.6 7.7 7.7 7.7 7.8 7.8 7.9 7.9Redclyffe RDF2201 6.0 6.2 6.2 6.4 6.5 6.6 6.6 6.7 6.7 6.8 6.8Tuai TUI0111 1.1 1.1 1.1 1.1 1.1 1.1 1.1 1.1 1.1 1.1 1.1<strong>2012</strong> <strong>Annual</strong> <strong>Planning</strong> <strong>Report</strong> © <strong>Transpower</strong> New Zealand Limited <strong>2012</strong>.All rights reserved. 353
Appendix C: Fault LevelsGrid exit pointPoint ofservice<strong>2012</strong> 2013 2014 2015 2016 2017 2018 2019 2020 2021 2022Tuai TUI1101 5.8 5.8 5.8 5.8 5.9 5.9 5.9 5.9 5.9 5.9 5.9Wairoa WRA0111 9.1 9.1 9.1 9.1 9.1 9.2 9.2 9.2 9.2 9.2 9.2Whakatu WTU0331 12.2 12.3 12.4 12.5 12.5 12.6 12.6 12.7 12.7 12.7 12.7Whakatu WTU2201 5.2 5.3 5.3 5.5 5.5 5.6 5.6 5.7 5.7 5.8 5.8Whirinaki WHI0111 22.0 22.1 22.1 22.2 22.3 22.4 22.4 22.5 22.5 22.5 22.5Whirinaki WHI0112 21.9 22.0 22.0 22.1 22.2 22.3 22.3 22.4 22.4 22.4 22.4Whirinaki WHI0113 22.3 22.4 22.5 22.6 22.7 22.7 22.7 22.8 22.8 22.9 22.9Whirinaki WHI2201 5.9 6.1 6.1 6.3 6.4 6.6 6.6 6.7 6.7 6.8 6.8WELLINGTONCentral Park CPK0111 7.2 7.2 7.2 7.2 7.2 7.2 7.4 7.4 7.4 7.4 7.4Central Park CPK0331 18.3 18.6 18.6 18.7 18.7 18.7 22.4 22.4 22.6 22.6 22.8Gracefield GFD0331 13.2 13.3 13.3 13.4 13.4 13.4 16.3 16.3 16.4 16.4 16.4Greytown GYT0331 3.8 3.8 3.8 3.8 3.8 3.8 3.8 3.8 3.8 3.8 3.8Haywards HAY0111 12.6 12.6 12.6 12.6 12.6 12.6 12.7 12.7 12.7 12.7 12.7Haywards HAY0331 3.9 4.0 4.0 4.0 4.0 4.0 4.0 4.0 4.0 4.0 4.0Haywards HAY1101 17.3 18.4 18.4 18.8 18.8 18.8 20.2 20.4 20.5 20.5 20.5Haywards HAY2201 10.4 10.8 10.8 11.1 11.1 11.2 11.8 12.1 12.1 12.1 12.5Kaiwharawhara KWA0111 7.9 8.0 8.0 8.0 8.0 8.0 8.0 8.0 8.0 8.0 8.0Masterton MST0331 7.2 7.2 7.2 7.2 7.2 7.2 7.2 7.3 7.3 7.3 7.3Melling MLG0111 13.5 13.6 13.6 13.6 13.6 13.6 13.7 13.7 13.7 13.7 13.7Melling MLG0331 9.3 9.4 9.4 9.4 9.4 9.4 9.5 9.5 9.5 9.5 9.5Paraparaumu PRM0331 7.9 8.0 8.0 8.0 8.0 8.0 8.1 8.1 8.1 8.1 8.1Pauatahanui PNI0331 6.2 6.3 6.3 6.3 6.3 6.3 6.3 6.3 6.4 6.4 6.4Takapu Road TKR0331 14.3 14.5 14.5 14.6 14.6 14.6 14.9 14.9 15.0 15.0 15.0Takapu Road TKR1101 14.5 15.2 15.2 15.5 15.5 15.5 16.7 16.8 16.9 16.9 16.9Upper Hutt UHT0331 9.5 9.5 9.5 9.6 9.6 9.6 9.7 9.7 9.7 9.7 9.7West Wind WWD1101 8.3 8.4 8.4 8.5 8.5 8.5 9.1 9.2 9.2 9.2 9.3West Wind WWD1102 8.2 8.4 8.4 8.5 8.5 8.5 9.1 9.1 9.2 9.2 9.2Wilton WIL0331 13.1 13.2 13.2 14.3 14.3 14.3 14.4 14.5 14.5 14.5 14.6Wilton WIL1101 12.4 12.8 12.8 13.0 13.0 13.0 14.3 14.4 14.4 14.4 14.6Wilton WIL2201 7.7 8.0 8.0 8.2 8.2 8.2 8.7 8.8 8.9 8.9 9.0NELSON-MARLBOROUGHArgyle ARG1101 2.6 2.6 2.6 2.9 2.9 3.3 3.3 3.3 3.3 3.3 3.3Blenheim BLN0331 6.6 6.6 6.6 7.0 7.1 12.2 12.2 12.2 12.2 12.2 12.2Blenheim BLN1101 2.6 2.6 2.6 2.8 2.8 4.1 4.1 4.1 4.1 4.1 4.1Cobb COB0661 2.9 2.9 2.9 3.0 3.0 3.0 3.0 3.0 3.0 3.0 3.0Motueka MOT0111 7.7 7.7 7.7 7.8 7.8 7.9 7.9 7.9 7.9 7.9 7.9Motupipi MPI0661 1.6 1.6 1.6 1.7 1.7 1.7 1.7 1.7 1.7 1.7 1.7Stoke STK0331 11.1 11.1 11.1 11.9 12.0 12.9 12.9 12.9 12.9 12.9 12.9Stoke STK1101 3.9 3.9 3.9 4.4 4.4 5.3 5.3 5.3 5.3 5.3 5.3Stoke STK2201 2.6 2.6 2.6 2.9 3.0 3.4 3.4 3.4 3.4 3.4 3.4Upper Takaka UTK0661 2.6 2.6 2.6 2.6 2.7 2.7 2.7 2.7 2.7 2.7 2.7354<strong>2012</strong> <strong>Annual</strong> <strong>Planning</strong> <strong>Report</strong> © <strong>Transpower</strong> New Zealand Limited <strong>2012</strong>.All rights reserved.
Appendix C: Fault LevelsGrid exit pointPoint ofservice<strong>2012</strong> 2013 2014 2015 2016 2017 2018 2019 2020 2021 2022WEST COASTArthurs Pass APS0111 2.2 2.2 2.2 2.3 2.3 2.3 2.3 2.3 2.3 2.3 2.3Atarau ATU1101 1.5 1.5 1.5 1.9 2.0 2.1 2.1 2.1 2.1 2.1 2.1Castle Hill CLH0111 2.8 2.8 2.8 2.8 2.8 2.8 2.8 2.8 2.8 2.8 2.8Dobson DOB0331 3.0 3.0 3.0 3.7 3.7 3.9 3.9 3.9 3.9 3.9 3.9Greymouth GYM0661 2.5 2.5 2.5 3.5 3.5 3.6 3.6 3.6 3.6 3.6 3.6Hokitika HKK0661 1.7 1.7 1.7 1.8 1.8 1.8 1.8 1.8 1.8 3.4 3.4Inangahua IGH1101 2.2 2.2 2.2 3.7 4.2 4.3 4.3 4.3 4.3 4.3 4.3Kikiwa KIK0111 2.9 2.9 2.9 2.9 2.9 3.0 3.0 3.0 3.0 3.0 3.0Kikiwa KIK2201 3.1 3.1 3.1 3.5 3.6 4.0 4.0 4.0 4.0 4.0 4.0Kumara KUM0661 2.3 2.3 2.3 2.8 2.8 2.9 2.9 2.9 2.9 3.5 3.5Murchison MCH0111 2.6 2.6 2.6 2.7 2.7 2.7 2.7 2.7 2.7 2.7 2.7Otira OTI0111 1.6 1.6 1.6 1.6 1.6 1.6 1.6 1.6 1.6 1.7 1.7Reefton RFN1101 1.8 1.8 1.8 2.7 2.8 2.9 2.9 2.9 2.9 2.9 2.9Orowaiti ORO1101 1.5 1.5 1.5 2.5 3.1 3.1 3.1 3.1 3.1 3.1 3.1Orowaiti ORO1102 1.5 1.5 1.5 2.5 2.7 2.7 2.7 2.7 2.7 2.7 2.7Orowaiti ROB0331 3.5 3.5 3.5 4.7 5.1 5.1 5.1 5.1 5.1 5.1 5.1Westport WPT0111 8.6 8.6 8.6 11.1 11.9 11.9 11.9 11.9 11.9 11.9 11.9CANTERBURYAddington ADD0111 15.9 15.9 15.9 16.0 16.0 16.1 16.4 16.4 16.4 16.4 16.4Addington ADD0112 15.4 15.4 15.4 15.5 15.5 15.6 15.8 15.8 15.8 15.8 15.8Addington ADD0661 11.0 11.0 11.0 11.5 11.5 11.8 12.6 12.6 12.6 12.6 12.6Ashburton ASB0331 9.7 9.7 9.7 9.8 9.8 9.9 9.9 9.9 9.9 9.9 9.9Ashburton ASB0661 7.7 7.7 7.7 7.9 7.9 7.9 8.0 8.0 8.0 8.0 8.0Ashburton ASB2201 7.1 7.1 7.1 7.5 7.6 7.8 8.0 7.9 8.0 8.0 8.0Ashley ASY0111 8.6 8.6 8.6 8.7 8.7 8.7 8.7 8.7 8.7 8.7 8.7Ashley ASY0661 5.0 5.0 5.0 5.2 5.2 5.2 5.3 5.3 5.3 5.3 5.3Bromley BRY0111 14.6 15.1 15.1 15.6 15.6 15.6 15.7 15.7 15.7 15.7 15.7Bromley BRY0661 10.5 12.2 12.2 14.1 14.2 14.5 14.8 14.6 14.7 14.7 14.7Bromley BRY2201 5.6 5.6 5.6 6.2 6.2 6.4 6.6 6.6 6.6 6.6 6.6Coleridge COL0111 1.6 1.6 1.6 1.6 1.6 1.6 1.6 1.6 1.6 1.6 1.6Coleridge COL0661 4.2 4.2 4.2 4.3 4.3 4.3 4.3 4.3 4.3 4.4 4.4Culverden CUL0331 7.1 7.1 7.1 7.2 7.2 7.3 7.3 7.4 7.4 7.4 7.4Culverden CUL0661 1.6 1.6 1.6 1.6 1.6 1.6 1.6 1.6 1.6 1.6 1.6Hororata HOR0331 2.8 2.8 2.8 2.8 2.8 2.8 2.8 2.8 2.8 2.8 2.8Hororata HOR0661 4.5 4.5 4.5 4.5 4.5 4.6 4.6 4.6 4.6 4.6 4.6Islington ISL0331 14.5 14.5 14.5 14.9 15.0 15.2 15.4 15.4 15.4 15.4 15.4Islington ISL0661 15.0 15.0 15.0 15.9 16.0 16.5 18.1 18.1 18.1 18.1 18.1Islington ISL2201 6.6 6.6 6.6 7.2 7.2 7.6 8.0 7.9 8.0 8.0 8.0Kaiapoi KAI0111 12.9 12.9 12.9 13.0 13.1 13.1 13.2 13.2 13.2 13.2 13.2Middleton Tee MLN0661 11.3 11.3 11.3 11.8 11.9 12.2 13.0 13.0 13.0 13.0 13.0<strong>2012</strong> <strong>Annual</strong> <strong>Planning</strong> <strong>Report</strong> © <strong>Transpower</strong> New Zealand Limited <strong>2012</strong>.All rights reserved. 355
Appendix C: Fault LevelsGrid exit pointPoint ofservice<strong>2012</strong> 2013 2014 2015 2016 2017 2018 2019 2020 2021 2022Middleton Tee MLN0662 11.3 11.3 11.3 11.8 11.9 12.2 13.0 13.0 13.0 13.0 13.0Southbrook SBK0331 6.0 6.0 6.0 6.1 6.1 6.1 6.2 6.2 6.2 6.2 6.2Springston SPN0331 6.9 6.9 6.9 7.0 7.0 7.0 7.2 7.2 7.2 7.2 7.2Springston SPN0661 7.7 7.7 7.7 7.9 7.9 8.0 8.4 8.4 8.4 8.4 8.4Waipara WPR0331 1.8 1.8 1.8 1.8 1.8 1.8 1.8 1.8 1.8 1.8 1.8Waipara WPR0661 8.1 8.1 8.1 8.8 8.8 9.0 9.1 9.2 9.2 9.2 9.2SOUTH CANTERBURYAlbury ABY0111 4.4 4.4 4.4 4.4 4.4 4.4 4.4 4.4 4.4 4.4 4.4Aviemore AVI2201 15.6 15.6 15.8 17.1 17.4 17.5 19.3 19.3 19.4 19.4 19.5Bells Pond BPD1101 2.8 2.8 2.8 2.8 2.8 2.8 2.9 2.9 2.9 2.9 2.9Benmore BEN0161 97.7 97.8 97.8 98.1 98.2 98.3 99.0 99.0 99.1 99.2 99.2Benmore BEN2201 19.4 19.5 19.5 20.0 20.3 20.4 21.8 21.8 22.1 22.1 22.2Black Point BPT1101 3.5 3.5 3.5 3.5 3.5 3.5 3.7 3.7 3.7 3.7 3.7Livingstone LIV2201 7.9 7.9 9.0 9.4 9.8 9.9 11.8 11.9 11.9 11.9 12.0Oamaru OAM0331 5.4 5.4 5.4 5.4 5.4 5.4 5.6 5.6 5.6 5.6 5.6Ohau A OHA2201 17.6 17.6 17.6 18.0 18.2 18.3 18.7 18.8 19.0 19.1 19.2Ohau B OHB2201 19.1 19.1 19.1 19.5 19.8 20.0 20.5 20.5 20.9 20.9 21.0Ohau C OHC2201 17.1 17.1 17.1 17.4 17.6 17.7 18.2 18.2 18.5 18.5 18.6Opihi OPI2201 7.1 7.2 7.2 7.3 7.4 7.5 7.5 7.5 7.6 7.6 7.6Opihi OPI2202 7.1 7.2 7.2 7.3 7.4 7.5 7.5 7.5 7.6 7.6 7.6Studholme STU0111 7.4 7.4 7.4 7.4 7.4 7.4 7.5 7.5 7.5 7.5 7.5Tekapo A TKA0111 14.5 14.5 14.5 14.5 14.5 14.5 14.5 14.5 14.5 14.5 14.5Tekapo A TKA0331 1.3 1.3 1.3 1.3 1.3 1.3 1.3 1.3 1.3 1.3 1.3Tekapo B TKB2201 11.8 11.8 11.8 12.0 12.4 12.5 12.6 12.6 12.8 12.8 12.9Temuka TMK0331 6.5 6.5 6.5 6.5 6.5 6.5 6.5 6.5 6.6 6.6 6.6Timaru TIM0111 20.3 20.3 20.3 20.3 20.4 20.4 20.4 20.4 20.4 20.4 20.4Twizel TWZ0331 9.0 9.0 9.0 9.0 9.0 9.0 9.0 9.0 9.1 9.1 9.1Twizel TWZ2201 20.5 20.5 20.6 21.0 21.4 21.6 22.2 22.2 22.7 22.7 22.8Waitaki WTK0331 0.6 0.6 0.6 0.6 0.6 0.6 0.6 0.6 0.6 0.6 0.6Waitaki WTK2201 12.4 12.5 13.3 14.2 14.5 14.6 16.7 16.7 16.8 16.8 16.9OTAGO-SOUTHLANDBalclutha BAL0331 3.8 3.8 3.8 3.6 3.6 3.6 3.6 3.6 3.6 3.6 3.6Berwick BWK1101 4.9 4.8 4.8 4.8 4.8 4.9 4.9 4.9 4.9 4.9 4.9Brydone BDE0111 12.7 12.3 12.3 13.7 13.7 13.7 13.7 13.7 13.8 13.8 13.8Clyde CYD0331 10.4 10.4 10.4 10.4 10.5 10.5 10.5 10.5 10.6 10.6 10.6Clyde CYD2201 14.8 14.9 14.9 15.2 16.0 16.3 16.5 16.7 17.8 17.8 17.8Cromwell CML0331 10.4 10.4 10.4 11.6 11.7 11.7 11.7 11.7 11.8 11.8 11.8Edendale EDN0331 6.1 5.7 5.7 6.6 6.6 6.6 6.6 6.6 6.6 6.6 6.7Edendale EDN1101 3.8 3.3 3.3 4.4 4.4 4.5 4.5 4.5 4.5 4.5 4.6Frankton FKN0331 7.6 7.6 7.6 7.7 7.8 7.8 7.8 7.8 7.8 7.8 7.8Gore GOR0331 6.2 6.0 6.0 7.5 7.5 7.6 7.6 7.6 7.6 7.6 7.7Gore GOR1101 3.8 3.6 3.6 6.2 6.3 6.3 6.3 6.3 6.4 6.4 6.6356<strong>2012</strong> <strong>Annual</strong> <strong>Planning</strong> <strong>Report</strong> © <strong>Transpower</strong> New Zealand Limited <strong>2012</strong>.All rights reserved.
Appendix C: Fault LevelsGrid exit pointPoint ofservice<strong>2012</strong> 2013 2014 2015 2016 2017 2018 2019 2020 2021 2022Halfway Bush HWB0331 16.0 16.0 16.0 16.9 16.9 17.0 17.0 17.1 17.2 17.2 17.4Halfway Bush HWB0332 13.9 13.9 13.9 14.2 14.2 14.3 14.3 14.4 14.5 14.5 14.6Halfway Bush HWB1101 9.1 9.2 9.2 10.2 10.3 10.4 10.4 10.5 10.7 10.7 10.8Halfway Bush HWB2201 7.8 7.8 7.8 8.6 8.7 8.9 9.0 9.2 9.5 9.5 9.9Invercargill INV0331 17.4 17.4 17.4 17.5 17.6 17.6 17.8 17.8 17.8 17.8 17.9Invercargill INV1101 5.7 4.1 4.1 5.6 5.7 5.7 5.7 5.7 5.7 5.7 5.8Invercargill INV2201 9.6 9.6 9.6 9.7 9.9 10.0 10.3 10.3 10.3 10.3 10.6Manapouri MAN2201 11.5 11.5 11.5 11.7 11.7 11.8 12.0 12.0 12.0 12.0 12.2Naseby NSY0331 7.7 7.8 7.8 7.9 8.0 8.0 8.1 8.1 8.1 8.1 8.1Naseby NSY2201 5.9 5.9 6.2 6.9 7.6 7.7 8.3 8.3 8.4 8.4 8.4NorthMakarewa NMA0331 10.5 10.5 10.5 10.5 10.5 10.6 10.6 10.6 10.6 10.6 10.7NorthMakarewa NMA2201 9.7 9.7 9.7 10.0 10.1 10.2 10.6 10.6 10.7 10.7 11.0Palmerston PAL0331 1.7 1.7 1.7 1.7 1.7 1.7 1.7 1.7 1.7 1.7 1.7Roxburgh ROX1101 8.9 10.4 10.4 10.2 10.3 10.3 10.4 10.4 10.5 10.5 10.5Roxburgh ROX2201 15.0 15.2 15.2 15.6 16.5 16.9 17.2 17.5 19.6 19.6 19.7South Dunedin SDN0331 17.2 17.2 17.2 17.7 17.8 17.9 18.0 18.1 18.3 18.3 18.5South Dunedin SDN2201 7.3 7.3 7.3 7.9 8.1 8.3 8.3 8.5 8.8 8.8 9.1Three Mile Hill TMH2201 8.2 8.2 8.2 9.0 9.2 9.5 9.5 9.8 10.1 10.1 10.6Tiwai TWI2201 8.6 8.6 8.6 8.8 8.9 9.0 9.3 9.3 9.3 9.3 9.5<strong>2012</strong> <strong>Annual</strong> <strong>Planning</strong> <strong>Report</strong> © <strong>Transpower</strong> New Zealand Limited <strong>2012</strong>.All rights reserved. 357
Appendix C: Fault LevelsTable C.3: Ten year forecast of single-phase maximum fault levels,of service(kA) of each pointGrid exit pointNORTHLANDPoint ofservice2011 <strong>2012</strong> 2013 2014 2015 2016 2017 2018 2019 2020 2021Albany ALB1101 13.5 13.5 15.3 15.4 15.5 15.9 16.0 16.0 16.4 16.4 16.5Albany ALB2201 11.2 11.3 15.8 16.0 16.2 17.3 17.4 17.4 18.5 18.5 18.5Bream Bay BRB2201 4.9 4.9 5.2 5.2 5.3 7.7 7.8 7.8 7.9 7.9 8.3Henderson HEN1101 24.0 24.0 26.3 26.7 26.9 28.3 28.5 28.4 29.9 30.1 30.5Henderson HEN2201 14.8 14.8 16.8 17.1 17.3 18.4 18.5 18.5 19.8 19.8 19.8Hepburn Road HEP1101 17.9 18.0 19.0 19.4 19.5 20.2 20.2 20.1 20.8 21.1 21.6Huapai HPI2201 11.3 11.3 13.2 13.4 13.5 14.6 14.7 14.7 15.5 15.5 15.6Marsden MDN1101 8.7 8.7 9.1 9.1 9.1 11.2 11.3 11.3 11.4 11.4 12.1Marsden MDN2201 5.0 5.0 5.2 5.3 5.3 7.6 7.6 7.6 7.7 7.7 8.7Maungatapere MPE1101 4.6 4.6 4.7 4.7 4.7 5.1 5.1 5.1 5.6 6.2 6.2Maungaturoto MTO1101 4.6 4.6 4.7 4.7 4.7 5.1 5.1 5.1 5.5 6.1 6.1Maungaturoto MTO1102 4.6 4.6 4.7 4.7 4.7 5.1 5.1 5.1 5.5 6.1 6.1AUCKLANDBombay BOB1102 5.8 5.8 5.8 5.9 5.9 5.9 5.9 5.9 5.9 5.9 5.9Drury DRY2201 13.6 13.7 14.2 14.4 14.5 14.7 14.7 15.3 15.6 16.3 17.2Glenbrook GLN2201 10.5 10.5 10.8 10.9 11.0 11.1 11.1 11.3 11.5 11.8 15.2Mangere MNG1101 16.6 16.6 17.2 17.4 17.5 18.6 18.6 18.8 19.3 19.5 19.8Otahuhu OTA1101 22.0 22.0 23.2 23.4 23.6 24.8 24.8 25.1 26.0 26.3 26.7Otahuhu OTA1102 28.5 27.4 29.2 29.7 30.0 30.4 30.7 30.9 32.5 32.5 32.5Otahuhu OTA2201 24.6 25.0 27.8 28.6 29.2 30.0 30.5 31.3 35.2 35.2 35.2Otahuhu B OTC2201 24.6 25.0 27.8 28.6 29.2 30.0 30.5 31.3 35.2 35.2 35.2Penrose PEN1101 25.3 25.0 28.9 29.3 29.6 30.2 30.4 30.6 32.2 32.2 32.2Penrose PEN2201 17.6 20.8 23.7 24.3 24.9 25.6 25.9 26.3 28.9 28.9 28.9Mt Roskill ROS1101 15.5 15.5 16.2 16.4 16.5 16.9 16.9 17.1 17.6 17.9 18.9Southdown SWN2201 17.9 18.1 19.3 19.7 20.0 20.5 20.8 21.9 22.6 22.8 23.3WAIKATOArapuni ARI1101 12.6 12.6 12.5 12.5 12.7 12.7 12.7 13.0 13.0 13.1 13.1Atiamuri ATI2201 16.9 17.3 17.3 17.4 17.5 17.6 21.6 21.7 21.7 21.7 21.7Hamilton HAM1101 13.1 13.2 13.2 13.2 13.3 13.3 13.3 13.4 13.4 13.4 13.4Hamilton HAM2201 10.5 10.5 10.6 10.7 10.7 10.8 10.7 10.8 10.8 10.9 10.9Huntly HLY2201 32.1 32.3 32.9 34.8 35.1 35.5 35.2 37.0 35.0 36.5 35.0Hangatiki HTI1101 2.7 2.7 2.7 2.7 3.0 3.0 3.0 3.1 3.1 3.3 3.3Karapiro KPO1101 8.3 8.3 8.3 8.3 8.4 8.4 8.4 8.4 8.4 8.4 8.4Maraetai MTI2201 21.0 21.3 22.2 23.6 23.8 23.9 25.1 25.2 25.4 25.4 25.3Ohakuri OHK2201 16.5 17.0 17.1 17.2 17.3 17.4 20.4 20.5 20.5 20.5 20.5Te Awamutu TMU1101 2.8 2.8 2.8 2.8 2.8 2.8 2.8 2.8 2.8 2.8 2.8Te Kowhai TWH2201 8.8 8.8 8.8 8.9 8.9 9.0 9.0 9.0 9.0 9.0 9.0Whakamaru WKM2201 24.5 25.1 26.7 30.4 30.9 31.1 33.6 33.9 34.1 34.2 34.0Waipapa WPA2201 11.8 11.9 12.1 12.5 12.6 12.6 12.9 13.0 13.0 13.0 13.0358<strong>2012</strong> <strong>Annual</strong> <strong>Planning</strong> <strong>Report</strong> © <strong>Transpower</strong> New Zealand Limited <strong>2012</strong>.All rights reserved.
Appendix C: Fault LevelsGrid exit pointPoint ofservice2011 <strong>2012</strong> 2013 2014 2015 2016 2017 2018 2019 2020 2021BAY OF PLENTYEdgecumbe EDG1101 7.0 7.2 7.2 7.2 7.8 7.8 8.1 8.1 8.2 8.2 8.2Edgecumbe EDG2201 7.6 7.8 7.7 7.7 7.9 7.9 9.8 9.8 9.8 9.8 9.8Kawerau KAW1101 12.0 12.6 12.6 12.6 14.9 14.9 15.8 15.8 16.5 16.5 16.5Kawerau KAW2201 7.7 7.8 7.8 7.8 8.1 8.1 9.5 9.5 9.6 9.6 9.6Kinleith KIN1101 8.5 8.5 8.2 8.2 8.3 8.3 8.5 8.6 8.6 8.6 8.6Kaitimako KMO1101 10.6 10.7 10.5 10.5 10.6 10.6 25.3 25.3 25.3 25.4 25.4Lichfield Tee LFD1101 5.8 5.8 5.5 5.5 5.6 5.6 5.8 5.8 5.8 5.8 5.8Matahina MAT1101 9.4 9.7 9.7 9.7 10.7 10.7 11.1 11.1 11.4 11.4 11.4Mt Maunganui MTM1101 7.0 7.0 6.9 6.9 7.0 7.0 11.2 11.2 11.2 11.2 11.2Owhata OWH1101 4.0 4.0 3.9 3.9 3.9 3.9 4.2 4.2 4.2 4.2 4.2Rotorua ROT1101 6.5 6.5 5.5 5.5 7.7 7.7 8.2 8.3 8.3 8.3 8.3Rotorua ROT1102 6.1 6.1 5.1 5.1 5.7 5.7 6.2 6.2 6.2 6.2 6.2Te Matai TMI1101 5.1 5.1 5.1 5.1 5.1 5.1 6.4 6.4 6.4 6.4 6.4Tarukenga TRK1101 21.1 21.4 12.4 12.4 13.9 13.9 17.1 17.4 17.4 17.4 17.4Tarukenga TRK2201 11.6 11.8 9.2 9.3 9.5 9.5 17.4 17.5 17.5 17.5 17.5CENTRAL NORTH ISLANDAratiatia ARA2201 16.3 17.7 18.1 20.2 20.4 20.4 21.4 21.5 21.6 21.6 21.6Bunnythorpe BPE1101 13.0 12.3 12.3 12.5 12.5 12.5 12.7 13.0 13.3 13.3 13.3Bunnythorpe BPE2201 12.3 12.3 12.4 12.8 12.8 12.8 13.3 14.1 14.1 14.1 14.5Linton LTN2201 7.4 7.4 7.4 7.6 7.6 7.6 7.9 8.3 8.3 8.3 8.4Linton LTN2202 6.3 6.3 6.3 6.9 6.9 6.9 7.5 8.7 8.7 8.7 9.2Mangamaire MGM1101 2.8 2.8 2.8 2.8 2.8 2.8 2.8 2.8 2.8 2.8 2.8Nga Awa Purua NAP2201 16.2 17.4 18.3 20.1 20.3 20.3 21.5 21.6 21.6 21.7 21.6Ohaaki OKI2201 11.3 11.8 12.1 12.8 13.4 13.7 14.2 14.3 14.3 14.3 14.3Poihipi PPI2201 13.0 15.1 15.4 21.7 22.0 22.0 23.2 23.3 23.3 23.3 23.3Rangipo RPO2201 6.6 6.6 6.9 7.0 7.0 7.1 7.1 7.1 7.1 7.1 7.1Tokaanu TKU2201 11.1 11.2 11.3 11.4 11.4 11.4 11.6 11.6 11.6 11.7 11.6Tokaanu TKU2202 11.1 11.2 11.3 11.4 11.4 11.4 11.6 11.6 11.6 11.7 11.6Tangiwai TNG2201 3.6 3.6 3.7 3.7 3.7 3.7 3.7 3.7 3.7 3.7 3.7Tararua WindCentralTWC2201 7.8 7.8 7.8 8.3 8.3 8.3 8.8 9.6 9.6 9.6 10.0Woodville WDV1101 4.6 4.6 4.6 4.6 4.6 4.6 4.6 4.7 4.7 4.7 4.7Wairakei WRK2201 21.5 24.1 25.0 29.3 29.8 29.8 32.2 32.4 32.5 32.5 32.5TARANAKIBrunswick BRK2201 6.9 7.0 7.0 7.2 7.2 7.2 7.3 7.3 7.3 7.3 7.4Huirangi HUI1101 7.0 8.2 8.2 8.3 8.3 8.3 8.4 8.4 8.8 8.6 8.6Hawera HWA1101 7.5 6.7 6.7 6.8 6.8 6.8 6.8 6.8 6.8 6.8 6.8Hawera HWA1102 7.5 6.7 6.7 6.8 6.8 6.8 6.8 6.8 6.8 6.8 6.8Kapuni KPA1101 3.8 3.8 3.8 3.9 3.9 3.9 3.9 3.9 3.9 3.9 3.9Marton MTN1101 3.3 3.3 3.3 3.3 3.3 3.3 3.3 3.3 3.4 3.4 3.4<strong>2012</strong> <strong>Annual</strong> <strong>Planning</strong> <strong>Report</strong> © <strong>Transpower</strong> New Zealand Limited <strong>2012</strong>.All rights reserved. 359
Appendix C: Fault LevelsGrid exit pointPoint ofservice2011 <strong>2012</strong> 2013 2014 2015 2016 2017 2018 2019 2020 2021Marton MTN1102 3.3 3.3 3.3 3.3 3.3 3.3 3.3 3.3 3.4 3.4 3.4Motunui MNI1101 7.2 9.3 9.3 9.4 9.5 9.5 9.6 9.6 9.9 9.7 9.7New Plymouth NPL1101 12.8 14.0 14.0 14.5 14.7 14.7 15.0 15.0 17.5 16.7 16.7New Plymouth NPL2201 7.9 8.3 8.3 8.8 8.9 8.9 9.2 9.2 9.5 9.2 9.2Stratford SFD1101 12.9 13.3 13.3 13.8 13.9 13.9 14.2 14.2 14.2 14.2 14.2Stratford SFD2201 14.9 15.6 15.6 17.8 18.4 18.3 20.1 20.1 20.1 20.1 20.1Taumarunui TMN2201 2.8 2.8 2.8 2.8 2.8 2.8 2.8 2.8 2.9 2.9 2.9Wanganui WGN1101 3.1 2.2 2.2 2.2 2.2 2.2 2.2 2.2 2.8 2.8 2.8Waverley WVY1101 2.9 1.1 1.1 1.1 1.1 1.1 1.1 1.1 1.9 1.9 1.9HAWKE’S BAYFernhill FHL1101 5.1 5.2 5.2 5.2 5.2 5.3 5.3 5.3 5.3 5.3 5.3Gisborne GIS1101 1.4 1.4 1.4 1.4 1.4 1.4 1.4 1.4 1.4 1.4 1.4Redclyffe RDF1101 6.1 6.1 6.2 6.2 6.3 6.3 6.3 6.3 6.3 6.4 6.4Redclyffe RDF2201 4.4 4.5 4.5 4.6 4.7 4.7 4.7 4.8 4.8 4.8 4.8Tuai TUI1101 7.0 7.0 7.0 7.0 7.0 7.0 7.0 7.1 7.1 7.1 7.1Whirinaki WHI2201 5.3 5.4 5.4 5.5 5.7 5.8 5.8 5.9 5.9 6.0 6.0Whakatu WTU2201 3.7 3.8 3.8 3.8 3.9 3.9 3.9 4.0 4.0 4.0 4.0WELLINGTONHaywards HAY1101 19.6 20.4 20.5 20.8 20.9 20.9 22.2 22.4 22.5 22.5 22.5Haywards HAY2201 12.4 12.7 12.9 13.2 13.2 13.3 13.9 14.2 14.3 14.3 14.7Takapu Road TKR1101 11.7 11.9 12.0 12.1 12.1 12.1 12.6 12.7 12.7 12.7 12.8Wilton WIL1101 10.5 10.6 10.6 10.8 10.8 10.8 11.3 11.4 11.4 11.4 11.5Wilton WIL2201 7.3 7.4 7.4 7.6 7.6 7.6 7.9 8.0 8.0 8.0 8.1West Wind WWD1101 6.0 6.0 6.1 6.1 6.1 6.1 6.3 6.3 6.3 6.3 6.3West Wind WWD1102 6.0 6.0 6.0 6.1 6.1 6.1 6.3 6.3 6.3 6.3 6.3NELSON-MARLBOROUGHArgyle ARG1101 2.6 2.6 2.6 2.7 2.7 3.0 3.0 3.0 3.0 3.0 3.0Blenheim BLN1101 2.3 2.3 2.3 2.4 2.4 2.9 2.9 2.9 2.9 2.9 2.9Stoke STK1101 4.6 4.6 4.6 5.0 5.0 5.8 5.8 5.8 5.8 5.8 5.8Stoke STK2201 2.7 2.7 2.7 2.9 2.9 3.2 3.2 3.2 3.2 3.2 3.2WEST COASTAtarau ATU1101 1.5 1.5 1.5 1.8 1.8 1.9 1.9 1.9 1.9 1.9 1.9Inangahua IGH1101 2.1 2.1 2.1 3.5 3.8 3.9 3.9 3.9 3.9 3.9 3.9Kikiwa KIK2201 3.5 3.5 3.5 3.8 3.9 4.2 4.2 4.2 4.2 4.2 4.2Orowaiti ORO1101 1.2 1.2 1.2 1.9 2.6 2.6 2.6 2.6 2.6 2.6 2.6Orowaiti ORO1102 1.2 1.2 1.2 2.0 2.1 2.1 2.1 2.1 2.1 2.1 2.1Reefton RFN1101 1.6 1.6 1.6 2.2 2.3 2.3 2.3 2.3 2.3 2.3 2.3CANTERBURYAshburton ASB2201 7.5 7.5 7.5 7.8 7.9 8.0 8.1 8.1 8.1 8.1 8.2360<strong>2012</strong> <strong>Annual</strong> <strong>Planning</strong> <strong>Report</strong> © <strong>Transpower</strong> New Zealand Limited <strong>2012</strong>.All rights reserved.
Appendix C: Fault LevelsGrid exit pointPoint ofservice2011 <strong>2012</strong> 2013 2014 2015 2016 2017 2018 2019 2020 2021Bromley BRY2201 6.5 6.7 6.7 7.3 7.3 7.5 7.7 7.0 7.0 7.0 7.0Islington ISL2201 8.2 8.2 8.2 8.8 8.9 9.2 9.6 9.5 9.5 9.5 9.6SOUTH CANTERBURYAviemore AVI2201 17.0 17.0 17.1 17.9 18.1 18.2 19.4 19.4 19.5 19.5 19.5Benmore BEN2201 22.8 22.8 22.9 23.1 23.3 23.4 24.4 24.5 24.6 24.6 24.7Bells Pond BPD1101 1.7 1.7 1.7 1.7 1.7 1.7 1.7 1.7 1.7 1.7 1.7Black Point BPT1101 2.3 2.3 2.3 2.3 2.3 2.3 2.4 2.4 2.4 2.4 2.4Livingstone LIV2201 6.1 6.1 6.4 6.6 6.7 6.7 8.8 8.8 8.8 8.8 8.9Ohau A OHA2201 18.3 18.3 18.3 18.5 18.7 18.8 19.0 19.0 19.2 19.2 19.3Ohau B OHB2201 21.1 21.1 21.2 21.4 21.7 21.8 22.1 22.2 22.4 22.4 22.5Ohau C OHC2201 18.5 18.5 18.5 18.7 18.9 19.0 19.3 19.3 19.4 19.4 19.5Opihi OPI2201 5.9 5.9 5.9 6.0 6.0 6.0 6.1 6.1 6.1 6.1 6.1Opihi OPI2202 5.9 5.9 5.9 6.0 6.0 6.0 6.1 6.1 6.1 6.1 6.1Tekapo B TKB2201 11.8 11.8 11.8 11.9 12.3 12.3 12.4 12.4 12.5 12.5 12.5Twizel TWZ2201 22.7 22.7 22.7 23.0 23.3 23.5 23.8 23.9 24.2 24.2 24.3Waitaki WTK2201 13.4 13.4 14.0 14.6 14.8 14.8 16.5 16.5 16.6 16.6 16.7OTAGO-SOUTHLANDBerwick BWK1101 2.8 2.8 2.8 2.7 2.7 2.7 2.7 2.7 2.7 2.7 2.7Clyde CYD2201 16.4 16.4 16.4 16.6 17.2 17.5 17.6 17.8 18.7 18.7 18.7Edendale EDN1101 2.8 2.6 2.6 3.5 3.5 3.5 3.5 3.5 3.5 3.5 3.6Gore GOR1101 2.6 2.6 2.6 6.0 6.0 6.0 6.0 6.0 6.1 6.1 6.2Halfway Bush HWB1101 9.5 9.5 9.6 10.6 10.7 10.8 10.8 10.9 11.0 11.0 11.1Halfway Bush HWB2201 7.6 7.6 7.6 8.5 8.6 8.8 8.8 9.0 9.2 9.2 9.5Invercargill INV1101 5.8 4.6 4.6 5.5 5.5 5.5 5.6 5.6 5.6 5.6 5.6Invercargill INV2201 9.9 9.5 9.5 9.8 9.8 9.9 10.2 10.2 10.3 10.3 10.4Manapouri MAN2201 14.1 14.1 14.1 14.2 14.3 14.3 14.6 14.6 14.6 14.6 14.7NorthMakarewaNMA2201 9.5 9.3 9.3 9.7 9.8 9.9 10.4 10.4 10.4 10.4 10.6Naseby NSY2201 4.1 4.1 4.2 4.4 4.6 4.6 5.0 5.0 5.0 5.0 5.0Roxburgh ROX1101 10.1 11.2 11.2 11.0 11.1 11.1 11.1 11.2 11.3 11.3 11.3Roxburgh ROX2201 15.1 15.4 15.4 15.7 16.3 16.6 16.8 17.1 19.2 19.2 19.2South Dunedin SDN2201 6.8 6.8 6.8 7.5 7.5 7.7 7.7 7.9 8.0 8.0 8.3Three Mile Hill TMH2201 7.7 7.7 7.7 8.7 8.8 9.1 9.1 9.3 9.6 9.6 9.9Tiwai TWI2201 7.3 7.1 7.1 7.3 7.3 7.4 7.6 7.6 7.6 7.6 7.7<strong>2012</strong> <strong>Annual</strong> <strong>Planning</strong> <strong>Report</strong> © <strong>Transpower</strong> New Zealand Limited <strong>2012</strong>.All rights reserved. 361
Appendix D: Project CalendarAppendix DProject CalendarTable D.1: Forecast submission dates for projects to the Commerce Commission for the next 2 June years (by quarter)Year Quarter 1 Quarter 2 Quarter 3 Quarter 42011/12<strong>2012</strong>/13 Timaru substation development plan Upper South Island grid upgrade – Stage 1Table D.2: Forecast submission dates for projects to the Commerce Commission post-2013/14YearProject2013/14 Upper South Island grid upgrade – Stage 2Upper North Island reactive support – post-NIGUPLower North Island transmission capacity2014/15 HVDC Stage 3Valley spur security and reactive support2015/16To be advised 174Lower Waitaki Valley transmission developmentBunnythorpe interconnecting transformer replacementTaranaki interconnecting transformer capacity and voltage qualityWellington 110 kV supply securityKaitimako interconnecting transformer capacityInangahua–Murchison–Kikiwa transmission capacity174 Project submission date is pending on the outcome of investigations.362<strong>2012</strong> <strong>Annual</strong> <strong>Planning</strong> <strong>Report</strong> © <strong>Transpower</strong> New Zealand Limited <strong>2012</strong>. All rights reserved.
Appendix D: Project CalendarTable D-3: Base Capex 175 with minor enhancementProjectsForecastcommissioning yearResolve the protection limits on the Wellsford supply transformers. <strong>2012</strong>/13Resolve the protection limits on the Mangere supply transformers. <strong>2012</strong>/13Resolve the protection limits on the Takanini supply transformers. <strong>2012</strong>/13Resolve the protection limits on the Edgecumbe supply transformers. <strong>2012</strong>/13Resolve the protection limits on the Kopu supply transformers. <strong>2012</strong>/13Resolve the protection limits on the Carrington Street supply transformers. <strong>2012</strong>/13Resolve the metering and HV protection limits on Melling 110/33 kV and 110/11 kV supply transformers. <strong>2012</strong>/13Resolve the protection and metering limits on the Takapu Road supply transformers. <strong>2012</strong>/13Resolve the protection limits on the Motueka supply transformers. <strong>2012</strong>/13Resolve the protection limits on the Balclutha supply transformers. <strong>2012</strong>/13Resolve the protection limits on the Edendale supply transformers. <strong>2012</strong>/13Recalibrate metering parameters on the Invercargill supply transformer. <strong>2012</strong>/13Splitting Huapai 220 kV bus once the NAaN project is complete. 2013/14Resolve the protection and metering limits on the Upper Hutt supply transformers. 2013/14Resolve the protection limits on the Dobson supply transformers. 2013/14Resolve the protection limits on the Oamaru supply transformers. 2013/14Resolve the protection limits on the Mount Roskill supply transformers. 2014/15Recalibrate metering parameters on the South Dunedin supply transformers. 2014/15Resolve the protection limits on the Te Awamutu supply transformers. 2015/16Resolve the metering and protection limits on the Waipawa 11/33 kV transformers. 2015/16Resolve the metering and protection limits on the Greytown supply transformers. 2016/17Resolve the protection and metering limits on the Maungaturoto supply transformers. 2019/20175 These proposed projets are funded under approved Base Capex allowance.<strong>2012</strong> <strong>Annual</strong> <strong>Planning</strong> <strong>Report</strong> © <strong>Transpower</strong> New Zealand Limited <strong>2012</strong>. All rights reserved. 363
Appendix D: Project CalendarProjectsForecastcommissioning yearResolve the protection limits on the Wiri supply transformers. 2019/20Resolve the metering and protection limits on the Opunake supply transformers. 2019/20Resolve the protection limits on the Cromwell supply transformers. 2019/20Resolve protection and metering limits on the Tekapo A supply transformer. 2019/20Resolve the 110 kV disconnector limit on the Stoke 220/110 kV interconnecting transformer. 2020/21Resolve protection limits on the Bream Bay supply transformers. 2021/22Resolve the protection and metering limits on the Frankton T4 supply transformer. 2022/23Replace limiting switchgear on the Henderson T1. 2023/24Resolve protection and circuit breaker limits on the Albany supply transformers. 2023/24Resolve the metering limits on the Silverdale supply transformers. 2023/24Resolve the metering parameters on the Marton supply transformers. 2023/24Recalibrate the metering parameters on the Gisborne supply transformers. 2023/24Resolve the protection limits on the Wilton supply transformers. 2023/24Re-tune generator excitation systems and/or install power system stabilisers.To be advisedTable D-4: Forecast commissioning dates and project statusForecastcommissioningyearProjects Status Costband<strong>2012</strong>/13 A new 220/400 kV double-circuit transmission line from Pakuranga to Whakamaru. Committed GLower South Island Reliability projects (Commissioning years: <strong>2012</strong>/13-2014/15). Committed EUpper North Island reactive support – Stage 2 (Commissioning years: <strong>2012</strong>/13-2013/14). Committed FHVDC Pole 3 – Stage 1 and Stage 2 (Commissioning years: <strong>2012</strong>/13-2013/14). Committed G and DReplace the conductor on the 220 kV Bunnythorpe–Haywards 1 and 2 circuits (Commissioning years: <strong>2012</strong>/13-2018/19). Proposal submitted FResolve the protection limits on the Mangere supply transformers. Base Capex ABuilding a grid exit point at Piako. Committed (customer-specific) C364<strong>2012</strong> <strong>Annual</strong> <strong>Planning</strong> <strong>Report</strong> © <strong>Transpower</strong> New Zealand Limited <strong>2012</strong>. All rights reserved.
Appendix D: Project CalendarForecastcommissioningyearProjects Status CostbandResolve the protection limits on the Edgecumbe supply transformers. Base Capex AReplace the conductors on the 110 kV circuits between Stratford and Wanganui. Committed DReplace the Maungatapere 110/50 kV transformer with higher-rated units. Base Capex BResolve the protection limits on the Wellsford supply transformers. Base Capex AResolve protection limits on the Takanini supply transformers. Base Capex AResolve the bus and protection limits on the Cambridge supply transformers. Committed (customer-specific) AResolve the protection limits on the Kopu supply transformers. Base Capex AIncrease the rating of the two existing Te Kowhai transformers by installing radiators and fans. Committed (customer-specific) A110 kV grid reconfigurations to relieve Kawerau generation constraint. Proposal submitted AThermally upgrade the Kaitimako–Tarukenga circuits and change the operating voltage from 110 kV to 220 kV, and install two220/110 kV 150 MVA transformers at Kaitimako.CommittedDA new feeder from Tangiwai to Ohakune. Not yet agreed with customer AIncrease protection limits on the Carrington Street supply transformers. Base Capex AReplace the supply transformers at Stratford with two 40 MVA units (Commissioning years: <strong>2012</strong>/13-2014/15). Base Capex BReplace Masterton supply transformers with two 60 MVA units. Committed (customer-specific) BResolve the metering and HV protection limits on Melling 110/33 kV and 110/11 kV supply transformers. Base Capex AInstall new capacitors at Paraparaumu. Not yet agreed with customer AResolve the protection and metering limits on the Takapu Road supply transformers. Base Capex AResolve the protection limits on the Motueka supply transformers. Base Capex AReplace Stoke supply transformers with two 120 MVA units. Committed (customer-specific) CInstall one 220/66 kV transformer at Bromley (committed), followed by a second and third transformer at later date. Committed (customer-specific) BInstall reactive support at Oamaru. Not yet agreed with customer AResolve the protection limits on the Balclutha supply transformers. Base Capex AResolve the protection limit and upgrade the cable on the Edendale supply transformers.Base Capex (protection), andnot yet agreed with customer(cable)A<strong>2012</strong> <strong>Annual</strong> <strong>Planning</strong> <strong>Report</strong> © <strong>Transpower</strong> New Zealand Limited <strong>2012</strong>. All rights reserved. 365
Appendix D: Project CalendarForecastcommissioningyearProjects Status CostbandRecalibrate metering parameters on the Invercargill supply transformer. Base Capex A2013/14 Clutha-Upper Waitaki Lines Project (Commissioning years: 2013/14-2016/17). Committed FBuilding a new 220 kV double circuit transmission line between Wairakei and Whakamaru. Committed FSplitting Huapai 220 kV bus once the NAaN project is complete. Base Capex AIncrease supply transformer capacity at Dargaville by adding fans and/or pumps. Not yet agreed with customer ANew grid exit point at Wairau Road. Committed (customer-specific) CNorth Auckland and Northland project. Committed GNew grid exit point at Hobson Street. Committed (customer-specific) DTarukenga interconnecting transformer replacement. Base Capex DReplace Kawerau T12 with a 250 MVA 10 % impedance transformer. Proposal submitted BIncrease 110/11 kV supply transformer capacity at Rotorua or transfer some 11 kV load to the 33 kV bus and Owhata. Not yet agreed with customer TBAInstall an SPS scheme to automatically open the Mangamaire–Woodville circuit following an outage of one Bunnythorpe–Woodville circuit.Proposal not submittedAReplace Wanganui supply transformers with two 80 MVA units, or install new 110 kV feeders from Wanganui, or install 2 nd supplytransformer at Brunswick and supply the load from Brunswick (Commissioning years: 2013/14-2015/16).Base Capex for Wanganuitransformer replacementReplace Redclyffe supply transformers with two 120 MVA units. Committed (customer-specific) BReplace Central Park 110/33 kV supply transformers with 120 MVA units. Base Capex CReplace supply transformers at Haywards with two 110/33/11 kV 60 MVA units. Base Capex CResolve the protection and metering limits on the Upper Hutt supply transformers. Base Capex AInstall new capacitors at Motueka. Not yet agreed with customer AResolve the protection limits on the Dobson supply transformers. Base Capex AResolve the protection limits on the Oamaru supply transformers. Base Capex AInstall a 110 kV bus coupler at Timaru. Proposal not submitted AIncrease supply transformer’s capacity at Waitaki. Not yet agreed with customer A2014/15 A sixth bus coupler at Islington. Proposal not submitted TBAB366<strong>2012</strong> <strong>Annual</strong> <strong>Planning</strong> <strong>Report</strong> © <strong>Transpower</strong> New Zealand Limited <strong>2012</strong>. All rights reserved.
Appendix D: Project CalendarForecastcommissioningyearProjects Status CostbandInstall capacitors along the Valley Spur or within Powerco’s network, or replace existing transformers at Waikino and Waihou withon-load tap changing transformers (Commissioning years: 2014/15-2020/21).Not yet agreed with customerReplace Hangatiki supply transformers with two 40 MVA units. Base Capex BNew grid exit point at Putaruru. Not yet agreed with customer CConstruct a second transmission circuit either from Hangatiki or Karapiro to Te Awamutu. Not yet agreed with customer D or CResolve the circuit breaker limits and protection limits on the Mount Roskill supply transformers. Not yet agreed with customer AUpgrade the circuitbreaker and busbar ratings on the Takanini supply transformer. Not yet agreed with customer AIncrease the existing transformers capacity at Owhata. Three options are currently under reviewed. Not yet agreed with customer TBAThermally upgrade the Rotorua–Tarukenga circuits. Not yet agreed with customer TBAReplace the Bunnythorpe interconnecting transformers with two 150 MVA units (Commissioning years: 2014/15-2016/17). Proposal not submitted BThermally upgrade the Carrington Street–Stratford circuit’s terminal spans near Carrington Street. Proposal not submitted AUpgrade the LV bus section, disconnectors and current transformer limits on the Carrington–Street supply transformers. Not yet agreed with customer AA third supply transformer at Paraparaumu or a new grid exit point at Otaki. Not yet agreed with customer A or CInstall a third 220/66 kV transformer at Ashburton. Not yet agreed with customer AReplace Studholme supply transformers with higher-rated units. Not yet agreed with customer BReplace the Timaru supply transformers with higher-rated units or transfer some loads to 33 kV by installing two 220/33 kVsupply transformers.Not yet agreed with customerReplace Gore supply transformers with two higher-rated units (Commissioning years: 2014/15-2024/25). Base Capex AReplace Naseby supply transformers with two higher-rated units (Commissioning years: 2014/15-2020/21). Not yet agreed with customer ARecalibrate metering parameters on the South Dunedin supply transformers. Base Capex A2015/16 HVDC link expansion up to 1400 MW. Proposal not submitted EResolve the protection limits on the Te Awamutu supply transformers. Base Capex AReplace the Kinleith 110/33 kV 20 MVA supply transformer with a 40 MVA unit. Not yet agreed with customer AReconductor the Bunnythorpe–Woodville circuits with higher-rated conductors, or convert Bunnythorpe–Woodville circuits to220 kV operation (Commissioning years: 2015/16-2020/21).Proposal not submittedResolve the metering and protection limits on the Waipawa 11/33 kV transformers. Base Capex AA or B orACTBA<strong>2012</strong> <strong>Annual</strong> <strong>Planning</strong> <strong>Report</strong> © <strong>Transpower</strong> New Zealand Limited <strong>2012</strong>. All rights reserved. 367
Appendix D: Project CalendarForecastcommissioningyearProjects Status CostbandInstall a second transformer at New Plymouth, or operate the 220 kV New Plymouth–Stratfird circuits at 110 kV (Commissioningyears: 2015/16-2020/21).Install reactive support at Hawera, or contract for aditional reactive support, or install under-voltage load shedding capability(Commissioning years: 2015/16-2020/21).Proposal not submittedProposal not submittedTBAAInstall a second 250 MVA interconnecting transformer at Wilton (Commissioning years: 2015/16-2020/21). Proposal not submitted BA new grid exit point at Brightwater. Not yet agreed with customer CReplace the Dobson supply transformers with higher-rated units (Commissioning years: 2015/16-2017/18). Not yet agreed with customer BReplace Ashley 66/11 kV supply transformers with two 40 MVA units. Base Capex A2016/17 Install additional shunt reactive support around Islington or Bromley, or bus the existing circuits between Waitaki Valley andIslington where they converge near Geraldine.Proposal not submittedDConstruct a new Hamilton–Waihou or upgrade existing Hamilton–Waihou circuits. Not yet agreed with customer D or CResolve the metering and protection limits on the Greytown supply transformers. Base Capex AA new grid exit point at Riwaka. Not yet agreed with customer C2017/18 Install a new 220/33 kV transformer at Hamilton and/or at Te Kowhai. Not yet agreed with customer A and/orCInstall a third 220/110 kV interconnecting transformer at Kaitimako. Proposal not submitted BInstall a new 220/33 kV supply transformer at Brunswick. Not yet agreed with customer BThermally upgrade the Inangahua–Murchison–Kikiwa circuit, or install a special protection scheme. Proposal not submitted A orTBAReplace Edendale supply transformers with two higher-rated units. Base Capex BReplace two Halfway Bush 110/33 kV transformers with one 220/33 kV transformer. Base Capex TBA2018/19 Replace Huirangi supply transformers with two 50 MVA units and reconfigure the distribution system. Not yet agreed with customer BReplace the Fernhill 30 MVA supply transformer with an 80 MVA unit. Base Capex AReplace the North Makarewa 220/33 kV transformers with two 220/66 kV units. Not yet agreed with customer TBA2019/20 Resolve the protection and metering limits on the Maungaturoto supply transformers. Base Capex AResolve the protection limits on the Wiri supply transformers. Base Capex AReplace the transformers at Waiotahi with two higher-rated units. Base Capex A368<strong>2012</strong> <strong>Annual</strong> <strong>Planning</strong> <strong>Report</strong> © <strong>Transpower</strong> New Zealand Limited <strong>2012</strong>. All rights reserved.
Appendix D: Project CalendarForecastcommissioningyearProjects Status CostbandResolve the metering and protection limits on the Opunake supply transformers. Base Capex AResolve the protection limits on the Cromwell supply transformers. Base Capex AThermally upgrade the 110 kV Cromwell–Frankton circuits. Not yet agreed with customer TBAResolve protection and metering limits on the Tekapo A supply transformer. Base Capex A2020/21 Resolve the constraint on the terminal spans at Otahuhu and Penrose substations. Base Capex AReplace the supply transformers at Wiri with higher-rated units. Not yet agreed with customer BInstall a special protection scheme, or Kinleith 110 kV bus reconfiguration (Commissioning years: 2020/21-2026/27). Proposal not submitted AReplace the supply transformers at Waikino with higher-rated units. Base Capex BResolve the 110 kV disconnector limit on the Stoke 220/110 kV interconnecting transformer. Base Capex AInstall additional capacitors in the West Coast, or install a special protection scheme Proposal not submitted A orTBAEstablish a new 220/66 kV grid exit point southof Christchurch. Not yet agreed with customer C2022/23 Replace the Waihou supply transformers with higher-rated units (Commissioning years: 2022/23-2026/27). Base Capex BResolve protection and metering limits on Frankton T4 supply transformer and upgrade T2A & T2B supply transformer capacity.Base Capex (protection andmetering), and not yet agreedwith customer (transformercapacity)Resolve the protection and metering limits on the Frankton T4 supply transformer. Base Capex AIncrease Frankton T2A & T2B supply transformers’ capacities by adding pumps. Not yet agreed with customer A2023/24 Replace limiting switchgear on the Henderson T1. Base Capex AInstall a 3 rd 220/110 kV transformer at Marsden, and convert the 220 kV and 110 kV buses to three zones Proposal not submitted BResolve protection and circuit breaker limits on the Albany supply transformers. Base Capex AResolve the metering limits on the Silverdale supply transformers. Base Capex AResolve the metering parameters on the Marton supply transformers. Base Capex ARecalibrate the metering parameters on the Gisborne supply transformers. Base Capex AResolve the protection limits on the Wilton supply transformers. Base Capex AAA<strong>2012</strong> <strong>Annual</strong> <strong>Planning</strong> <strong>Report</strong> © <strong>Transpower</strong> New Zealand Limited <strong>2012</strong>. All rights reserved. 369
Appendix D: Project CalendarForecastcommissioningyearProjects Status Costband2024/25 Automatic split the 110 kV network between Henderson and Maungatapere or thermal upgrade the Henderson–Wellsford circuits. Proposal not submitted TBA2025/26 Install a new interconnecting transformer at Hamilton or at a new grid exit point. Proposal not submitted B or CReplace Halfway Bush 220/33 kV 100 MVA transformers with one 220/33 kV 120 MVA transformer. Base Capex TBATo be advised Upper North Island reactive support post 2014. Proposal not submitted TBARe-tune generator excitation systems and/or install power system stabilisers. Base Capex AIncrease the ratings of the 220 kV Brunswick–Stratford circuits, reconductor Huntly–Stratford circuits or a new line betweenTaumarunui and Whakamaru.Tranche 1 – an SPS/series reactor/phase shifting transformer, or increase the capacity of Tokaanu–Whakamaru andBunnythorpe–Tangiwai–Rangipo circuits.Tranche 2 – reconductor the Bunnythorpe–Tokaanu circuits, or a new transmission capacity between Bunnythorpe andWhakamaru, or a new line from Taumarunui to Whakamaru, or Lower North Island-wide SPS.Proposal not submittedProposal not submittedC and EF or GIncrease the HVDC line rating. Proposal not submitted TBAIncrease the ratings of the 220 kV Benmore–Twizel 1 circuit. Proposal not submitted BAdditional voltage support at Kaitaia or Maungatapere. Proposal not submitted TBAInstall a third supply transformer at Henderson. Not yet agreed with customer BThermal upgrade the 110 kV Kaikohe–Maungatapere circuits. Not yet agreed with customer TBAUpgrade the Kensington 33 kV switchboard, and upgrade branch limiting components on the Kensington–Maungatapere circuits. Not yet agreed with customer TBAInstall a third supply transformer at Otahuhu, or replace with existing transformers with higher-rated units. Not yet agreed with customer BInstall a new cable from Otahuhu connecting to a new 110/ 33 kV transformer at Wiri, or a 110/33 kV transformer at Otahuhu and33 kV cable to Wiri, or reconductor Otahuhu–Wiri circuit, or a new 220/110 kV connection at Bombay and supply Wiri from hereand a 110 kV bus at Wiri.Under investigationDReplace Otahuhu T2 & T4 with higher impedance transformers, or upgrade the Otahuhu–Penrose circuit capacity. Proposal not submitted TBAReplace the Hinuera 30 MVA supply transformer with a 60 MVA unit. Not yet agreed with customer AA new grid exit point at Papamoa. Not yet agreed with customer BReplace Edgecumbe supply transformers with higher-rated units. Not yet agreed with customer CInstall either series reactors or phase shifting transformers to reduce the power flows on the Bunnythorpe–Mataroa circuits. Proposal not submitted TBA370<strong>2012</strong> <strong>Annual</strong> <strong>Planning</strong> <strong>Report</strong> © <strong>Transpower</strong> New Zealand Limited <strong>2012</strong>. All rights reserved.
Appendix D: Project CalendarForecastcommissioningyearProjects Status CostbandInstall new capacitors at Gisborne 110 kV bus. Proposal not submitted TBAUpgrade the Takapu Road supply transformer capacity. Not yet agreed with customer BInstall a second 110/66 kV interconnecting transformer at Stoke. Not yet agreed with customer BThermal upgrade Kikiwa–Stoke 110 kV circuit. Proposal not submitted TBAReplace Kikiwa T1 with a higher-rated unit. Proposal not submitted TBAImplement Kawaka bonding project. Proposal not submitted TBAReplace existing two 220/33 kV transformers with 220/66 kV higher-rated units at Culverden. Not yet agreed with customer TBAInstall two new 66 kV feeders from Southbrook. Not yet agreed with customer TBAInstall a new 220/66 kV transformer at Islington. Proposal not submitted BTo increase supply security at Bells Pond. Not yet agreed with customer TBAA new grid exit point near St Andrews. Not yet agreed with customer TBAIncrease interconnecting transformer capacity at Timaru. Proposal not submitted TBAInstall a new 120 MVA transformer at Temuka, and upgrade the 110 kV Timaru–Temuka circuits. Not yet agreed with customer B and BInstall a second supply transformer at Waitaki. Not yet agreed with customer A<strong>2012</strong> <strong>Annual</strong> <strong>Planning</strong> <strong>Report</strong> © <strong>Transpower</strong> New Zealand Limited <strong>2012</strong>. All rights reserved. 371
Appendix E: Investment Approvals ProcessAppendix E<strong>Transpower</strong>’s Investment Approvals Process(IAP)E.1 Purpose of the Investment Approvals ProcessThe Investment Approvals Process (IAP) is the decision – making framework forpreparing investment proposals. It is a robust and replicable process, adaptable tothe range of investment situations that arise: - large and small value proposals withmany or few options to investigate. The output is a high quality investment proposalfor approval by the Commerce Commission or a Customer. <strong>Transpower</strong>’s Board andstakeholders can be confident that the investment and delivery decisions are drivenby a verified need and are efficient, appropriate and defensible.There are two approval routes:Regulatory approval of proposals for investment in interconnection assets allows<strong>Transpower</strong> to add the assets to its regulated asset base (RAB) and to recovercosts via the Transmission Pricing Methodology (TPM), andInvestment in connection assets which are paid for by customers are not addedto <strong>Transpower</strong>’s regulated asset base. The exception to this, which has not yetever occurred, is where investment in connection assets is required to meet GRSand is approved by the Commerce Commisison via a Major Capex proposal.E.2 IAP FrameworkThe Framework consists of five stages with generic actions occurring through each(outlined in Figure 1). Specific actions are required according to the rules 176 forinvestment in interconnection assets and rules for investment in connection assets,e.g. proposals that require individual Regulator approval (for investment ininterconnection assets) must comply with rules for consultation and methodology foreconomic analysis.NeedOptionsIdentificationOptionsAnalysisProposalTransition toDelivery176 Relevant rules as at March <strong>2012</strong> are those in Part 12 Electricity Industry Participation Code 2010and Capex Input Methodology <strong>2012</strong>.372<strong>2012</strong> <strong>Annual</strong> <strong>Planning</strong> <strong>Report</strong> © <strong>Transpower</strong> New Zealand Limited <strong>2012</strong>. All rights reserved.
Appendix E: Investment Approvals ProcessOutline of IAP StagesNeedNeeds are identified through <strong>Annual</strong> <strong>Planning</strong> <strong>Report</strong> process, includingconsultation with Customers.Each need is investigated and verified as an investment case.OptionsIdentificationInterconnectionA range of investment options isconsidered, including possible nontransmissionsolutionsConsultation on need, approach,assumptions, long list options; andrequest additional information, throughconsultation document and/orStakeholder forum.The long list options are refined to a setof credible options, using specific criteria(high-level cost, feasibility, GEIP).ConnectionTP produces a High LevelResponse for investment options,taking into account Customerneed.Costs and benefits are assessed under the regulated cost/benefit test (theInvestment Test) with analysis commensurate with the likely investment cost.OptionsAnalysisA short-list of investments options isidentified from economic, technical andfeasibility analysis of credible options.Decision rule for proposed investment isbased on maximum net benefits or leastnet cost (depending on whetherinvestment is to meet the Grid ReliabilityStandards and / or to create net benefitsto the market).Customer decides on preferred optionand signs a contract for detailed studydesign.TP must assess any implications forthe Grid Reliability Standards (GRS)arising from the investment.Both TP and Customers haverequirements under the Codedepending on the GRS assessment.ProposalInvestment option confirmedincluding through feedback fromstakeholders on short list options and/orpreferred option.Investment proposal submitted toCommerce Commission.Investment option confirmedand <strong>Transpower</strong> and theCustomer enter into anInvestment Contract.Transition toDeliveryThe approved investment enters a detailed design (equipment and placement)stage and approvals processes under the RMA are undertakenConsultation continues within communities affected by ensuing works.<strong>2012</strong> <strong>Annual</strong> <strong>Planning</strong> <strong>Report</strong> © <strong>Transpower</strong> New Zealand Limited <strong>2012</strong>. All rights reserved. 373
Appendix F: Grid Support ContractsAppendix FGrid Support ContractsF.1 BackgroundFollowing the 2007 - 2008 demand-side participation trials and the consideration ofthe many complex issues and trade-offs involved, <strong>Transpower</strong> designed a gridsupport contract (GSC) product incorporating feedback from its industry consultationprocess. The design and sample contracts are available on <strong>Transpower</strong>’s projectwebsite. 177<strong>Transpower</strong> has introduced grid support contracts (GSCs) to enable it to contract withproponents of non-transmission options to augment or substitute for grid capacity inspecific circumstances.F.2 Use of GSCsGSCs as a risk management tool<strong>Transpower</strong> has significant concerns over the risk to reliability of supply frominsufficient transmission capacity that could arise from:delayed build of new transmission assets - whether for reasons of regulatoryapproval, obtaining consents under the RMA, acquiring property, or due tocompetition in world markets for transmission assets and expertisehigher demand growth than was forecast at the time of investment decision,which would bring forward the need date, ormajor asset failure - which is a growing concern given the age of <strong>Transpower</strong>’sasset base.GSCs are designed to provide a useful product as part of a toolbox of approaches tomanaging such risks.GSCs as a transmission deferral toolGSCs may also be used to contract for products that can defer transmissioninvestments where there is genuine option value in deferring an investment decision.Where such option values do not exist, <strong>Transpower</strong> would not propose to use GSCsto push investment to the very edge of modelled ‘just in time’ limits. There are hugeasymmetries of risk, with transmission ‘better a year early than a day late’. Critically,to plan to use GSCs for deferring an investment in this way would remove theiradvantage as an insurance against the delivery risks outlined above.177 http://www.gridnewzealand.co.nz/gsc-publications.374<strong>2012</strong> <strong>Annual</strong> <strong>Planning</strong> <strong>Report</strong> © <strong>Transpower</strong> New Zealand Limited <strong>2012</strong>. All rights reserved.
Appendix F: Grid Support ContractsF.3 Key parametersKey parameters of <strong>Transpower</strong>’s GSC product design include the following.GSCs will be specific to transmission capacity problems and offered only forspecific regions and periods when these are occurring or are forecast to occur.GSCs will not be offered to address generation adequacy problems.<strong>Transpower</strong> will not pick winners or losers: <strong>Transpower</strong> will identify a need, apotential provider may propose a commercial solution to the need, and<strong>Transpower</strong> will decide whether or not to offer a GSC for that proposal.To encourage innovation in non-transmission solutions, GSCs will be open to allnon-transmission options, but with clear qualification and evaluation criteria toensure reliability.To encourage competition in procurement, GSCs will be offered to successfultenders through a full request for information (RFI) and request for proposal(RFP) process: qualification and evaluation criteria will be applied.GSCs will be contracts for services, not for <strong>Transpower</strong> ownership. <strong>Transpower</strong>will offer them in its capacity as grid owner. For those GSCs that require to becalled or dispatched, this will be done by the System Operator on behalf of thegrid owner.As cost recovery will be through the transmission pricing methodology (TPM),approval of the GSCs will be required from the Commerce Commission (unlesspre-approved by the former Electricity Commission). GSCs will be offered onlyas part of a reliability investment proposal for assets on the interconnected grid:they will not be offered for connection asset issues or for economic investments.F.4 Design issues<strong>Transpower</strong> has concerns about some specific issues around GSC design andoperation and the GSC product on offer is intended to minimise these risks.<strong>Transpower</strong>’s main concern is how to obtain the benefits possible from GSCs without:compromising reliabilitysignificant interference in the wholesale electricity marketsignificant distortions in electricity generation investment incentives, or<strong>Transpower</strong> becoming relied on for energy as well as transmission capacityprovision.ReliabilityHistorically, the transmission grid was developed to link previously unconnectedregions to provide greater levels of reliability through access to more generationresources. While initially undertaken for energy transport reasons, more recentlyinvestment has been for market efficiency too.Using GSCs to maintain reliability therefore requires them to be highly reliable.It is unrealistic to expect local generation or demand-side response to be able toachieve transmission levels of reliability. Rather, a reliability level of around 99% to99.9% may be achievable, which may be adequate if exposure to these lowerreliability levels is limited to system peaks for limited periods. Using these options itmust be appreciated that reliability may decline, but the options still add value as arisk management tool. Even lower levels of reliability, or prolonged exposure to suchlevels, would in <strong>Transpower</strong>’s view not be acceptable for the backbone,interconnected grid.A key issue in GSC design and operation is therefore ensuring that appropriatereliability criteria are set for proponents wishing to enter into GSCs.<strong>2012</strong> <strong>Annual</strong> <strong>Planning</strong> <strong>Report</strong> © <strong>Transpower</strong> New Zealand Limited <strong>2012</strong>. All rights reserved. 375
Appendix F: Grid Support ContractsMarket distortionA significant issue for our GSC design process is to what extent the use of GSCscould distort existing markets, in particular the wholesale generation investment andoperations market. The wholesale electricity market is a multi-billion dollar perannum market, whereas the GSC market is likely to be in the order of some tens ofmillions per annum at most. Designing and operating GSCs to minimise interferencein the wholesale market is essential.F.5 Forms of GSCThe design encompasses three forms of GSC:Demand-side participation (DSP), including non-market generation<strong>Transpower</strong> has trialled small aggregated DSP in its 2007 Pilot and 2008 Trial. Thesedemonstrated that, under certain conditions, blocks of aggregated small DSP sourcescan be made reliable. Significant issues arose in forecasting the time and size ofneed sufficiently accurately at the time of call. <strong>Transpower</strong> is investigatingimprovements to the load forecasting processes and also the criteria for callingDemand Response as a means to address the issues identified at the time of thosetrials. A Demand-side participation GSC may include a variety of Demand Response(DR) resources, including aggregated blocks of multiple small DR resources, blocksmade up of single load, and in principle, non-market generation sources (although thelatter are likely to be part of an aggregated block). Blocks would be called individuallyby the System Operator in accordance with instructions from <strong>Transpower</strong> as gridowner reflecting the contract terms. Blocks would be expected to deliver thecontracted capacity: their reliability would be a paramount consideration in thedesign, procurement and operation of this form of GSC. Blocks would either becalled ahead of time using a Demand Response Management System (DRMS), or beoperated automatically post-contingency.Voltage support<strong>Transpower</strong> will use GSCs for contracting for voltage support over medium to longterm planning horizons. They will in effect replace the voltage support ancillaryservice contracts over these timeframes. This will provide improved integration ingrid planning, as the grid planner can better ‘co-optimise’ real and reactive powerissues and transmission and non-transmission reactive support options, overplanning horizons from technical, good electricity industry practice and economicperspectives. In particular, the grid planner can test and contract for the availabilityand cost of future voltage support, rather than simply assume that this will be theeventual outcome of ancillary service voltage support contracts. Cost allocationwould change from zonal under Part 8 (of the Electricity Industry Participation Code)to national under the Part 12 transmission pricing methodology, aligning costallocation for transmission and non-transmission reactive support solutions. TheSystem Operator would still procure contracts of a short-term nature to cover forunanticipated reactive power requirements.Market generationFor market generation, avoiding interference in the operational market is paramount.GSCs will not be offered to define how generators would offer real power into themarket, whether in time, quantity or price. Rather, GSCs will be limited tocontributions to capital or other fixed ‘up front’ costs. In effect, GSCs will be used tobuy certainty over a particular generator’s development path – be it for example intime, equipment or location – to allow transmission to be safely designed around it.Proponents will be required to demonstrate that they are sufficiently committed to beable to deliver and that their contract price is a fair and reasonable reflection of actualcost.376<strong>2012</strong> <strong>Annual</strong> <strong>Planning</strong> <strong>Report</strong> © <strong>Transpower</strong> New Zealand Limited <strong>2012</strong>. All rights reserved.
Appendix F: Grid Support ContractsF.6 Process for offering GSCsAs GSCs are specific to transmission capacity problems, GSCs will be offered only aspart of a reliability investment proposal for assets on the interconnected grid. Thus,GSCs will become a routine part of <strong>Transpower</strong>’s grid planning process. Where thereis a proponent of a non-transmission option (identified through <strong>Transpower</strong>’s RFI andRFP process) that meets the GSC qualification and evaluation criteria, the option willbecome part of the preferred option that is submitted as an investment proposalunder a GUP.The diagram on the next page illustrates how GSCs are integrated into the existinggrid planning process.F.7 Updates and further informationIn 2011, <strong>Transpower</strong> released a request for proposal for the procurement of 60 MWof demand-side response in the Upper North Island. No demand response wasprocured through this process, due to the offers being deemed uneconomic as atransmission deferral option for Upper North Island.A key finding from the tender process was that demand response needs to beestablished if it is to be an economic transmission deferral product. Requiringproponents to provide adequate demand response within a condensed timeframe andfor a relatively short contract period only drives prices upward. Reliability demandresponse needs to be established as a sustained programme and not as a reactive“just in time” measure.<strong>Transpower</strong> has re-scoped the Upper North Island Demand Side Initiatives (UNI DSI)project to investigate whether reliable demand can be delivered at economic cost.The re-scoped project builds on what we learnt during the tender process in 2011.The project includes implementing a pilot which will:test a demand response management system for effective dispatch of demandresponse.assess whether the management system reduces barriers to entry for differenttypes of demand response.discover the economic price points for different types of demand response.determine whether a sustainable demand response programme can beestablished.The implementation of the pilot will be conducted over a number of months, with areview at each stage.It is anticipated that the GSC product will be progressively refined with experience.The current design details of the product may differ slightly from those outlinedabove.<strong>2012</strong> <strong>Annual</strong> <strong>Planning</strong> <strong>Report</strong> © <strong>Transpower</strong> New Zealand Limited <strong>2012</strong>. All rights reserved. 377
Appendix F: Grid Support ContractsInvestment Approval ProcessNeedProject assumptionsRFIOptions IdentificationTransmission &transmission alternativesLong-listRFPShort-listOptions AnalysisConsultationdocumentGUPProposalCC’s noticeof intentionCC’s finaldecisionTransition to DeliveryIntegration of Grid Support Contracts fortransmission alternativesIdentificationAPR with GRR,GEIRLong term plans for the gridassist potential proponents oftransmission alternatives todevelop conceptIndustry responsesto RFIEvaluate industry responsesto RFIIndustry responsesto RFPEvaluation<strong>Transpower</strong> issues an RFP if therecould be practical transmissionalternatives. <strong>Transpower</strong> short listsproposals that meet qualificationcriteria and have technical,economic and commercial merit.Evaluate industry responsesto RFPAgree technical and commercialtermsContract signed conditionalonCC approvalProcurementIf a short-listed transmissionalternative becomes the preferredsolution, or is part of the solution,a conditional contract isnegotiated.ApprovalGrid Support Contract<strong>Transpower</strong> ensures that costscan be recovered under the Codeand under the Commerce ActQualification criteriaStandard ContractQualification criteriaTo ensure reliability requirements, minimisemarket distortion and manage commercial riskto <strong>Transpower</strong>:CapacityOperating ConditionsReliabilityDegree of CommitmentRange of ServicesPrudential requirementsStandard contractOperating criteriaPerformance and testingProof of complianceInterface with other marketsPenalty provisionsFees and pricing structureOther standard contractual terms378<strong>2012</strong> <strong>Annual</strong> <strong>Planning</strong> <strong>Report</strong> © <strong>Transpower</strong> New Zealand Limited <strong>2012</strong>. All rights reserved.
Appendix G Generation ScenariosAppendix GGeneration ScenariosThis section details the timing, type, location and size of new generators assumed ineach of the generation scenarios.The scenarios range from being renewable to being more thermally oriented.The generation scenarios assume specific points of connection for new modelledgenerators. The choice of connection point is often arbitrary, but required in order toeffectively model future transmission grids. Changes to these connection points maybe necessary when testing proposed transmission investment into a region.G.1 Scenario 1: Sustainable PathThe major features of the Sustainable Path scenario are:Carbon charges and gas prices are both very high. As a result, renewableenergy production exceeds 90% of total generation (on average) from 2020onwards.Major development of renewable generation takes place in both North and SouthIslands. By 2027, geothermal capacity has reached 1500 MW, wind capacityexceeds 3,000 MW, and 1,000 MW of new hydro has been constructed.Tidal and wave energy, distributed solar power, and biomass cogeneration alsofeature.Baseload thermal generation is largely phased out, with all four Huntly coal-firedunits, Otahuhu B, Taranaki CC and Southdown decommissioned by 2027.Thermal peaking plants are required in order to balance intermittent generation,provide dry-year swing, and supply reliable capacity to meet peak demand. By2027, over 1,400 MW of thermal peakers are available.Interruptible load (IL) and price-responsive demand, driven by advancedmetering, time-of-use tariffs, and other initiatives, have an important role to playin balancing intermittent generation and meeting peak demand.The extent of demand-side management, however, is substantially less than wasassumed in the 2010 Statement of Opportunities (and hence the last APR). Thetotal (firm) demand-side management capacity increases by 400 MW between2011 and 2027.<strong>2012</strong> <strong>Annual</strong> <strong>Planning</strong> <strong>Report</strong> © <strong>Transpower</strong> New Zealand Limited <strong>2012</strong>. All rights reserved. 379
MWAppendix G: Generation Scenarios14000Installed capacity by technology - Sustainable path (mds1)12000100008000600040002000WindWaveTidalSolarCogeneration, otherOpen cycle gas turbine - gasInterruptible loadCoal, IGCC w ith CCSHydro, schedulableHydro, run of riverHydro, peakingHydro, pumped storageGeothermalPeaker, fast start gas-fired peakerCogeneration, gas-firedPeaker, diesel-fired OCGTPrice-responsive load curtailmentCoalCombined cycle gas turbineCogeneration, biomass-fired0<strong>2012</strong> 2014 2016 2018 2020 2022 2024 2026YearProjects and commission dates – Sustainable Path scenarioYear Plant description Technology description CapacityMWSubstation(approx)2013 Huntly coal unit 1 Coal 0 (Decomm.)Huntly2013 Wairakei Geothermal 0 (Decomm.)Wairakei2013 Kawerau Norske Skog Geothermal 25 Kawerau2013 Te Mihi Geothermal 165 Wairakei2013 Remaining part of Wairakei Geothermal 110 Wairakei2013 Waitara McKee peaker Peaker, fast start gas-firedpeaker100 MotunuiDeviation2014 Ngatamariki Geothermal 82 Nga Awa Purua2015 Huntly coal unit 2 Coal 0 (Decomm.)Huntly2015 Tauhara stage 2 Geothermal 200 Wairakei2015 Demand side response 1 NI Price-responsive loadcurtailment2015 Demand side response 1 SI Price-responsive loadcurtailment50 Takapuna50 Bromley2015 Generic solar 1 Solar 50 Penrose2015 Mill Creek Wind 60 Wilton2016 Generic geo 1 Geothermal 100 Kawerau2016 Pukaki Gates Hydro, peaking 35 Pukaki2016 Arnold Hydro, run of river 46 Dobson2016 New IL 1 Interruptible load 50 Penrose2017 Wairau Hydro, run of river 73 Blenheim380<strong>2012</strong> <strong>Annual</strong> <strong>Planning</strong> <strong>Report</strong> © <strong>Transpower</strong> New Zealand Limited <strong>2012</strong>. All rights reserved.
Appendix G Generation ScenariosYear Plant description Technology description CapacityMWSubstation(approx)2017 Stockton Hydro, run of river 30 Westport2017 Demand side response 2 NI Price-responsive loadcurtailment50 Mangere2017 Castle Hill 1 Wind 200 Linton2017 Central Wind Wind 120 Rangipo2018 Southdown Combined cycle gas turbine 0 (Decomm.)Southdown2018 Generic geo 2 Geothermal 100 Ohaaki2018 Generic geo 4 Geothermal 100 Whakamaru2018 Generic geo 5 Geothermal 100 Rotorua2018 Diesel fired OCGT 1 Peaker, diesel-fired OCGT 40 Marsden2018 Diesel fired OCGT 10 Peaker, diesel-fired OCGT 40 Kaitemako2018 Diesel fired OCGT 19 Peaker, diesel-fired OCGT 40 Gracefield2018 Demand side response 3 NI Price-responsive loadcurtailment50 Central Park2018 Generic solar 3 Solar 50 Addington2019 Taranaki CC Combined cycle gas turbine 0 (Decomm.)Stratford2019 Kaituna Hydro, run of river 15 Tarukenga2019 Diesel fired OCGT 9 Peaker, diesel-fired OCGT 100 Huntly2019 Gas fired OCGT 9 Peaker, fast start gas-firedpeaker160 Huntly2019 Maungaharuru Wind 94 Whirinaki2019 Castle Hill 2 Wind 200 Linton2019 Hauauru ma raki 1 Wind 250 Huntly2019 Taharoa Wind 54 Hangatiki2019 Mt Cass Wind 50 Waipara2020 Huntly coal unit 3 Coal 0 (Decomm.)Huntly2020 Otahuhu B Combined cycle gas turbine 0 (Decomm.)Otahuhu2020 Biomass Cogen, Kawerau Cogeneration, biomass-fired 31 Kawerau2020 North Bank Tunnel Hydro, peaking 280 Waitaki2020 Diesel fired OCGT 3 Peaker, diesel-fired OCGT 100 Marsden2020 Gas fired OCGT 2 Peaker, fast start gas-firedpeaker2020 Gas fired OCGT 5 Peaker, fast start gas-firedpeaker2020 Demand side response 4 NI Price-responsive loadcurtailment100 Southdown100 Otahuhu50 Penrose2020 Generic tidal 1 Tidal 200 Wellsford2020 Waverley Wind 135 Waverley2021 Generic solar 2 Solar 50 Mt Roskill2021 Mahinerangi stage 2 Wind 170 Halfway Bush2021 Hauauru ma raki 2 Wind 250 Huntly2022 Clutha River Hydro, peaking 200 Roxburgh2022 New IL 2 Interruptible load 50 Mt Roskill2023 Diesel fired OCGT 6 Peaker, diesel-fired OCGT 100 Otahuhu<strong>2012</strong> <strong>Annual</strong> <strong>Planning</strong> <strong>Report</strong> © <strong>Transpower</strong> New Zealand Limited <strong>2012</strong>. All rights reserved. 381
Appendix G: Generation ScenariosYear Plant description Technology description CapacityMWSubstation(approx)2023 Castle Hill 3 Wind 200 Linton2023 Long Gully Wind 12.5 Central Park2023 Hurleyville Wind 100 Hawera2024 Generic run of river 1 Hydro, run of river 50 Stoke2024 Waitahora Wind 175 Linton2024 Taumatatotara Wind 44 Hangatiki2025 Huntly coal unit 4 Coal 0 (Decomm.)Huntly2025 Waikato upgrade Hydro, peaking 150 Whakamaru2025 Generic run of river 9 Hydro, run of river 50 Tarukenga2025 Generic run of river 5 Hydro, run of river 50 Culverden2025 Diesel fired OCGT 15 Peaker, diesel-fired OCGT 100 Whirinaki2025 Demand side response 12 NI Price-responsive loadcurtailment50 Mt Roskill2025 Cape Campbell Wind 150 Blenheim2026 Generic run of river 8 Hydro, run of river 50 Wanganui2026 Generic solar 4 Solar 50 Stoke2026 Generic wind North Isthmus 1 Wind 200 Maungatapere2027 Diesel fired OCGT 12 Peaker, diesel-fired OCGT 100 Kaitemako2027 Generic wave 2 Wave 38 Waimangaroa2027 Kaiwera Downs Wind 240 NorthMakarewaG.2 Scenario 2: South Island WindThe key features of the South Island Wind scenario are:Carbon prices and gas prices are both high. As a result, renewable energyproduction exceeds 85% of total generation (on average) from 2020 onwards.By 2020, over 600 MW of new hydro and 600 MW of new wind generation havebeen added in the South Island. This is less than assumed in the 2010Statement of Opportunities (and hence the last APR), but still a substantialamount.There is also substantial development of wind generation in the lower NorthIsland, with nearly 1,000 MW added by 2022.Overall there is strong wind and hydro development in both islands. By 2027,wind capacity exceeds 3000 MW, and 1000 MW of new hydro has beenconstructed. Geothermal development is slower than in other scenarios, withcapacity maxing out at 1,000 MW.Baseload thermal generation is considerably reduced, with three out of fourHuntly coal-fired units, Taranaki CC and Southdown decommissioned by 2027.Over 1400 MW of thermal peakers are available by 2027. Interruptible load andprice-responsive demand increase by 350 MW over the same period.382<strong>2012</strong> <strong>Annual</strong> <strong>Planning</strong> <strong>Report</strong> © <strong>Transpower</strong> New Zealand Limited <strong>2012</strong>. All rights reserved.
MWAppendix G Generation Scenarios14000Installed capacity by technology - SI wind (mds2)1200010000800060004000WindSolarCogeneration, otherOpen cycle gas turbine - gasInterruptible loadCoal, IGCC w ith CCSHydro, schedulableHydro, run of riverHydro, peakingGeothermalPeaker, fast start gas-fired peakerCogeneration, gas-firedPeaker, diesel-fired OCGTPrice-responsive load curtailmentCoalCombined cycle gas turbineCogeneration, biomass-fired20000<strong>2012</strong> 2014 2016 2018 2020 2022 2024 2026YearProjects and commission dates – South Island Wind scenarioYear Plant description Technology description CapacityMWSubstation(approx)2013 Huntly coal unit 1 Coal 0 (Decomm.)Huntly2013 Wairakei Geothermal 0 (Decomm.)Wairakei2013 Kawerau Norske Skog Geothermal 25 Kawerau2013 Te Mihi Geothermal 165 Wairakei2013 Remaining part of Wairakei Geothermal 110 Wairakei2013 Waitara McKee peaker Peaker, fast start gas-firedpeaker100 MotunuiDeviation2014 Ngatamariki Geothermal 82 Nga Awa Purua2014 Central Wind Wind 120 Rangipo2015 Huntly coal unit 2 Coal 0 (Decomm.)Huntly2015 Hawea Control Gate Retrofit Hydro, peaking 17 Cromwell2015 Mohikinui Hydro, run of river 85 Inangahua2015 Gas fired OCGT 9 Peaker, fast start gas-firedpeaker160 Huntly2015 Mill Creek Wind 60 Wilton2015 Mt Cass Wind 50 Waipara2015 Turitea Wind 180 Linton2016 Generic geo 4 Geothermal 100 Whakamaru2016 Stockton Hydro, run of river 30 Westport2016 New IL 1 Interruptible load 50 Penrose2016 Taharoa Wind 54 Hangatiki<strong>2012</strong> <strong>Annual</strong> <strong>Planning</strong> <strong>Report</strong> © <strong>Transpower</strong> New Zealand Limited <strong>2012</strong>. All rights reserved. 383
Appendix G: Generation ScenariosYear Plant description Technology description CapacityMWSubstation(approx)2017 Wairau Hydro, run of river 73 Blenheim2017 Demand side response 1 NI Price-responsive loadcurtailment2017 Demand side response 2 NI Price-responsive loadcurtailment50 Takapuna50 Mangere2017 Mahinerangi stage 2 Wind 170 Halfway Bush2017 Project Hayes stage 1 Wind 150 Roxburgh2018 Southdown Combined cycle gas turbine 0 (Decomm.)Southdown2018 North Bank Tunnel Hydro, peaking 280 Waitaki2018 Demand side response 3 NI Price-responsive loadcurtailment50 Central Park2018 Castle Hill 1 Wind 200 Linton2019 Taranaki CC Combined cycle gas turbine 0 (Decomm.)Stratford2019 Gas fired OCGT 3 Peaker, fast start gas-firedpeaker2019 Gas fired OCGT 8 Peaker, fast start gas-firedpeaker2019 Gas fired OCGT 11 Peaker, fast start gas-firedpeaker160 Southdown100 Huntly100 Stratford2019 Castle Hill 2 Wind 200 Linton2019 Castle Hill 3 Wind 200 Linton2019 Project Hayes stage 2 Wind 160 Roxburgh2020 Huntly coal unit 3 Coal 0 (Decomm.)Huntly2020 Clutha River Hydro, peaking 200 Roxburgh2020 Kaituna Hydro, run of river 15 Tarukenga2020 Diesel fired OCGT 3 Peaker, diesel-fired OCGT 100 Marsden2020 Diesel fired OCGT 6 Peaker, diesel-fired OCGT 100 Otahuhu2020 Diesel fired OCGT 12 Peaker, diesel-fired OCGT 100 Kaitemako2020 Demand side response 4 NI Price-responsive loadcurtailment50 Penrose2020 Long Gully Wind 12.5 Central Park2021 Taumatatotara Wind 44 Hangatiki2021 Hauauru ma raki 1 Wind 250 Huntly2021 Generic wind North Isthmus 1 Wind 200 Maungatapere2022 Puketoi Wind 175 Linton2022 Puketiro Wind 90 Pauatahanui2023 Generic run of river 9 Hydro, run of river 50 Tarukenga2023 Generic run of river 10 Hydro, run of river 50 Wairoa2023 Generic wind Wellington Wind 80 Takapu Rd2024 Biomass Cogen, Kawerau Cogeneration, biomass-fired 31 Kawerau2024 Biomass Cogen, Central Cogeneration, biomass-fired 63 Tangiwai2024 Generic run of river 8 Hydro, run of river 50 Wanganui2025 Waikato upgrade Hydro, peaking 150 Whakamaru2025 Hurleyville Wind 100 Hawera2026 Arnold Hydro, run of river 46 Dobson384<strong>2012</strong> <strong>Annual</strong> <strong>Planning</strong> <strong>Report</strong> © <strong>Transpower</strong> New Zealand Limited <strong>2012</strong>. All rights reserved.
MWAppendix G Generation ScenariosYear Plant description Technology description CapacityMW2026 Demand side response 12 NI Price-responsive loadcurtailmentSubstation(approx)50 Mt Roskill2027 Biomass Cogen, Whirinaki Cogeneration, biomass-fired 63 Whirinaki2027 Generic run of river 2 Hydro, run of river 50 Inangahua2027 Gas fired OCGT 5 Peaker, fast start gas-firedpeaker2027 Demand side response 13 NI Price-responsive loadcurtailment100 Otahuhu50 Central ParkG.3 Scenario 3: Medium RenewablesThe key features of the Medium Renewables scenario are:Gas prices are lower than in the previous two scenarios, though the volumeavailable is still limited. Carbon prices are moderate.The NZAS aluminium smelter is progressively phased out between 2022 and2027. No new generation build is required over the phase-out period.Baseload thermal generation is considerably reduced, with two out of four Huntlycoal-fired units, Taranaki CC and Southdown decommissioned. However, anefficient new coal-fired power station is constructed in 2022.There is moderate geothermal and wind development, mainly in the North Island.By 2020, geothermal and wind capacity each exceed 1,400 MW. There is littlenew hydro generation.Over 1,400 MW of thermal peakers are available by 2022. The demand sidecontributes relatively little, with interruptible load and price-responsive demandincreasing by just 150 MW over the same period.12000Installed capacity by technology - Medium renewables (mds3)100008000600040002000WindCogeneration, otherOpen cycle gas turbine - gasInterruptible loadHydro, schedulableHydro, run of riverHydro, peakingHydro, pumped storageGeothermalPeaker, fast start gas-fired peakerCogeneration, gas-firedPeaker, diesel-fired OCGTPrice-responsive load curtailmentCoalCombined cycle gas turbineCogeneration, biomass-fired0<strong>2012</strong> 2014 2016 2018 2020 2022 2024 2026Year<strong>2012</strong> <strong>Annual</strong> <strong>Planning</strong> <strong>Report</strong> © <strong>Transpower</strong> New Zealand Limited <strong>2012</strong>. All rights reserved. 385
Appendix G: Generation ScenariosProjects and commission dates – Medium Renewables scenarioYear Plant description TechnologydescriptionCapacityMWSubstation(approx)2013 Wairakei Geothermal 0 (Decomm.)Wairakei2013 Kawerau Norske Skog Geothermal 25 Kawerau2013 Te Mihi Geothermal 165 Wairakei2013 Waitara McKee peaker Peaker, fast start gasfiredpeaker100 Motunui Deviation2014 Ngatamariki Geothermal 82 Nga Awa Purua2015 Mahinerangi stage 2 Wind 170 Halfway Bush2015 Mill Creek Wind 60 Wilton2016 Generic geo 2 Geothermal 100 Ohaaki2016 Mohikinui Hydro, run of river 85 Inangahua2016 Maungaharuru Wind 94 Whirinaki2017 Huntly coal unit 1 Coal 0 (Decomm.) Huntly2017 Tauhara stage 2 Geothermal 200 Wairakei2017 Hawea Control Gate Retrofit Hydro, peaking 17 Cromwell2017 Demand side response 1 NI Price-responsive loadcurtailment2017 Demand side response 1 SI Price-responsive loadcurtailment50 Takapuna50 Bromley2017 Central Wind Wind 120 Rangipo2018 Generic geo 1 Geothermal 100 Kawerau2018 New IL 1 Interruptible load 50 Penrose2019 Southdown Combined cycle gasturbine0 (Decomm.)Southdown2019 Generic geo 3 Geothermal 100 Wairakei2019 Generic geo 5 Geothermal 100 Rotorua2019 Diesel fired OCGT 16 Peaker, diesel-firedOCGT40 New Plymouth2019 Puketoi Wind 175 Linton2020 Taranaki CC Combined cycle gasturbine2020 Diesel fired OCGT 18 Peaker, diesel-firedOCGT2020 Gas fired OCGT 6 Peaker, fast start gasfiredpeaker2020 Gas fired OCGT 12 Peaker, fast start gasfiredpeaker0 (Decomm.)Stratford100 New Plymouth160 Otahuhu160 Stratford2020 Turitea Wind 180 Linton2021 Huntly coal unit 2 Coal 0 (Decomm.) Huntly2021 Generic run of river 4 Hydro, run of river 50 Hokitika2021 Diesel fired OCGT 12 Peaker, diesel-firedOCGT2021 Gas fired OCGT 3 Peaker, fast start gasfiredpeaker2021 Gas fired OCGT 9 Peaker, fast start gasfiredpeaker100 Kaitemako160 Southdown160 Huntly2022 Marsden Coal Coal 320 Marsden386<strong>2012</strong> <strong>Annual</strong> <strong>Planning</strong> <strong>Report</strong> © <strong>Transpower</strong> New Zealand Limited <strong>2012</strong>. All rights reserved.
MWAppendix G Generation ScenariosG.4 Scenario 4: Coal12000The key features of the Coal scenario are:Gas prices are lower than in the Sustainable Path and South Island Windscenarios, though the volume available is still limited. This is the scenario withthe lowest carbon prices.Most existing baseload thermal generation remains online. Taranaki CC isdecommissioned, and one coal-fired Huntly unit follows in 2025.An efficient new coal-fired power station is commissioned in 2022; a second,burning Southland lignite, in 2025.There is also some renewable development. Geothermal capacity climbs to1,400 MW, and 250 MW of new hydro and 250 MW of wind are added.The output of existing hydro generation is curtailed due to difficulties in obtainingwater rights.Over 1,000 MW of thermal peakers are available by 2027 (less than in the morerenewable scenarios). Interruptible load and price-responsive demand increaseby 400 MW over the same period.Installed capacity by technology - Coal (mds4)10000800060004000WindCogeneration, otherOpen cycle gas turbine - gasLigniteInterruptible loadHydro, schedulableHydro, peakingGeothermalPeaker, fast start gas-fired peakerCogeneration, gas-firedPeaker, diesel-fired OCGTPrice-responsive load curtailmentCoalCombined cycle gas turbineCogeneration, biomass-fired20000<strong>2012</strong> 2014 2016 2018 2020 2022 2024 2026YearProjects and commission dates – Coal scenarioYear Plant description Technology description CapacityMWSubstation(approx)2013 Wairakei Geothermal 0 (Decomm.)Wairakei2013 Kawerau Norske Skog Geothermal 25 Kawerau2013 Te Mihi Geothermal 165 Wairakei2013 Waitara McKee peaker Peaker, fast start gas-firedpeaker100 MotunuiDeviation2014 Ngatamariki Geothermal 82 Nga Awa Purua<strong>2012</strong> <strong>Annual</strong> <strong>Planning</strong> <strong>Report</strong> © <strong>Transpower</strong> New Zealand Limited <strong>2012</strong>. All rights reserved. 387
Appendix G: Generation ScenariosYear Plant description Technology description CapacityMWSubstation(approx)2016 Generic geo 5 Geothermal 100 Rotorua2016 Demand side response 1 NI Price-responsive loadcurtailment50 Takapuna2017 New IL 1 Interruptible load 50 Penrose2017 Demand side response 2 NI Price-responsive loadcurtailment2017 Demand side response 1 SI Price-responsive loadcurtailment2018 Demand side response 3 NI Price-responsive loadcurtailment2018 Demand side response 2 SI Price-responsive loadcurtailment50 Mangere50 Bromley50 Central Park50 Islington2018 Kaiwera Downs Wind 240 NorthMakarewa2019 Generic geo 1 Geothermal 100 Kawerau2019 Generic geo 4 Geothermal 100 Whakamaru2020 Taranaki CC Combined cycle gas turbine 0 (Decomm.)Stratford2020 Tauhara stage 2 Geothermal 200 Wairakei2020 Generic geo 3 Geothermal 100 Wairakei2020 North Bank Tunnel Hydro, peaking 280 Waitaki2020 Gas fired OCGT 12 Peaker, fast start gas-firedpeaker160 Stratford2021 New IL 2 Interruptible load 50 Mt Roskill2022 Generic coal 1 Glenbrook Coal 400 Glenbrook2024 Gas fired OCGT 6 Peaker, fast start gas-firedpeaker160 Otahuhu2025 Huntly coal unit 1 Coal 0 (Decomm.)Huntly2025 Generic lignite 1 Southland Lignite 400 NorthMakarewa2025 Demand side response 12 NI Price-responsive loadcurtailment2026 Gas fired OCGT 9 Peaker, fast start gas-firedpeaker50 Mt Roskill160 HuntlyG.5 Scenario 5: High Gas DiscoveryThe key features of the High Gas Discovery scenario are:Substantial volumes of natural gas are available at affordable prices. Carbonprices are moderate.All four coal-fired Huntly units are decommissioned by 2020. However, existinggas-fired generators remain online.Efficient new CCGTs are constructed - a 200 MW plant in Taranaki in 2015, a240 MW plant in Northland in 2017, and 400 MW plants in Auckland in 2020 and2025.New gas-fired peakers are added, with thermal peaking capacity reaching 1,100MW by 2027. There is also new gas-fired cogeneration.There is also some renewable development. Geothermal capacity climbs to1,200 MW, and 650 MW of new wind is added. There is little new hydrogeneration.388<strong>2012</strong> <strong>Annual</strong> <strong>Planning</strong> <strong>Report</strong> © <strong>Transpower</strong> New Zealand Limited <strong>2012</strong>. All rights reserved.
MWAppendix G Generation ScenariosInterruptible load and price-responsive demand increase by 200 MW (rather lessthan in the 2010 SOO, and hence the last APR).Installed capacity by technology - High gas discovery (mds5)1200010000800060004000WindCogeneration, otherOpen cycle gas turbine - gasInterruptible loadHydro, schedulableHydro, run of riverHydro, peakingGeothermalPeaker, fast start gas-fired peakerCogeneration, gas-firedPeaker, diesel-fired OCGTPrice-responsive load curtailmentCoalCombined cycle gas turbineCogeneration, biomass-fired20000<strong>2012</strong> 2014 2016 2018 2020 2022 2024 2026YearProjects and commission dates – High Gas Discovery scenarioYear Plant description Technology description CapacityMWSubstation(approx)2013 Huntly coal unit 1 Coal 0 (Decomm.)Huntly2013 Wairakei Geothermal 0 (Decomm.)Wairakei2013 Kawerau Norske Skog Geothermal 25 Kawerau2013 Te Mihi Geothermal 165 Wairakei2013 Remaining part of Wairakei Geothermal 110 Wairakei2013 Waitara McKee peaker Peaker, fast start gas-firedpeaker100 MotunuiDeviation2014 Ngatamariki Geothermal 82 Nga Awa Purua2015 Huntly coal unit 2 Coal 0 (Decomm.)Huntly2015 Todd CCGT Combined cycle gas turbine 200 Stratford2015 Arnold Hydro, run of river 46 Dobson2015 Demand side response 1 NI Price-responsive loadcurtailment2015 Demand side response 1 SI Price-responsive loadcurtailment50 Takapuna50 Bromley2016 Taranaki Cogen Cogeneration, gas-fired 50 Stratford2016 Generic geo 3 Geothermal 100 Wairakei2016 New IL 1 Interruptible load 50 Penrose2017 Rodney CCGT stage 1 Combined cycle gas turbine 240 Huapai2018 Huntly coal unit 3 Coal 0 (Decomm.)Huntly<strong>2012</strong> <strong>Annual</strong> <strong>Planning</strong> <strong>Report</strong> © <strong>Transpower</strong> New Zealand Limited <strong>2012</strong>. All rights reserved. 389
MWAppendix G: Generation ScenariosYear Plant description Technology description CapacityMWSubstation(approx)2018 Wairau Hydro, run of river 73 Blenheim2018 Diesel fired OCGT 19 Peaker, diesel-fired OCGT 40 Gracefield2018 Gas fired OCGT 9 Peaker, fast start gas-firedpeaker2018 Gas fired OCGT 12 Peaker, fast start gas-firedpeaker2018 Demand side response 2 SI Price-responsive loadcurtailment160 Huntly160 Stratford50 Islington2020 Huntly coal unit 4 Coal 0 (Decomm.)Huntly2020 Generic gas 1 Auckland Combined cycle gas turbine 410 Otahuhu2020 Generic geo 2 Geothermal 100 Ohaaki2021 Diesel fired OCGT 13 Peaker, diesel-fired OCGT 40 Whirinaki2022 Generic geo 1 Geothermal 100 Kawerau2022 Kaituna Hydro, run of river 15 Tarukenga2023 Gas fired OCGT 3 Peaker, fast start gas-firedpeaker160 Southdown2023 Hauauru ma raki 1 Wind 250 Huntly2023 Generic wind Wellington Wind 80 Takapu Rd2024 Mahinerangi stage 2 Wind 170 Halfway Bush2024 Slopedown Wind 150 Gore2025 Otahuhu C Combined cycle gas turbine 407 Otahuhu2027 Gas fired OCGT 6 Peaker, fast start gas-firedpeaker160 OtahuhuG.6 Plots of installed capacity for major generation technologies160014001200Sustainable path (mds1)SI w ind (mds2)Medium renew ables (mds3)Coal (mds4)High gas discovery (mds5)Installed capacity of coal and lignite10008006004002000<strong>2012</strong> 2014 2016 2018 2020 2022 2024 2026Year390<strong>2012</strong> <strong>Annual</strong> <strong>Planning</strong> <strong>Report</strong> © <strong>Transpower</strong> New Zealand Limited <strong>2012</strong>. All rights reserved.
MWMWMWAppendix G Generation ScenariosInstalled capacity of gas2500Sustainable path (mds1)SI w ind (mds2)Medium renew ables (mds3)Coal (mds4)High gas discovery (mds5)200015001000500<strong>2012</strong> 2014 2016 2018 2020 2022 2024 2026Year1600150014001300Sustainable path (mds1)SI w ind (mds2)Medium renew ables (mds3)Coal (mds4)High gas discovery (mds5)Installed capacity of geothermal120011001000900800700<strong>2012</strong> 2014 2016 2018 2020 2022 2024 2026YearInstalled capacity of hydro6200Sustainable path (mds1)SI w ind (mds2)Medium renew ables (mds3)Coal (mds4)High gas discovery (mds5)60005800560054005200<strong>2012</strong> 2014 2016 2018 2020 2022 2024 2026Year<strong>2012</strong> <strong>Annual</strong> <strong>Planning</strong> <strong>Report</strong> © <strong>Transpower</strong> New Zealand Limited <strong>2012</strong>. All rights reserved. 391
MWMWMWAppendix G: Generation ScenariosInstalled capacity of interruptible load and price-responsive load curtailment600Sustainable path (mds1)SI w ind (mds2)Medium renew ables (mds3)Coal (mds4)High gas discovery (mds5)500400300200100<strong>2012</strong> 2014 2016 2018 2020 2022 2024 2026YearInstalled capacity of thermal peakers1400Sustainable path (mds1)SI w ind (mds2)Medium renew ables (mds3)Coal (mds4)High gas discovery (mds5)12001000800600400<strong>2012</strong> 2014 2016 2018 2020 2022 2024 2026YearInstalled capacity of wind3000Sustainable path (mds1)SI w ind (mds2)Medium renew ables (mds3)Coal (mds4)High gas discovery (mds5)2500200015001000500<strong>2012</strong> 2014 2016 2018 2020 2022 2024 2026Year392<strong>2012</strong> <strong>Annual</strong> <strong>Planning</strong> <strong>Report</strong> © <strong>Transpower</strong> New Zealand Limited <strong>2012</strong>. All rights reserved.
Appendix H: Project NamingAppendix H<strong>Transpower</strong> Project Naming<strong>Transpower</strong> assigns a unique project reference to each project. This is to assistinternally and externally in ensuring unambiguous project references between<strong>Transpower</strong> and its customers, industry, the Electricity Authority and the wider NewZealand public.All projects are named according to the following convention:LocationIdentifier-AssetCategory-TypeOfWork-UniqueIDLocation + Asset Category + Work Type + Unique IDRegion Site ParentAKLDWAKTBOPEWGTNCHCHetcorExistingStationcodes: +GRDPAOPTRorLine code:ADD_ISLARI_EDGMTI_WKMetcorNIGUNAANSIGUAssetCategories:POW_TFRTRANREA_SUPSUBESTBUSCBUS_PTNC_BANKSPOW_TFR_DISPOW_TFR_PTNBUSZ_PTNWork Types:DEVEHMTREPLUnique ID:010203...H.1 Location IdentifierThe first block of letters is the location identifier, which can be one of three types:regionsite, ormajor project parent.The region/site codes are largely based on <strong>Transpower</strong>’s existing site/line specificabbreviations (e.g. OTA for Otahuhu). Where new sites are contemplated, a newabbreviation will be formed (e.g. GRD for Geraldine).Unique codes of four characters will be made for regions or cities where a project isnot sufficiently well defined in location to use a site/line abbreviation (for example,AKLD for Auckland, CHCH for Christchurch).Unique four character codes will also be used for parent projects (e.g. large umbrellaprojects encompassing a number of individual projects). Examples used in the APRinclude:<strong>2012</strong> <strong>Annual</strong> <strong>Planning</strong> <strong>Report</strong> © <strong>Transpower</strong> New Zealand Limited <strong>2012</strong>. All rights reserved. 393
Appendix H: Project NamingNIGU – North Island Grid UpgradeNAAN – North Auckland and NorthlandHVDC – HVDCUPNI – Upper North IslandH.2 Asset CategoryCodes for the asset category are to be based on <strong>Transpower</strong>’s internal codingpractices. These include:C_BANKS – Capacitor banksSYN_COND – Synchronous CondenserTRAN – TransmissionREA_PWRC – Reactive Power ControllerREA_PWRS – Reactive Power SupportBUSG – BussingPOW_TFR – Power TransformerSUBEST – Substation EstablishmentH.3 Work TypeCodes for the work type also reflect <strong>Transpower</strong>’s internal coding. Examples include:DEV – DevelopmentEHMT – EnhancementREPL – ReplacementH.4 Unique IDFinally, a unique numeric identifier is added at the end of the code sequence todistinguish projects for which all other parts of the name are identical. This can occurin particular over a ten year forecast period.394<strong>2012</strong> <strong>Annual</strong> <strong>Planning</strong> <strong>Report</strong> © <strong>Transpower</strong> New Zealand Limited <strong>2012</strong>. All rights reserved.
Appendix I: GlossaryAppendix IGlossaryTermAfter DiversityMaximum Demandautomatic underfrequency loadsheddingavailabilitybay (of a station)breaker-and-a-halfstationbusbus coupler circuitbreakerbus sectioncablecapacitor bankcharging current (line)circuit (transmission)(cct)circuit-breakerco-generationcommissionedcommitted projectsconstraintcontingencycontingent eventDescriptionThe peak consumption of energy (averaged over a half-hour period and expressed inWatts) that incorporates the non-simultaneous nature of each point of supply’s load peaktime.The automatic disconnection of customers for severe or prolonged under frequency.Implemented on relays installed within the distribution network or at <strong>Transpower</strong>’ssubstations, customers are tripped in two, nominally, 20% groups.The number of hours per year the network or part thereof is in service. Unavailability isthe opposite of availability (for example, the hours per year the network or part thereof isnot providing service).That part of a substation or power station where a given circuit’s switchgear is located.According to the type of circuit, a substation or power station may include: feeder bays,transformer bays, bus coupler bays, etc.A double-bus substation where, for two circuits, three circuit-breakers are connected inseries between the two buses, the circuits being connected on each side of the centralcircuit-breaker.The common primary conductor of power from a power source to two or more separatecircuits.A circuit-breaker located between two busbars that can both be accessed by the sameexternal circuit. The bus coupler circuit-breaker permits the busbars to be connectedtogether or separated under load or fault conditions.Part of a bus that can be isolated from another part of the same bus.One or more insulated conductors forming a transmission circuit above or below ground.A number of capacitors connected together in series and/or parallel to form the requisitecapacitance and voltage rating for reactive compensation and harmonic filters on theHVAC and HVDC power systems.The current taken by a transmission circuit to energise its conductors due to thecapacitive effect of the circuit.A set of conductors (normally three) plus associated hardware and insulation on atransmission line, which together form a single electrical connection between two or morestations and which, when faulted, is removed automatically from the system (by circuitbreakers)as a single entity.A switching device, capable of making, carrying and breaking currents under normalcircuit conditions and also making, carrying for a specified time and breaking currentsunder specified abnormal conditions, such as those of short circuit.The use of high-pressure steam from a turbo-generator set for an industrial process. Theproduction of electricity is usually secondary to the requirements of the industrial process.The operational state of equipment that has undergone the commissioning process and isbrought under the operational control of a service centre/controller.Refers to actual proposed projects that satisfy a number of criteria indicating that they areextremely likely to proceed in the near future. For example:land has been acquired for construction of the projectplanning consents, construction approvals and licences have been obtainedconstruction has begun, or a firm commencement date has been setcontracts for supply and construction have been finalised, andfinancing arrangements are largely complete.A local limitation in the transmission capacity of the grid required to maintain grid securityor power quality.The uncertainty of an event occurring, and the planning to cover for this. For example, asingle contingency could be:a. in relation to transmission, the unplanned tripping of a single item of equipment, orb. in relation to a fall in frequency, the loss of the largest single block of generation inservice, or the loss of one HVDC pole.Those events for which, in the reasonable opinion of the system operator, resources canbe economically provided to maintain the security of the grid and power quality without the<strong>2012</strong> <strong>Annual</strong> <strong>Planning</strong> <strong>Report</strong> © <strong>Transpower</strong> New Zealand Limited <strong>2012</strong>. All rights reserved. 395
Appendix I: GlossaryTermcontinuous ratingdecommissioneddemanddemand-sidemanagementdisconnectorDescriptionshedding of demand.The maximum rating to which equipment can be operated continuously.The status of equipment which is permanently disconnected from the power system,made permanently inoperable, and free of any operational identification.A measure of the rate of consumption of electrical energy.Initiatives or mechanisms used to control electricity demand. Examples include ripplecontrols on water heating or contracted shedding of load (demand).A switch that, when in the open position, provides an isolating distance in accordance withspecified requirements.dispatch The process of :distribution (ofelectricity)a. pre-dispatch scheduling to allocate active and reactive power generation, includingadditional ancillary services and reserve, to match expected demand, within thelimitations of the grid and equipmentb. rescheduling to meet forecast demand, andc. issuing instructions based on the schedule and the real-time conditions to manageresources to meet the actual demand.The transfer of electricity between the transmission network and end users through a localnetwork.distribution linedouble circuit lineduplicate protectionelectricity distributorElectricityGovernanceRegulationsElectricityGovernance Rulesembedded generatorsend usereventfeederfirm capacityforced outagefrequency (power)frequency excursiongas turbine (GT)generating setAn electric line that is part of a local network.A transmission line carrying two circuits.A protection scheme for a plant item such that any fault on the plant item can be clearedby two independent sets of relays, either of which is able to operate correctly even if theother fails completely.An asset owner whose assets are predominantly for the distribution of electricity tocustomers.The Electricity Governance Regulations 2003 and all amendments and codes of practicefollowing therefrom.The rules made pursuant to the Electricity Governance Regulations 2003.Embedded generators are smaller power plants connected to a regional electricity linebusiness’s distribution network (as opposed to the high voltage transmission network).An entity connected to the power system for the primary purpose of consuming electricity.A term identifying undesired or untoward operational happenings, principally:a. accidents (resulting in loss)b. near-misses (which, under slightly different circumstances, could have caused loss)to people, process, equipment, material or the environmentc. a disturbance to the power systemd. a significant change in the state of the gride. equipment defects, andf. fire or intruder alarm operation.A circuit that provides a direct connection to a customer.Power capacity intended to be available at all times during the period covered by aguaranteed commitment to deliver, even under adverse conditions.The automatic or urgent removal from service of an item of equipment.The rate of cyclic change in value of current and voltage, quantified by the internationalstandard term ’Hertz‘ (Hz).A variation of the power system frequency above 50.25 Hz or below 49.75 Hz.A heat engine that uses the energy of expanding gases passing through a multi-stageturbine to create rotational power.A group of rotating machines transforming mechanical or thermal energy into electricity.Note: For the purposes of the operating codes and the output ratings referred to, the set istaken to include the limitations of the energy source, turbine, generator, cable, settransformer and switchgear. [GOSP glossary - IEC 50 (602-02-01)]generationThe electrical energy produced by a generator, a generating station or within a powersystem as a whole.396<strong>2012</strong> <strong>Annual</strong> <strong>Planning</strong> <strong>Report</strong> © <strong>Transpower</strong> New Zealand Limited <strong>2012</strong>. All rights reserved.
Appendix I: GlossaryTermgeneratorgridgrid asset ownergrid assetsgrid exit point (GXP)grid injection pointHVACHVDCin serviceinstantaneous loadintertripislanded operationlife expectancyline [overhead]load controlload sheddingmain protectionmanual load sheddingmaximum continuousrating (MCR)maximum demandMegaVoltAmpere(MVA)n-1, “n”nominal ratingDescriptionThe process of producing electricity.A person who owns and/or manages one or more generating sets that are physicallyconnected to the grid assets or to a network or to other assets connected to the gridassets.That part of the New Zealand electricity transmission system, the operation of which isundertaken by the grid operator.<strong>Transpower</strong> New Zealand Limited.At any time, the plant, transmission lines and other facilities, owned or managed by thegrid asset owner, and which are used to interconnect all the points of connection forconnected parties.A point of connection where electricity may flow out of the grid.A point of connection where electricity may flow into the grid.High voltage alternating current.High voltage direct current.The state of equipment that is connected to a source of energy or may be connected to asource of energy by an operating action.The maximum instantaneous current drawn. It consists of continuous, non-continuous andmomentary currents.A protection signalling system whereby a signal initiated at one station trips a circuitbreakerat another station.The condition that arises when a section of the power system is disconnected from andoperating independently of the remainder of the power system.The date where replacement/major refurbishment is necessary.A series of structures carrying overhead one or more transmission circuits.Types of load control include:automatic under frequency load shedding (see MW reserve of a power system)interruptible load (see MW reserve of a power system), andmanual load shedding (see manual load shedding).The forced disconnection of load, in stages. This is either manual (see load control) orautomatic (see MW reserve [of a power system]).Protection equipment (or a system) expected to have priority in initiating either a faultclearance or an action to terminate an abnormal condition in the power system.The forced disconnection of load by an operator/controller.The value assigned to an equipment parameter by the manufacturer, and at which theequipment may be operated for an unlimited period without damage.The peak consumption of energy (averaged over a half-hour period and expressed inwatts) recorded during a given time, for example, a day, week, or year.1000 kVA. The flow of active power is measured in megaWatts (MW). Whencompounded with the flow of reactive power, which is measured in Mvar, the resultant ismeasured in MegaVoltAmperes (MVA).Refers to the planning standard that <strong>Transpower</strong> generally plans the grid to.The n-1 security level provides supply security to the connected loads under a singlecredible contingency with all the assets that can reasonably be expected in service. Thesingle credible contingencies that are defined in the Rules are:a single transmission circuit interruptionthe failure or removal from operational service of a single generating unitan HVDC link single pole interruptionthe failure or removal from service of a single bus sectiona single interconnecting transformer interruption, andthe failure or removal from service of a single shunt connected reactive component.An ‘’n” security standard means that any outage will trip load. It is often found in smallersupply areas, where just one transmission circuit or supply transformer provides supply.The design rating of the equipment or transmission circuit. For equipment, this is oftenreferred to as the 'nameplate rating'.<strong>2012</strong> <strong>Annual</strong> <strong>Planning</strong> <strong>Report</strong> © <strong>Transpower</strong> New Zealand Limited <strong>2012</strong>. All rights reserved. 397
Appendix I: GlossaryTermnominal systemfrequencynon-continuous loadnormal systemconditionson-load tap-changer(OLTC)outageoverhead lineoverloadpeak demandpeak loadplanned outagepower factorpower flow analysispower systemstabilitypower transformerprotectionreactive powerrelayreliabilityresource consentreturn periodrunback schemesecurityshort circuit ratingshort term ratingsingle-circuit linespur circuitstability limitDescription50 Hertz.A load that is energised for a portion of the duty cycle greater than one minute. It may befor a set period, and removal may be automatic or by operator action or it may continue tothe end of the duty cycle.The state of the power system when it is operating in accordance with statutoryrequirements as regards quality of supply and within basic design and operationalparameters.Equipment fitted to a power transformer by which the voltage ratio between the windingscan be varied while the transformer is on-load.The state of an item of equipment when it is not available to perform its intended function.An outage may or may not cause an interruption of supply to customers.A transmission line.A load greater than the maximum continuous rating.See maximum demand.The maximum peak load (in amps) that can be expected to be carried within a twelvemonth period on the circuit or by the equipment/component.A deliberate outage scheduled for maintenance purposes.The ratio between active power (expressed in watts, W) and true power (expressed involt-amperes, VA). Can vary between 1 and 0. A load with a low power factor uses morereactive current than a load with a high power factor for the same amount of useful powertransferred.Simulation of the actual power system using computer models, so as to analyse theeffects of changes to inputs (like demand, supply, and asset ratings), and identifyconstraints or other issues that might affect security of supply to a region.The capability of a power system to regain a steady state, characterised by thesynchronous operation of the generators after a disturbance due, for example, to variationof power or impedance.A transformer that primarily changes voltage and current for the efficient conveyance ofelectricity over the circuits connected to it.The equipment provided for detecting abnormal conditions in a power system and theninitiating fault clearance or actuating signals or indications.Energy that flows in the power system between alternators, capacitors, SVCs, etc., andinductive and capacitive equipment such as transmission lines and low power factorloads. It is the product of the voltage and out-of-phase components of the alternatingcurrent and is measured in vars.A device designed to produce predetermined changes in one or more electrical outputcircuits, when certain conditions are fulfilled in the electrical input circuits controlling thedevice.The failure rate. For example, the number of failures per year based on experience over along time period, say 10 years or more.A consent to use land, air or water granted by the local government under the ResourceManagement Act. The consent usually imposes limits on that use.The statistical return period of a weather-related event, load or load effect.An automatic limit on generation or HVDC transfer, which typically would be enabledwhen there is loss of a particular circuit, transformer, signalling or control system.A term used to describe the ability or capacity of a network to provide service after one ormore equipment failures. It can be defined by deterministic planning criteria such as (n),(n-1), (n-2) security contingency. A security contingency of (n-m) at a particular location inthe network means that ‘m’ component failures can be tolerated without loss of service.The three second fault rating of equipment.The maximum rating to which equipment can be operated for a specified duration.A transmission line carrying one circuit.A circuit connected to the transmission system at only one point.The critical value of a given system state variable that cannot be exceeded withoutendangering power system stability.398<strong>2012</strong> <strong>Annual</strong> <strong>Planning</strong> <strong>Report</strong> © <strong>Transpower</strong> New Zealand Limited <strong>2012</strong>. All rights reserved.
Appendix I: GlossaryTermsteady state stabilitysubstationswitchgearswitchgear groupswitching stationsynchronouscondensersystem frequencysystem normalsystem operatortee (or T) pointtee-offthermalconstraints/limits/capacitiesthermal upgradetransformertransient (in)stabilitytransmissiontransmission circuittransmission linetransmission systemvoltagevoltage collapsevoltage (in)stabilityDescriptionFor a power system without a fault, this concept is related to the steady state stability ofthe system.A power system stability in which disturbances have only small rates of change and smallrelative magnitudes.A building, structure or enclosure incorporating equipment used principally for the controlof the transmission or distribution of electricity.A collective term for switches of all types and their associated equipment, includingcircuit-breakers, disconnectors, and earthing switches.A circuit-breaker and related disconnectors. The relationship is determined by switchgearnumbering.A station existing solely for the purpose of transmission rather than supply.A synchronous machine running without mechanical load and supplying or absorbingreactive power to regulate local voltage.At any instant the value of the frequency of the power in the North Island or South Island.See also Hertz, nominal system frequency, and frequency.The power system is operating in the normal state when:generation meets the demand at 50Hz (±0.2 Hz)voltage requirements are metgrid equipment is operated within design ratings, andreserve margins and the power system configuration provide an adequate level ofoperational security.The person responsible from time to time for the operation of the grid system. The systemoperator is <strong>Transpower</strong> New Zealand Limited.The point at which a branch transmission circuit is solidly and permanently connected to amain circuit, usually without switchgear. See also tee-off.A branch transmission circuit joining a main circuit and that is protected as part of themain circuit.Refers to the temperature ratings of the assets (lines, generators, transformers)connected to the power system, beyond which the assets cannot securely be operated.The increase in temperature ratings of assets to provide more capacity.A static electric device consisting of a winding or two or more coupled windings whichtransfer power by electromagnetic induction between circuits of the same frequency,usually with changed values of voltage and current.Refers to the response of the power system when it experiences a large disturbance likea line fault or outage of a generator.The conveying of bulk electricity from power stations to points of supply (compared withdistribution).An electrical circuit the primary purpose of which is the transmission of electricity from onegeographical location to another.A series of structures carrying one or more transmission circuits overhead.That part of the power system primarily intended for the conveyance of bulk electricity.The nominal potential difference between conductors or the nominal potential differencebetween a conductor and earth, whichever is applicable.A sudden and large decrease in the voltage of the electrical system.Refers to the power system’s ability to maintain a satisfactory voltage at all buses for anydisturbance, such as a variation in load or an outage of plant.<strong>2012</strong> <strong>Annual</strong> <strong>Planning</strong> <strong>Report</strong> © <strong>Transpower</strong> New Zealand Limited <strong>2012</strong>. All rights reserved. 399
Appendix J: Grid Exit and Injection PointsAppendix JGrid Exit and Injection PointsTable J-1: North Island Grid Exit and Injection PointsNorth IslandNorth Isthmus Auckland Waikato Bay of Plenty Central North Island Taranaki Hawkes Bay WellingtonAlbany GXP Bombay GXP Cambridge GXP Edgecumbe GXP Bunnythorpe GXP Brunswick GXP Fernhill GXP Central Park GXPBream Bay GXP Glenbrook GXP Hamilton GXP Kaitimako GXP Dannevirke GXP Carrington St GXP Gisborne GXP Gracefield GXPDargaville GXP Hobson Street GXP Hangatiki GXP Kinleith GXP Linton GXP Hawera GXP Redclyffe GXP Greytown GXPHenderson GXP Mangere GXP Hinuera GXP Lichfield GXP Mangamaire GXP Huirangi GXP TokomaruBayGXP Haywards GXPHepburn Road GXP Meremere GXP Kopu GXP Mt Maunganui GXP Marton GXP Motunui GXP Wairoa GXP Kaiwharawhara GXPHuapai GXP Mount Roskill GXP Piako GXP Owhata GXP Mataroa GXP Opunake GXP Whakatu GXP Masterton GXPKensington GXP Pakuranga GXP Putaruru GXP Rotorua GXP National Park GXP Taumarunui GXP Tuai GIP Melling GXPMaungatapere GXP Penrose GXP Te Awamutu GXP Tarukenga GXP Ohakune GXP Wanganui GXP Whirinaki GIP Paraparaumu GXPMaungaturoto GXP Takanini GXP Te Kowhai GXP Tauranga GXP Ongarue GXP Waverley GXP Pauatahanui GXPSilverdale GXP Wiri GXP Waihou GXP Te Kaha GXP Tangiwai GXP Kapuni GIP Takapu Rd GXPWellsford GXP Otahuhu GIP/GXPMarsden GIP Southdown GIP Huntly GIP/GXPWaikino GXP Te Matai GXP Waipawa GXP NewPlymouthWaiotahi GXP Woodville GXP/GIPDrury SWI Arapuni GIP Kawerau GIP/GXPAtiamuri GIP Matahina GIP Mangahao GIPKarapiro GIP Nga AwaPuruaGIP Upper Hutt GXPStratford GIP Wilton GXPAratiatia GIP West Wind GIPGIPMaraetai GIP Ohaaki GIPMokai GIP Poihipi GIPOhakuri GIP Rangipo GIP400<strong>2012</strong> <strong>Annual</strong> <strong>Planning</strong> <strong>Report</strong> © <strong>Transpower</strong> New Zealand Limited <strong>2012</strong>. All rights reserved.
Appendix J: Grid Exit and Injection PointsNorth IslandNorth Isthmus Auckland Waikato Bay of Plenty Central North Island Taranaki Hawkes Bay WellingtonWaipapa GIP Tararua GIPWhakamaru GIP Tokaanu GIPOhinewai SWI Wairakei GIPTable J-2: South Island Grid Exit and Injection PointsSouth IslandNelson/Marlborough West Coast Canterbury South Canterbury Otago/SouthlandArgyle GXP Arthurs Pass GXP Addington GXP Albury GXP Balclutha GXPBlenheim GXP Atarau GXP Ashburton GXP Bells Pond GXP Brydone GXPMotueka GXP Castle Hill GXP Ashley GXP Black Point GXP Cromwell GXPMotupipi GXP Dobson GXP Bromley GXP Oamaru GXP Edendale GXPStoke GXP Greymouth GXP Culverden GXP Studholme GXP Frankton GXPCobb GIP Hokitika GXP Hororata GXP Temuka GXP Gore GXPUpper Takaka SWI Kikiwa GXP Islington GXP Timaru GXP Halfway Bush GXPMurchison GXP Kaiapoi GXP Twizel GXP Invercargill GXPOtira GXP Middleton GXP Aviemore GIP Naseby GXPReefton GXP Southbrook GXP Benmore GIP NorthMakarewaOrowaiti(Robertson Rd)GXPGXP Springston GXP Ohau A GIP Palmerston GXPWestport GXP Waipara GXP Ohau B GIP SouthDunedinGXPKumara GIP Coleridge GIP Ohau C GIP Tiwai GXPInangahua SWI Tekapo A GIP Berwick GIP<strong>2012</strong> <strong>Annual</strong> <strong>Planning</strong> <strong>Report</strong> © <strong>Transpower</strong> New Zealand Limited <strong>2012</strong>. All rights reserved. 401
Appendix J: Grid Exit and Injection PointsSouth IslandNelson/Marlborough West Coast Canterbury South Canterbury Otago/SouthlandWaimangaroa SWI Tekapo B GIP Clyde GIPWaitaki GIP Manapouri GIPLivingstone SWI Roxburgh GIPThree MileHillSWIGXP – Grid Exit PointGIP– Grid Injection PointSWI – Switching Station402<strong>2012</strong> <strong>Annual</strong> <strong>Planning</strong> <strong>Report</strong> © <strong>Transpower</strong> New Zealand Limited <strong>2012</strong>. All rights reserved.