This time, we will study the basics of support/resistance levels trading and find out, whether this strategy is close to "exchange grail".
Only a lazy trader, after a couple of months of trading, doesn’t come across the notion of support/resistance levels in relation to the price action. On the Internet, there are numerous ads of levels trading strategies, “profitable levels trading”, “trade levels as a professional”, “super profitable strategy of levels trading”, and so on.
It’s the same on forums, it is fashionable to criticize different technical analysis indicators/chart patterns and praise the analysis of levels in an empty chart. Those who trade without indicators, look down on the traders, using them, because they “haven’t understood yet” and so, are far from a professional approach to trading. But there is a mistake, which will be further described.
Based on my own experience of using horizontal levels in trading, I can disappoint those who think this analyzing method to be something magical or superior to other strategies: levels don’t guarantee 100% profits. Any strongest level can be broken by the price. Even if all traders from your favorite forum and all the world analysts indicated the level as a “very strong one”, the price breaks it through without any difficulties. We will see later why it happens.
The article covers the following subjects:
- Major takeaways
- What is Support and Resistance in Forex Trading?
- How the price is formed
- What is Support?
- What is Resistance?
- Dynamic Support and Resistance
- Why Support and Resistance are Important
- How to Draw Support and Resistance Lines
- MT4 Support and Resistance Guide
- MT5 Support and Resistance Guide
- LiteFinance platform Support and Resistance Guide
- How to Find and Use Support and Resistance Levels: Best Indicators and Strategies for S&R
- Trend Lines usage
- Pivot Points
- Stock Support and Resistance Levels: How to trade them?
- Summary
- Support and Resistance FAQ
Major takeaways
| Main Thesis | Insights and Key Points |
|---|---|
| Definition: | Support and resistance levels are fundamental concepts in forex trading related to price action. They represent key price levels where the price tends to find resistance or support. Using the support and resistance indicator can help traders understand these levels. |
| How the price is formed | Price is formed based on the law of supply and demand. For instance, if the price falls, more people will buy it. The price will rise until the amount of purchases exceeds the amount of sales. The support and resistance indicator can help identify these shifts. |
| Support meaning: | A support level is the price action of buying interest in an uptrend or selling interest in a downtrend. It's the price that makes technical analysts actively support further trend development. The support and resistance indicator can highlight these levels. |
| Resistance meaning: | Resistance is the price level which makes market participants fix profits and resist further price moves in the same direction. The support and resistance indicator can be used to identify these crucial points. |
| Dynamic Support and Resistance | Dynamic levels are "movable" or "moving" price levels, unlike classic static levels. The support and resistance indicator can help differentiate between static and dynamic levels. |
| Importance: | Understanding support and resistance zones is crucial because they help understand the market situation, predict reversals, determine market sentiment, design trading strategies, filter false breakout signals, and simplify analysis. The support and resistance indicator enhances this understanding. |
| How to Draw: | Drawing these lines requires marking extremums with horizontal rays on a linear chart, no shorter than 4 hours. The support and resistance indicator can assist in this process. |
| Indicators: | The article mentions several indicators for identifying support and resistance levels: extremums, Fibonacci channels, moving averages, trend analysis, and pivot points. The Fibonacci sequence, in particular, is actively used as a support and resistance indicator in Forex trading. |
| Strategies: | To identify support and resistance levels, traders can use techniques like drawing rays through the last two maximums and minimums, analyzing price action for no-breakout retests, and using tools like MT4 and MT5. Additionally, understanding the importance of ATH (all-time high) and ATL (all-time low) is crucial. |
| Advantages and limitations: | The advantages of using support and resistance indicators include better prediction of price movements and enhanced trading strategies. However, the article does not explicitly mention the limitations. Further insights might be available in the remaining content |
Let’s try to understand what support/resistance levels (or demand/supply zones) are in general, and how they are formed in our beginner's guide.
What is Support and Resistance in Forex Trading?

I have already mentioned support and resistance trading ranges casually in my article on technical analysis, in the Common terms section. Now it's time to go into detail.
A support level is defined as the price action of the buying interest in an uptrend when the asset price rises in value or the selling interest in a downtrend when the asset price falls. That's the price that makes technical analysts actively support further trend development. Conversely, resistance is defined as the price level which makes market participants fix profits and go in the opposite direction of the trend line, i.e., resist further price moves in the same direction. However, support or resistance levels aren't registered solely in a trending stock market. Those key price levels can be observed in a flat market as well. In that case, the support level will coincide with the trading channel's lower limit and the resistance trading level – with its upper limit. Those values are usually marked with a thin horizontal line on the chart. I prefer using rays to see the starting point clearer. It has already been proved that the older a price level is, the stronger it is, compared with later values.
How the price is formed
Before you continue reading, try to answer the question: “Why does the price go up and down at all”? Don’t think about the price action curve recall the examples from real life. Remember, what is happening on sales or in times of product shortage. Remember?

Now, let’s study example №1.
There are three tomato sellers in the financial markets.
The first one’s price for tomatoes is 50 per kilo.
The second one’s price for tomatoes is 60 per kilo.
The third one’s price for tomatoes is 70 per kilo.
Who will you buy tomatoes from? Of course, from seller №1, as it is more advantageous for you. Will other people do so? I think they will. Thus, we understand the law of supply and demand: “the lower a product price is, the more the desire to buy it”.
If we apply this law to exchange trading, we can say so: traders-buyers will compete with each other for the lowest price offered by traders-sellers.
And now in simple terms: if the price falls, more people than now will buy it.
Traders-buyers will compete with each other for the lowest price offered by traders-sellers.
What moves the price?
Imagine that you are a large player in the foreign exchange market, Forex. Not the one, who is a “market maker” and thought to cause other traders’ losses without losing himself/herself. Just a large market player. A fund, for example. You need to buy a lot of euros, 5 billion, for example.
| Price | Amount for this price |
| 1.1600 $ | 2 billion EUR |
| 1.1500 $ | 2 billion EUR |
| 1.1400 $ | 2 billion EUR |
According to the law of supply and demand, and common sense, as well, you will start to buy at the lowest price offered, at 1.1400. However, we see that the amount of euros is not sufficient, the seller offers 2 billion, but you need 5 billion. After your deal with the seller, he/she joyfully finds exit points from the market, and you are left with the need to buy 3 billion more.
What happened?
The lowest price for euro, before you entered the market, was 1.1400. When you started buying it out, you bought the entire amount for this price (2 billion). Now the lowest price for euro in the market is 1.1500. So, because the amount of your purchase exceeded the amount of sales for the price of 1.1400, the price rose up to 1.1500. How long will the price action go up? Until the amount of purchases exceeds the sales amount.
In your example, you will buy out the entire amount for 1.1500 (2 billion) and a half of the amount for 1.1600 (1 billion). Thus, while you are buying 5 billion euro, the price will have risen from 1.1400 up to 1.1600.
And what can we conclude from that?
Price rises until the amount bought is more than the amount sold. So, as soon as more is sold than bought, the price drops.
The price will rise until the amount of purchases exceeds the amount of sales.
What can stop the price?

And, finally, we have come to the most important point, what will happen if you want to buy your 5 billion euro at a certain price, and strongly object to buying at a higher price?
Let’s study the previous example, but change the values:
1.1600 – 2 billion EUR;
1.1500 – 2 billion EUR;
1.1400 – 2 billion EUR.
You buy 2 billion euro for 1.140, and need 3 billion more to buy. Suddenly, a more active but as large as you player goes ahead and starts buying out euro for 1.1500, then for 1.1600, for 1.1700, and so on (remember the example with iPhones). Due to this, the price is surging very fast. That’s all. The price has grown up, and you don’t want to pay more, so you are just waiting until there is the price you need. If the price returns down to 1.1400, you will resume buying. If you want to buy more euro than is offered at 1.1400, you will again prevent the price from falling and can trigger its growth. How will it look in the chart? That’s about how it will:
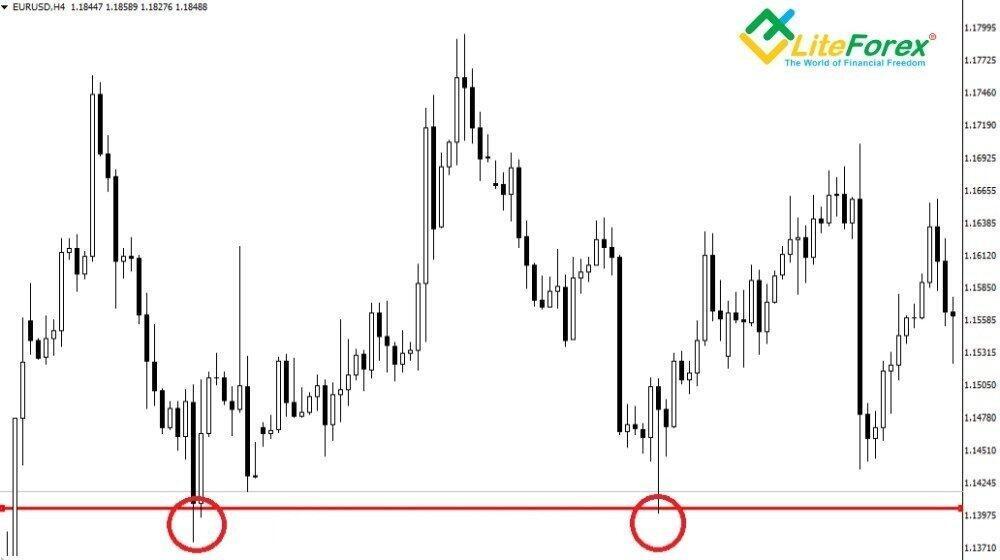
Support level 1.1400.
That is, there, where you buy out all the sales, will be large price swings: the price drops – you buy out all the supply – other technical analysts see this stop and start to buy, thus pushing the price action up.
And exactly those price swings are the popular support and resistance trading range levels.
The price action, for which large amounts are bought, will swing greatly. Exactly those swing trading elements are taken to build either support or resistance levels (see the above chart).
What is Support?
Let's imagine the situation when the price moves upwards.
The price action curve's movement to the upside isn't linear, and the price action tends to drop down. However, it doesn't fall below a certain value as if something were supporting it (some big capital, most often). The price that serves as the starting point to oppose the asset's further drop-off is called "support level."
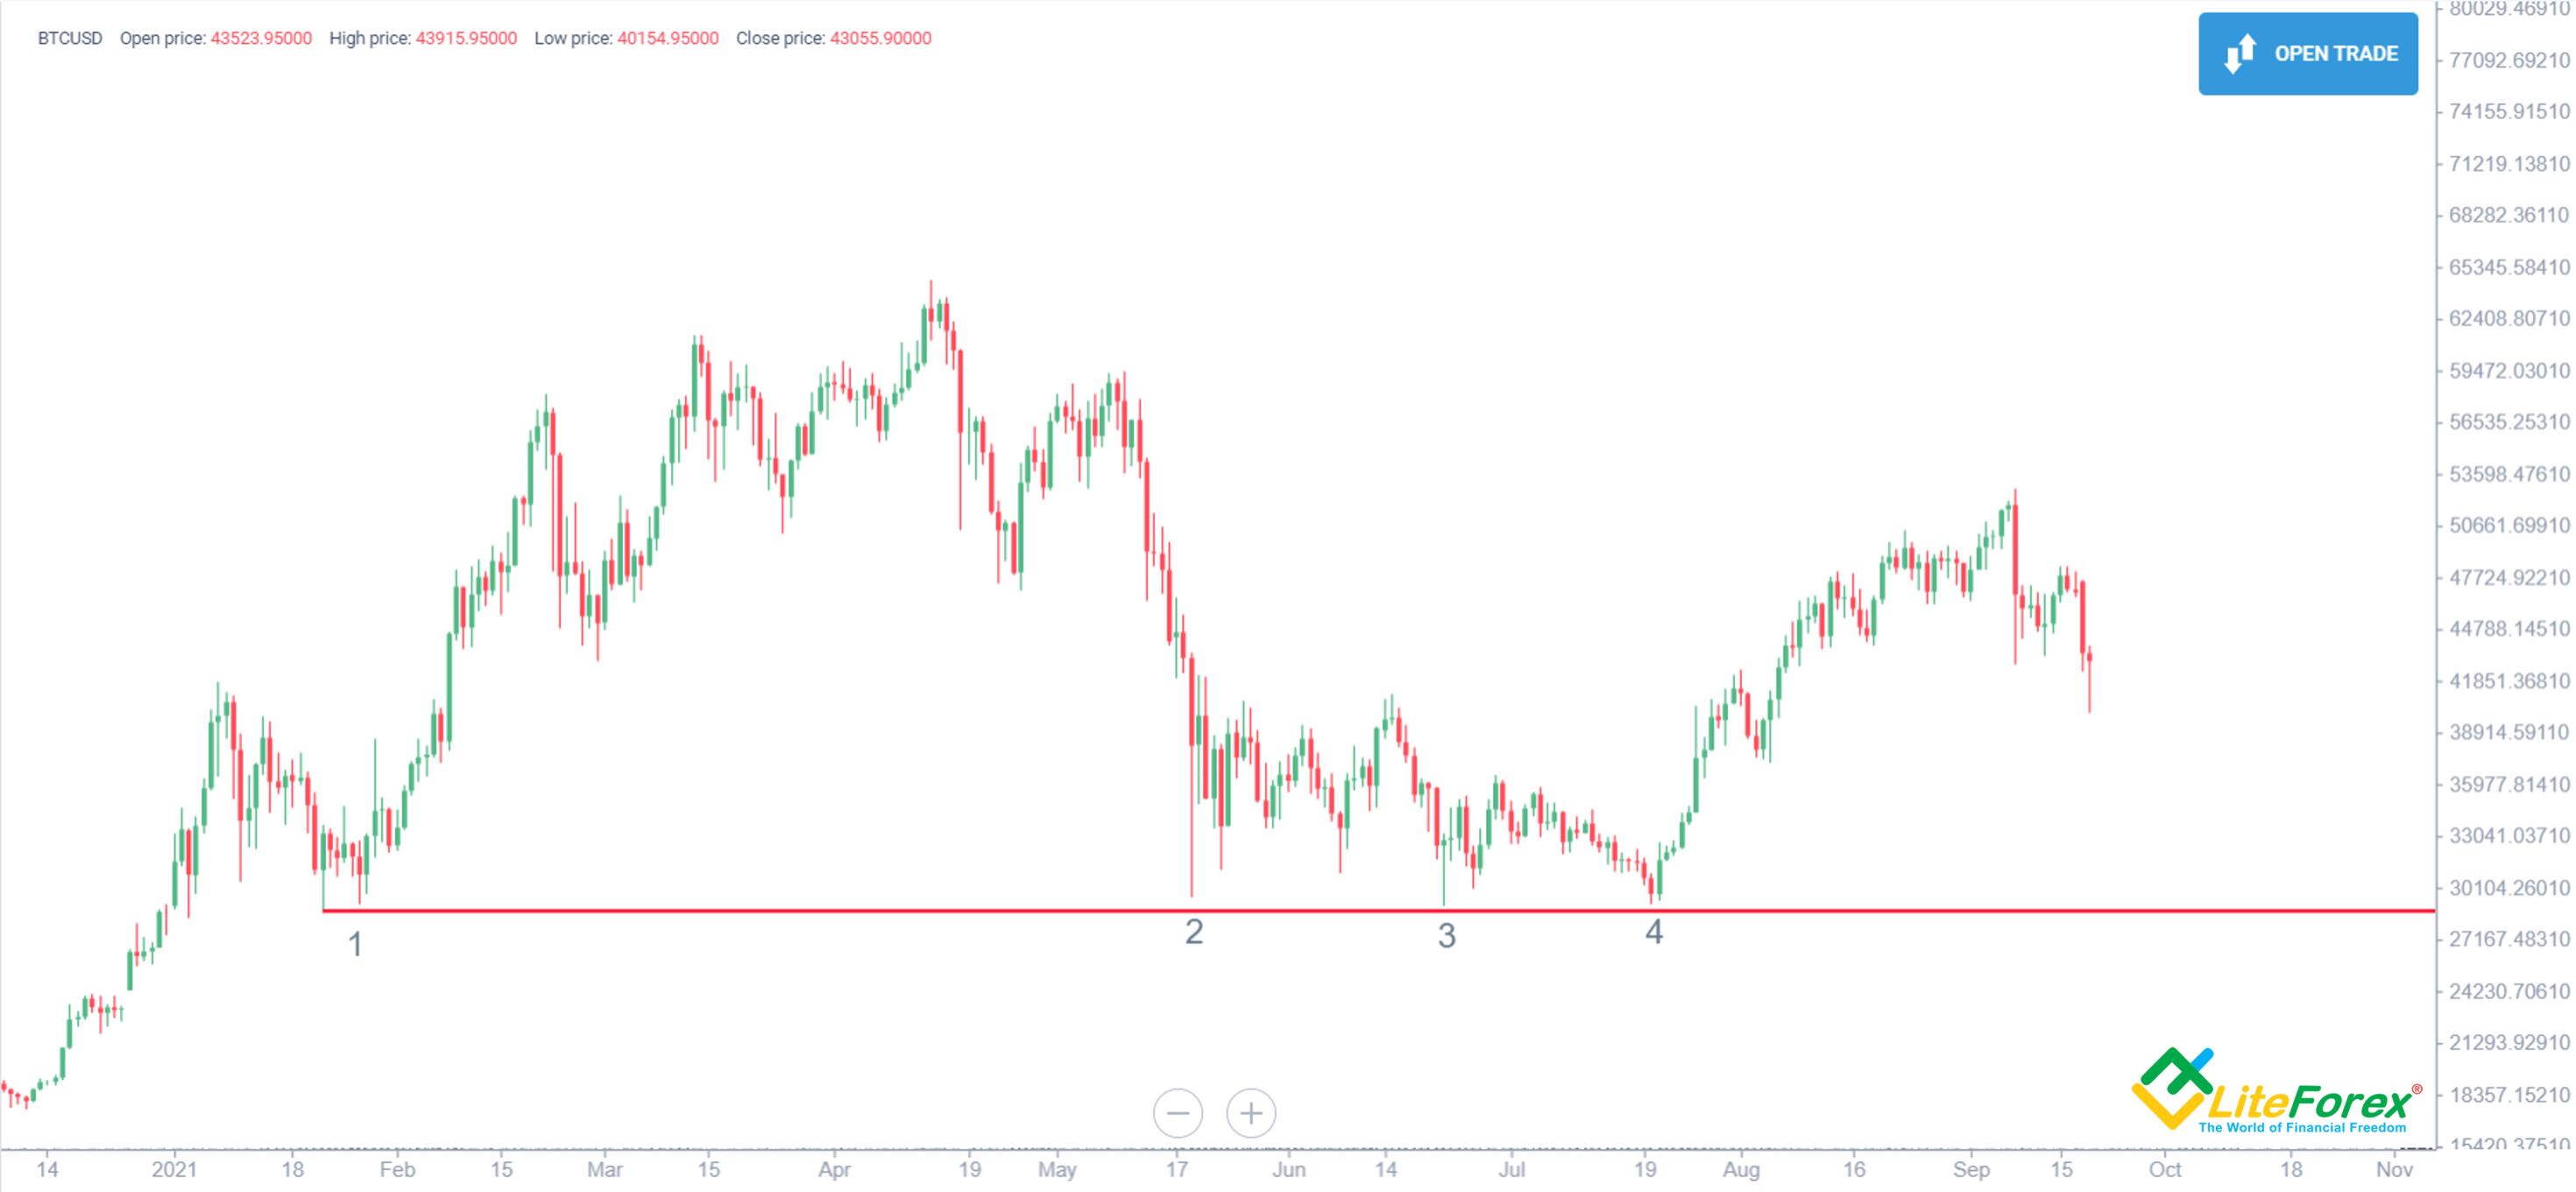
On the above chart you can see a good example of a support level at 29,000 USD for one Bitcoin. The sellers have attempted to break support level four times in 2021, but the buyers managed to keep the value unchanged.
What is Resistance?
Let's examine a price action on the same H1 chart again.
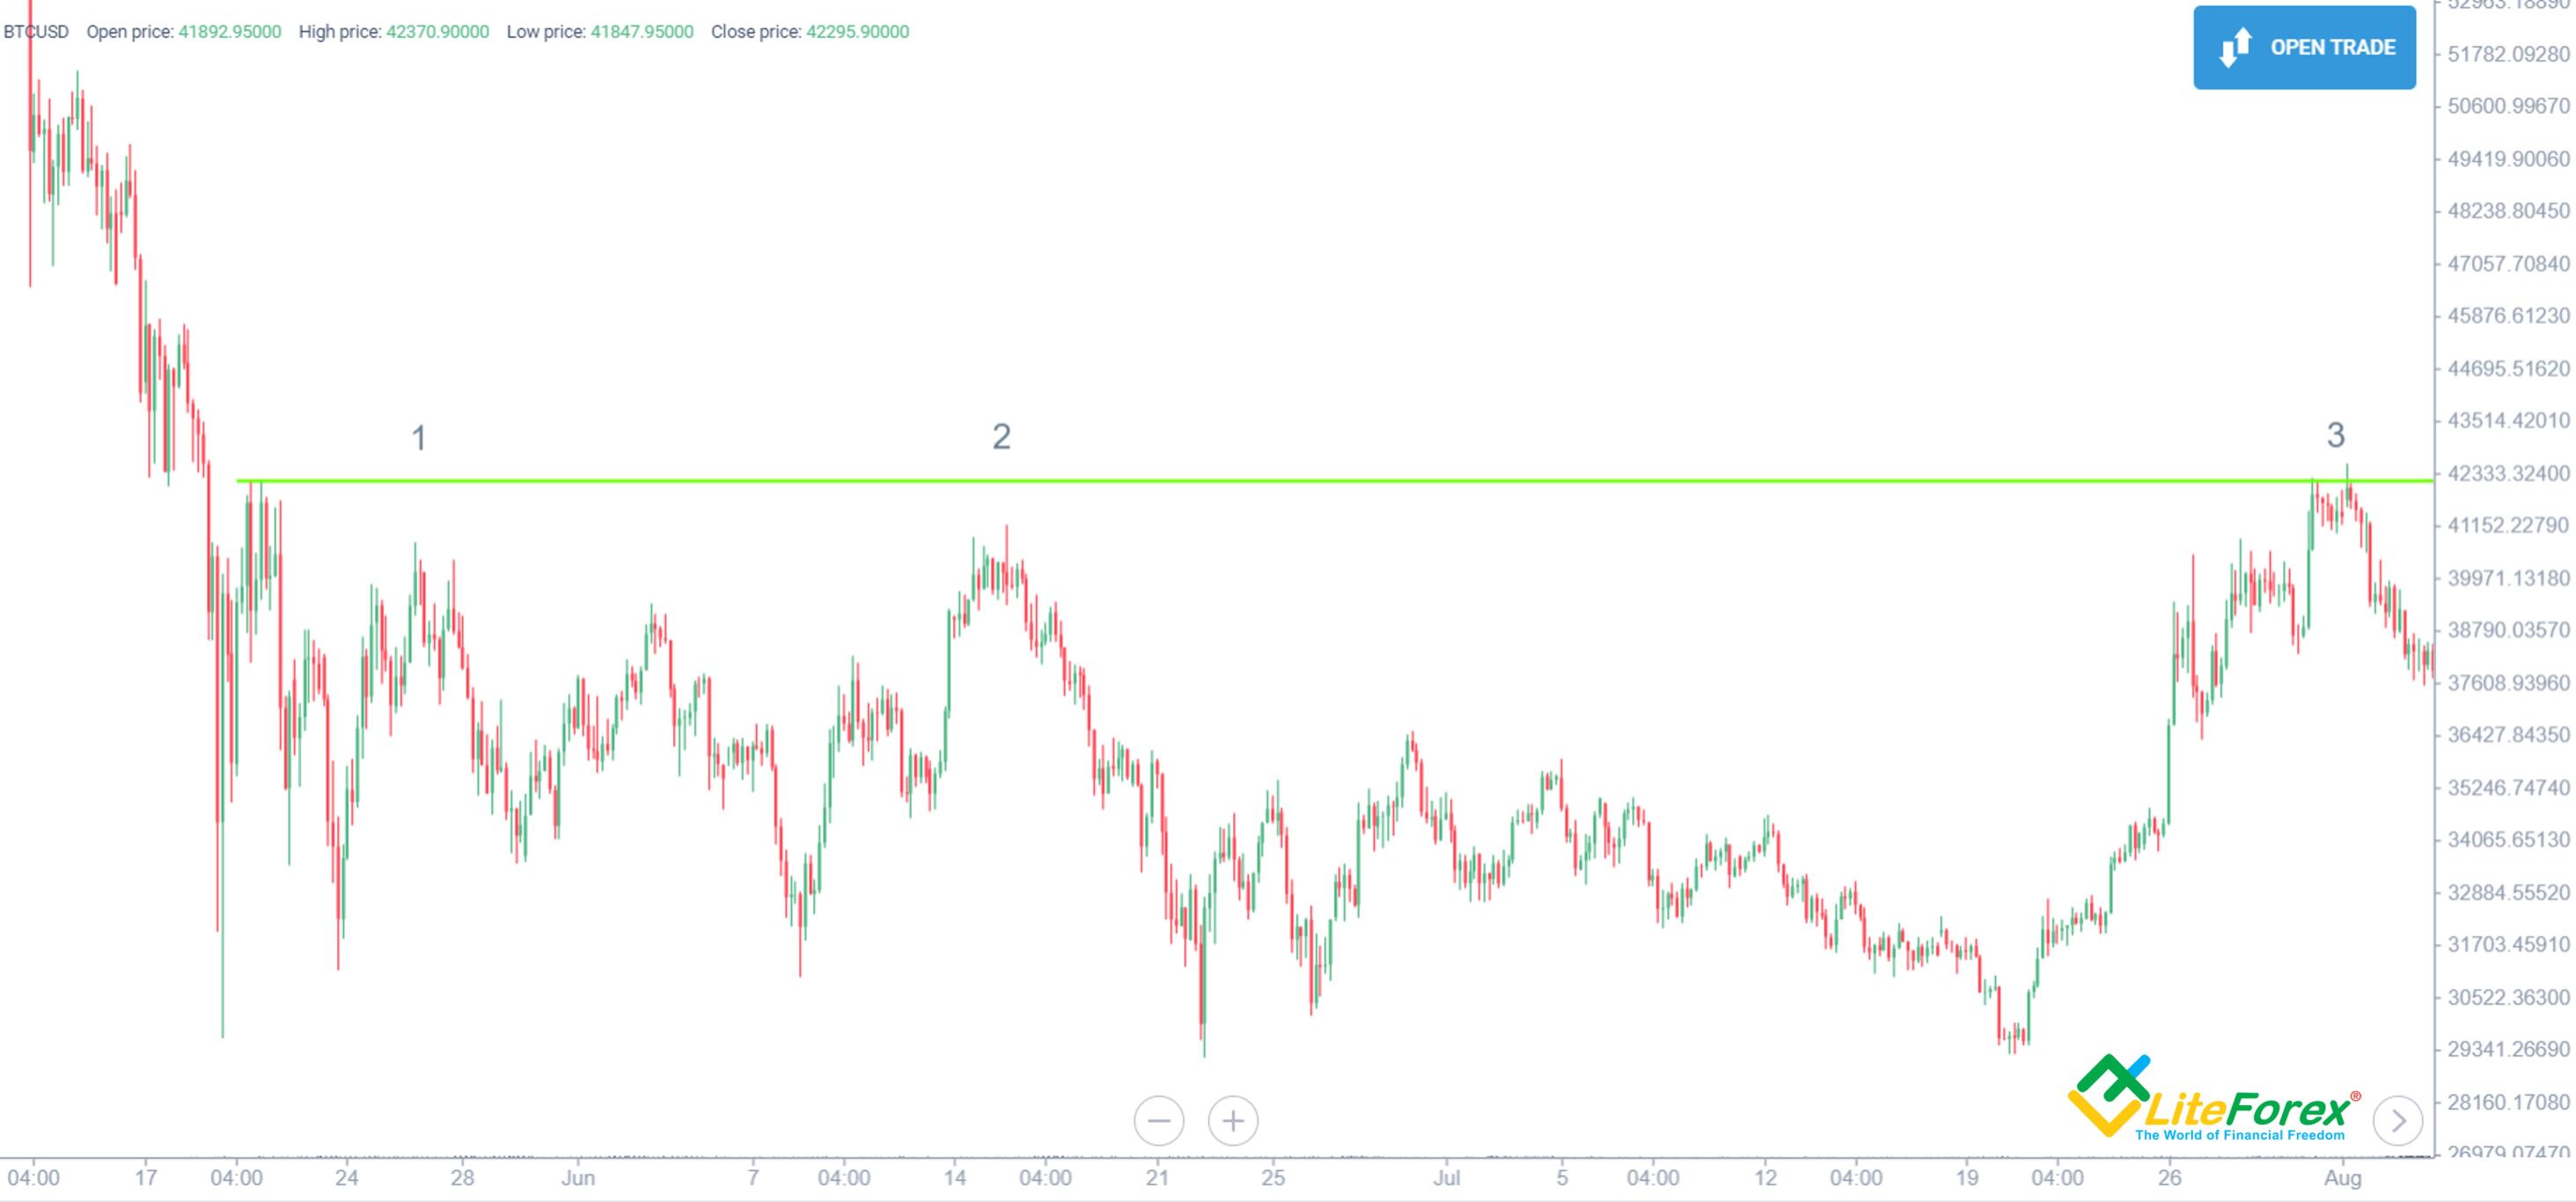
As we see from the chart above, something prevents Bitcoin from growing above a certain price level. That's where a resistance trading line should be marked. It's 42,230 USD.
Dynamic Support and Resistance
What does "dynamic" mean? As we remember from our physics classes, dynamics studies the mechanics of motion. So, in our case, a "dynamic level" would be a "movable" or "moving" price level. Conversely, classic support and resistance trading ranges are static levels.
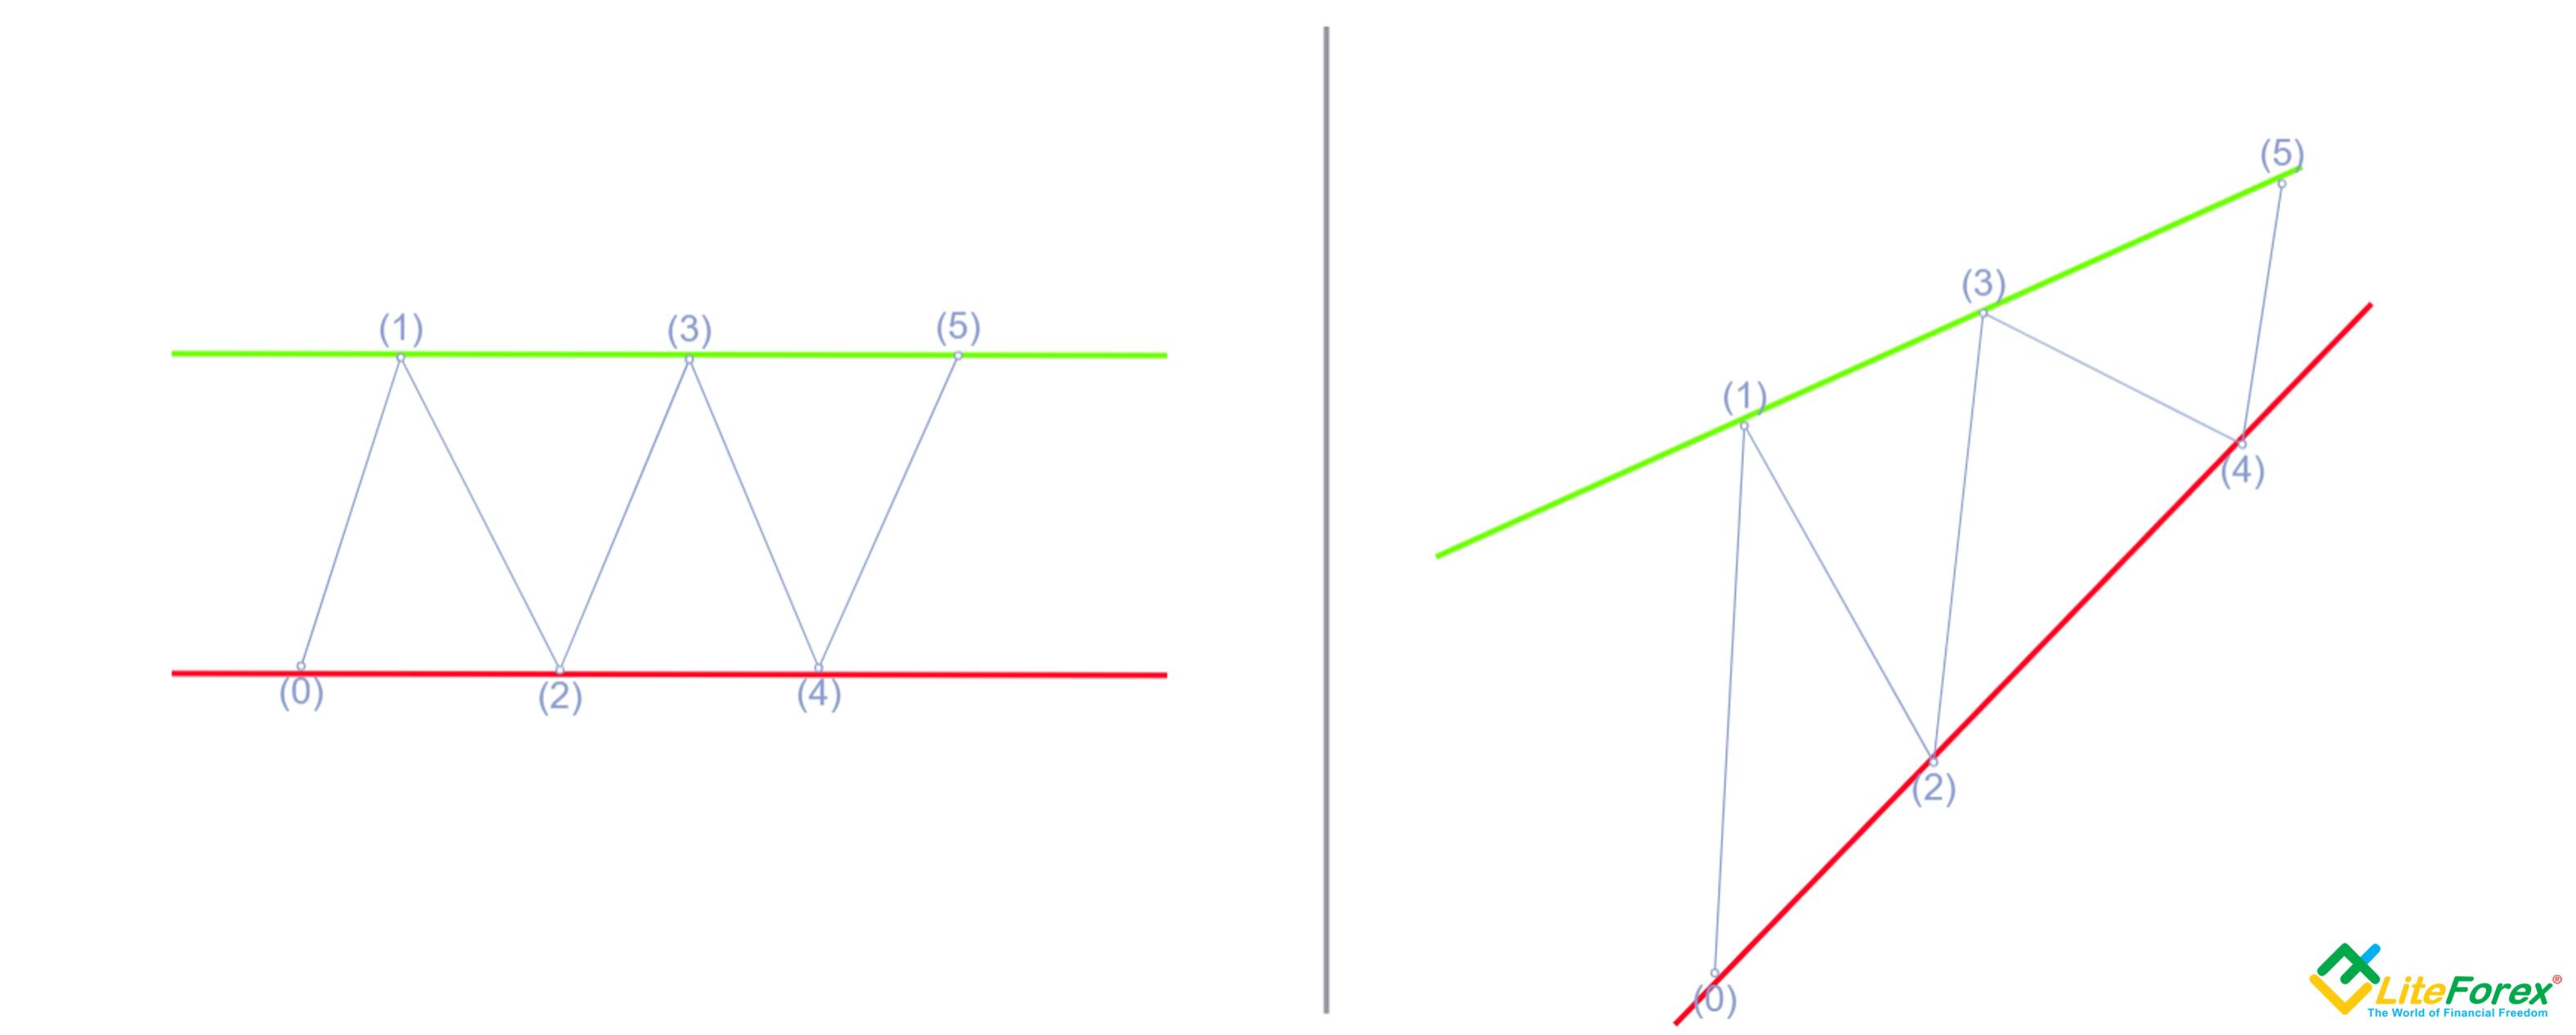
I've drawn those two types of movable price levels in the picture above to show the difference between them. On the left, you can see static support and resistance trading ranges that mirror each other. On the right, you see dynamic levels. The red line is support level, and the green line is resistance. If you ask me what the difference between a support level and a trend line is, my answer will be "there's none."
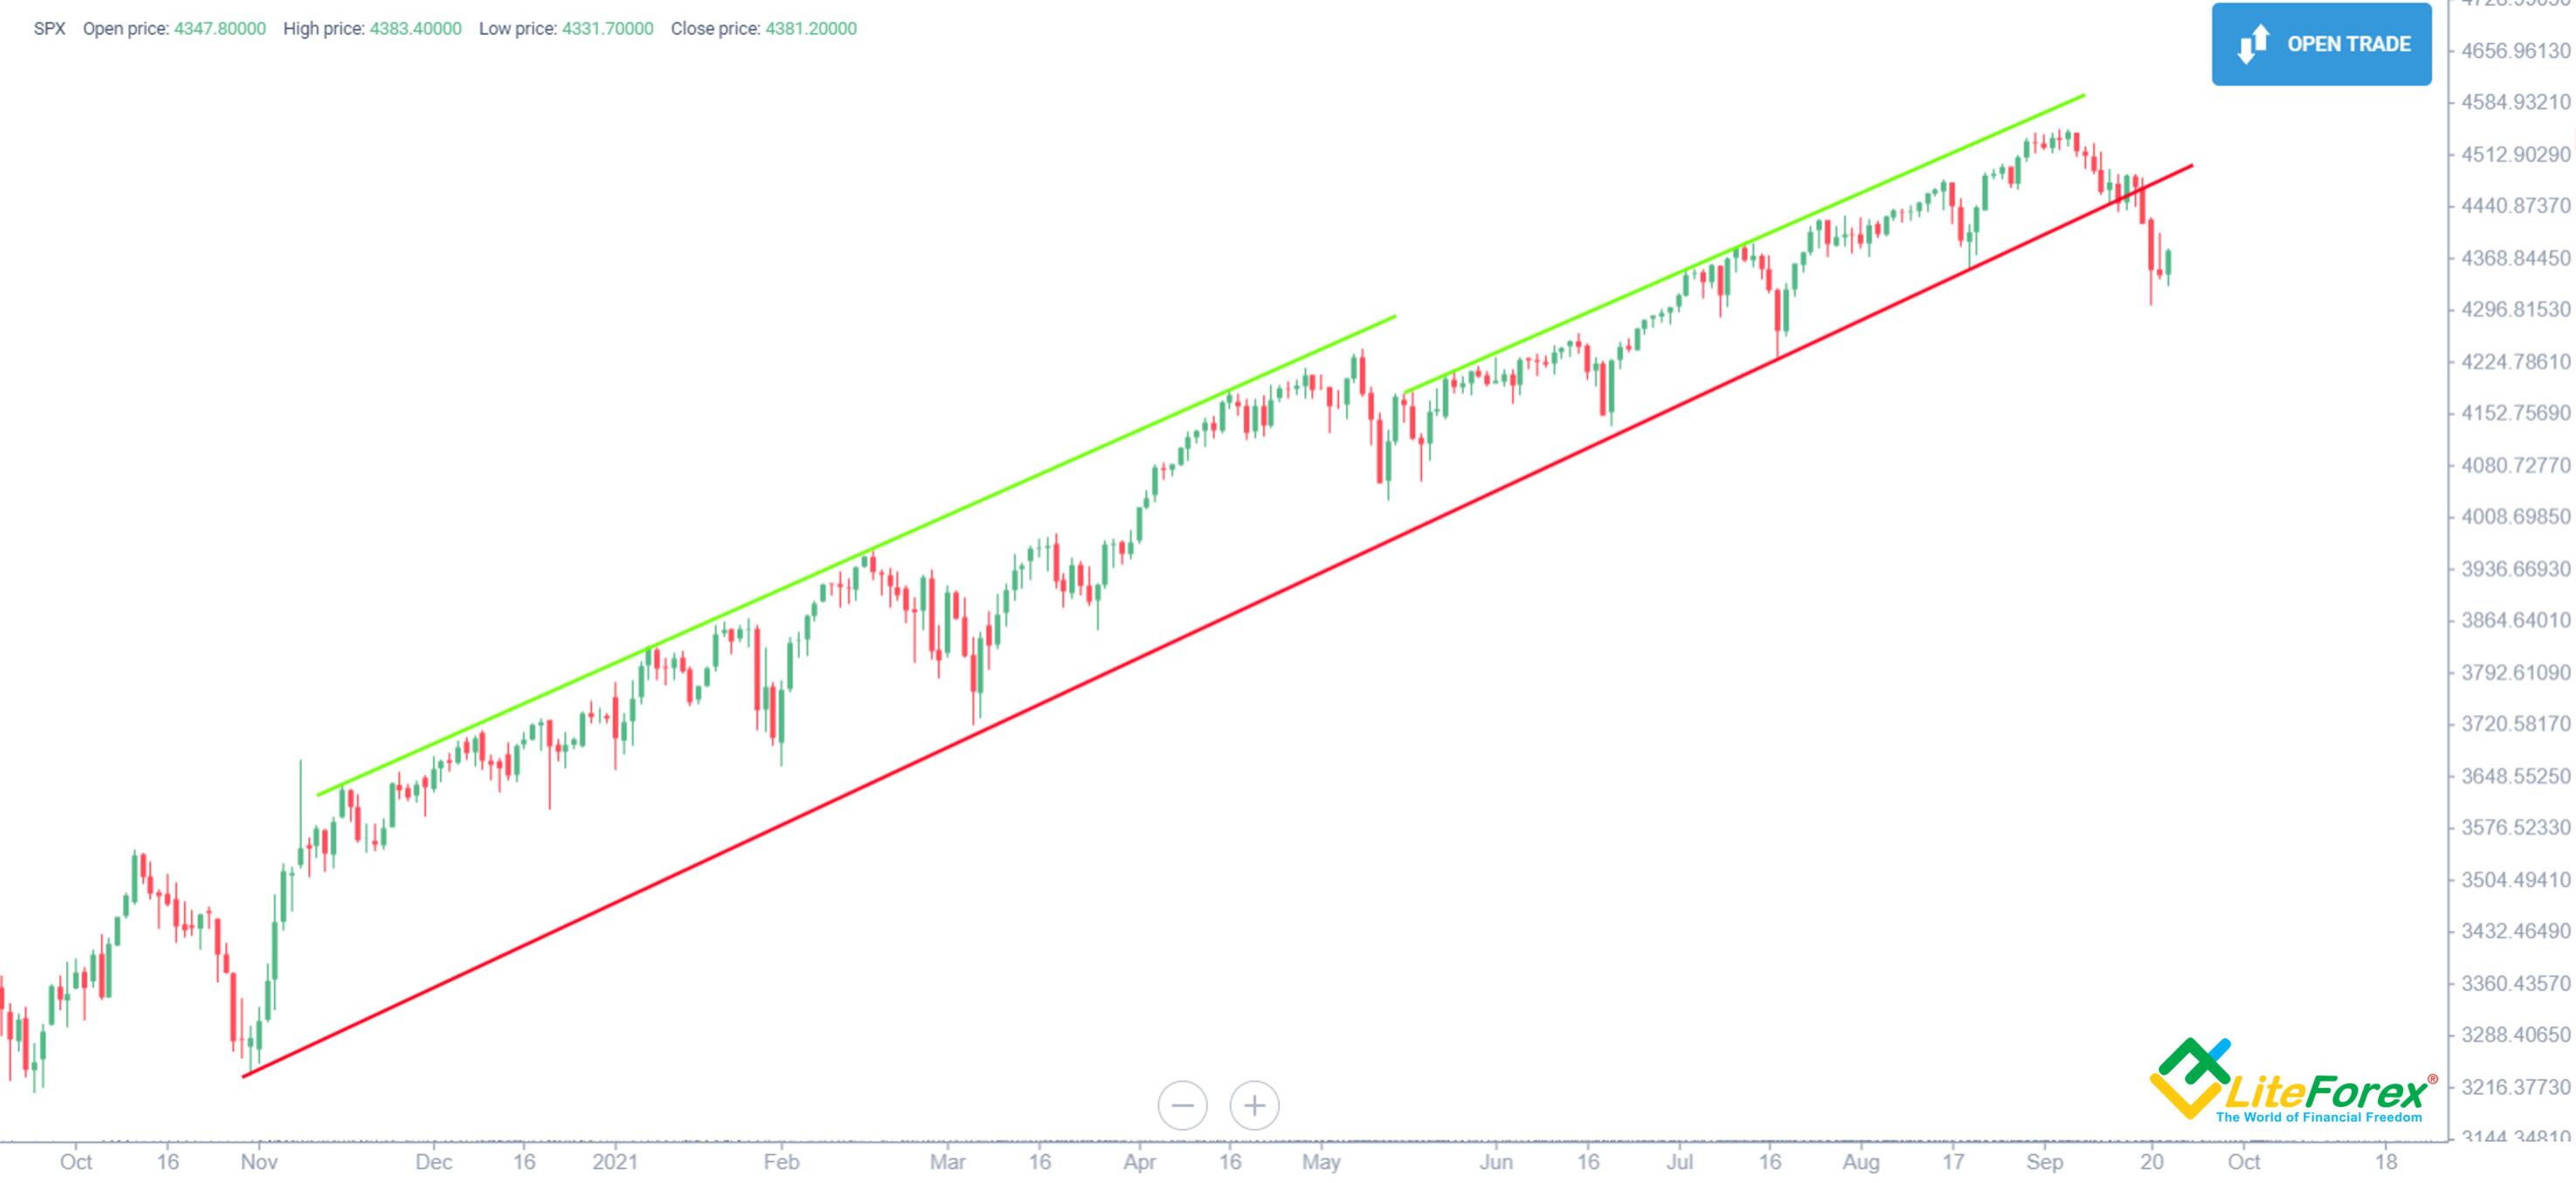
As we can see from the S&P500 chart, the index's extremums have been on dynamic lines since November 2020. The quotes have rebounded off the red line four times. At the same time, the dynamic resistance has defined the ceiling of the price level within the trend limits over the whole year 2021. The dynamic resistance trading line then moved close to the support levels after May's correction. The trade channel got narrower, which was the first indicator of an eventual sharp reversal.
Why Support and Resistance are Important

Based on my own experience and the examples above, I can single out seven fundamental reasons why understanding support and resistance zones (trading ranges) is crucial for traders:
They help understand a general market situation.
They are necessary for trend analysis.
They are used to predict reversals.
The reaction of price action to the key levels helps determine the sentiment of the financial market participants.
They are used in designing a trading strategy as guidelines for price targets, entry and exit points, and stop losses.
They help filter false breakout signals and confirm real ones.
They simplify end-to-end analysis if several time frames are used.
How to Draw Support and Resistance Lines
Experienced analysts and traders can draw them with their eyes closed. Beginners will need some time. However, it's essential to learn to draw support or resistance level lines correctly, or mistakes will be pretty costly. To avoid them, you need to make just three steps:
Step 1. Start with a linear chart, no shorter than 4 hours.
Short trade timeframes, for example, 1 Min time frames, are subject to high volatility, which produces a lot of false signals. Also, illiquid assets might not be informative on 1M charts and full of anomalies, which will produce many false breakouts.
When it comes to candlesticks, which are a default mode of representation, they might have errors in long shadows. So, linear charts would be a better choice.
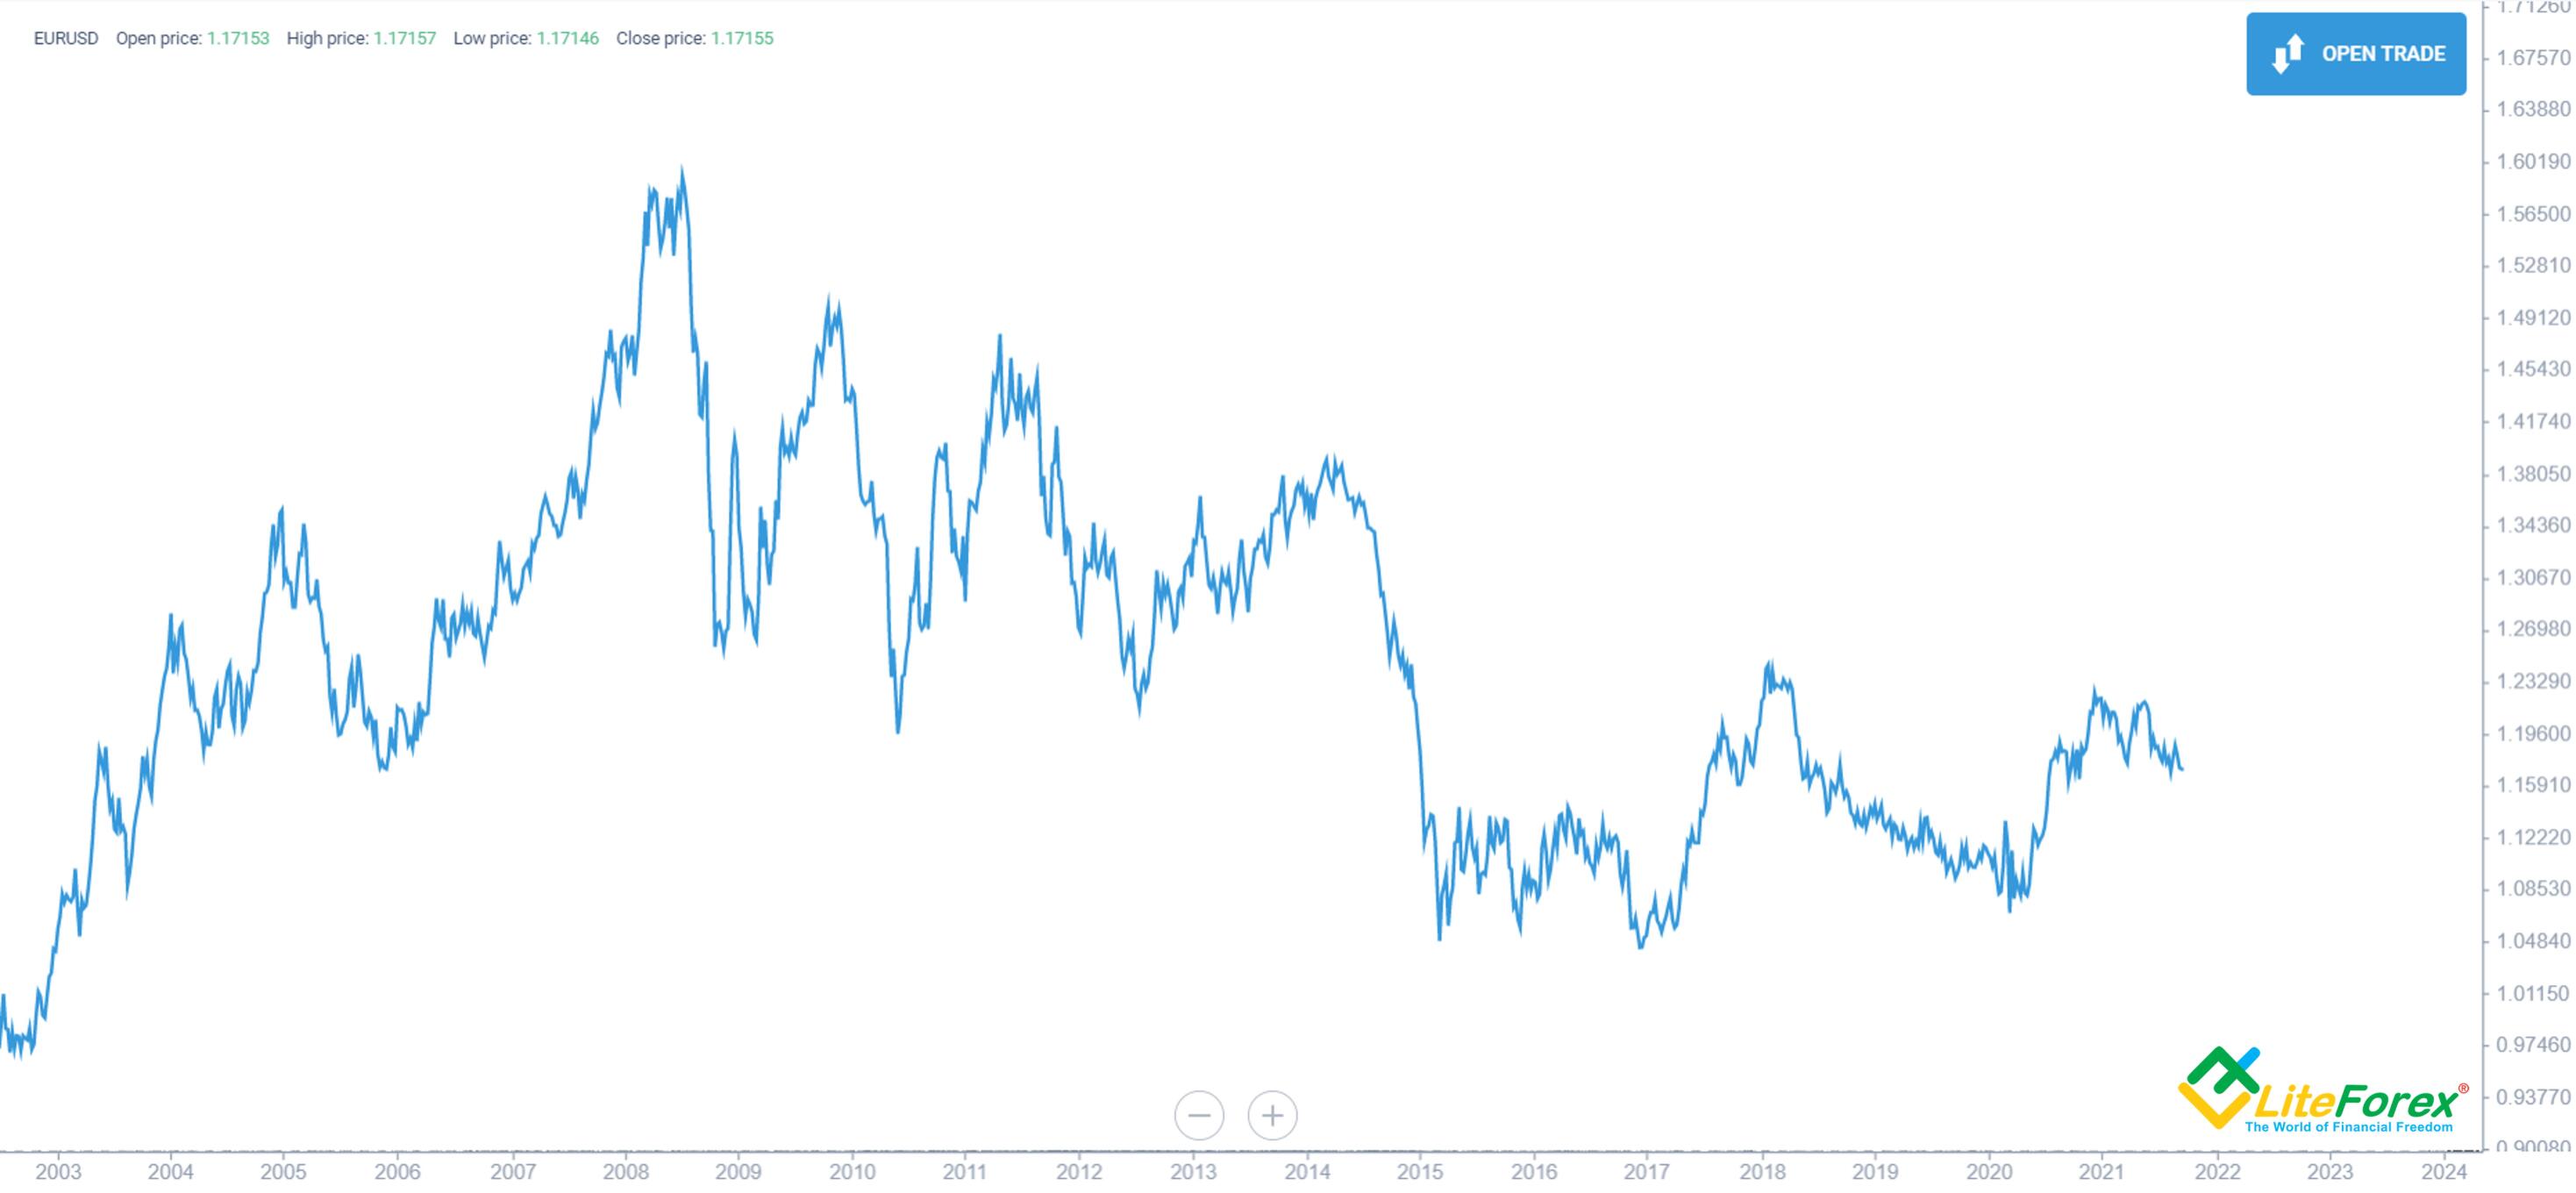
I've chosen a weekly EURUSD time frame chart and switched it to a linear model.
Step 2. Mark extremums with a horizontal ray. Let the highs be green and the lows – red.
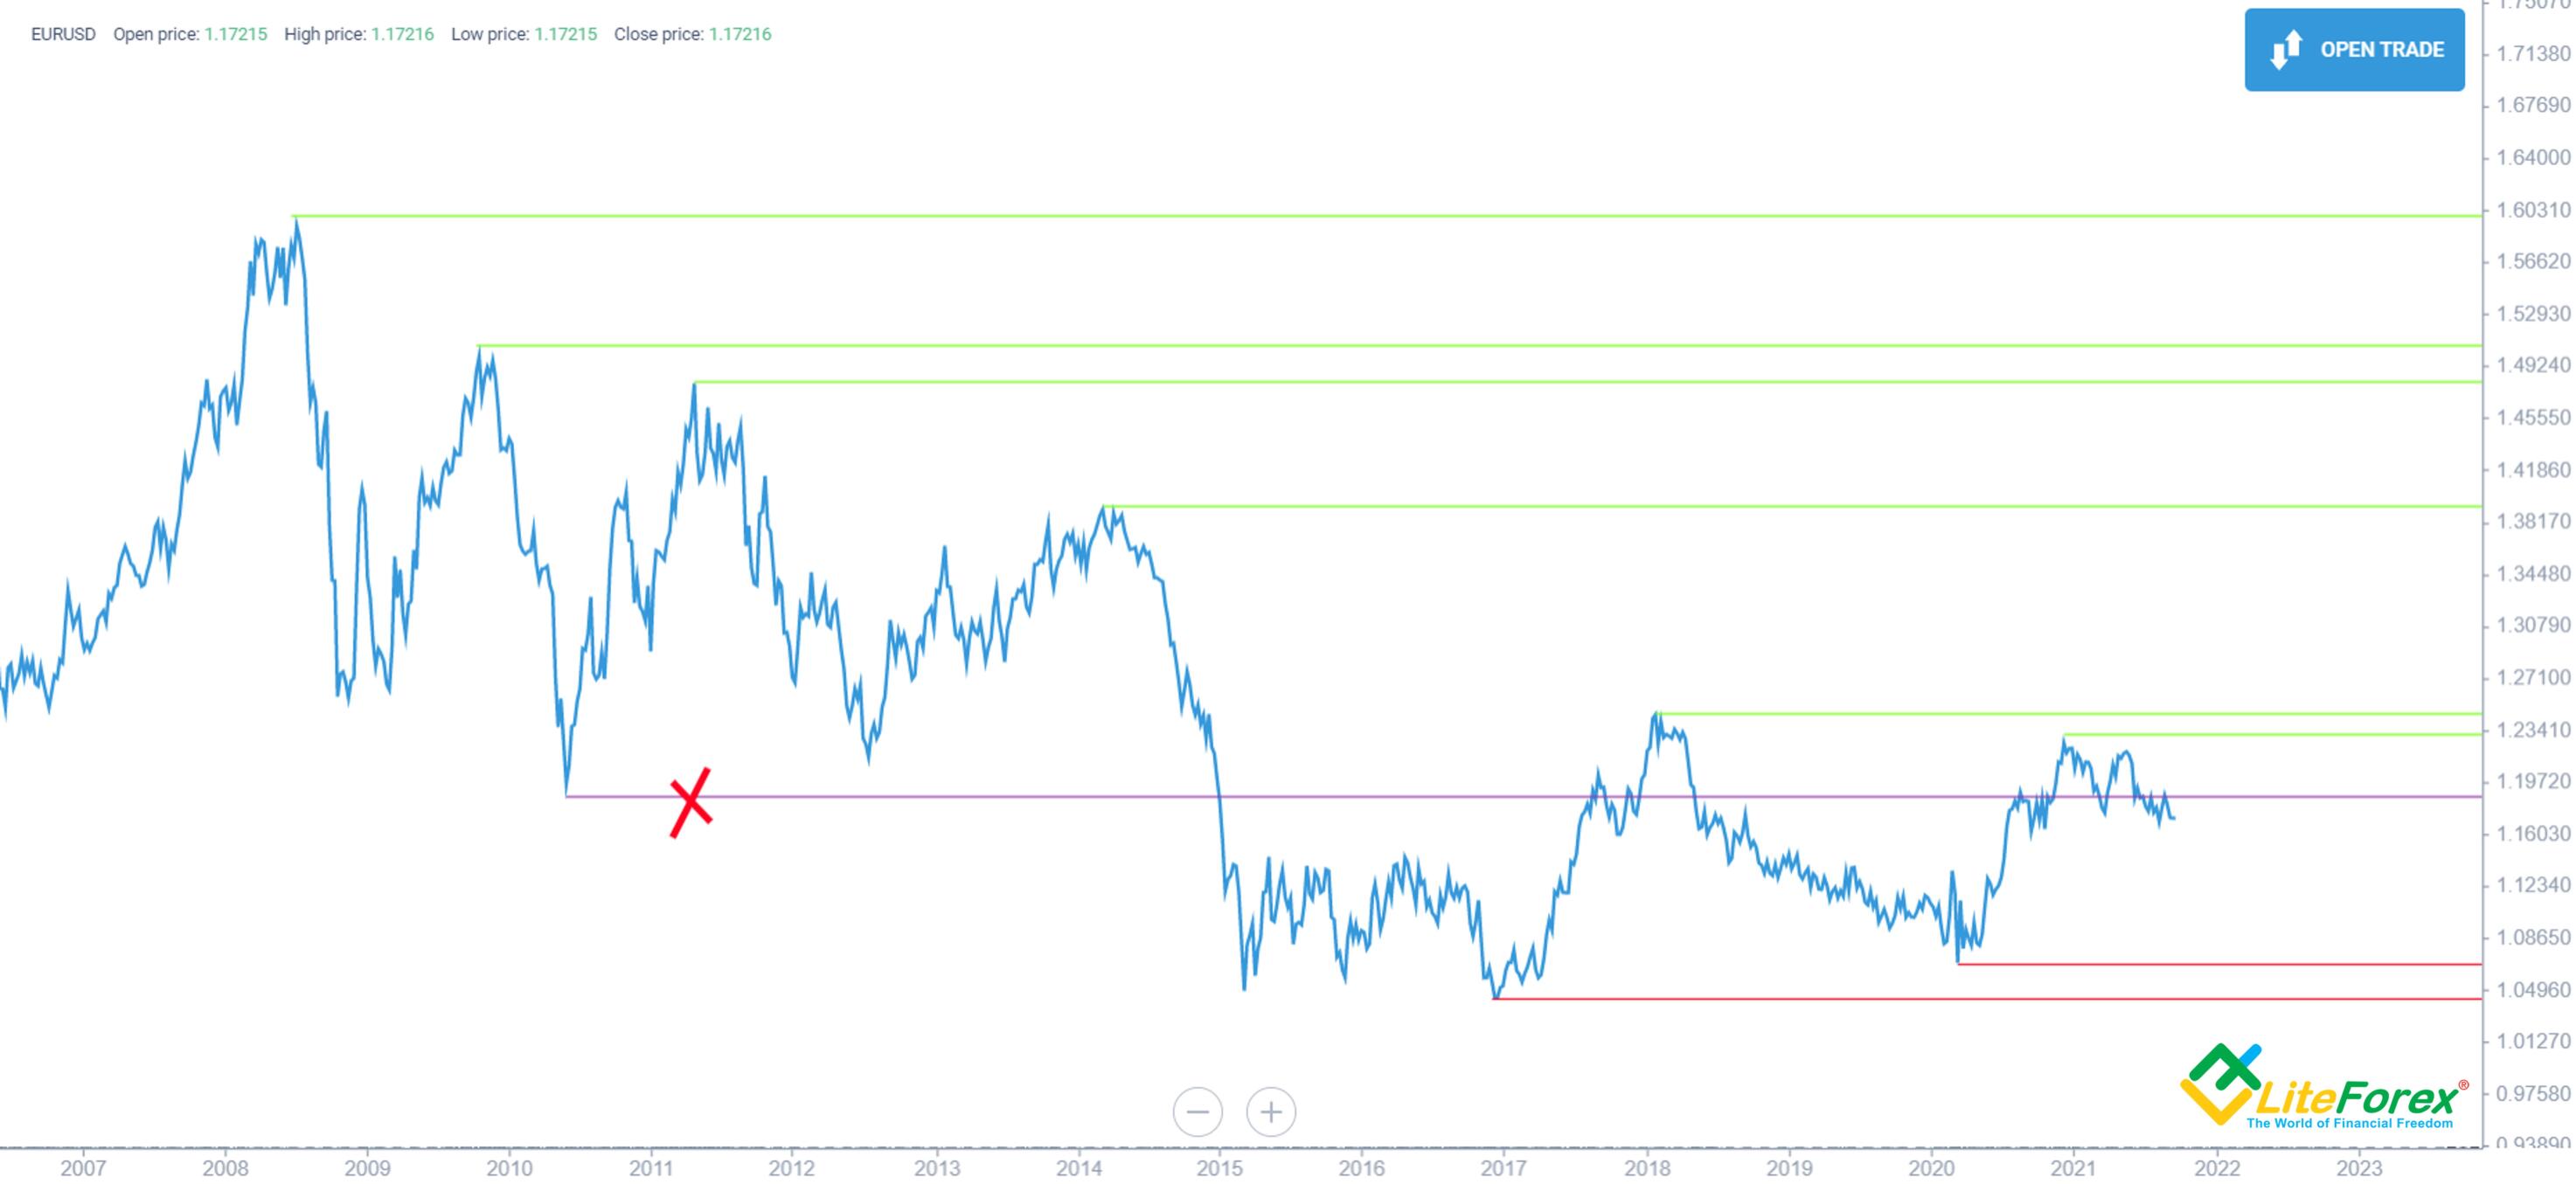
The price action shouldn't break the ray you're drawing. If you've repeated my actions, you will have something similar to the picture above. I've also marked in purple the ray drawn by mistake.
Why do I not recommend considering such rays? A support or resistance trading area that has been broken is no longer relevant and shouldn't be analyzed. The price might hold onto it for a short trade period, but most of such signals will be false.
Let's also mention the properties of support and resistance trading ranges:
They become even more relevant once confirmed, i.e., when the price approaches to the line and reverses without touching it.
The farther the level is from the current price, the more reliable it is. If the price action shows no reaction at the second approach, a breakout is likely to happen.
A strong momentum movement usually follows a breakout of support level or resistance zones.
Several support/resistance trading levels can be consolidated into areas or zones.
- Broken price levels located near relevant price levels can be used to determine the limits of such zones as well.
Step 3. Now we have to determine dynamic support and resistance levels.
That's easier. Draw a ray through the last two maximums and another ray through the last two minimums. The price action mustn't break out the common movement you'll have as a result, or else it can't be considered valid.
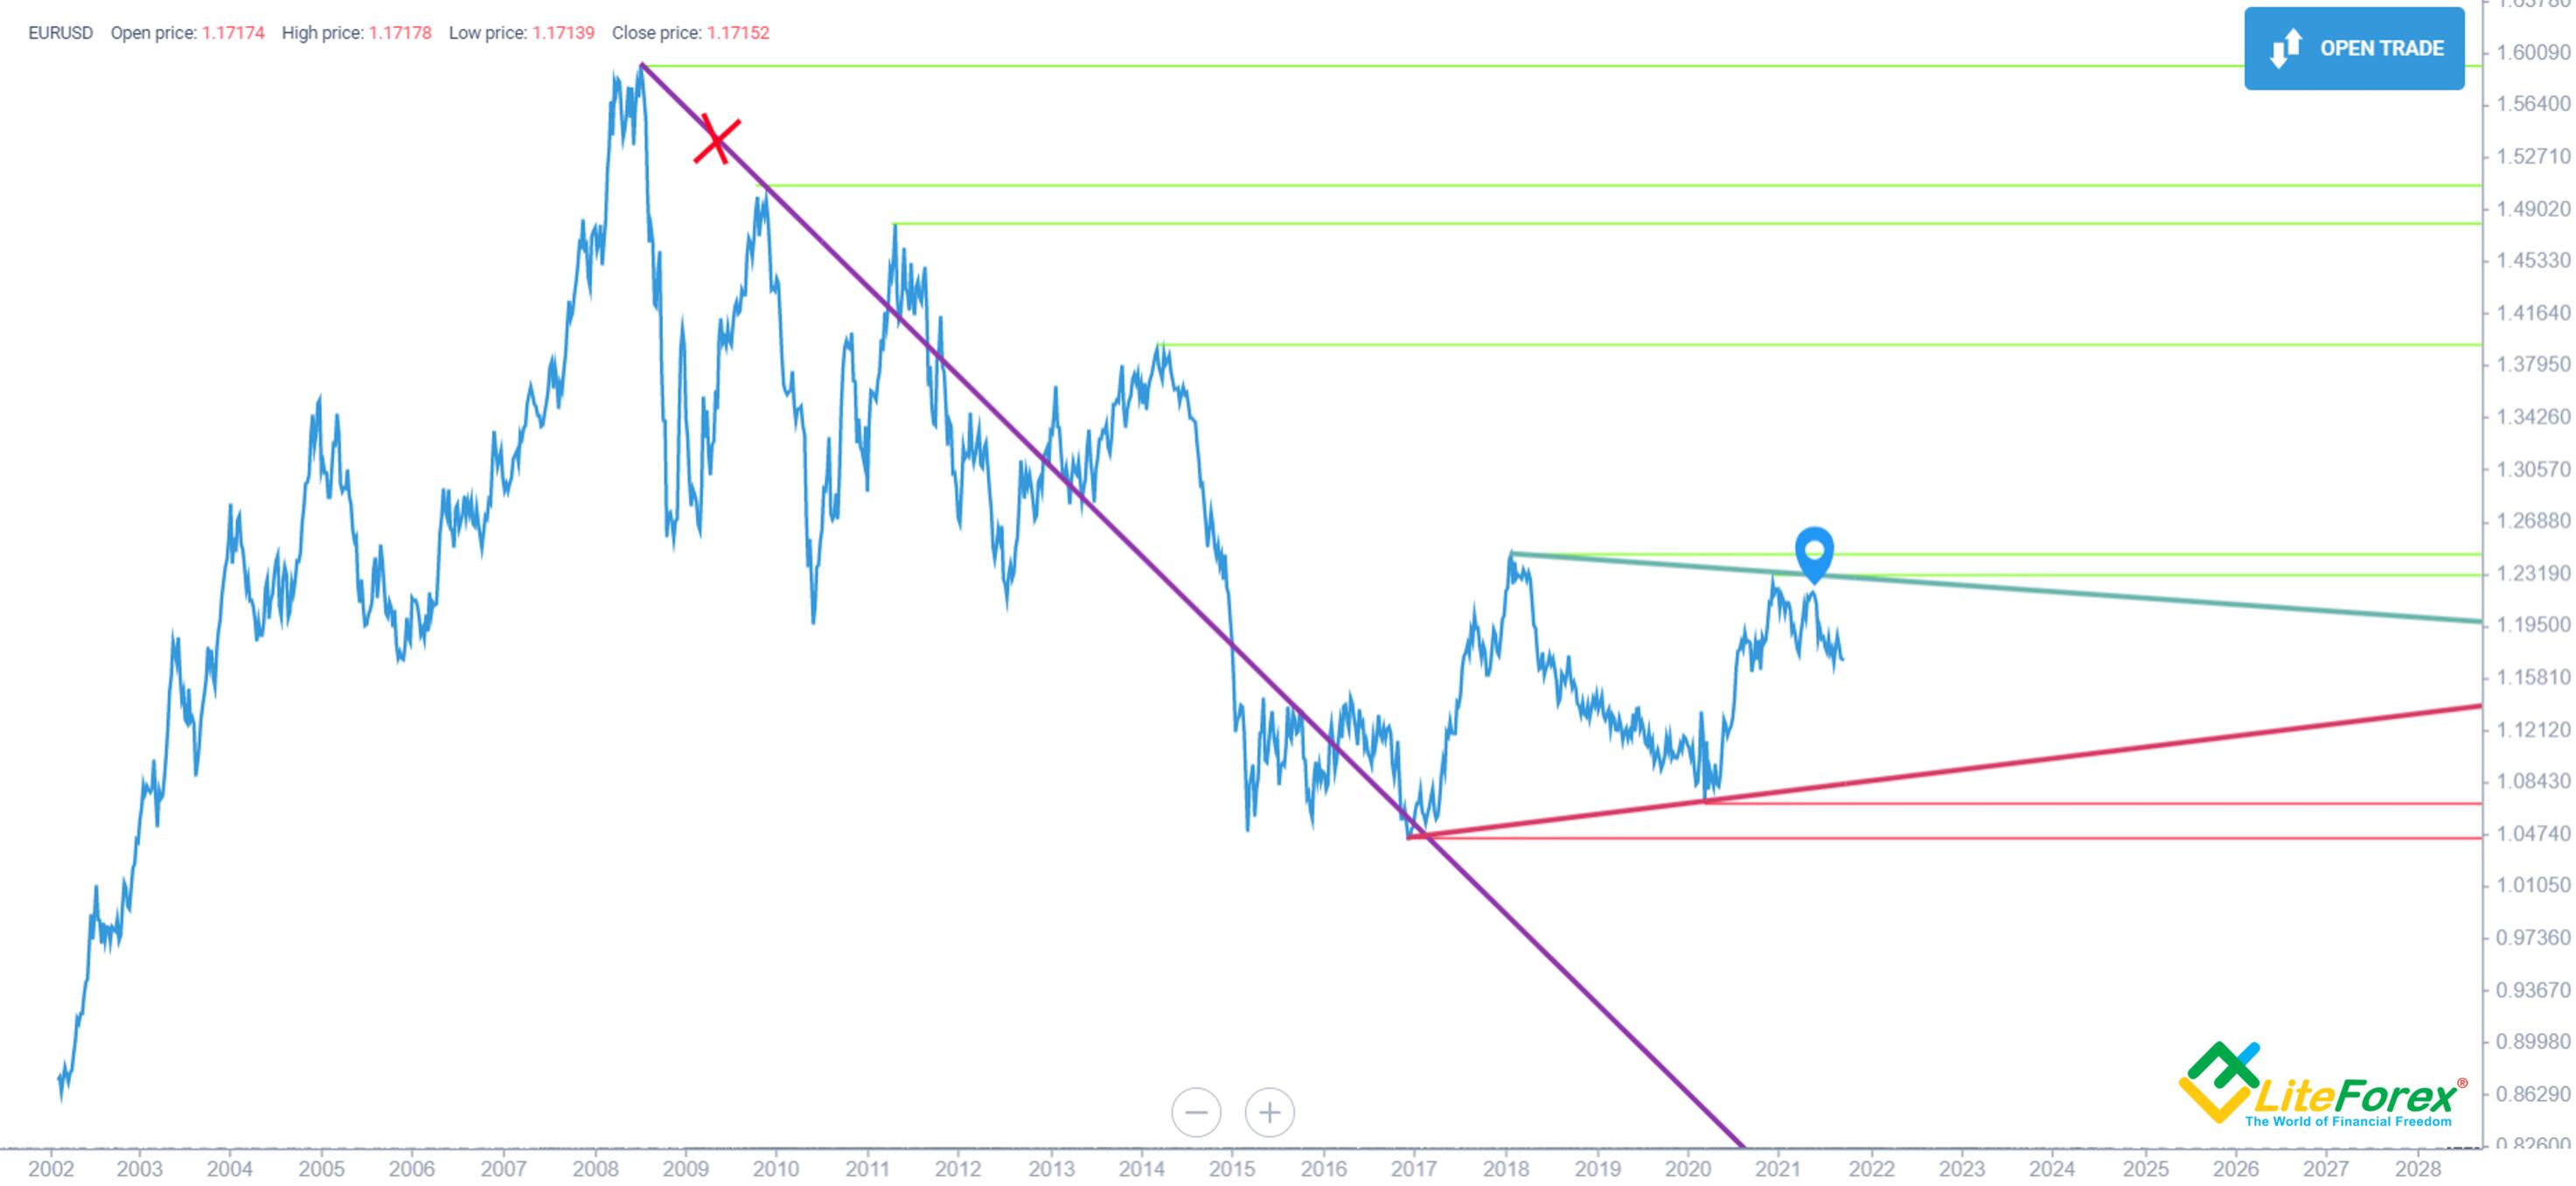
Another clear indication of support or resistance zones will be a no-breakout retest. I've marked its example in blue line on the chart above.
There can be several dynamic levels. The more extensive price history a ray covers, the more reliable it is. However, remember to filter the lines broken by the price. I've marked such a line with a red cross in the chart above. It will be irrelevant in technical analysis.
MT4 Support and Resistance Guide
You can identify support or resistance level in MT4 in just a few steps.
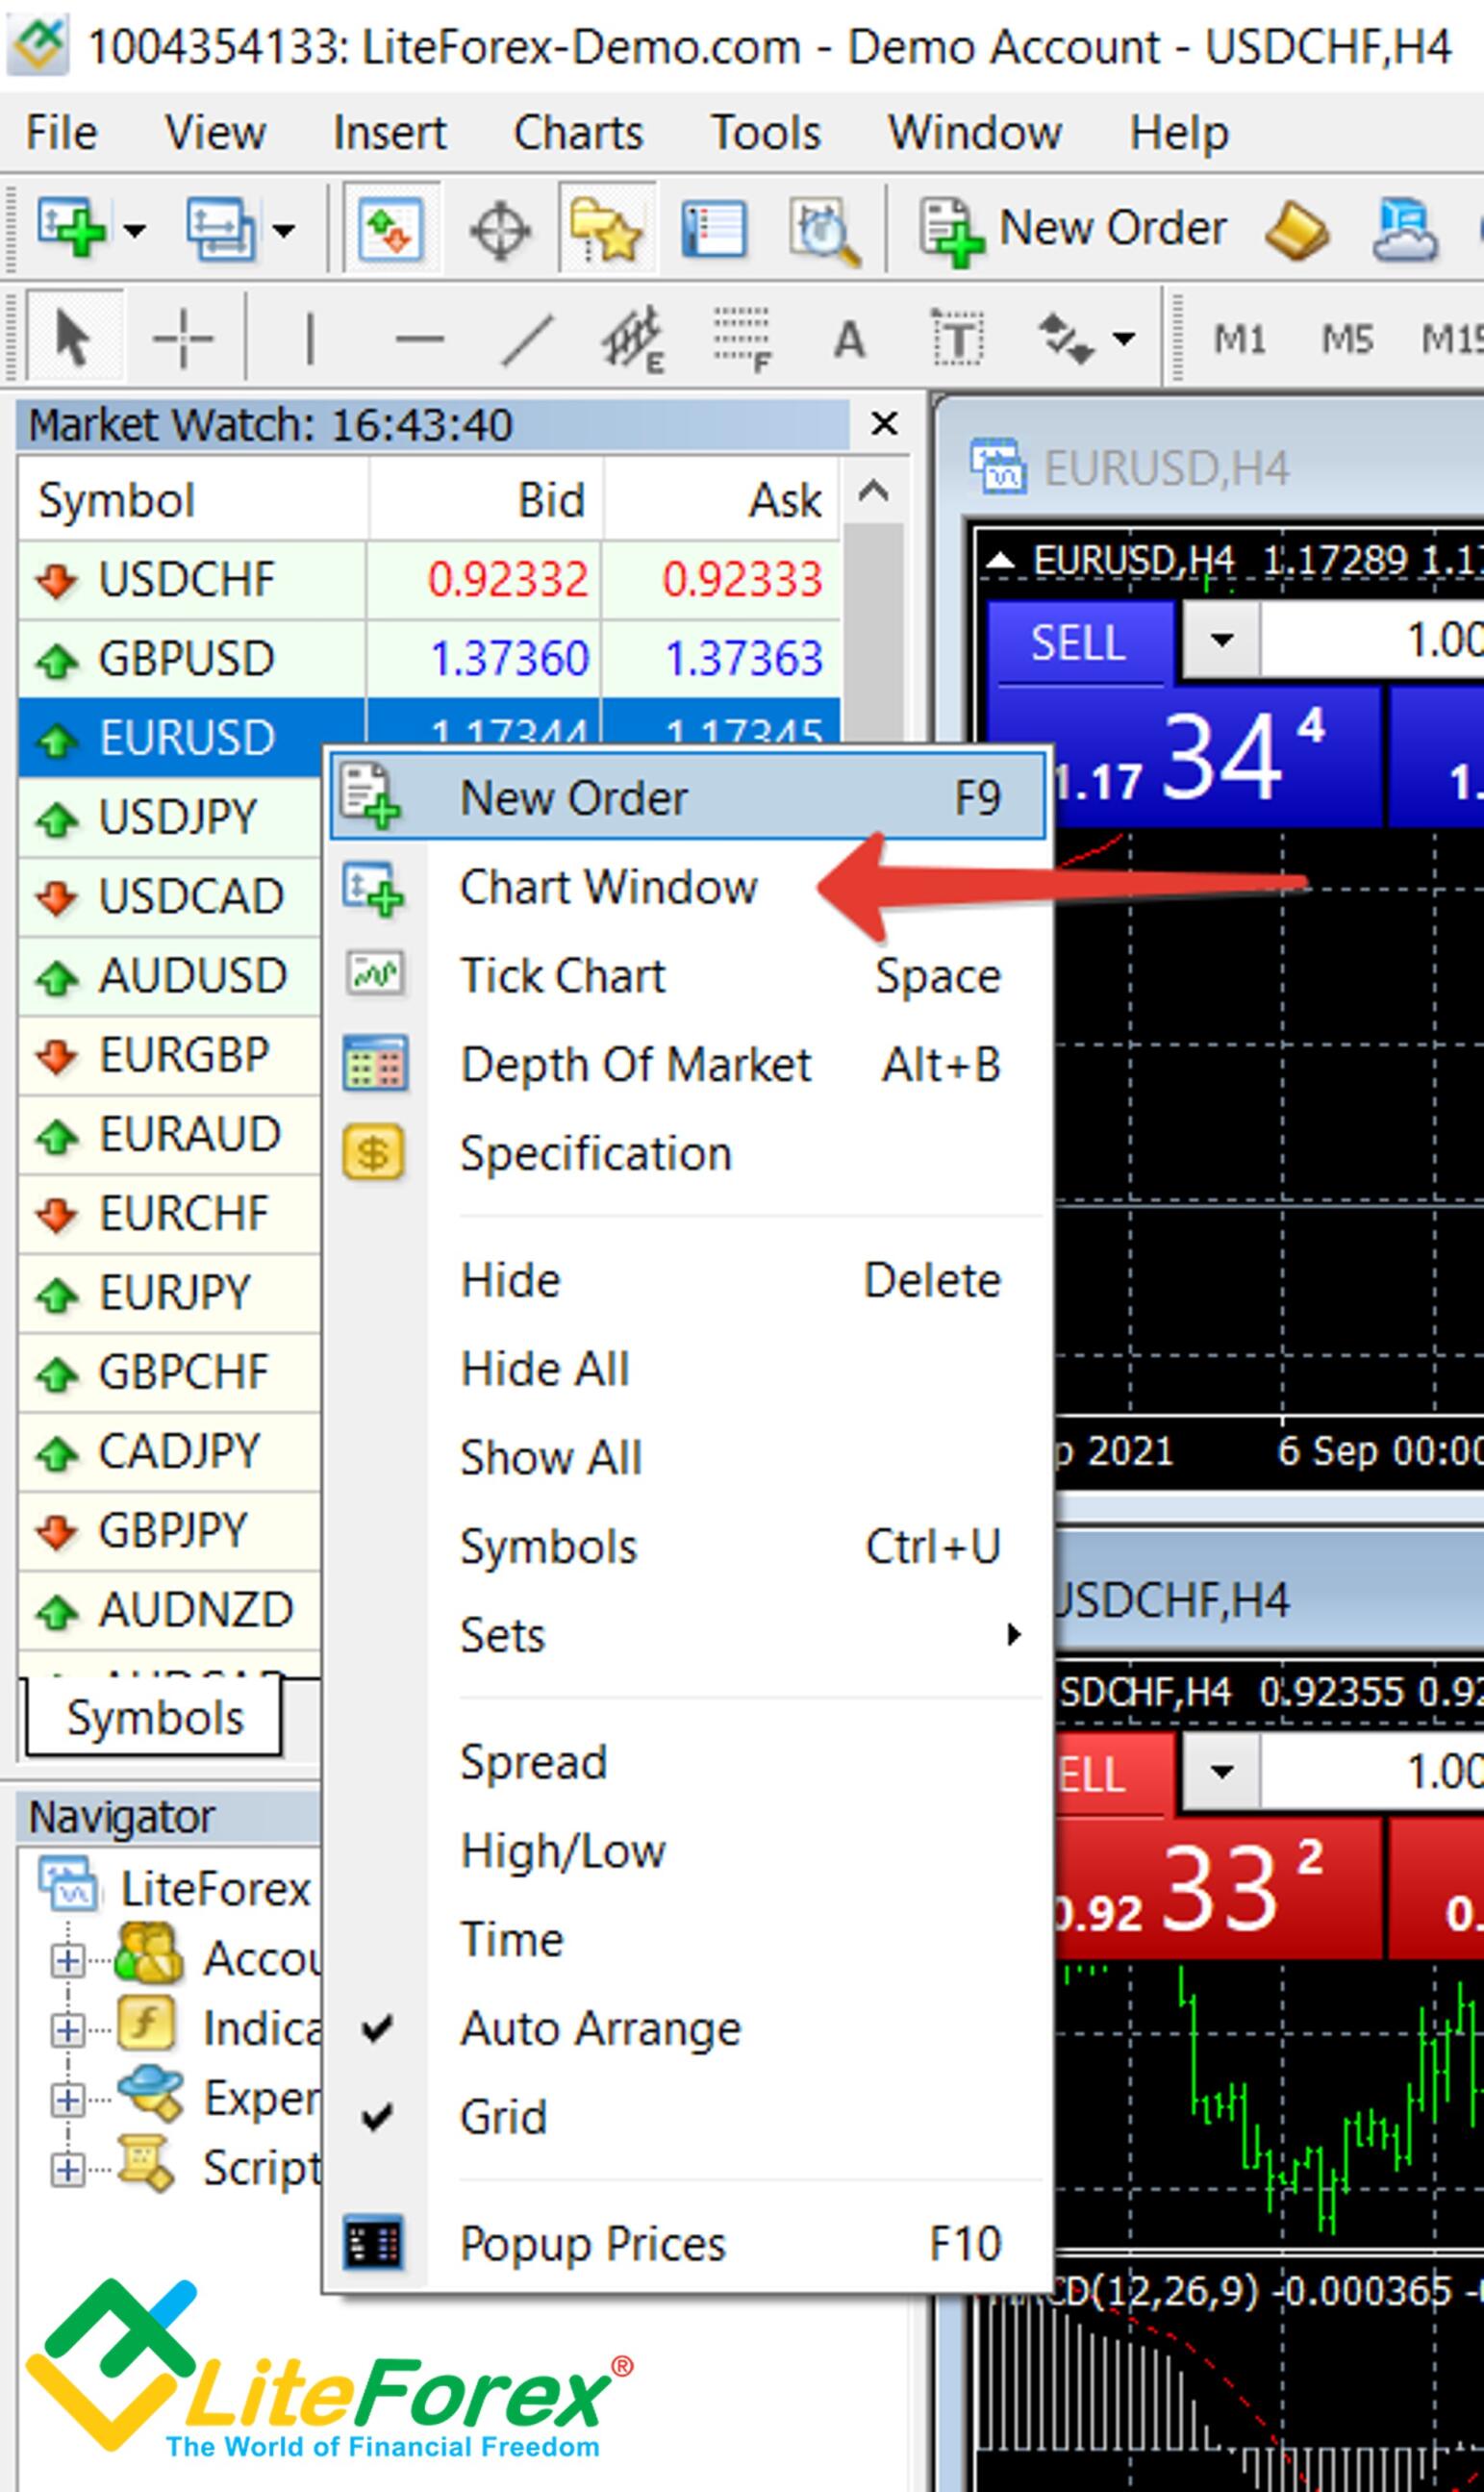
1. Right-click on a trading instrument in the "Symbols" window and then on the "Chart window" button.
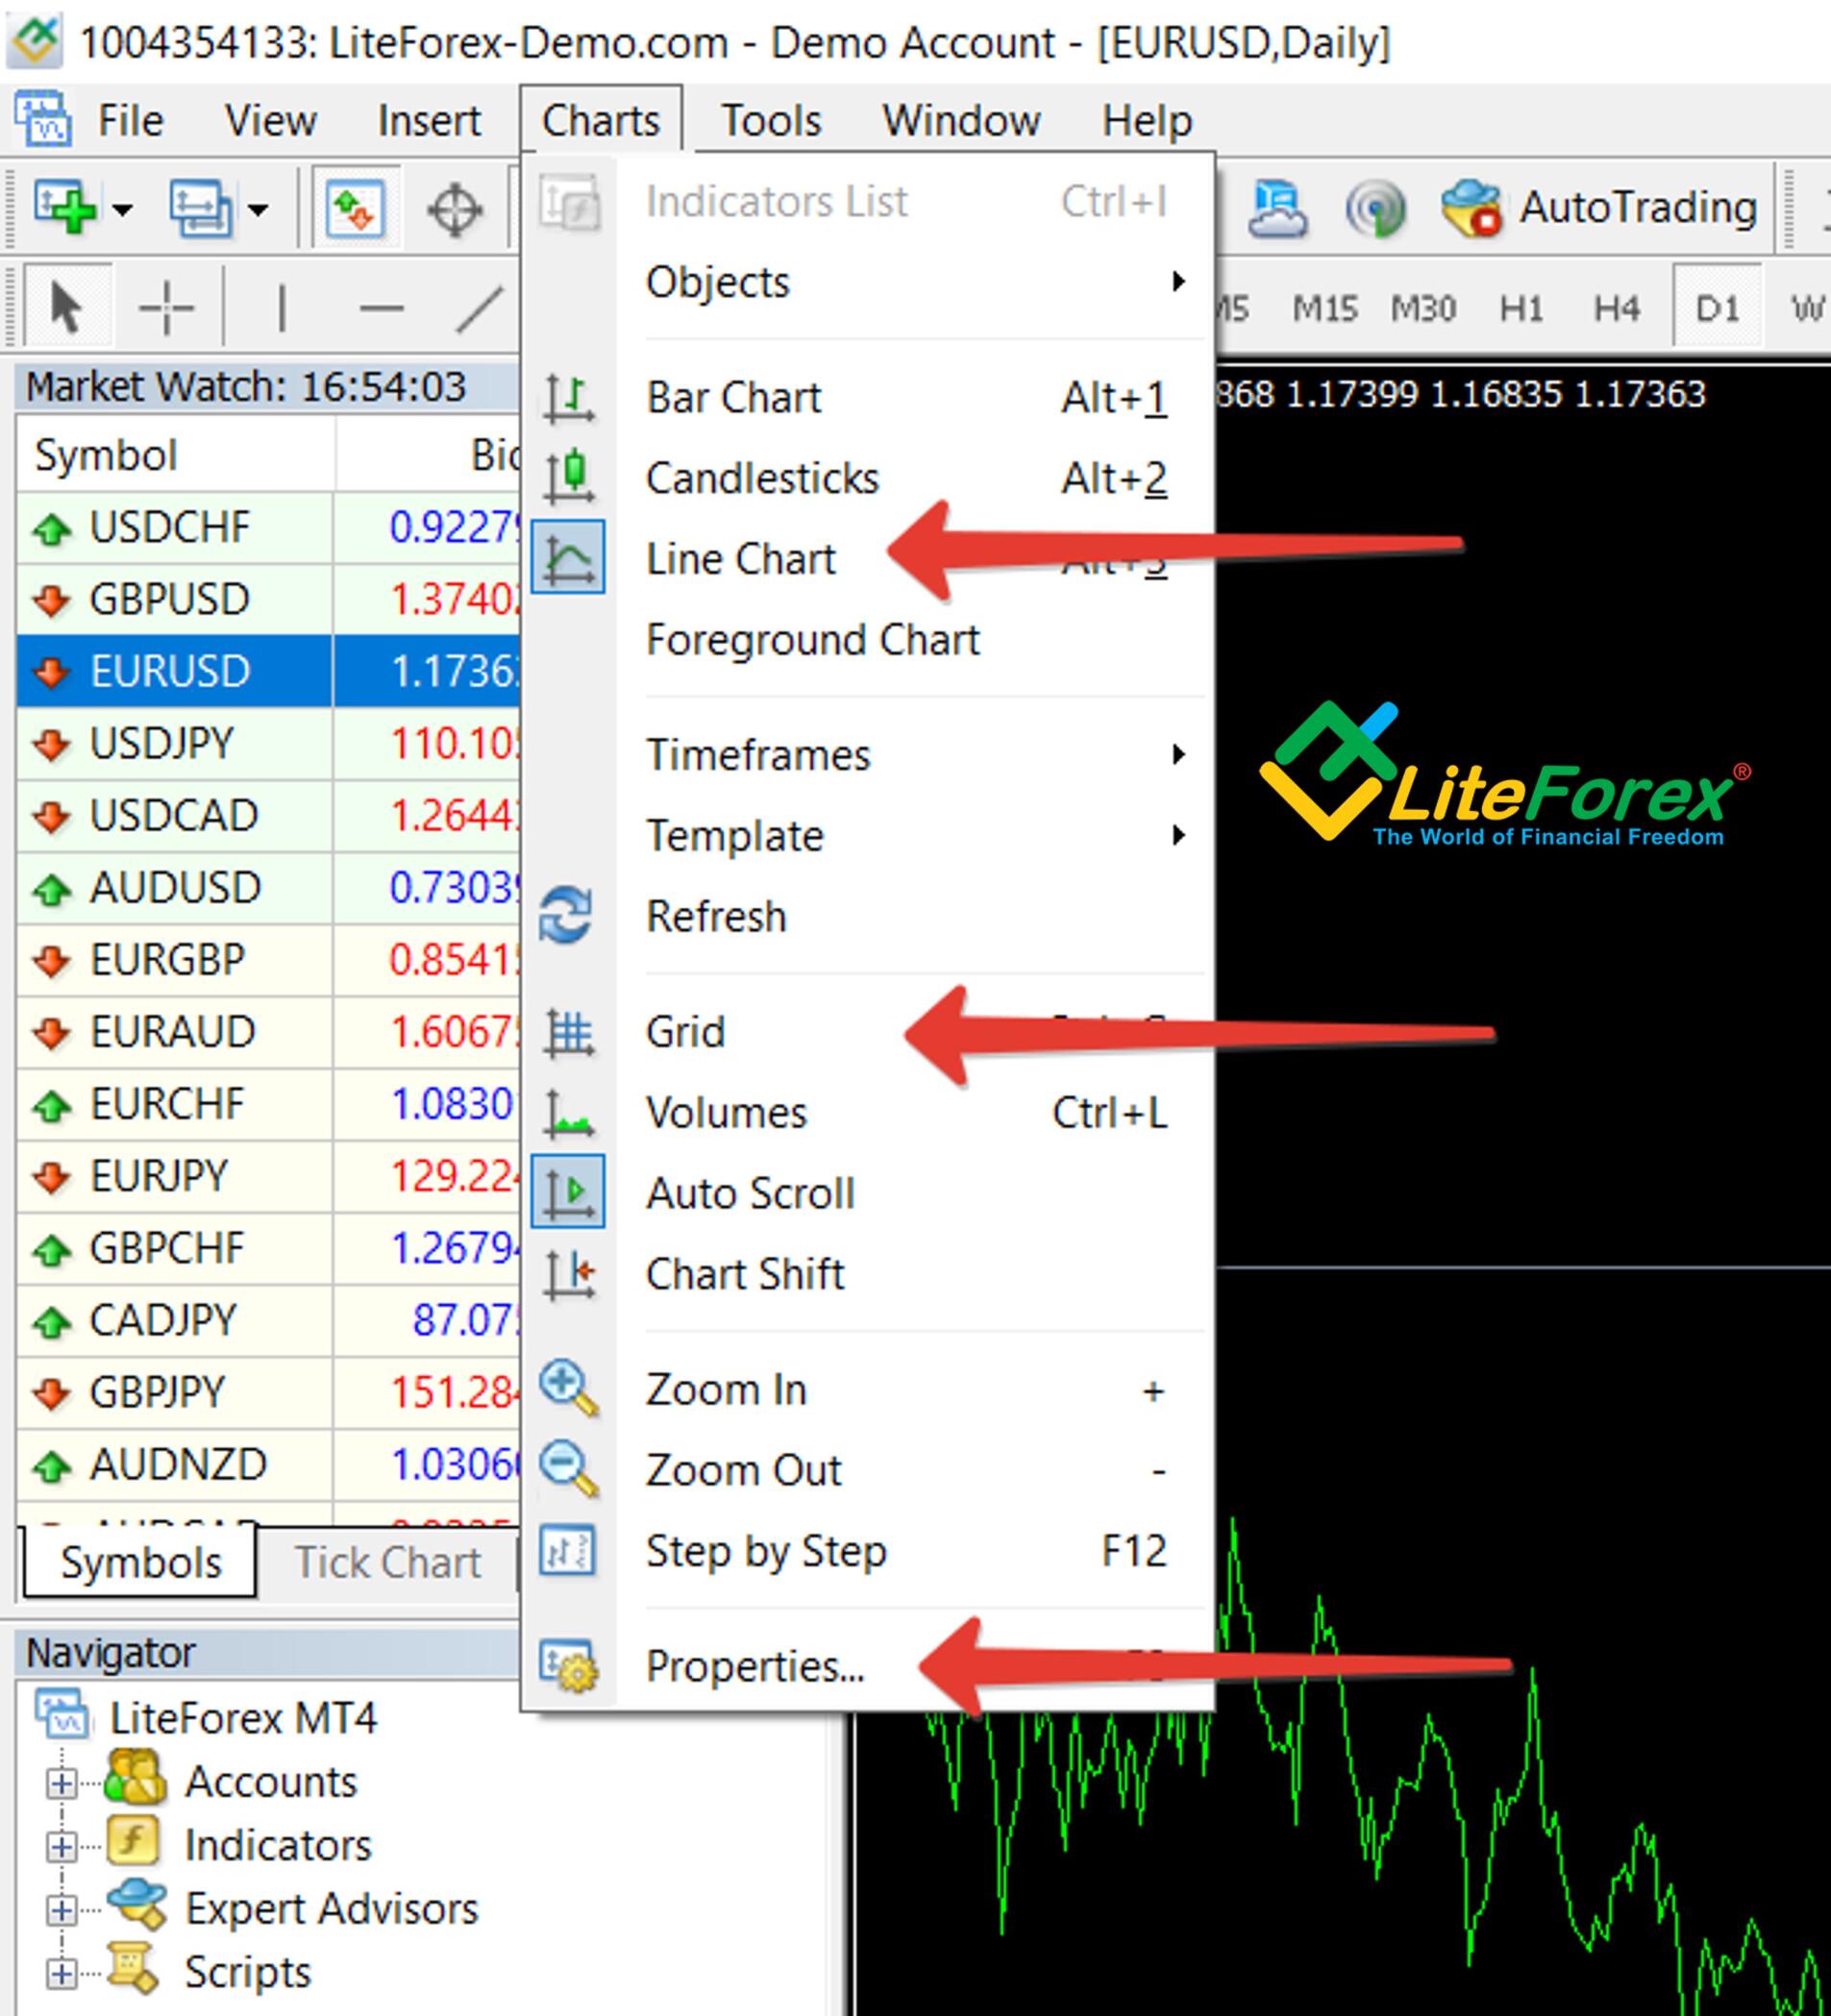
2. Then go to Charts, choose Line charts, enable Grid, and go to Properties.
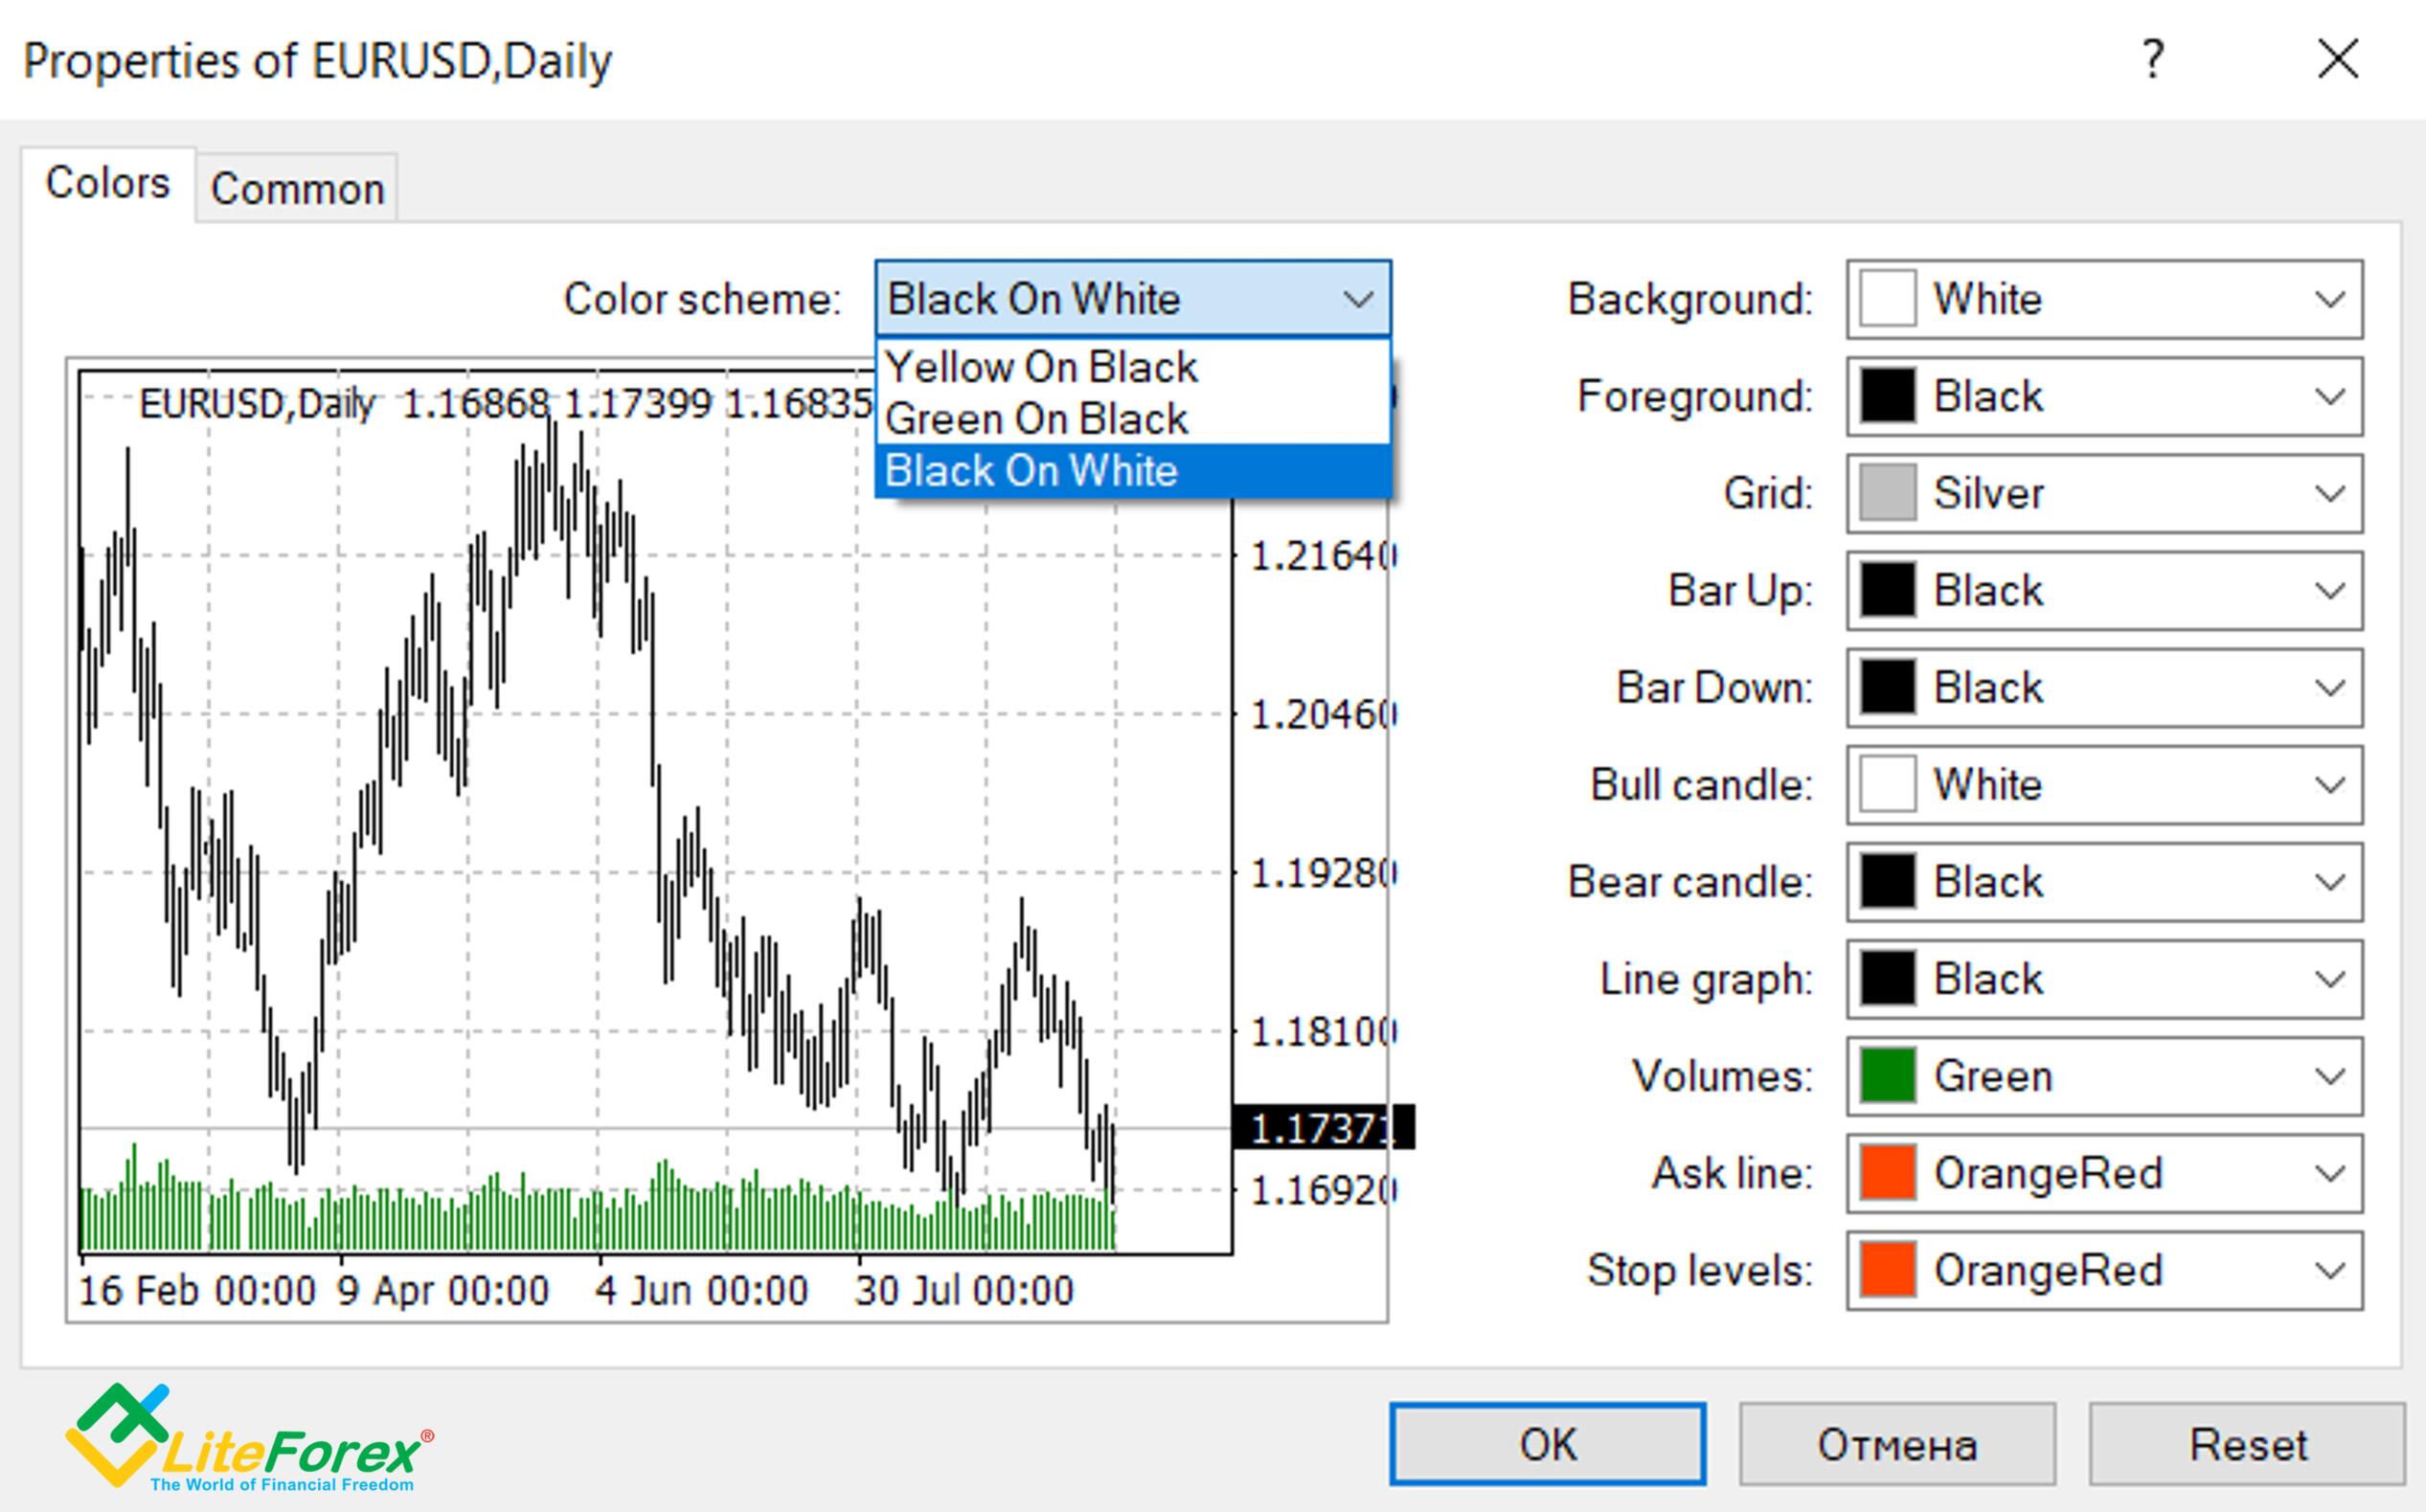
3. This step is voluntary, but I don't recommend skipping it. Choose the Black on White color scheme.
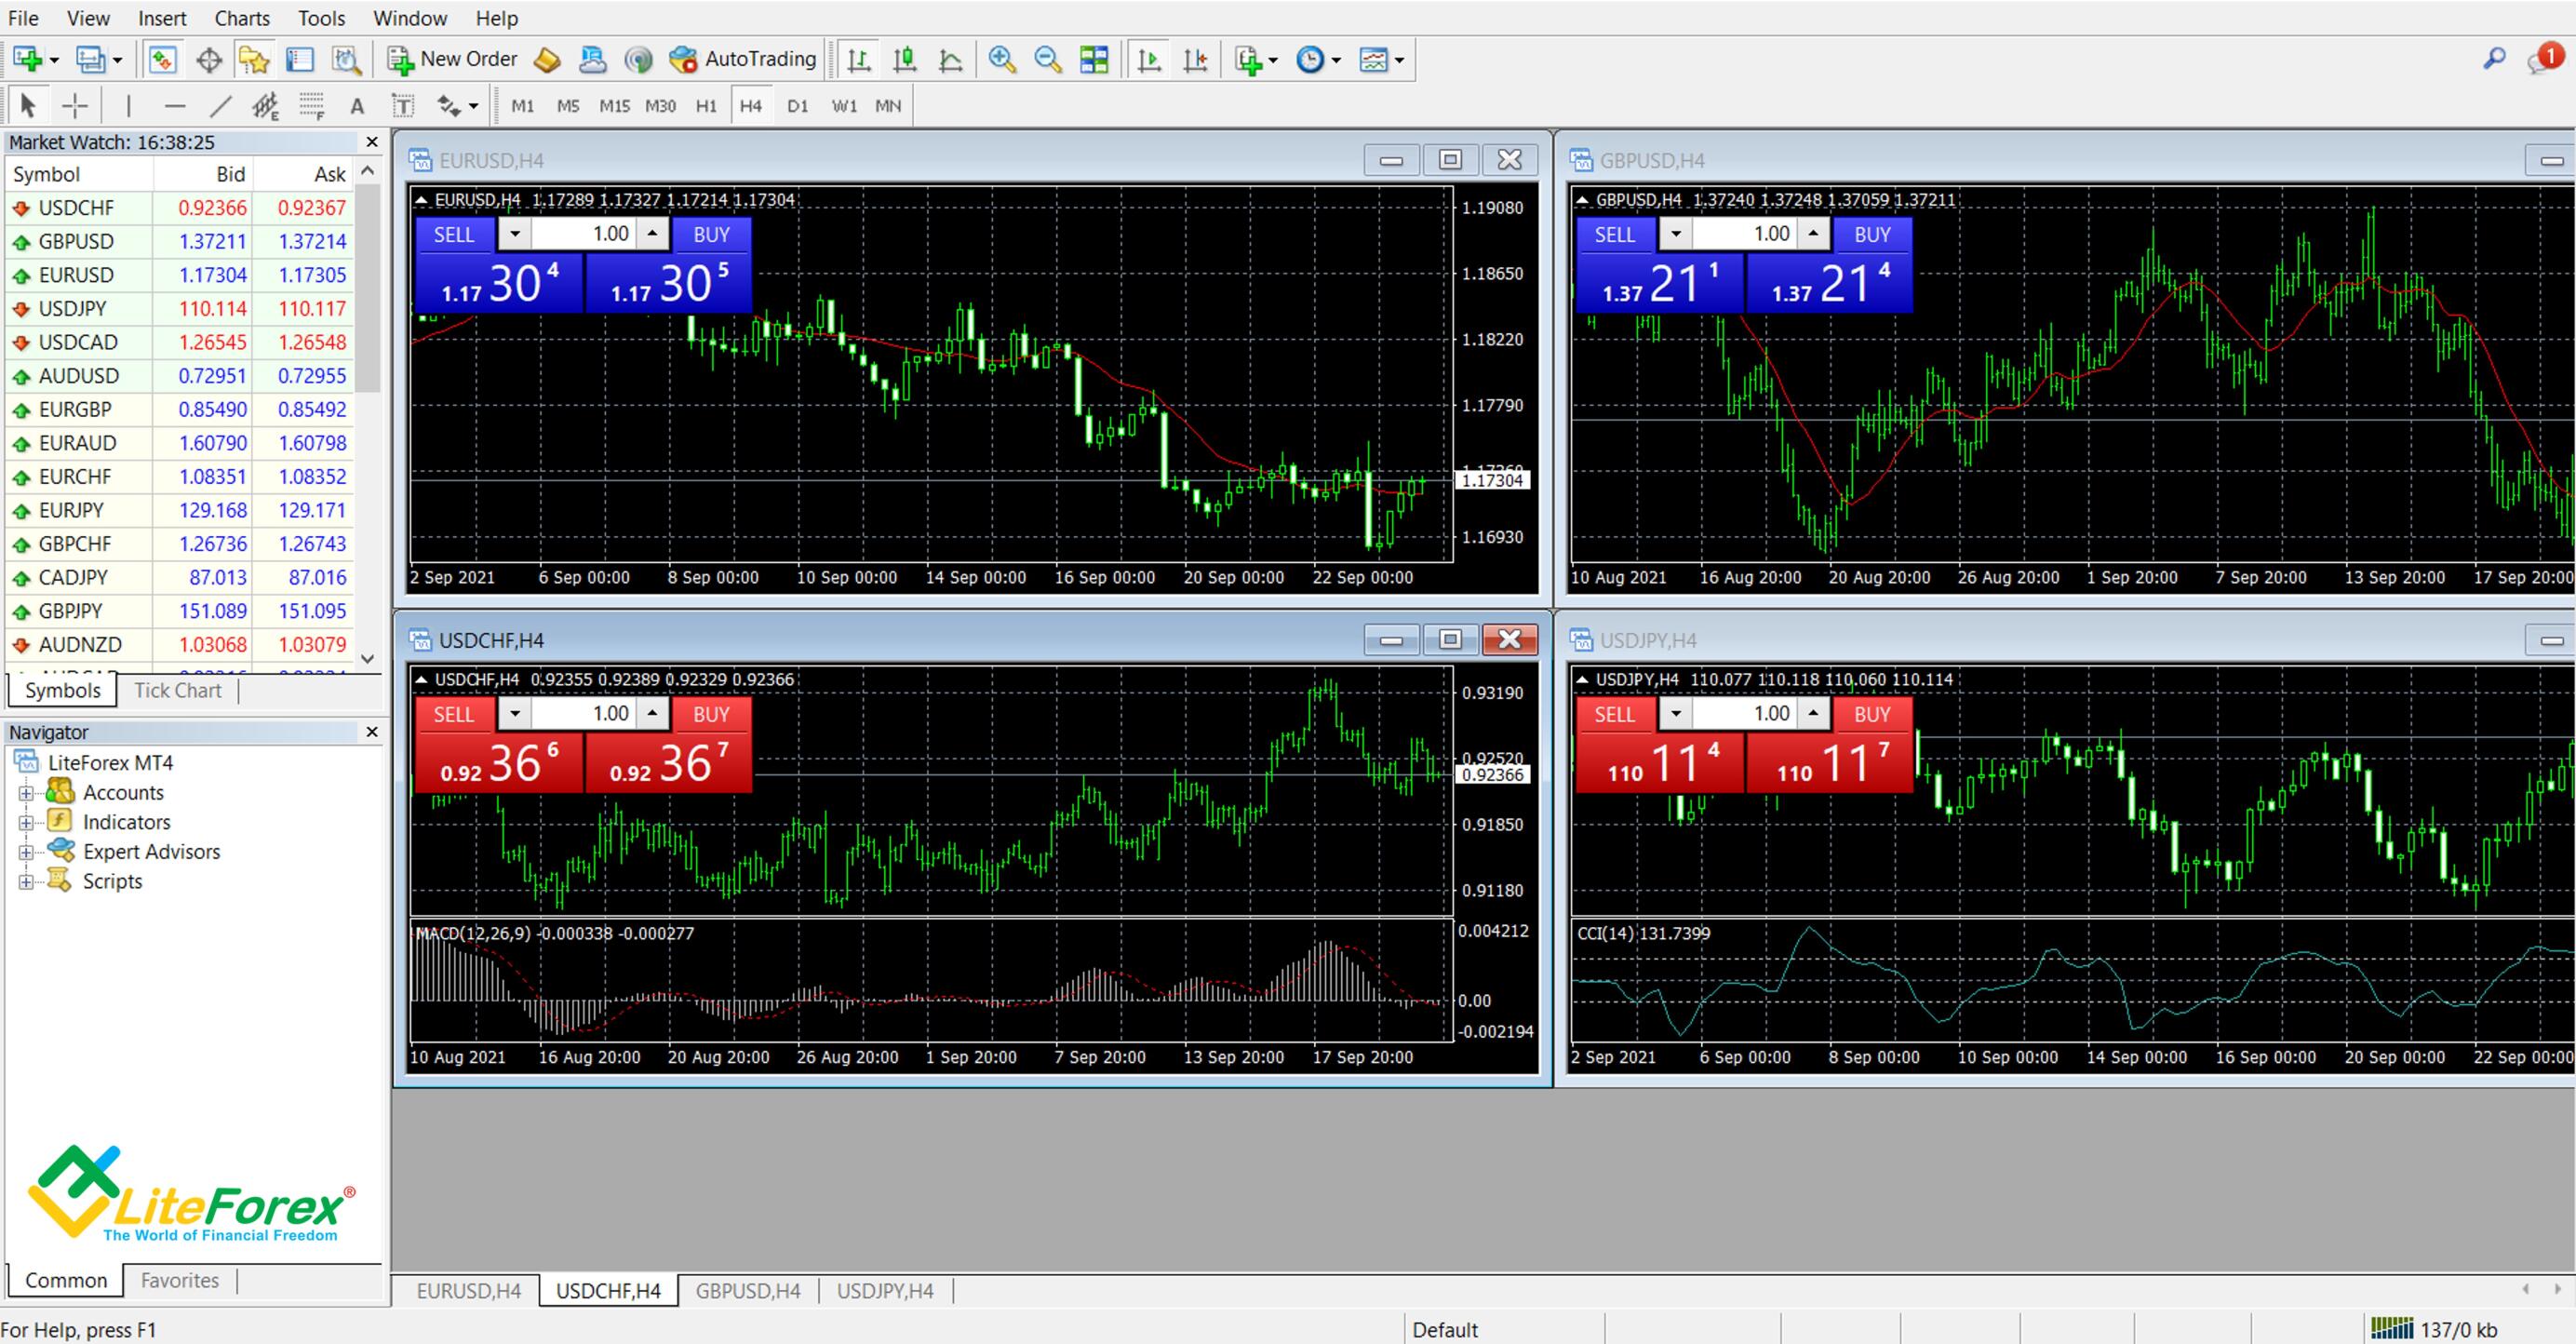
4. Then, use the previous instructions to draw support and resistance lines on the Forex platform. Unfortunately, MT4 doesn't provide the rays option, so we need to use simple horizontal lines. I've ticked each peak to see the tops the levels relate to. To mark dynamic levels, I've used trend lines.
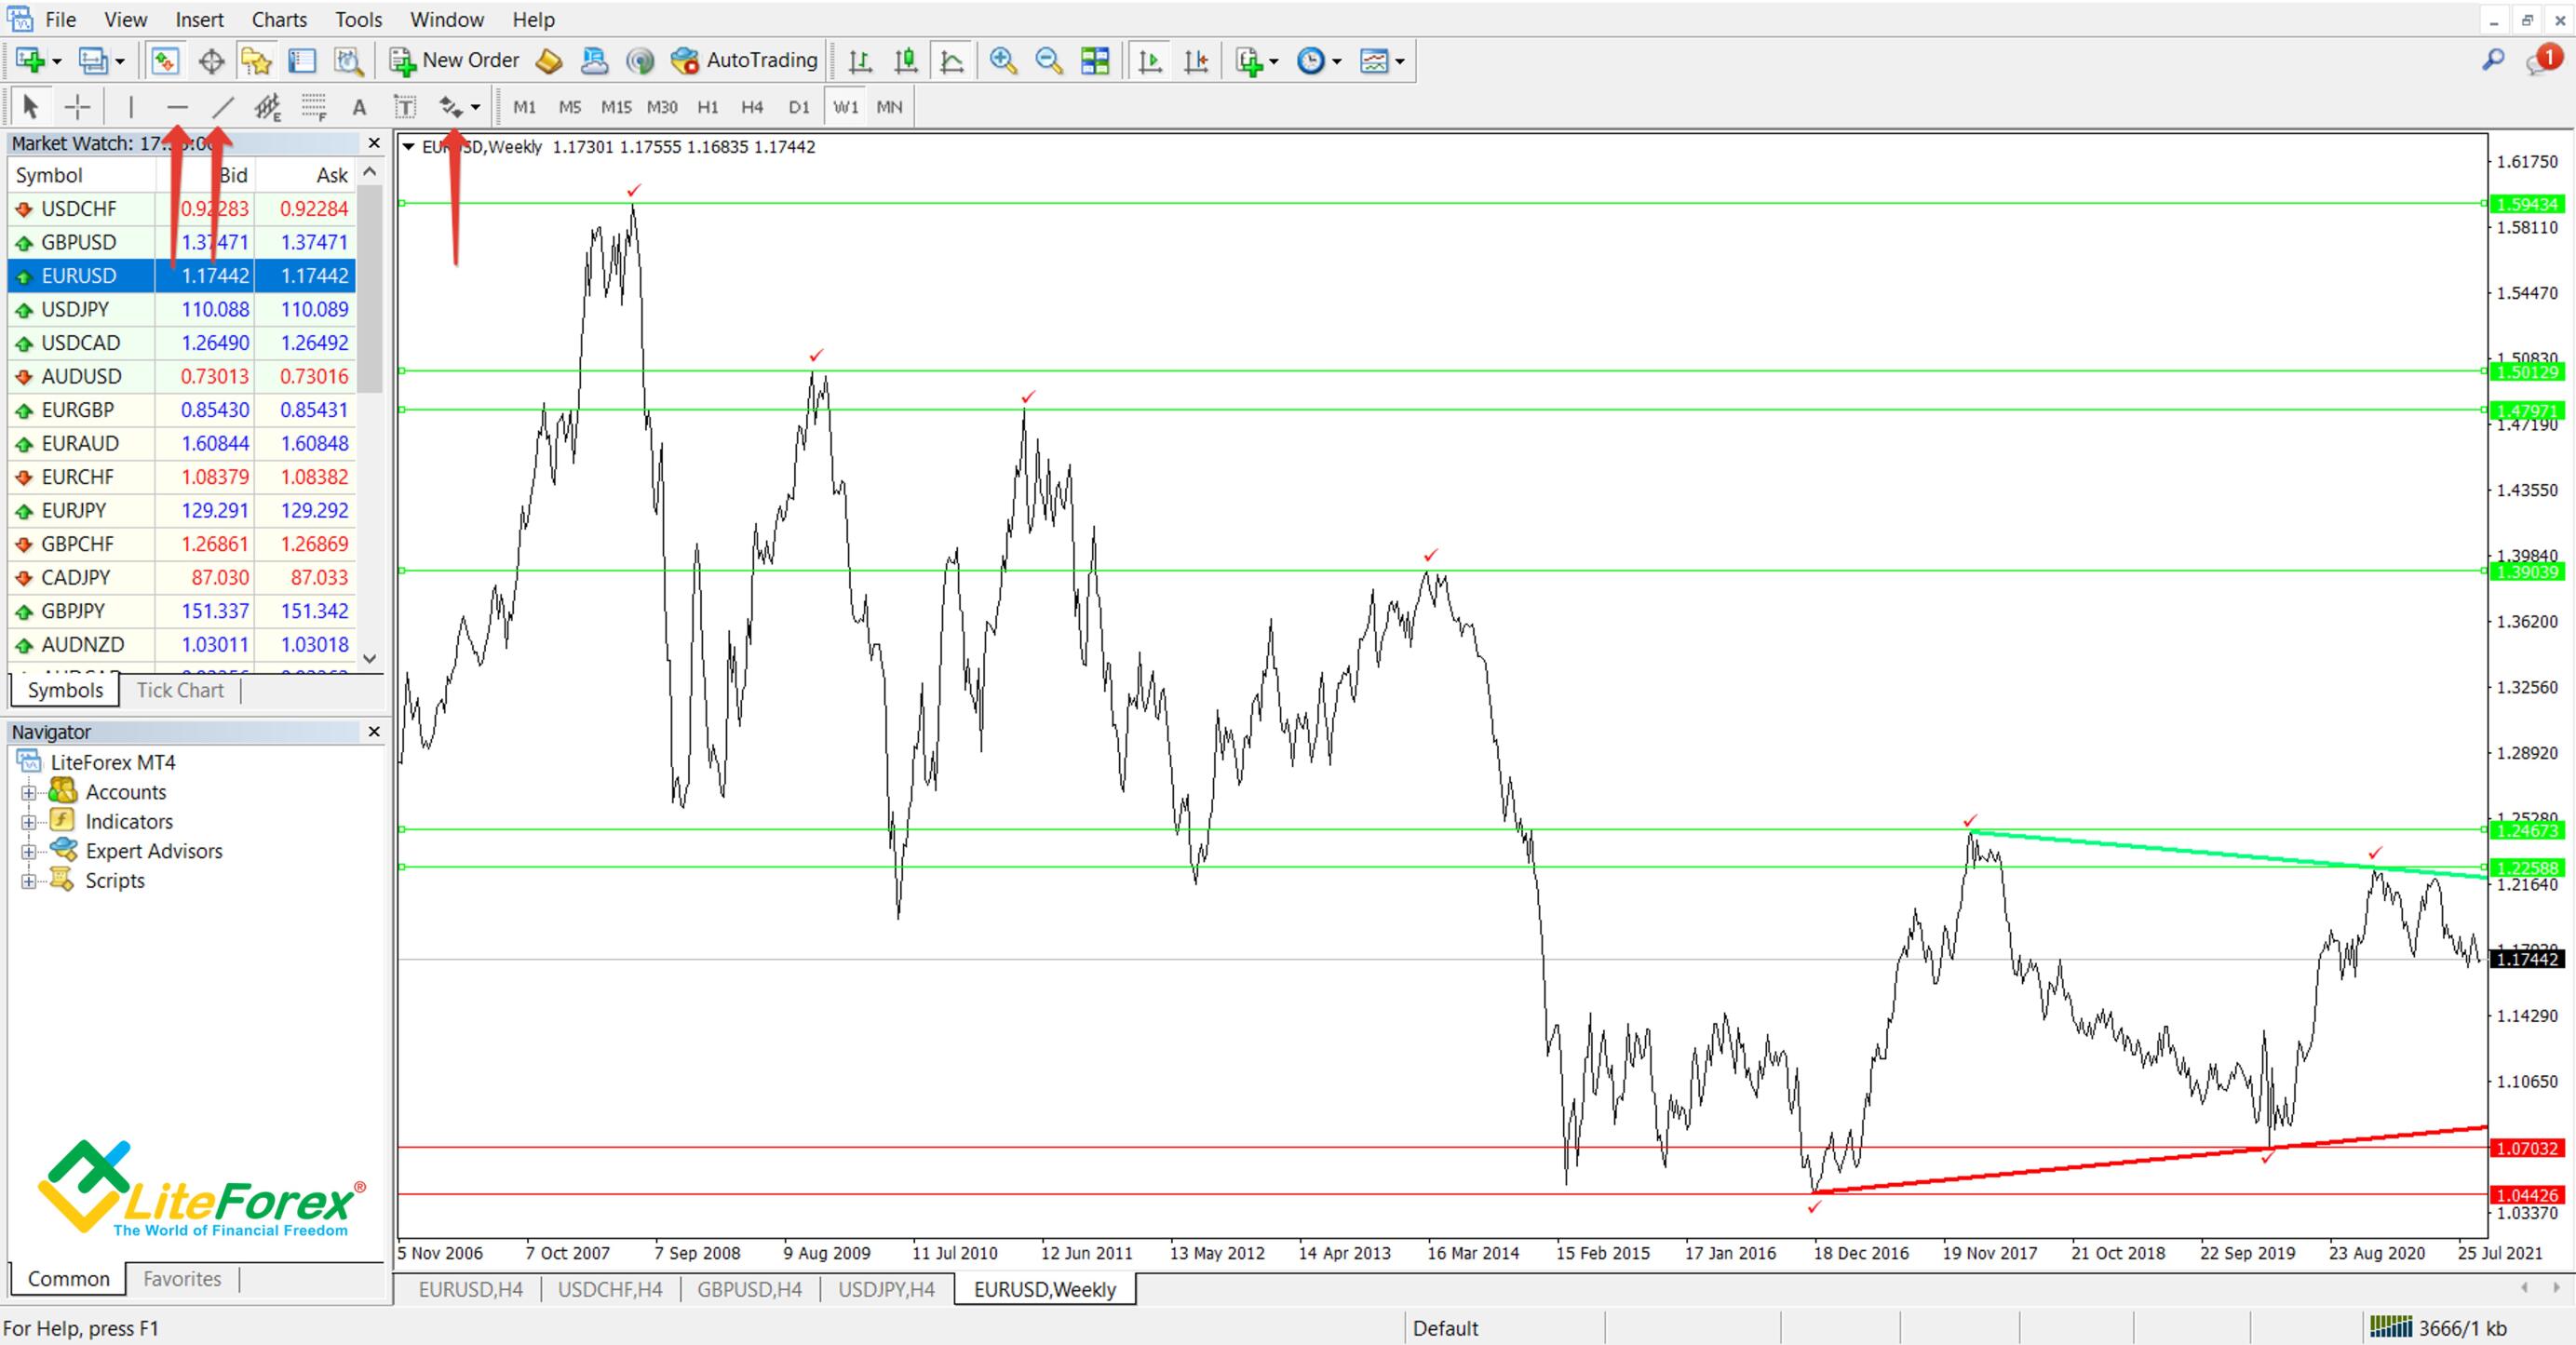
The tabs containing horizontal/trend lines and extremum labels are marked with red arrows in the picture above.
MT5 Support and Resistance Guide
Support or resistance levels are drawn in the same level in MT5 as they are drawn in MT4. The interfaces are only a little different, so I will repeat the steps:
Choose your trading instrument.
Turn the price chart to lines and hide unnecessary tools. We only need the price line.
Choose a convenient color scheme. I recommend using black on white.
Plot a horizontal line through extremums. To see the starting points clearer, mark the peaks.
- Draw inclined lines through the latest peaks to identify dynamic support and resistance levels.
LiteFinance platform Support and Resistance Guide
To draw a support or resistance level on a chart on LiteFinance's platform, you need to click on "Trade" on the left, choose a trading instrument and open its chart with a single click of the left mouse button.
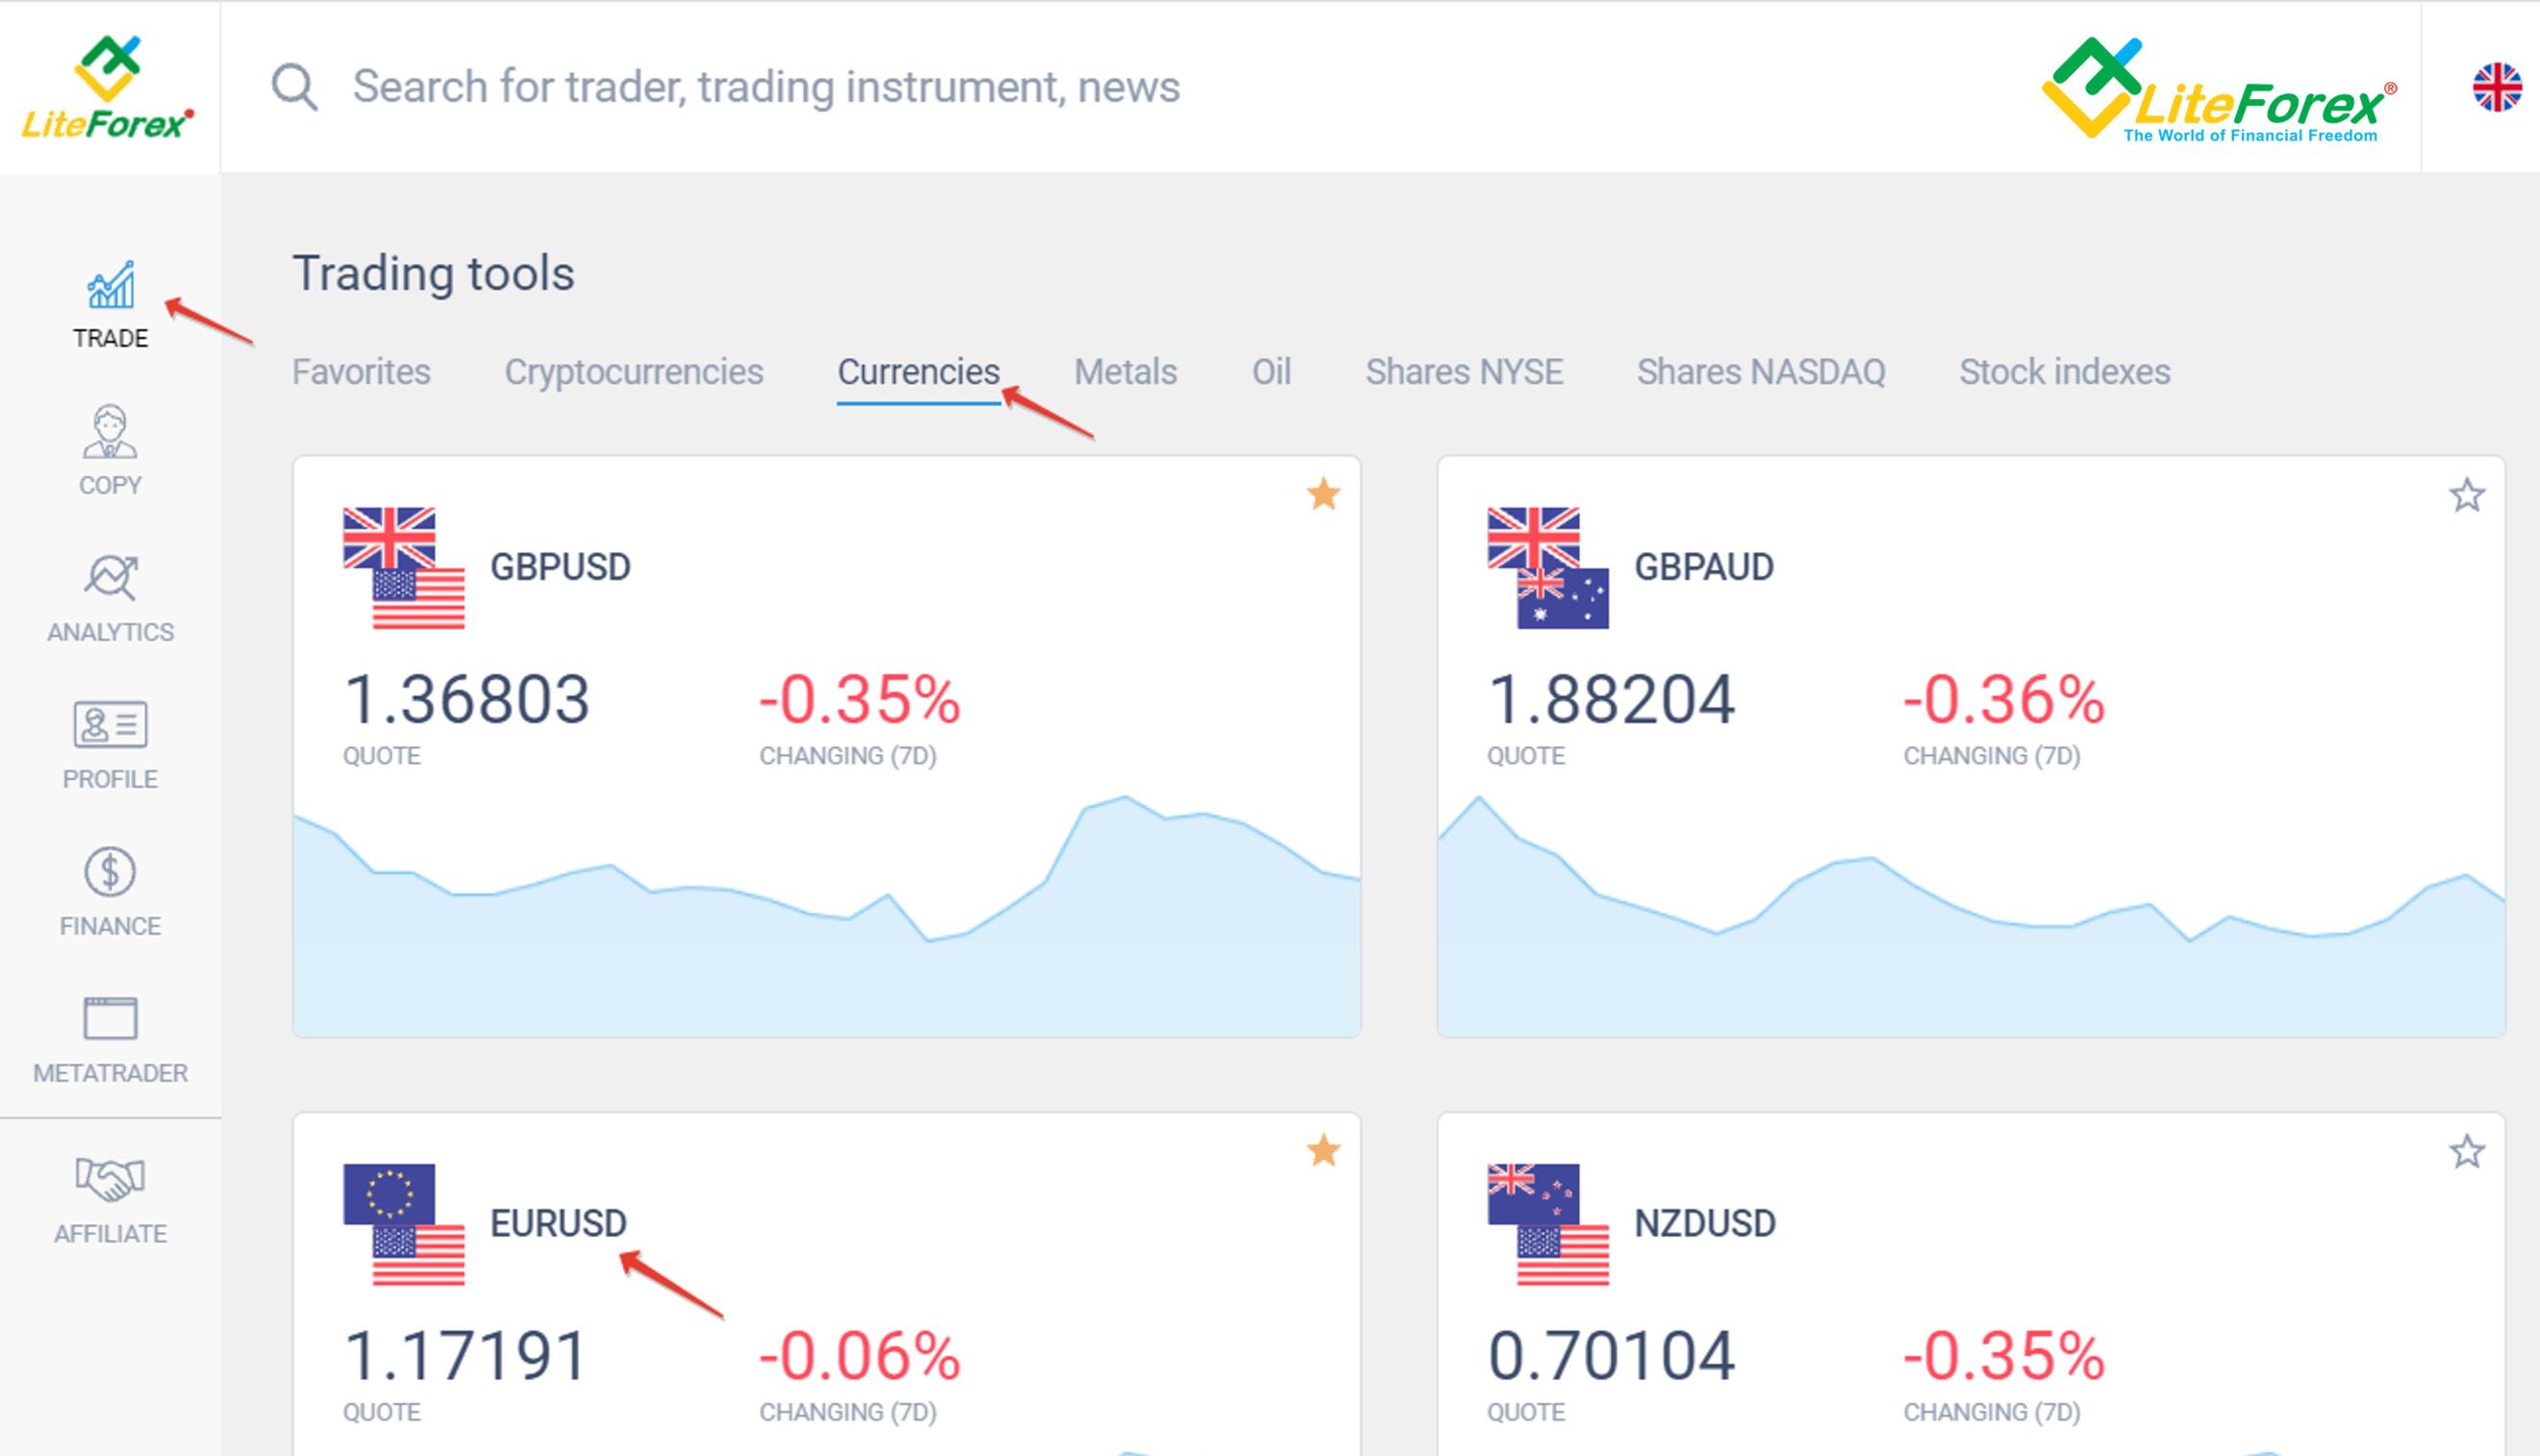
I've picked the EURUSD as an example. Once the chart opens, you'd better remove all extra elements. By default, there's a grid laid over the price chart, and there are trade volumes displayed below.
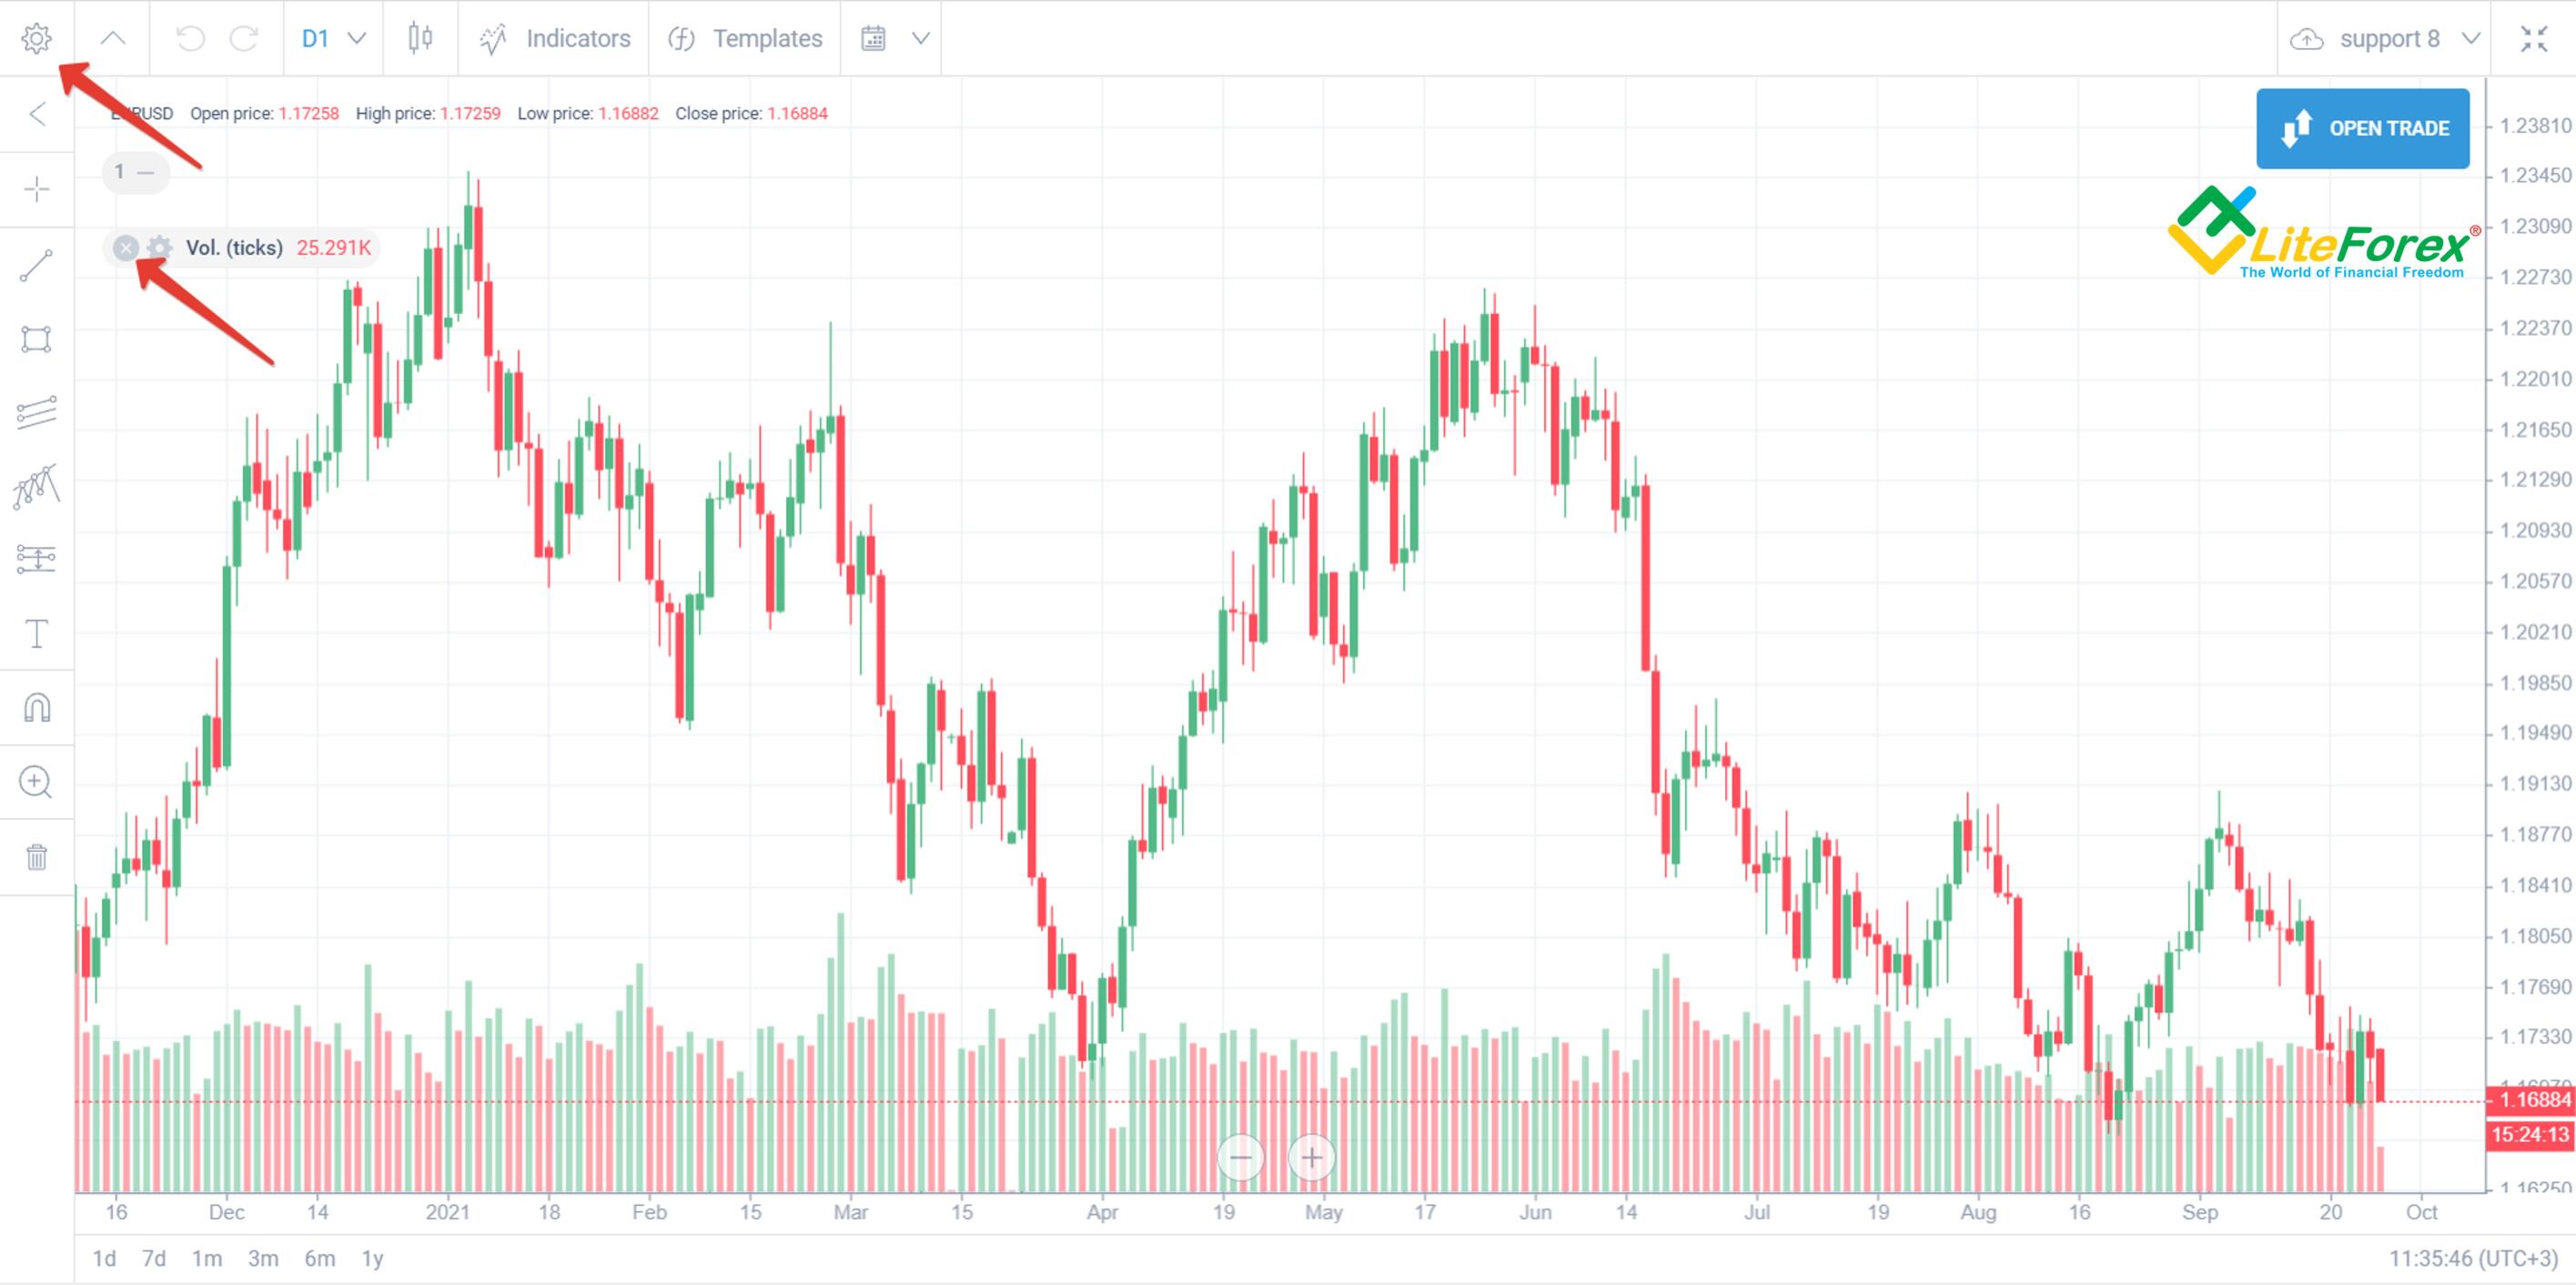
To remove the volume technical analysis indicator, just click the cross as displayed in the picture above. To remove the grid, click on the gear sign.
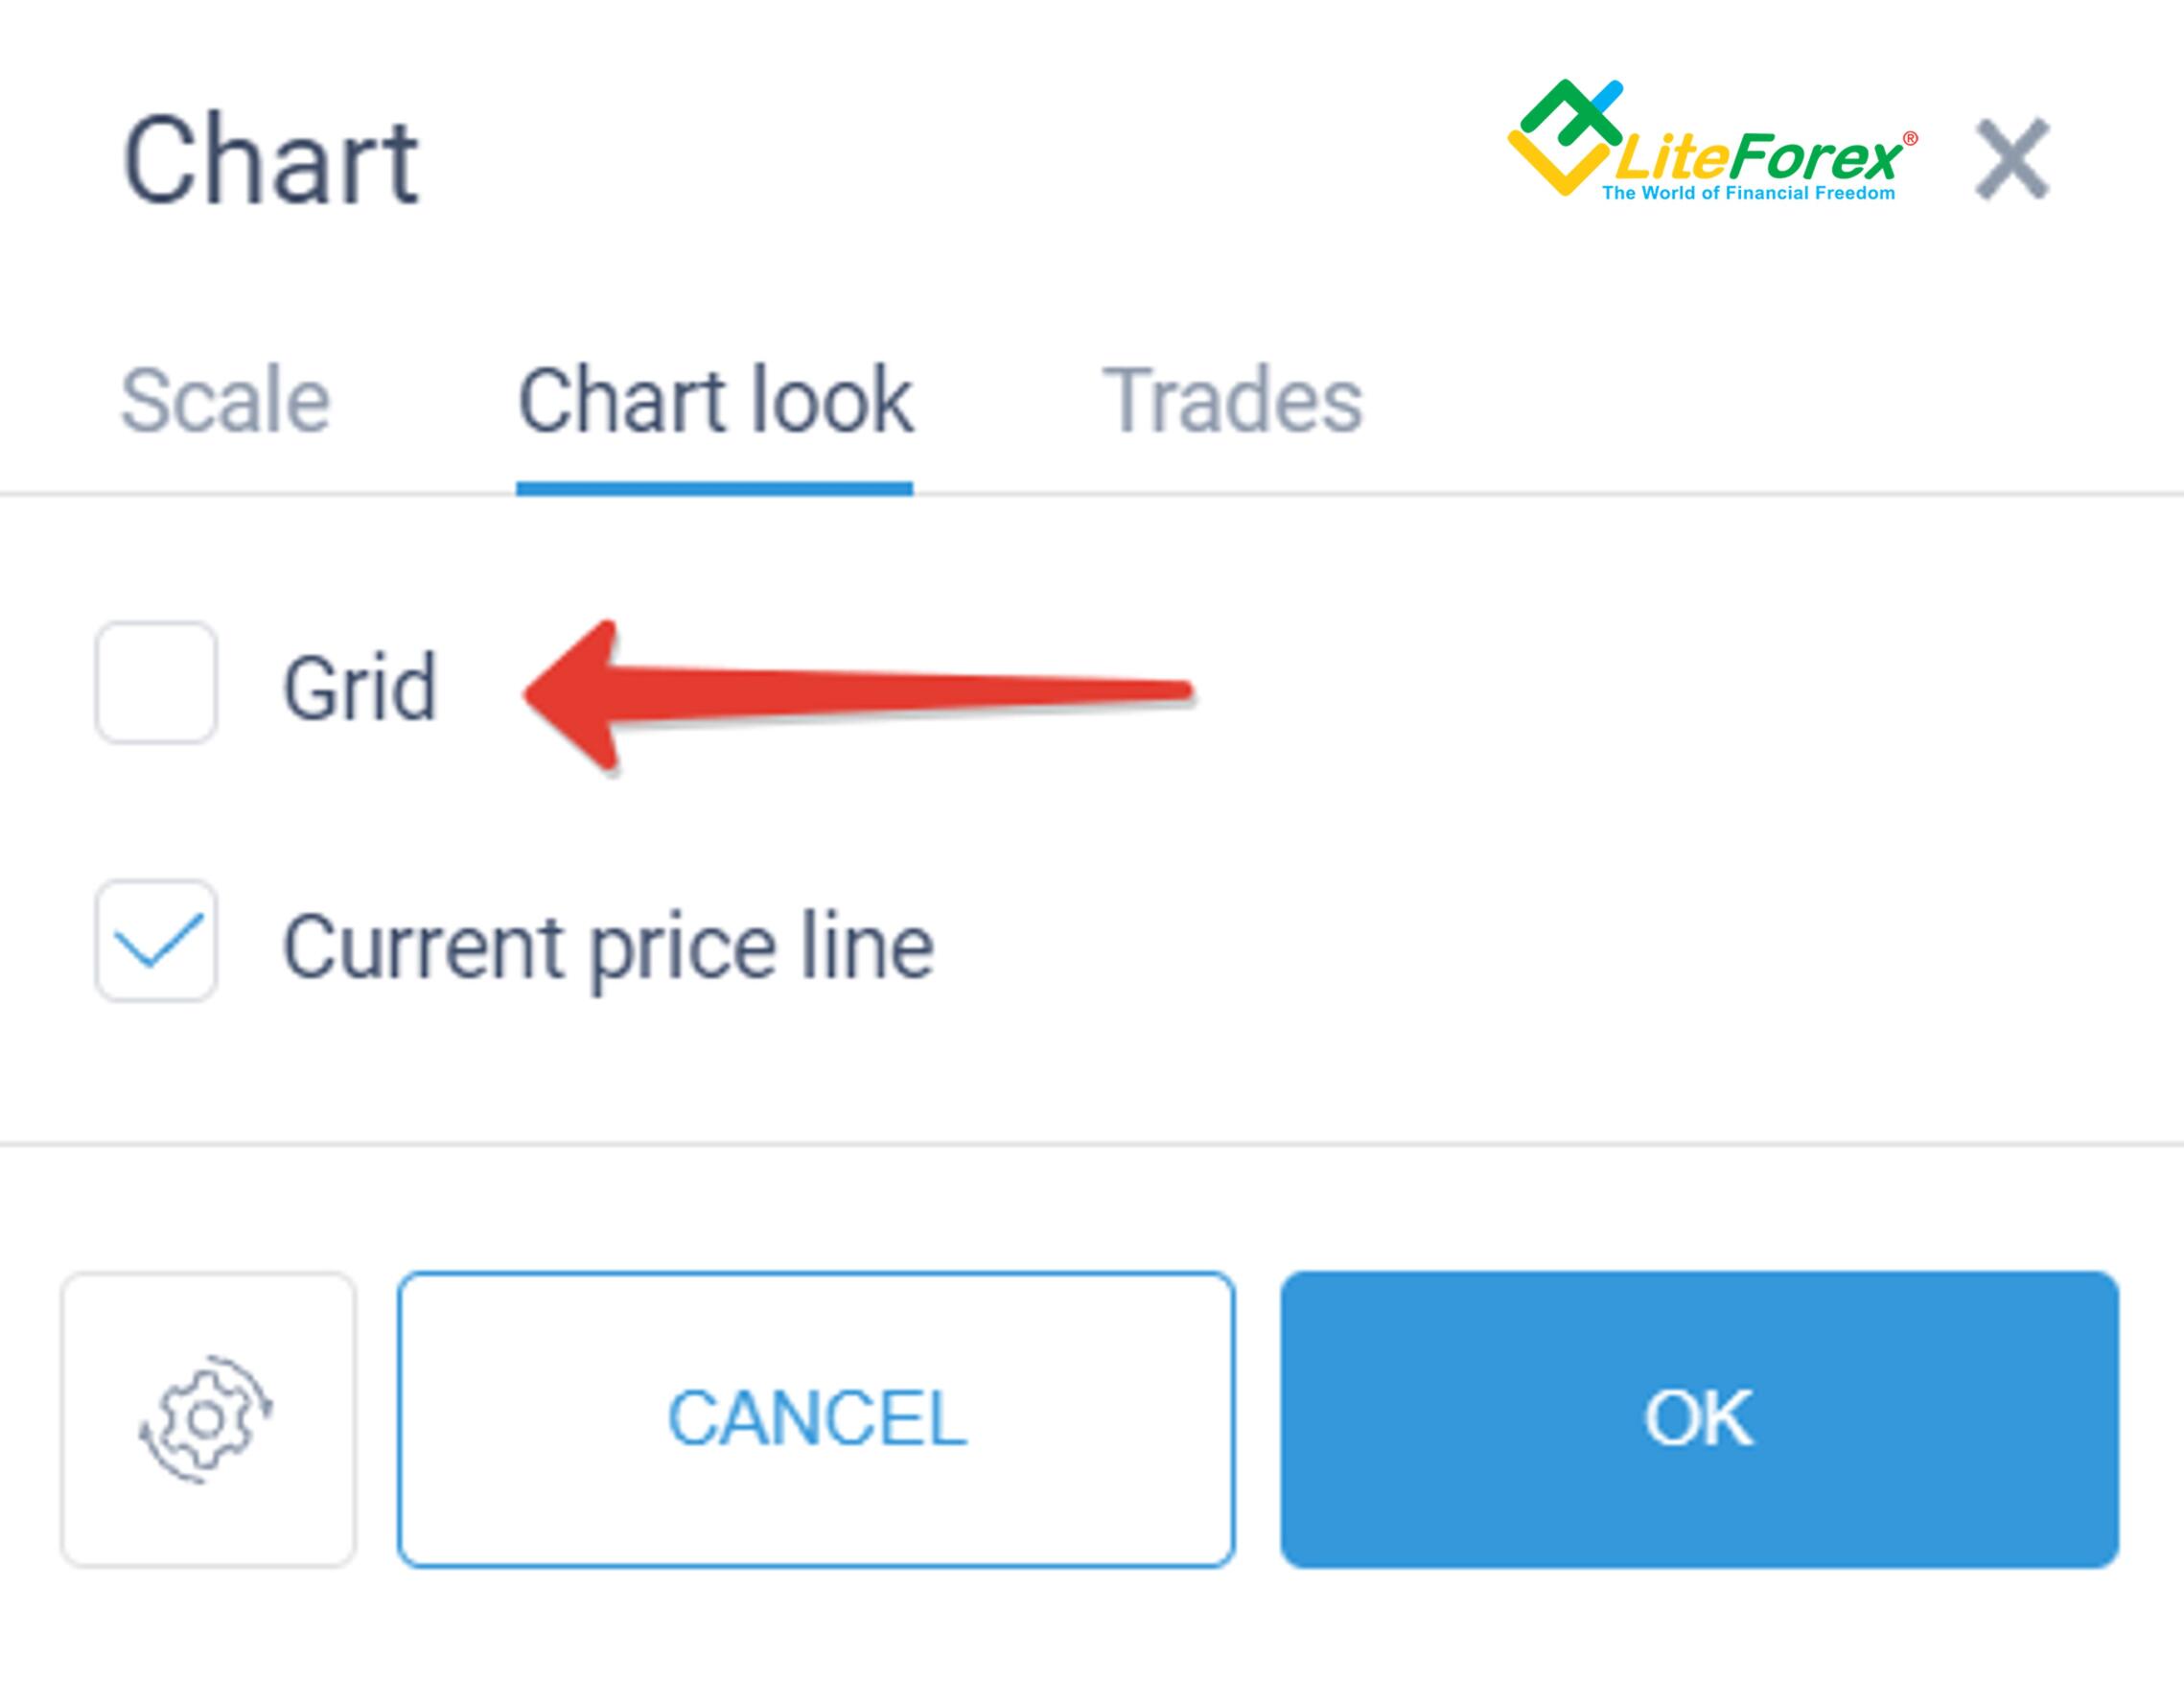
You'll have the settings window to untick the Grid field and click OK in the Chart Look tab. To start setting your support and resistance levels, choose your time frame and change the chart type to linear.
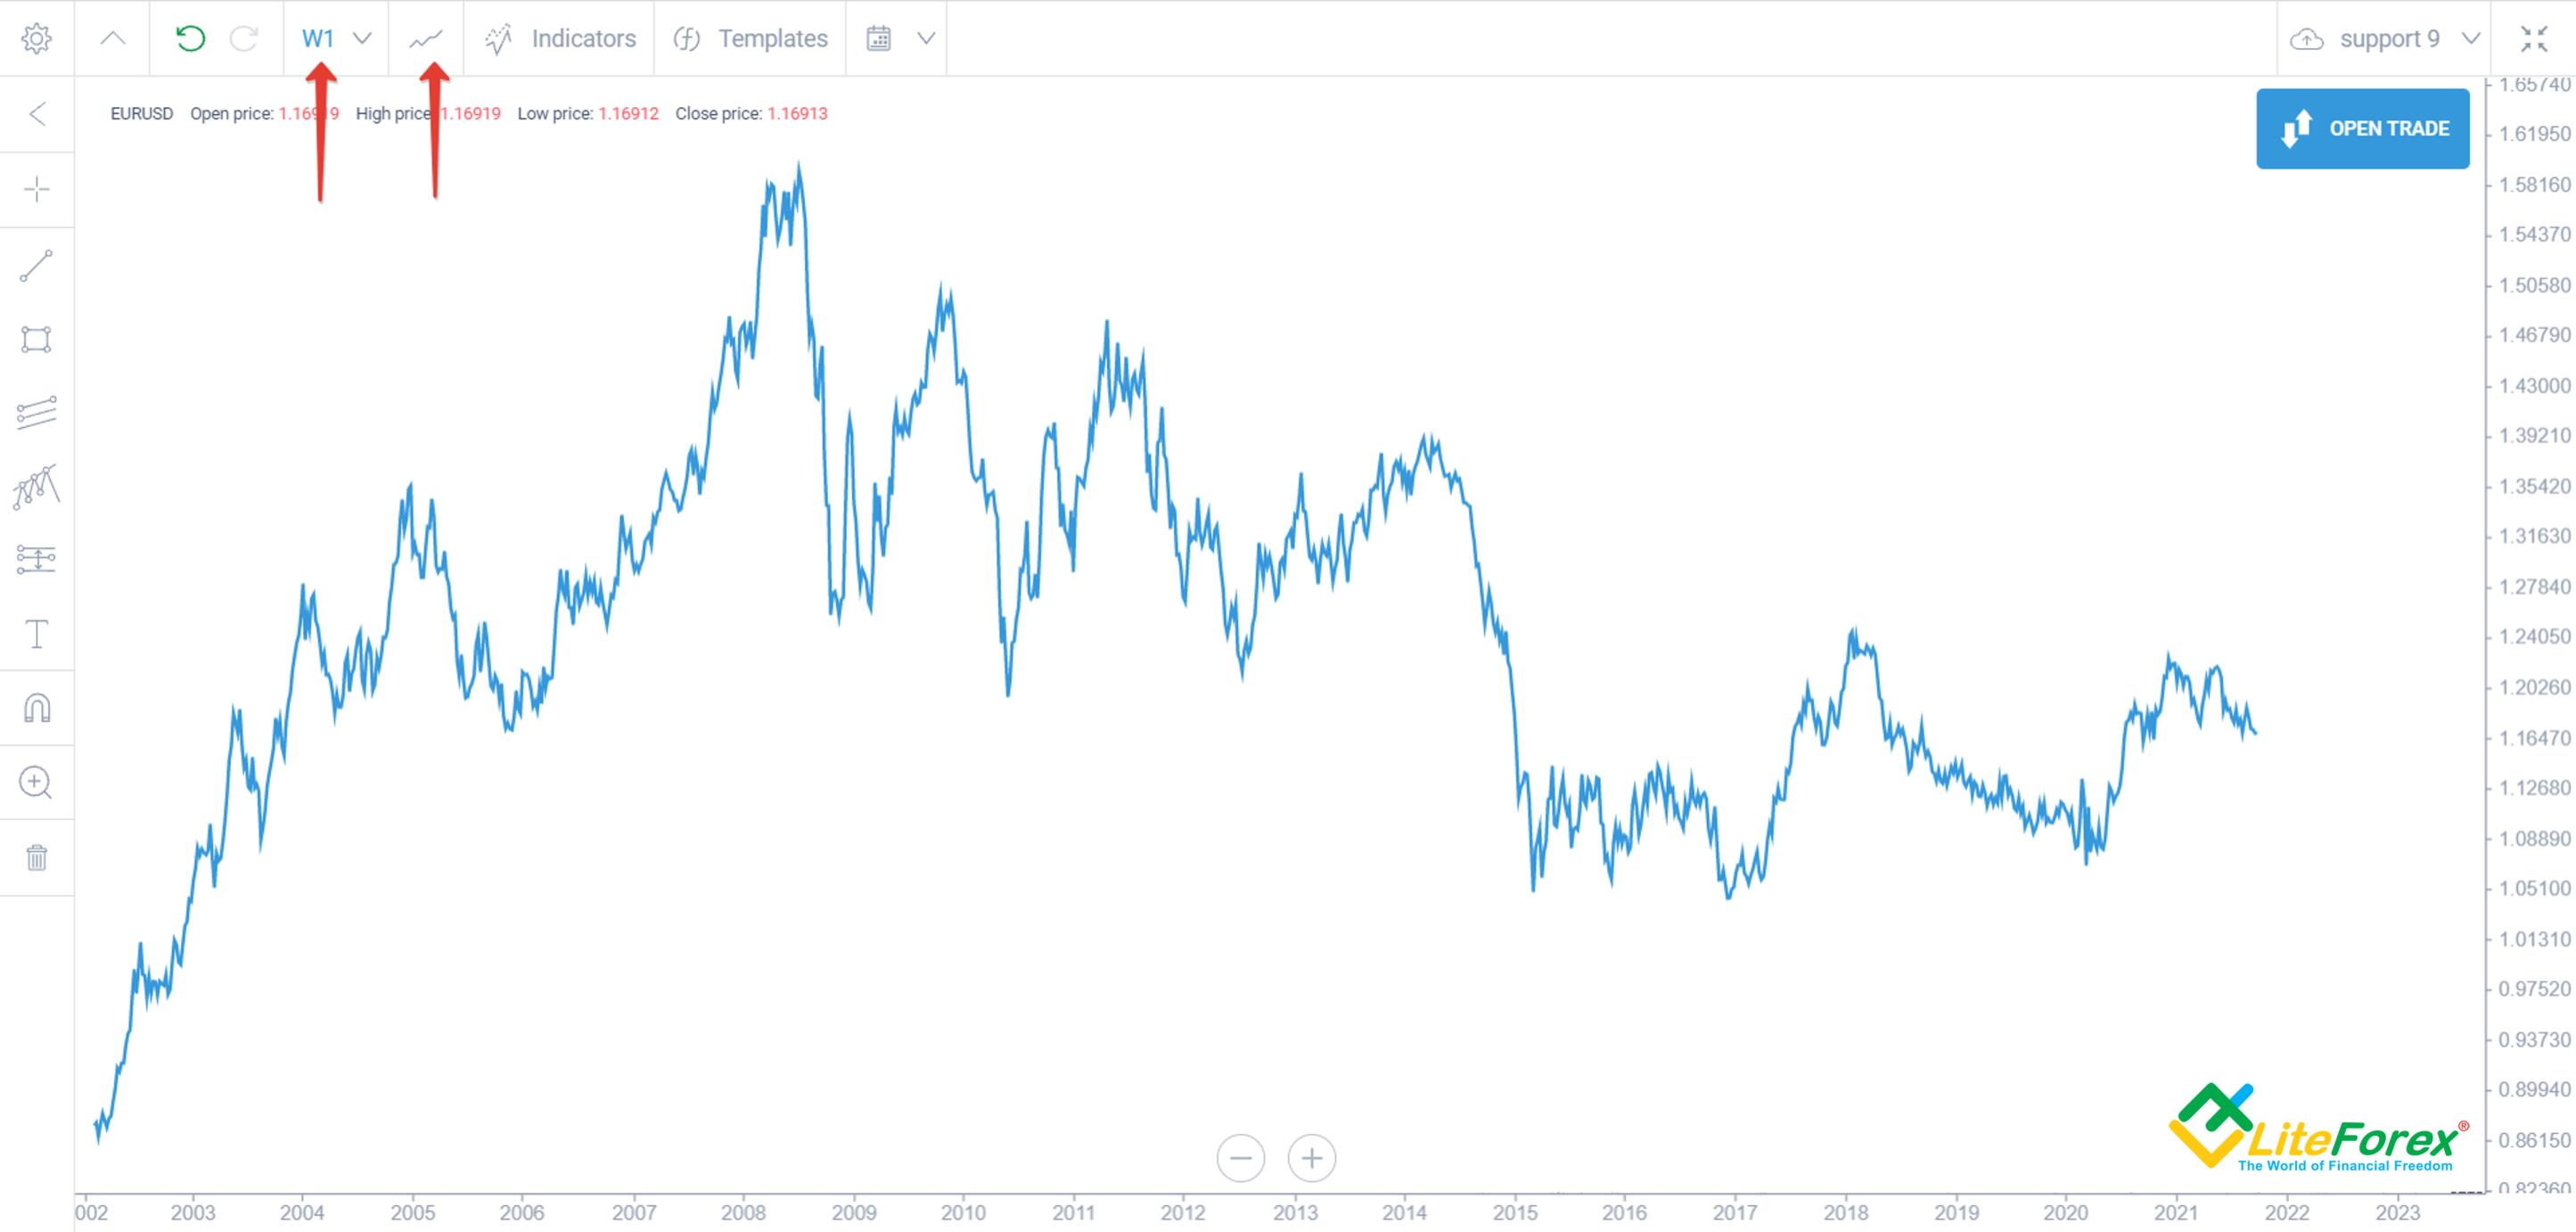
Let's now set the support level and resistance level on the Forex platform.
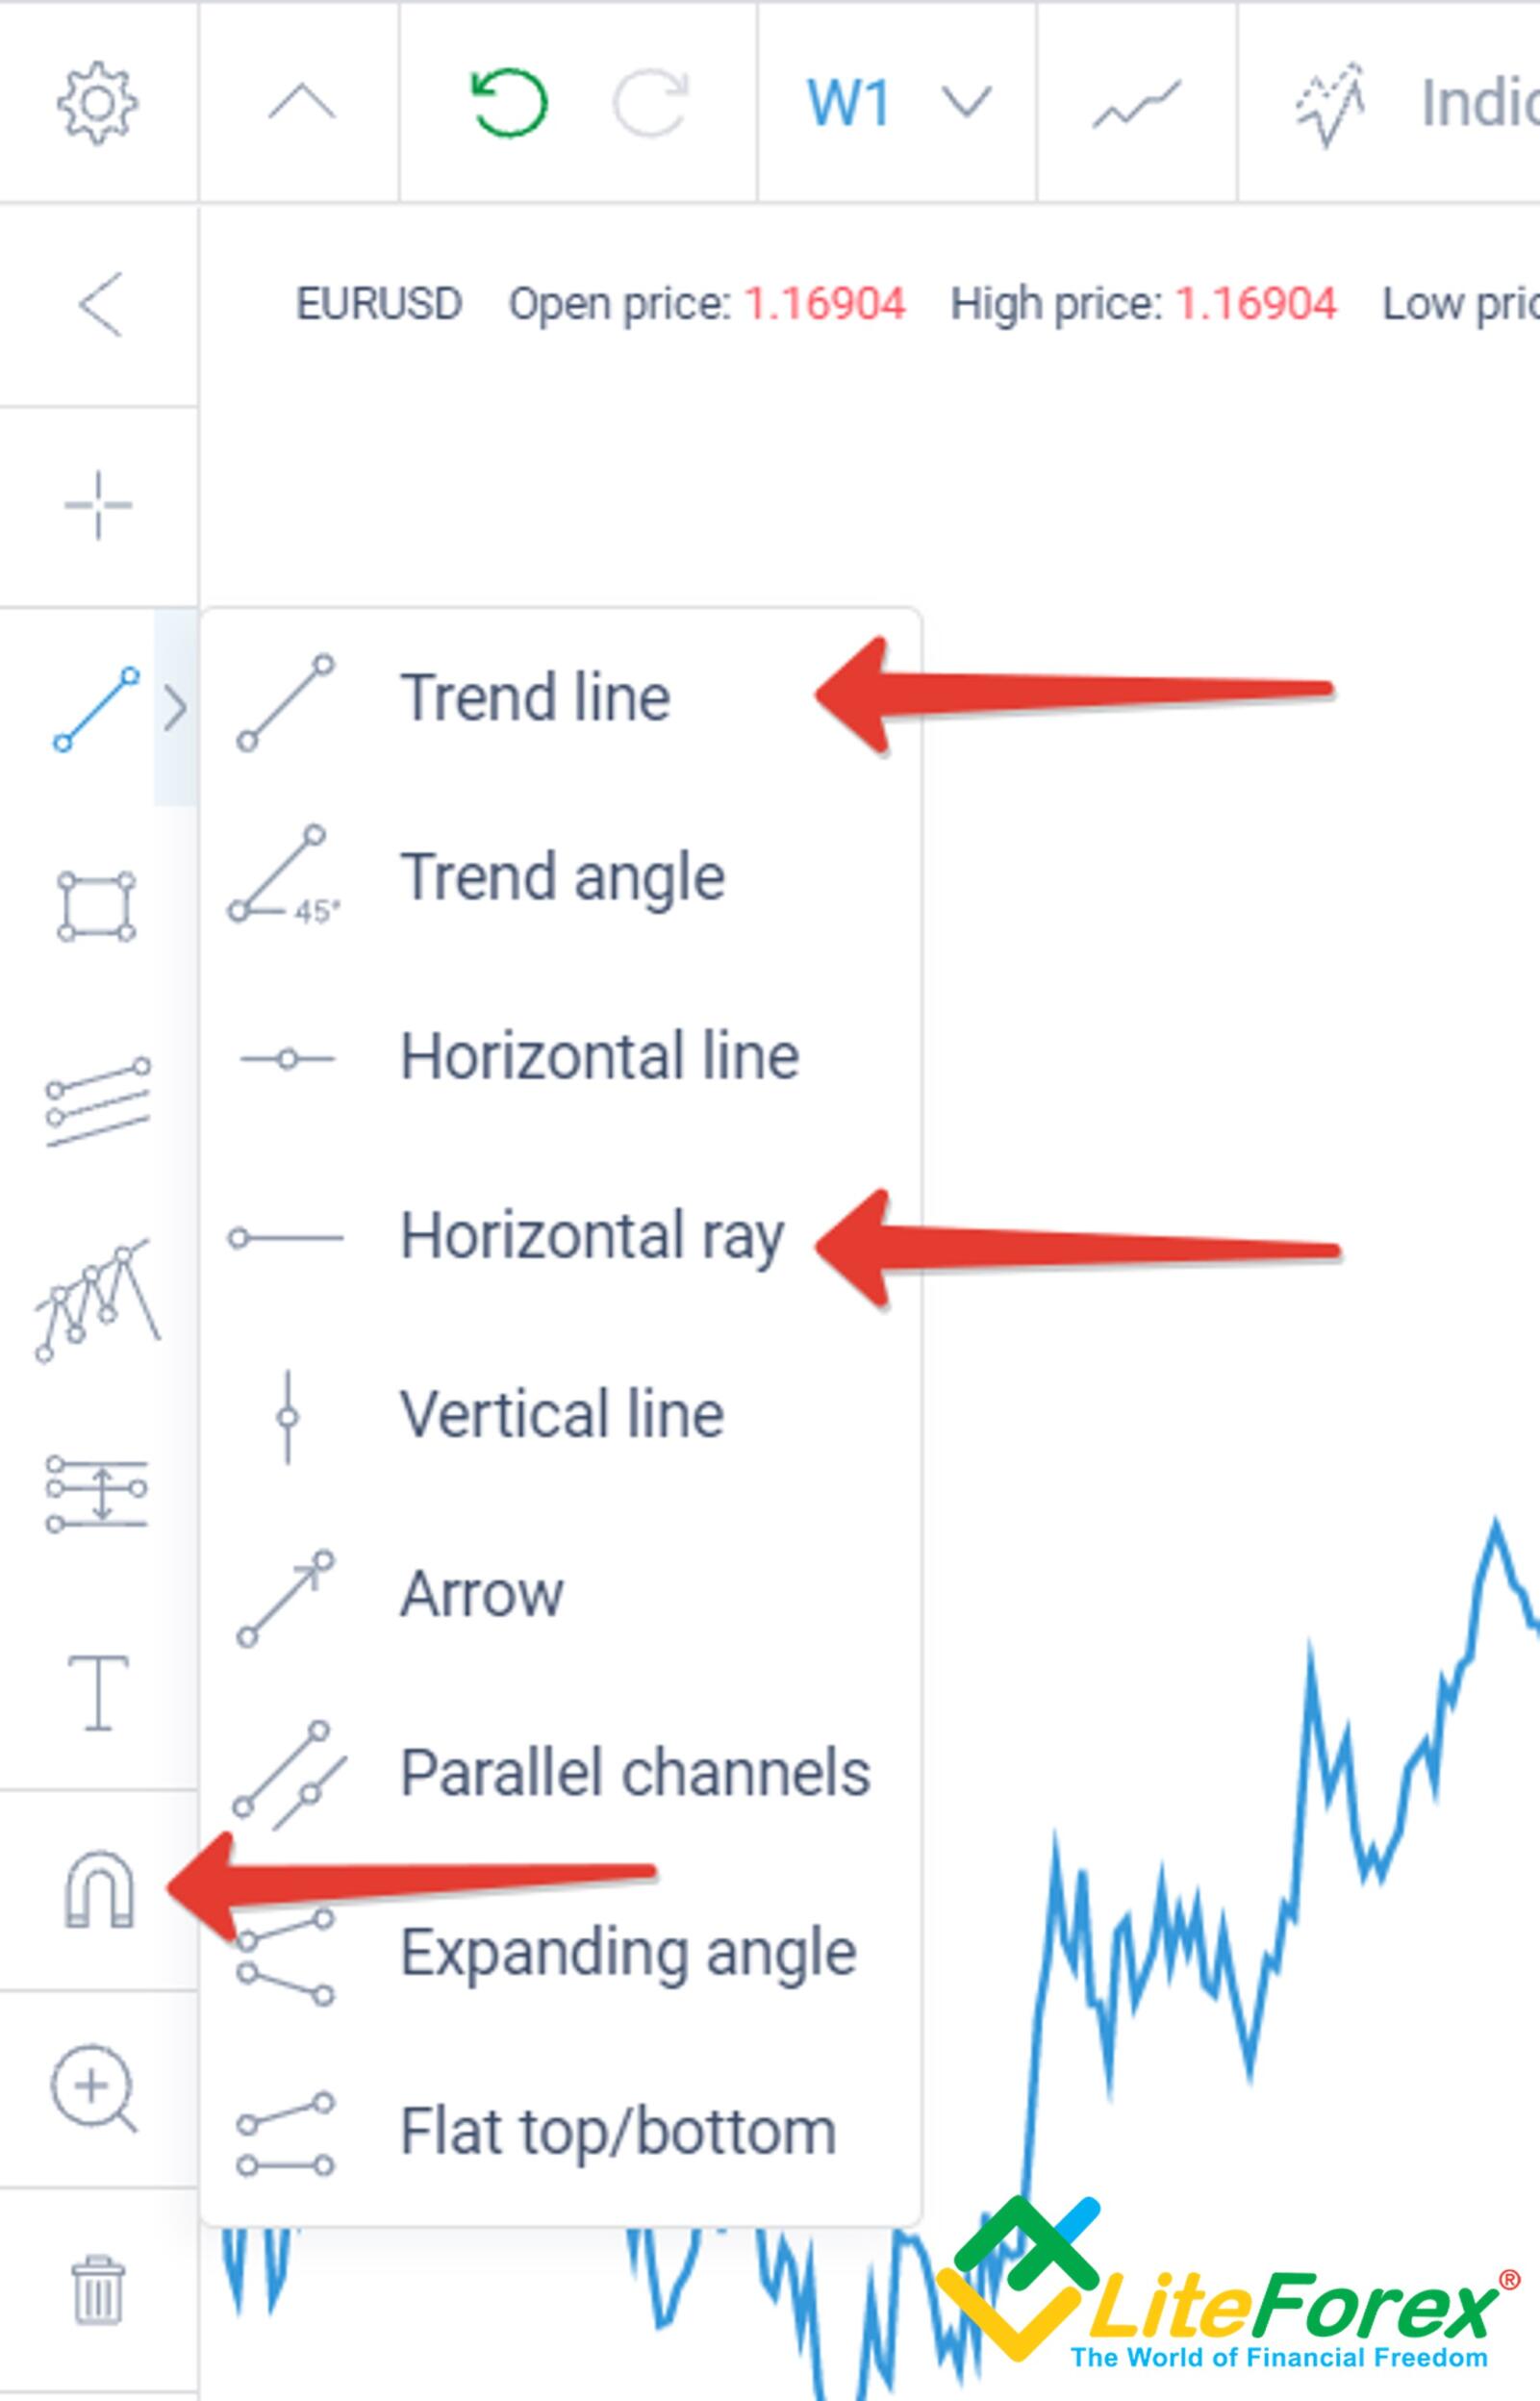
Unlike MT4 and MT5, LiteFinance's web platform provides a great advantage – the Magnet option. Once enabled, it will make your set values stick to the extremums. So, you won't have to adjust them all the time. This option is displayed in the form of the magnet icon in the picture above.
To set static levels, you can use horizontal rays. To draw dynamic levels, you'd better use trend lines, which turn into inclined rays in two clicks.
Get access to a demo account on an easy-to-use Forex platform without registration
How to Find and Use Support and Resistance Levels: Best Indicators and Strategies for S&R
Now that we’ve learned to identify support and resistance levels, we can review support and resistance level indicators: working with extremums should be any trader's basic skill. We will see how support or resistance levels change based on common price moves and their changes in direction. We will define the importance of ATH (all-time high) and ATL (all-time low) in trading.
Unfortunately, the end-to-end analysis of key levels is a regularly neglected technique. However, end-to-end analysis strategies help filter signals and obtain market insights that most people ignore.
Fibonacci channels are very popular with many traders and analysts, but few know how to use them correctly. We will examine the main peculiarities of that technique to avoid childish mistakes.
Moving average is a classical Forex technical analysis indicator of support and resistance levels which remains relevant these days. Every trader should find out how to use it regardless of the platform they trade on.
Trend analysis is essential to analyzing support and resistance levels. They are inseparable. We will look into the specifics of it.
Pivot point technical analysis indicator is the icing on the cake when working with support or resistance levels. Unfortunately, not everyone uses this handy instrument. The information you'll find further may improve the quality of your trading substantially. Just keep on reading!
Peaks and troughs
To start working with extremums, open the oldest possible time frame chart. For example, a one-month chart.
Mark the ATH – the all-time high value – on the chart. Mark the ATL – the all-time low – over the whole trading period.
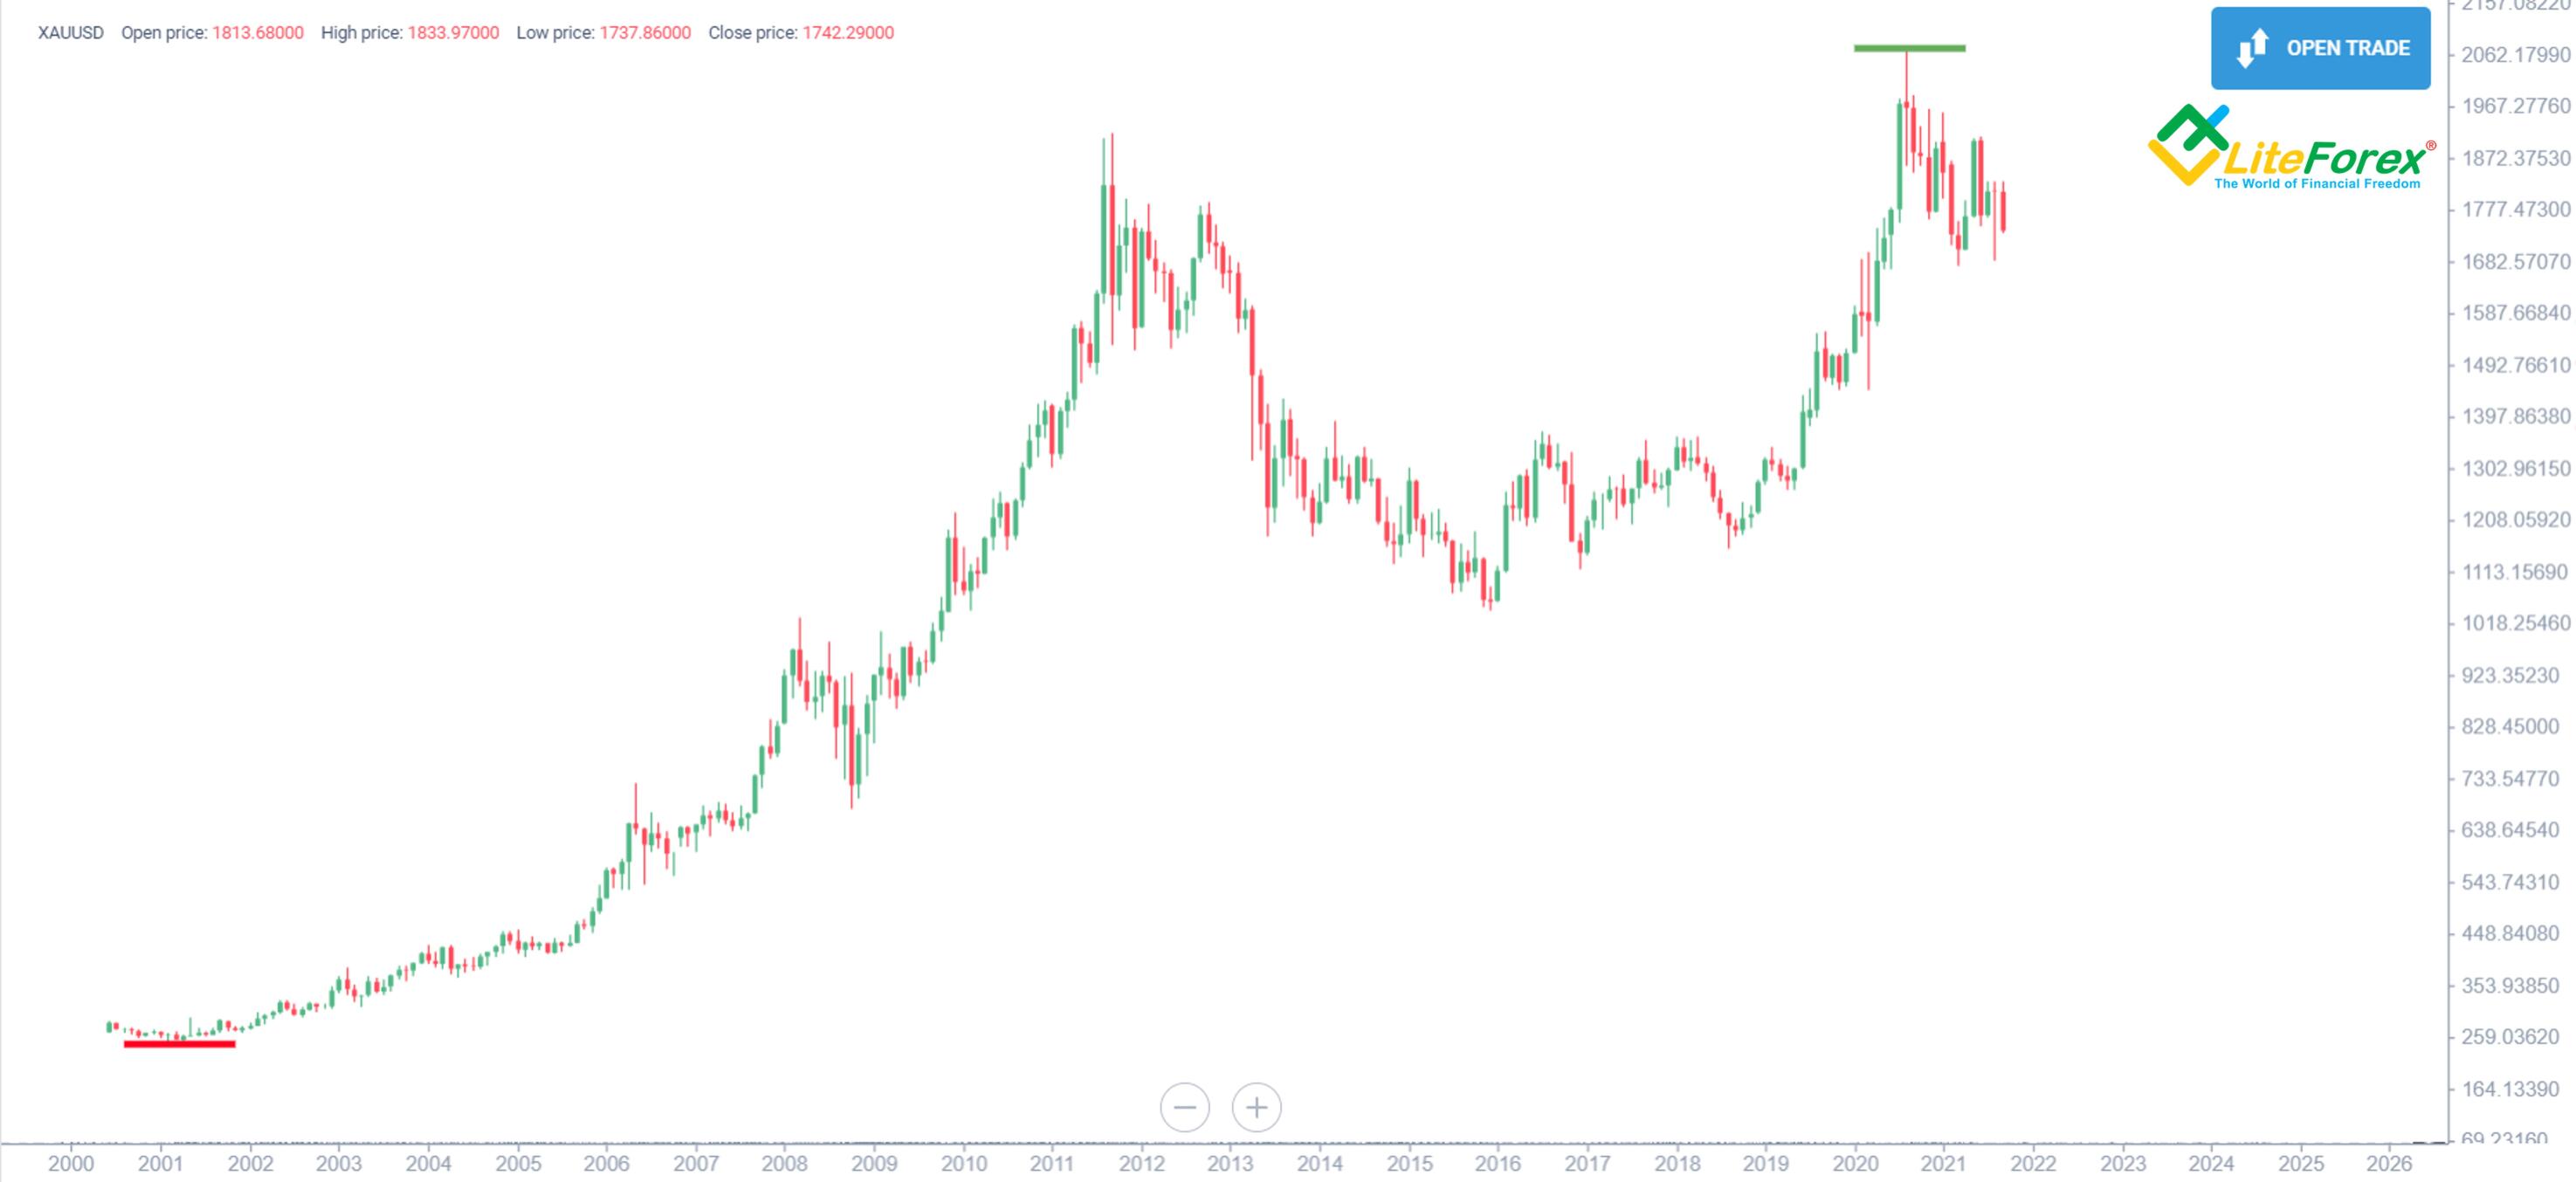
I've taken gold's chart from LiteFinance's web platform. If we pick the monthly time frame, we will see the whole trading history to analyze. It started in 2000.
Gold has traded for a much longer period, but what we see on the screen will be enough for us to make an analysis. The chart's ATL is located at around 245 USD – the red horizontal line – in the chart above. The chart's ATH is at about 2,074 USD – the green line on the chart. Those are powerful levels in terms of support and resistance levels.
As the current price levels are closer to the ATH, the global gold price moves are turning bullish. So, we are more interested to find out a chance of updating the historical maximums. The longer the ATH and the ATL remain unbroken, the more powerful they are.
In our case, the ATL hasn't been updated for more than 20 years, so the asset is highly unlikely to reach that level soon.
On the other hand, the ATH was updated a year ago, so there's a bigger chance that the price will go further upwards. Based on that logic, we can say that the pace at which the trading range between the new resistance and support and the previous extremums increases is a leading potential reversal signal.
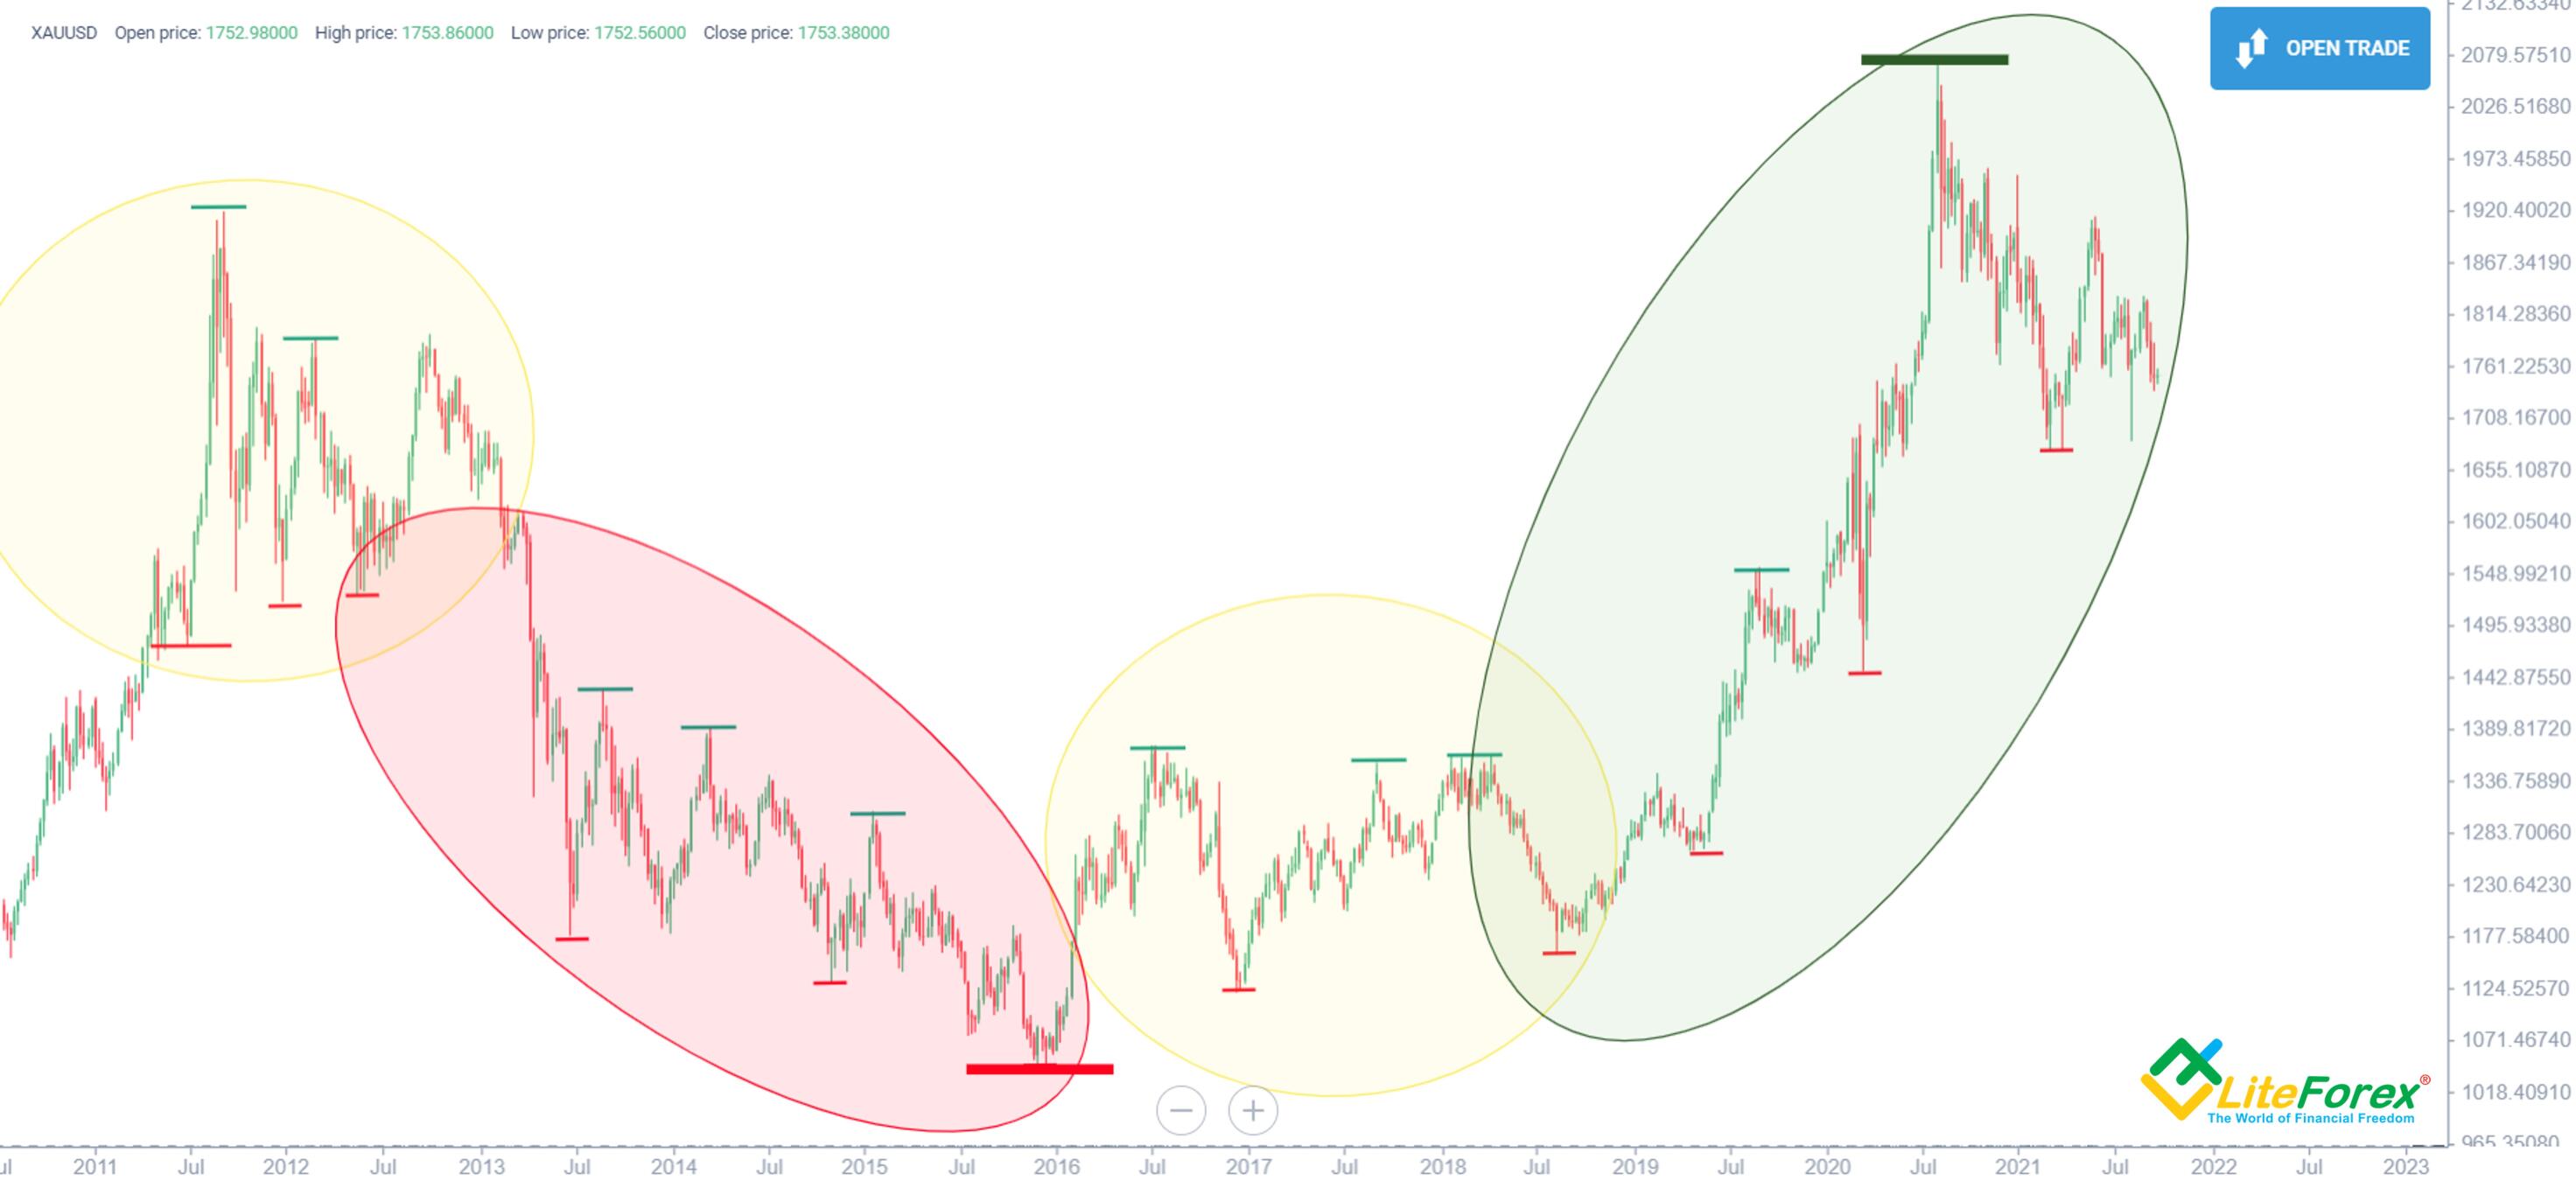
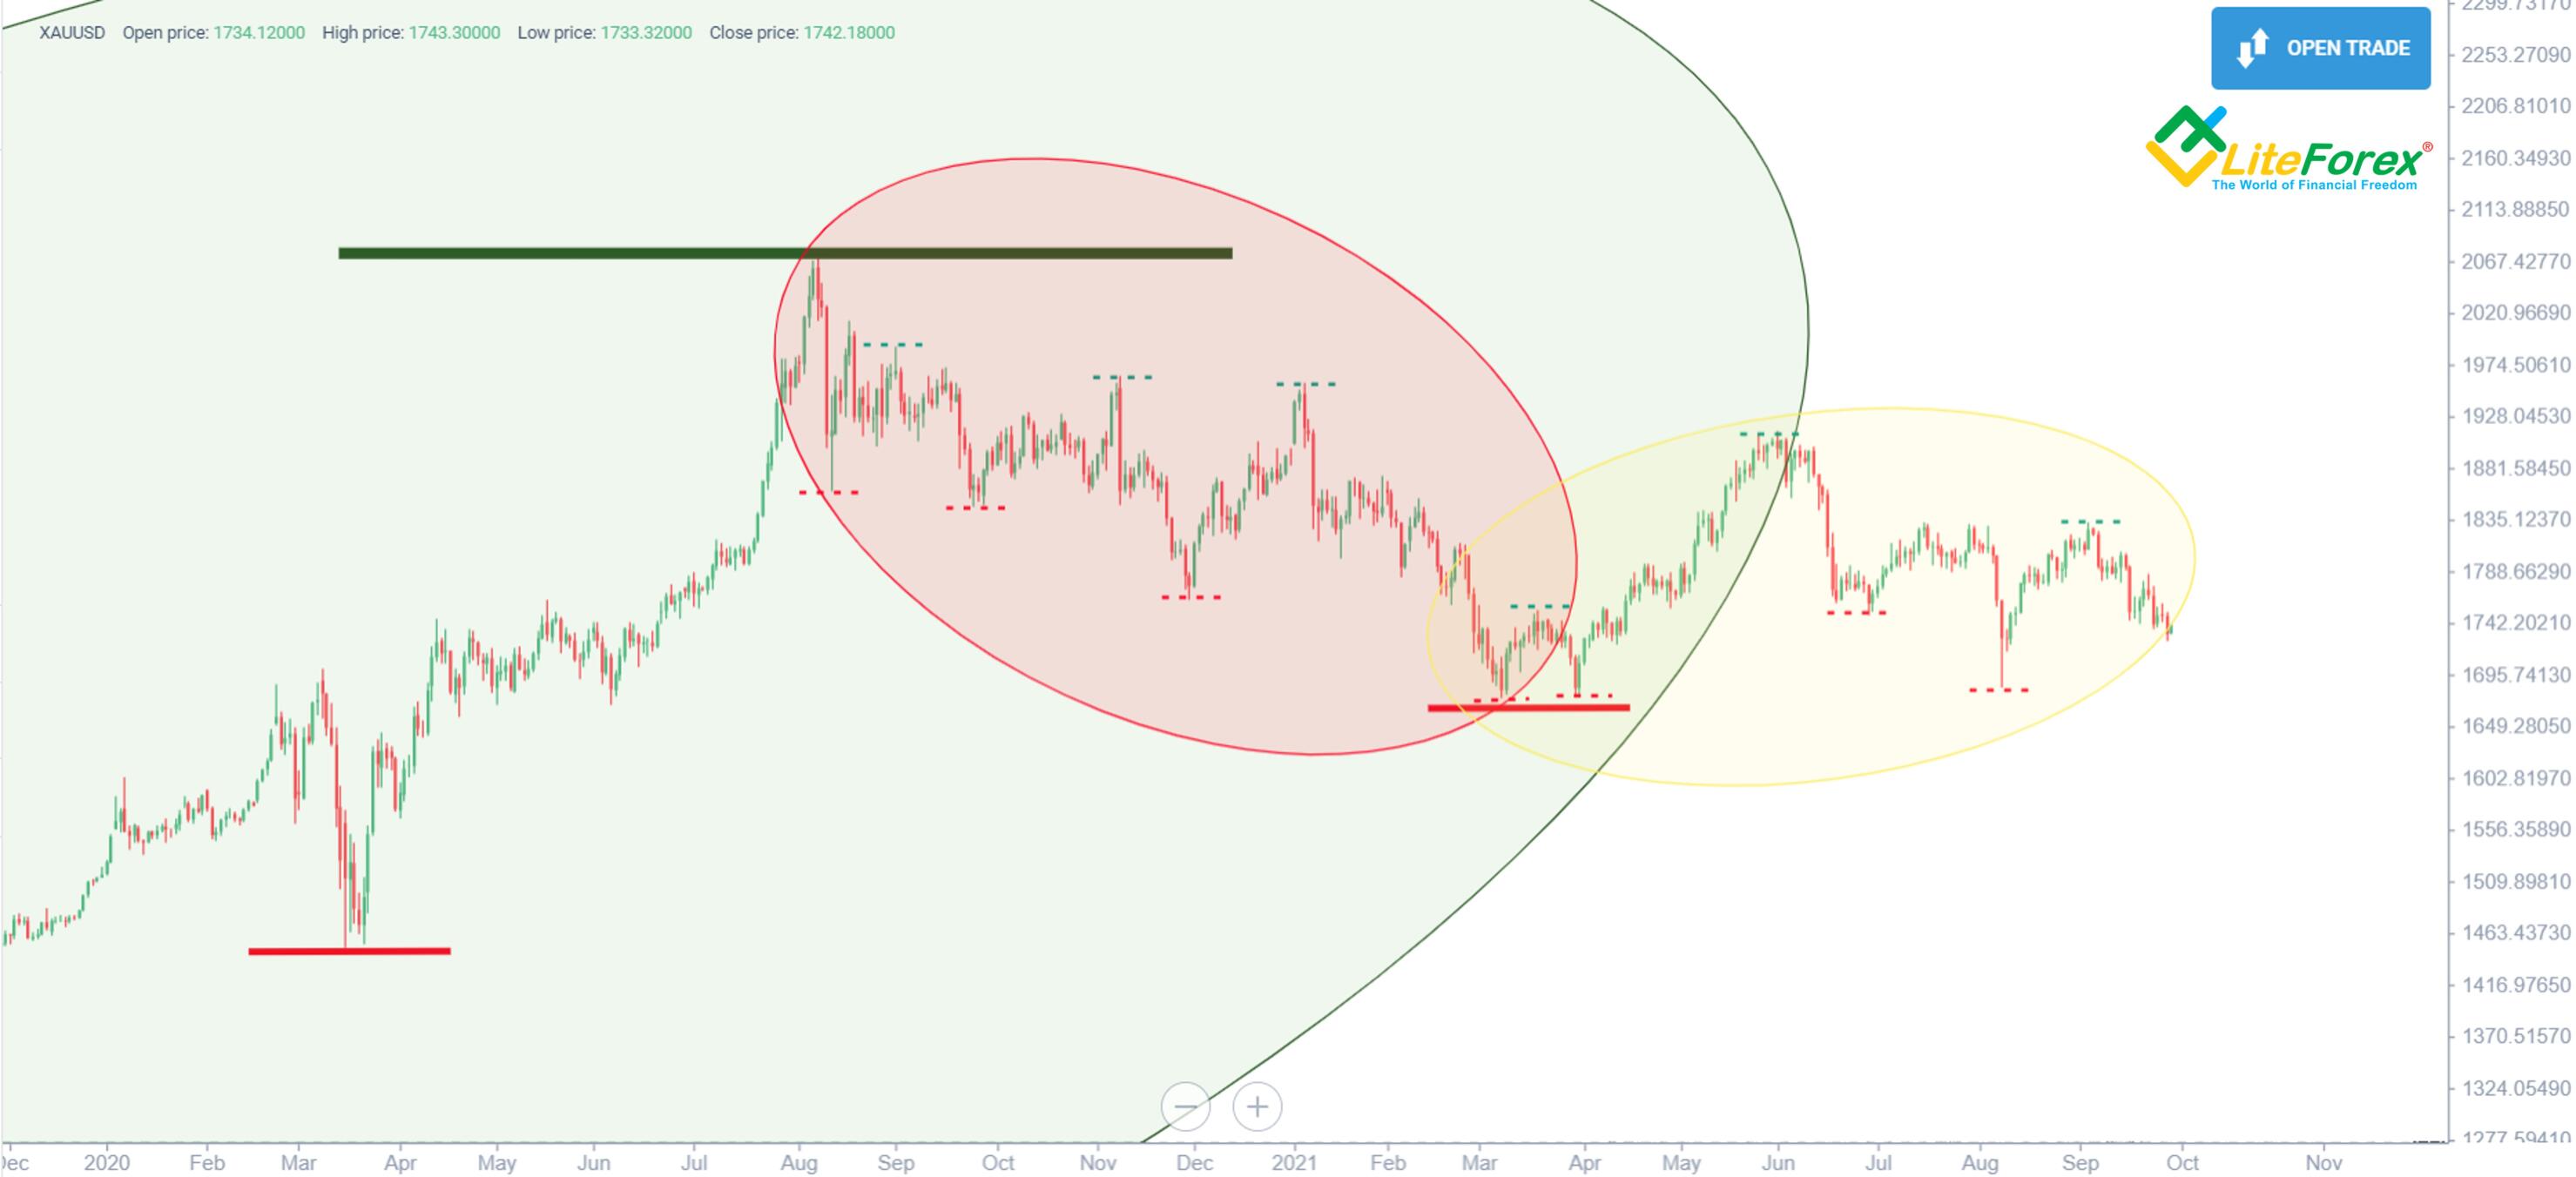
Having determined the global trend and ATH/ATL update intervals, we can examine local extremums. They are marked as short red and green segments on the XAUUSD weekly chart above. Once identified, all the extremums can be grouped based on a certain criterion. Have a look at the picture above: it shows three groups marked as red, yellow, and green ovals. They all mark a price moves direction, and that's the criterion I've just mentioned.
A bearish price direction will update local lows, and every subsequent high will continue lower. It is marked as the red oval in the chart above. When the market is flat, the extremums change conversely: the level of troughs most often grows, and peak values most often drop in that market phase. Such a pattern is called a "triangle" in graphical analysis.
A bullish price direction will be updating price maximums, and local lows will be rising. That market stage is marked as the green oval on the chart.
Using the troughs and peaks scheme, we can say in which phase the market currently is. What's more, those values are support and resistance levels. They should be considered when making a trading plan.
Support and resistance levels from the previous time frame
After determining historical extremums, local extremums, global price directions, and trend phases, the next step will be analyzing short trade time frames. What do we need that for? For a few reasons:
We have already got a general market picture, and now we need to go deeper and look at the current disposition of forces.
We need to analyze the phases of a local price direction and estimate a potential reversal probability.
We need to identify entry points and form a trading plan.
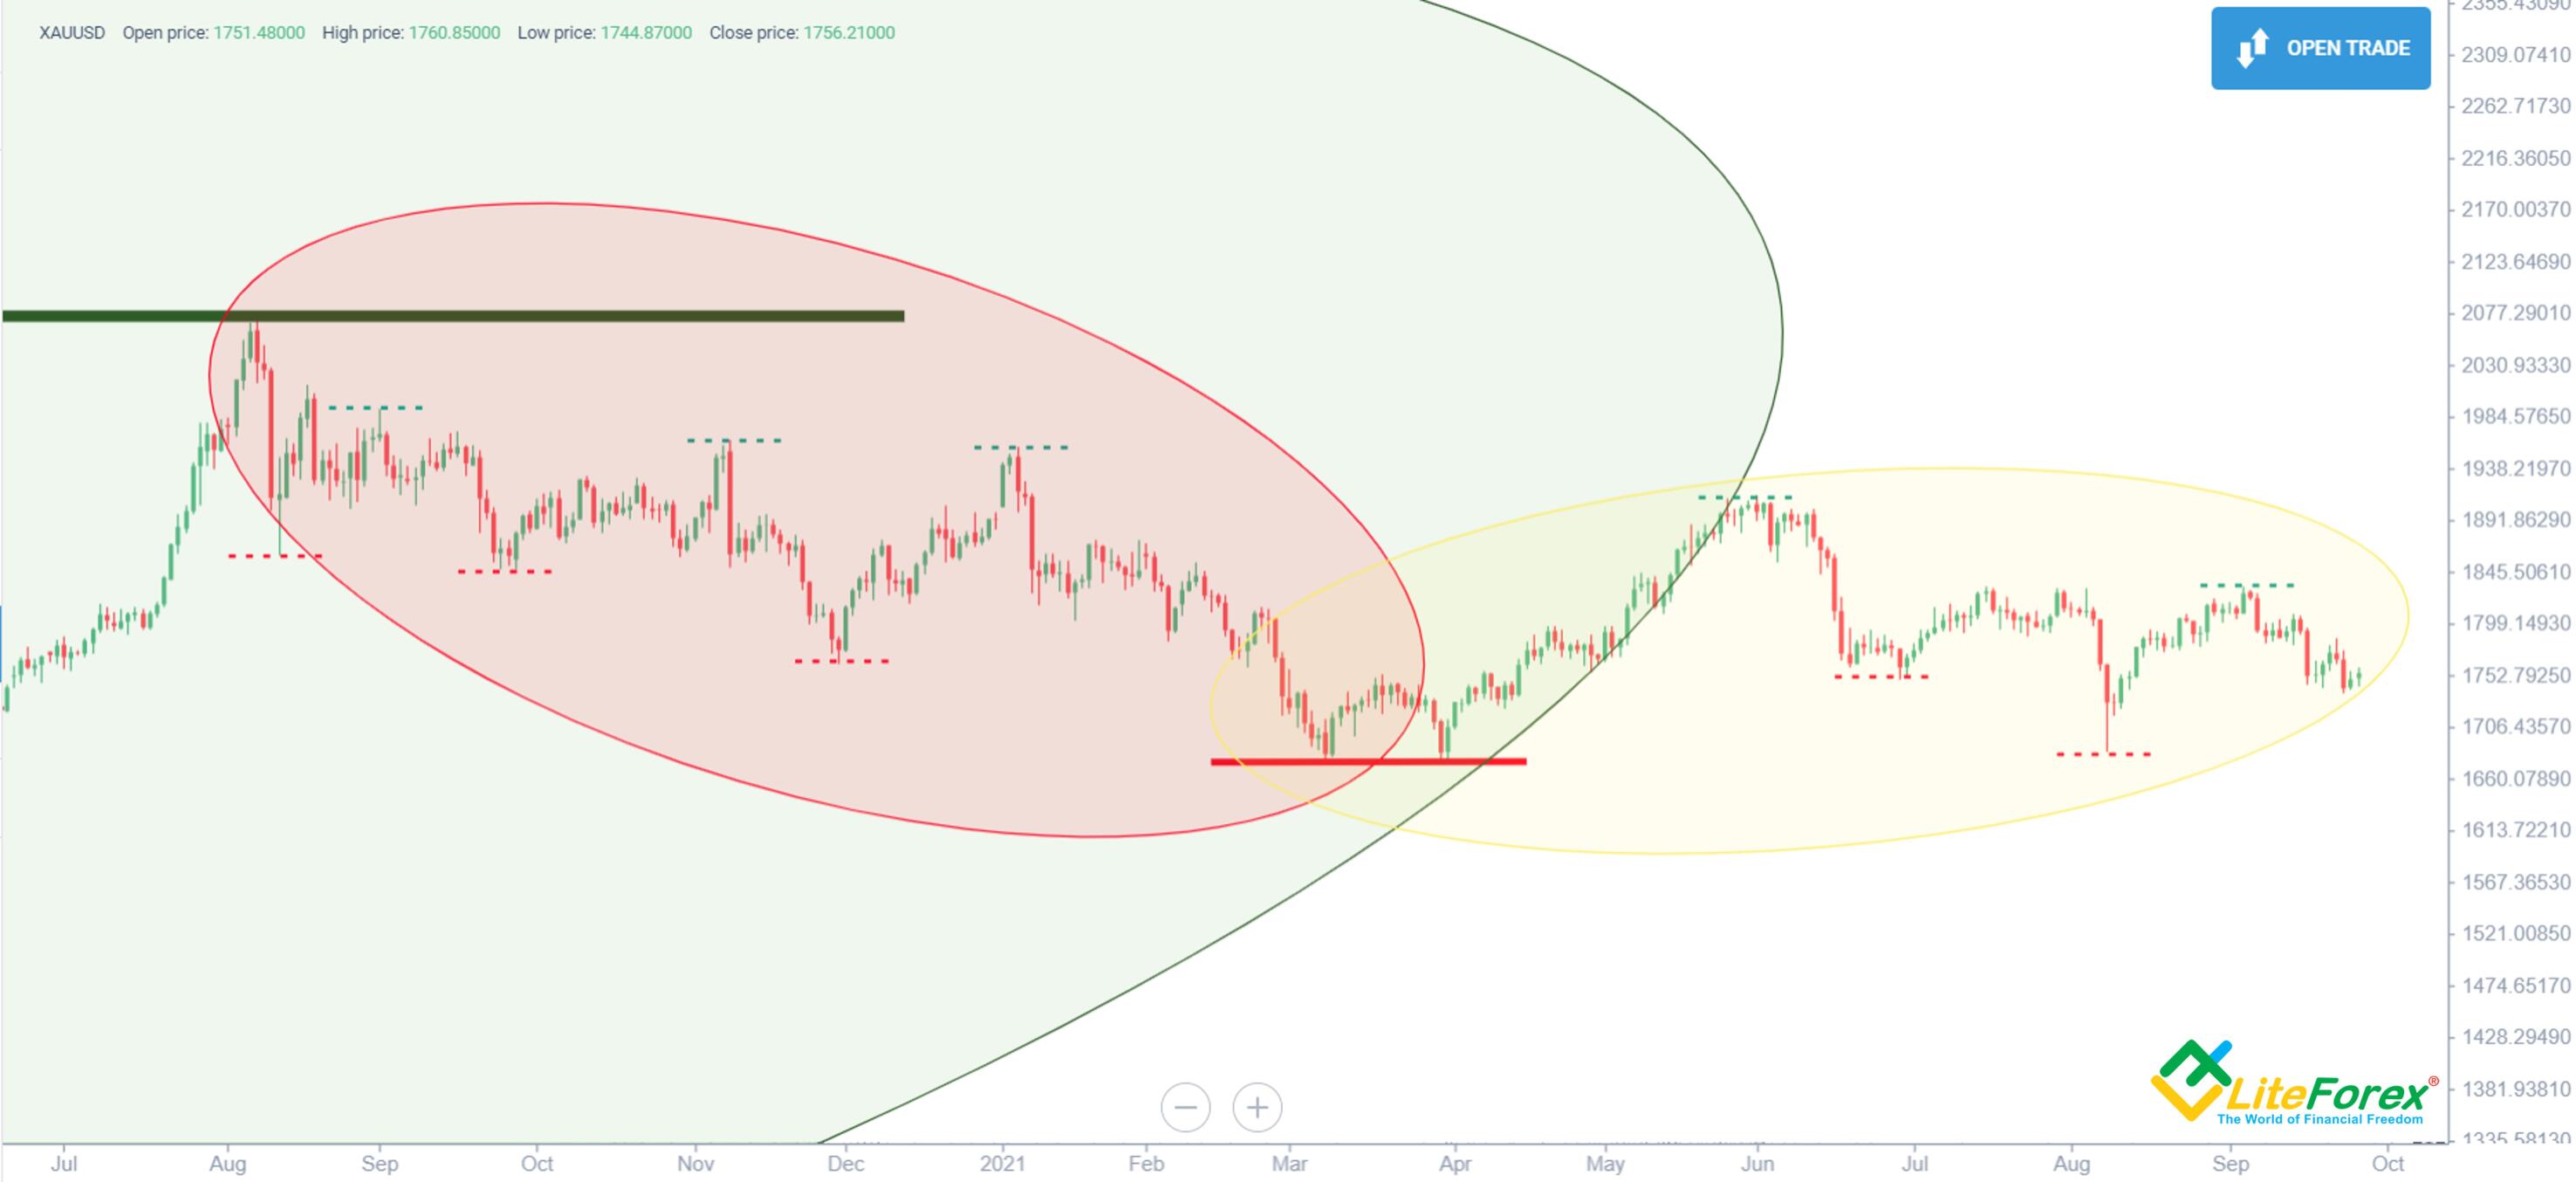
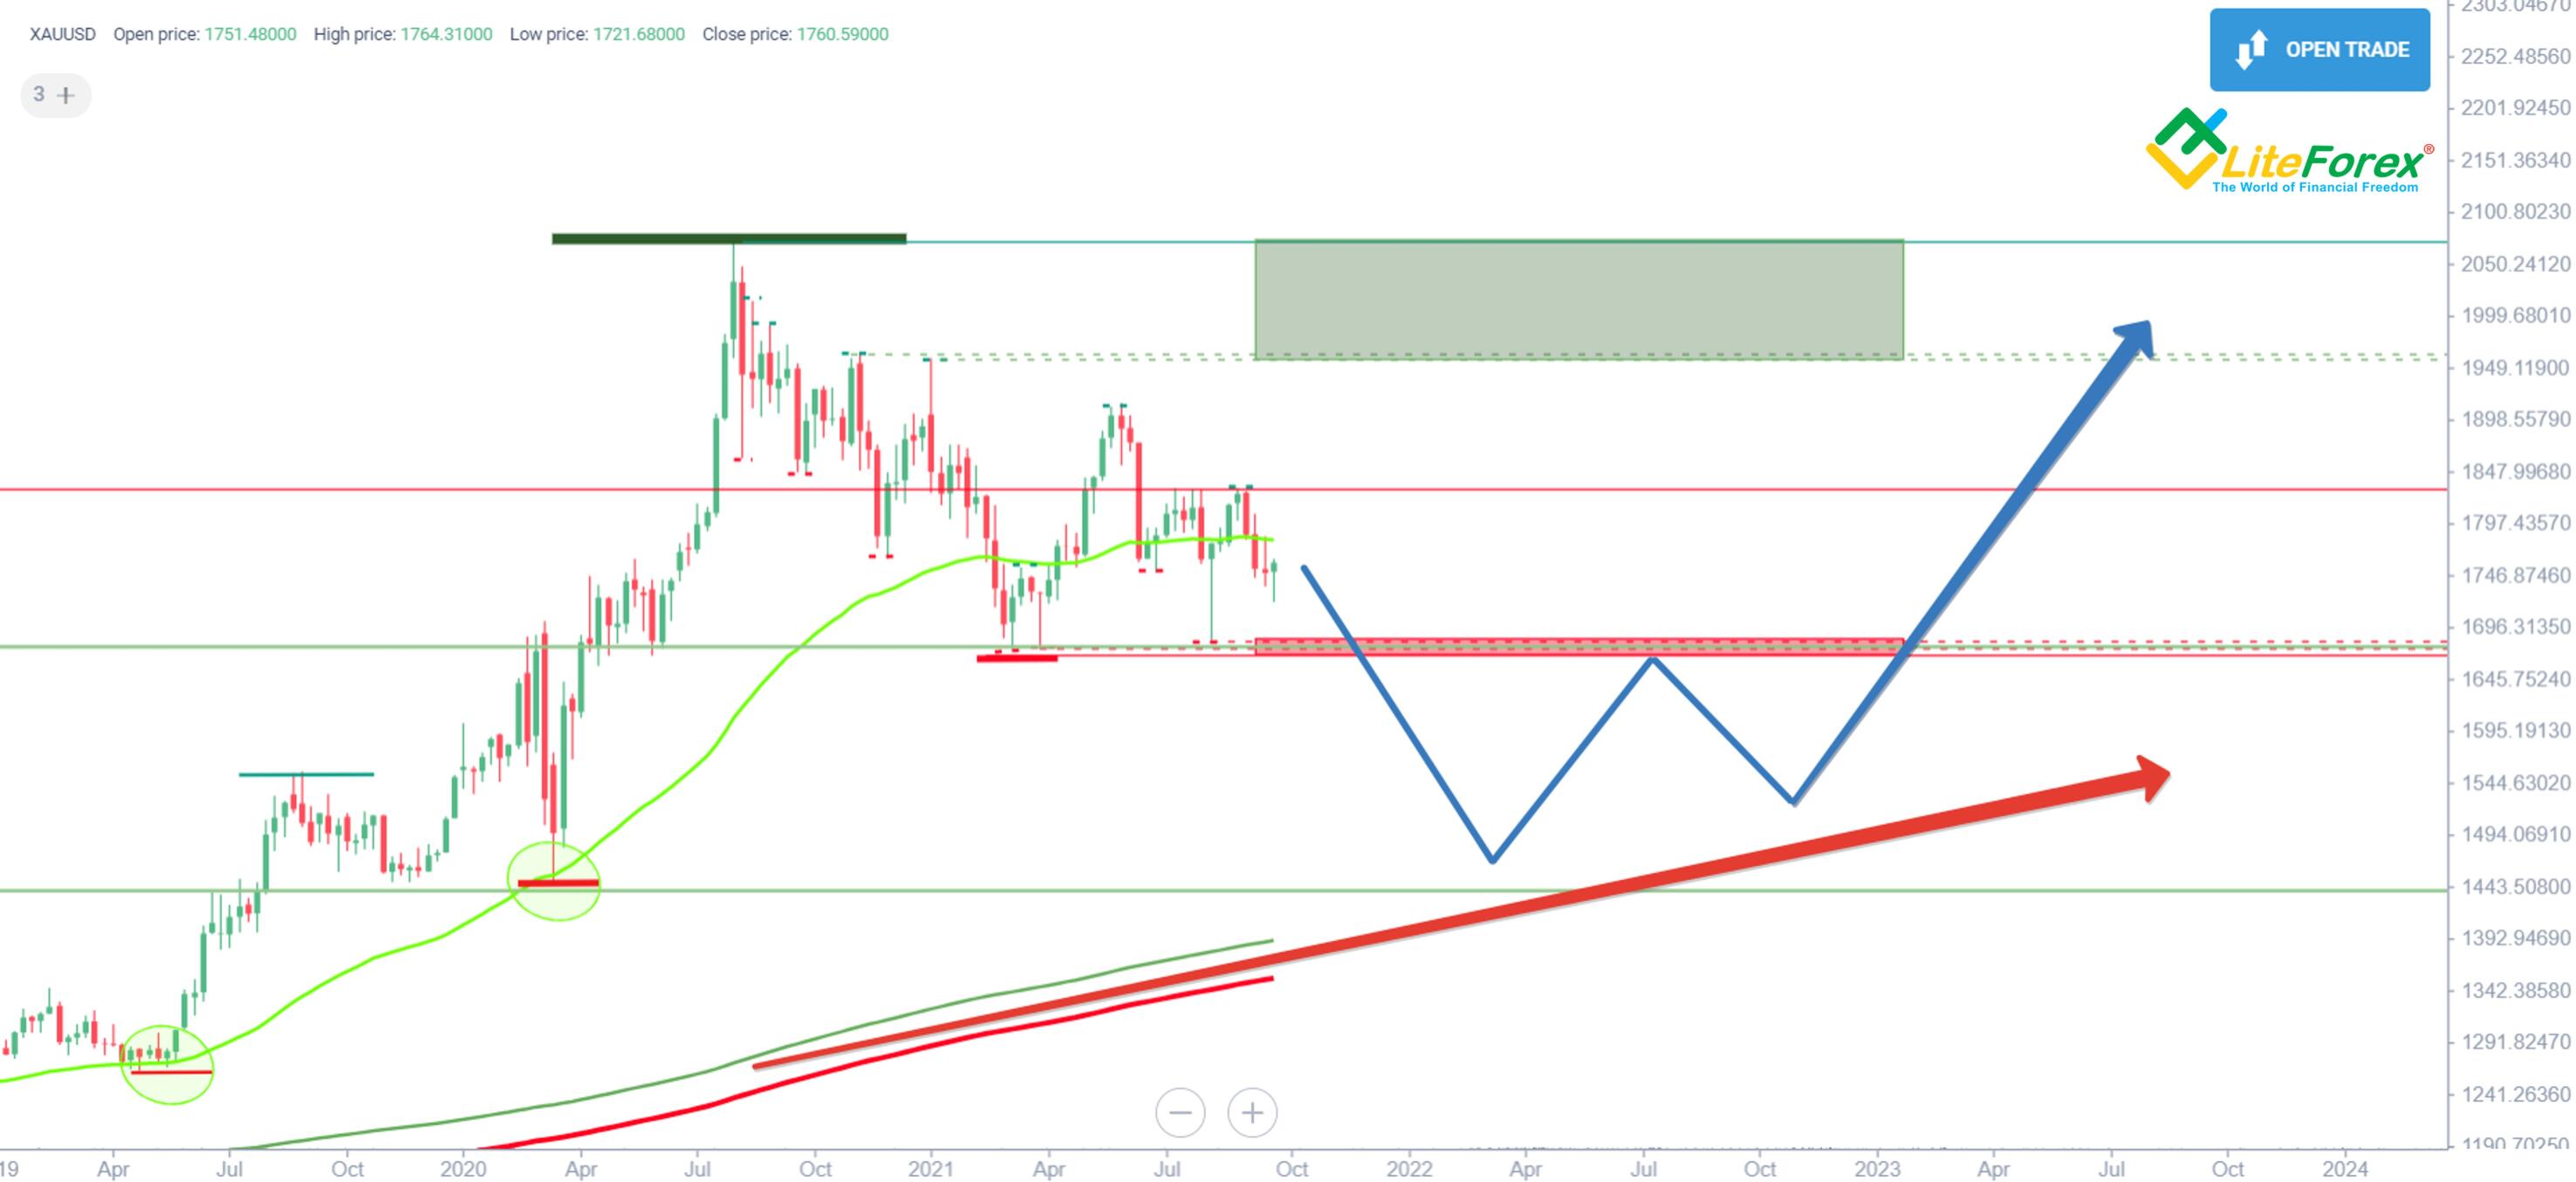
The chart above is an example of how we can continue the previous candle analysis. First, we have switched from a weekly to a daily chart. The dark green segment points to the ATH. The red segments indicate the local lows from the previous analysis. The dotted lines mark the daily TF's local extremums the way I did on the weekly chart. As a result, we see several things that weren't obvious when analyzing the weekly chart. Despite the global bullish market wave, the XAUUSD is correcting locally after establishing a new trading range.
The current market phase is consolidation since the minimums aren't updated, and the local highs go lower.
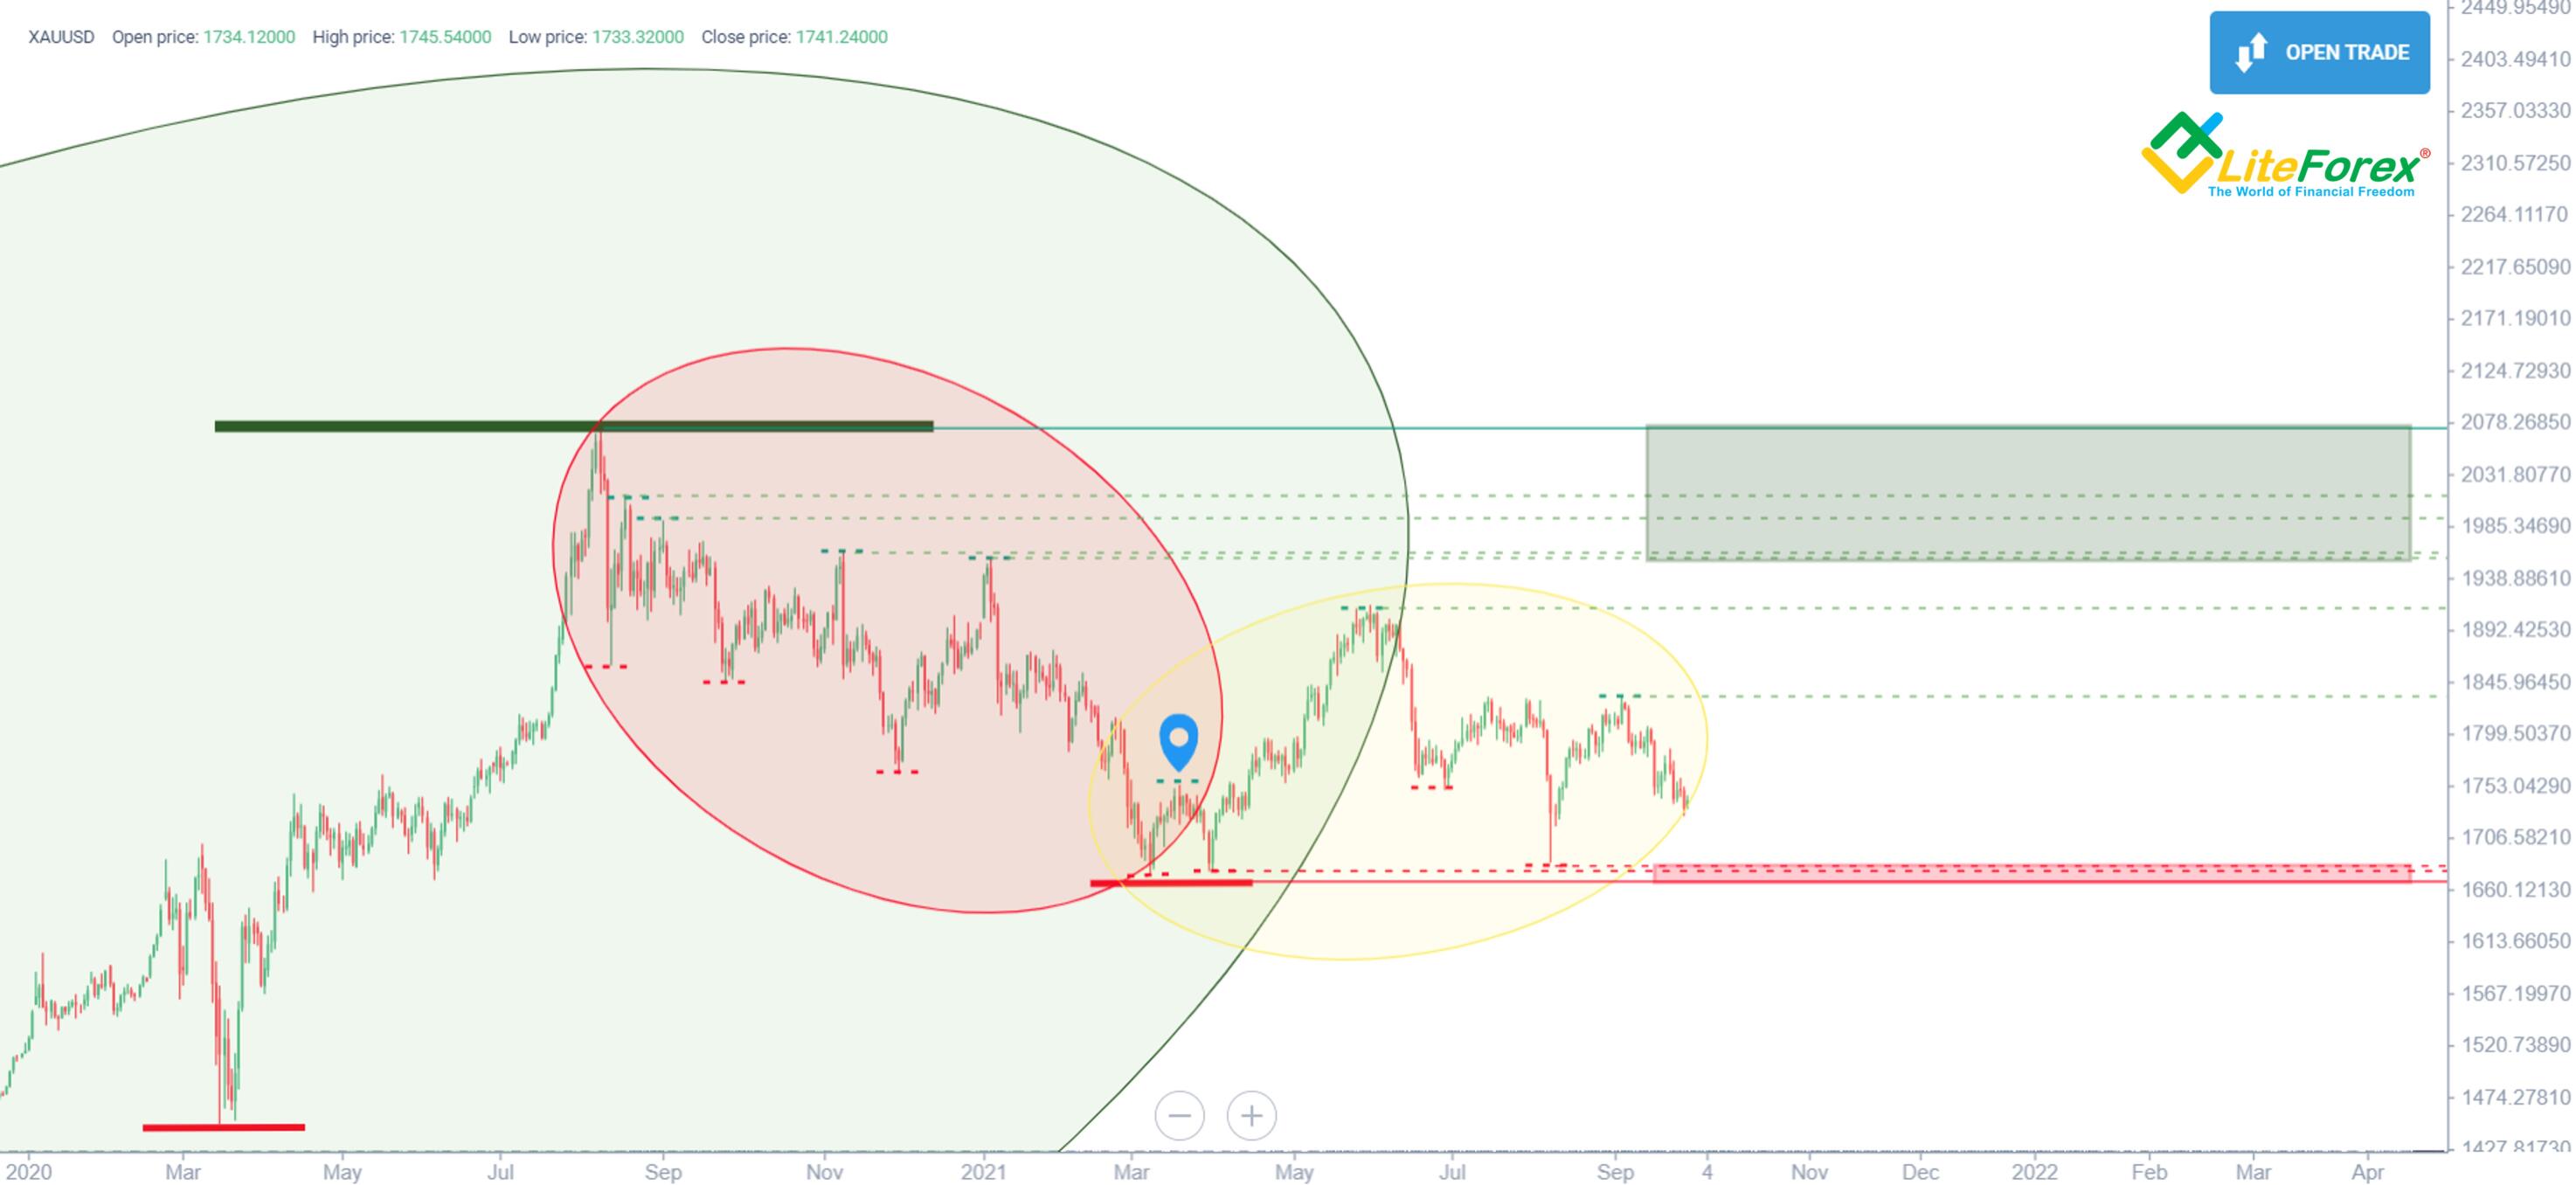
We will have several support and resistance level values if we project the marked levels uncovered by the price chart. The newly formed objects can be accumulated into support or resistance zones.
It's important to determine which levels fit into those support and resistance zones. As we can see from the chart above, the ATH fits into the green resistance area, while the local weekly TF low belongs to the red support level zone. The ATH is more powerful than the local levels, making the whole resistance zone more important and opposing the financial markets’ movements. The width of the area is important, too. The wider it is, the harder it is to break it through. That knowledge is even more precious when the market consolidates as it allows us to estimate a reversal probability objectively. Based on the analysis, a further decline is likelier to happen than further growth in our example.
Fibonacci levels
Leonardo of Pisa, also known as Fibonacci, was an Italian mathematician from the Middle Ages. He came with a great idea of a numeric sequence where each subsequent number is the sum of the two previous ones. If we divide each of those numbers by the previous one, it will tend to be 0.618.
Scientists found a lot of examples across nature where this ratio is exactly reproduced; that's why it was called "the golden ratio." As you have probably guessed, that ratio is frequently seen in Forex trading, so the Fibonacci sequence is actively used as a support and resistance level indicator.
If you wish to involve yourself deeply in this subject, I recommend checking out the article What is Fibonacci retracement? How to trade using this technical analysis indicator? We won't go deep into the theory. Instead, we'll look at how this tool can be used in practice to analyze support and resistance zones.
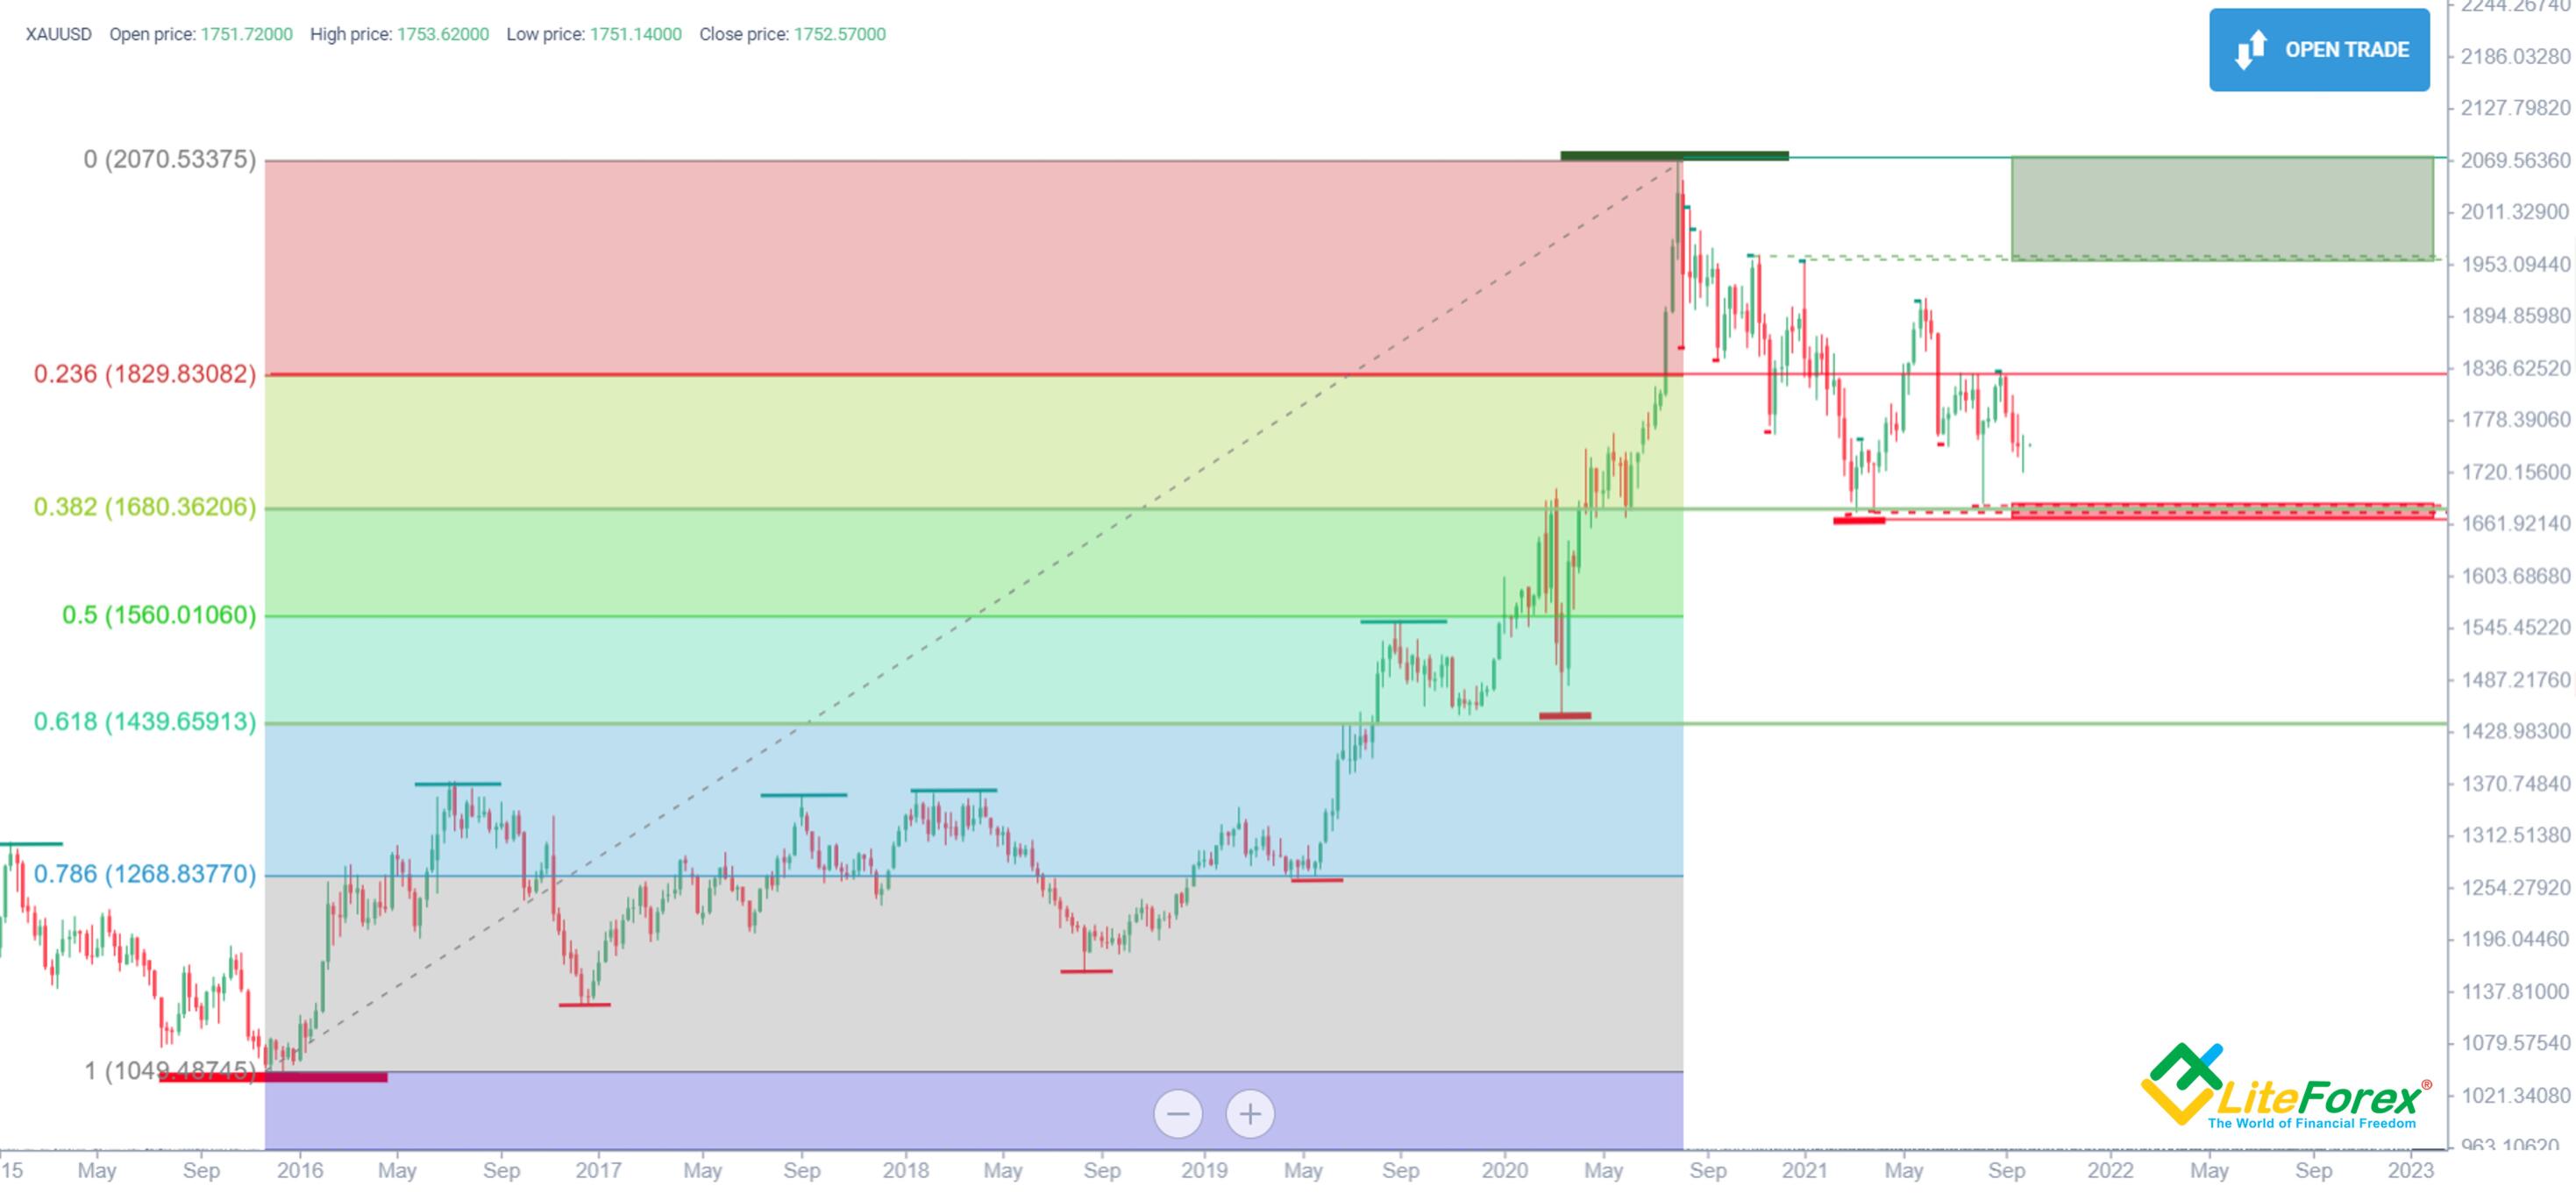
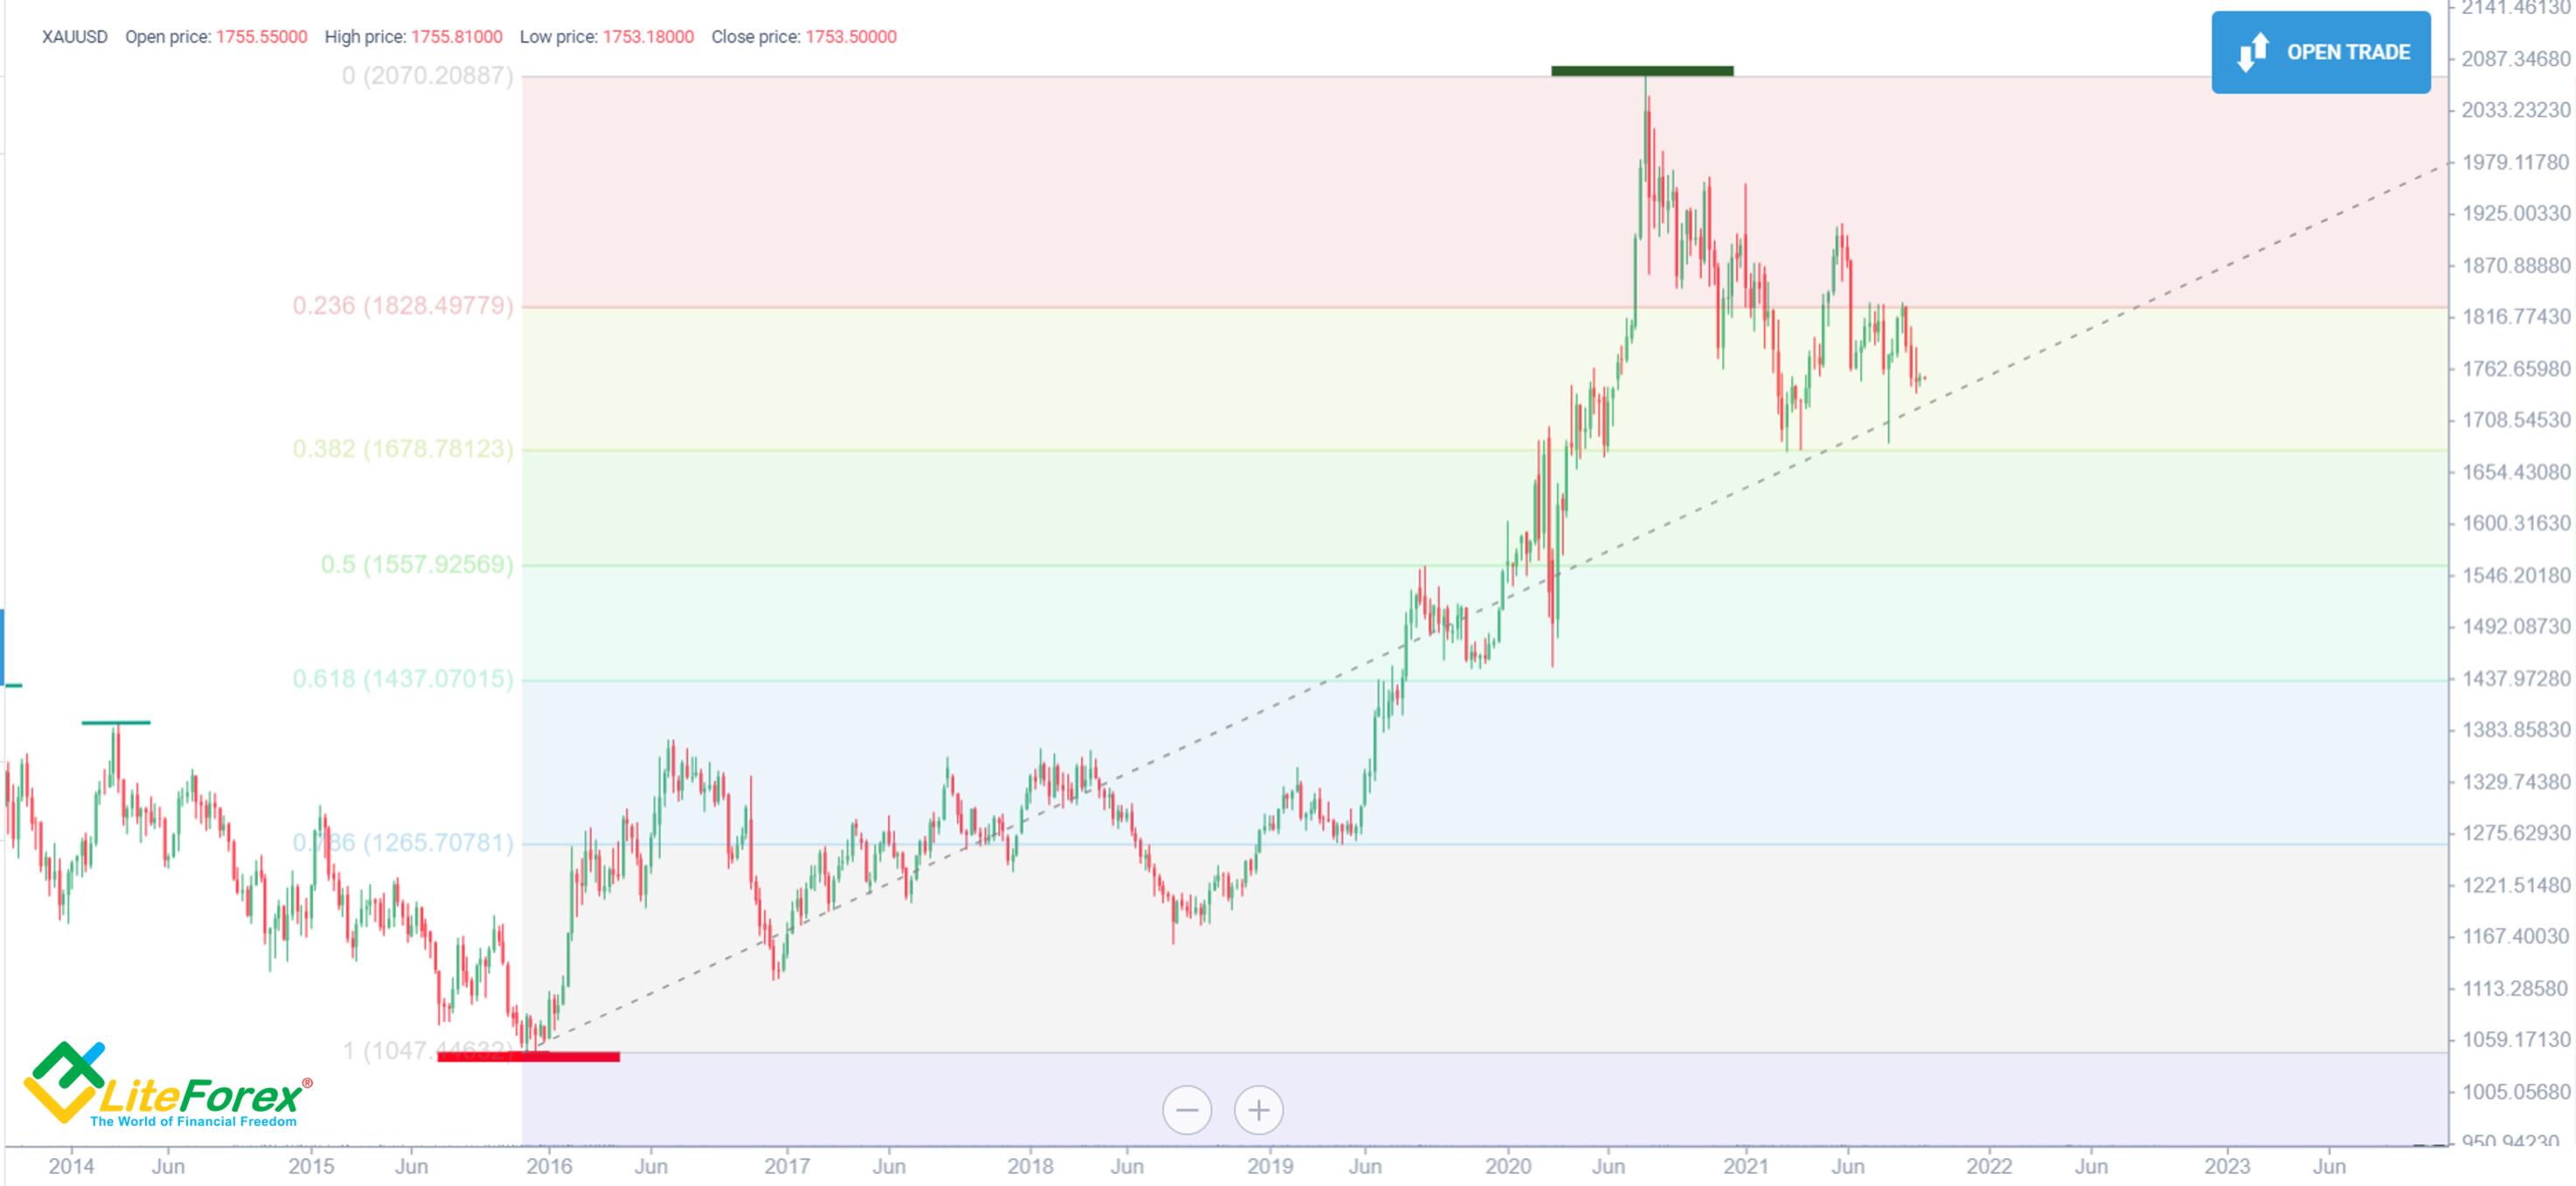
In the gold chart above, you can see Fibonacci correction levels based on the latest global extremums. The most important of them are levels 0.382 and 0.618, the "golden ratios". 0.236 value is the product of 0.382 and 0.618. 0.786 value is the square root of 0.618. They can also be used in trading as auxiliary levels.
We see that the ongoing correction held to the 0.382 line. There lies the strong support zone determined at the previous step.
The key levels coincide, and they become even more relevant to making price predictions.
Another conclusion we can make from the chart is that bears' next target price will be level 0.618 at around 1,430 USD once the red zone is broken. So, we have already got our profit fixing target to go short at a breakout.
Let's examine Fib 0.236 now as it seems to be significant as well. The price movement history confirms that. I often use that level as a trend weakness indicator. In a directed movement, the current price doesn't normally stay underneath that level for a long time. So, when the price goes to the trading range below 0.236, like in our example, that can be considered as an additional bearish signal of an upcoming reversal.
Moving averages
Technical analysis is rich in indicators, but a moving average is one of the oldest. It's a simple moving average, weighted or exponential, that reflects an average price over a certain period.
Regardless of which type of a moving average you will use, you'll have a lot of various trading signals. To use them correctly, you need to consider some factors:
Moving averages produce signals with a delay proportional to the period and the time frame.
Delays are directly proportional to the period and the time frame. The longer the period and the older the time frame is, the more delayed a signal will be.
The number of false breakouts is inversely proportional to the period and time frame. The smaller the period and the time frame is, the likelier a false signal is.
A moving average can be used only as a confirming indicator. Regardless of which time frame is used, false signals remain likely to happen.
There are many ways of using moving averages in trading. I'm going to share with you my author's method of using them as a support level indicator.
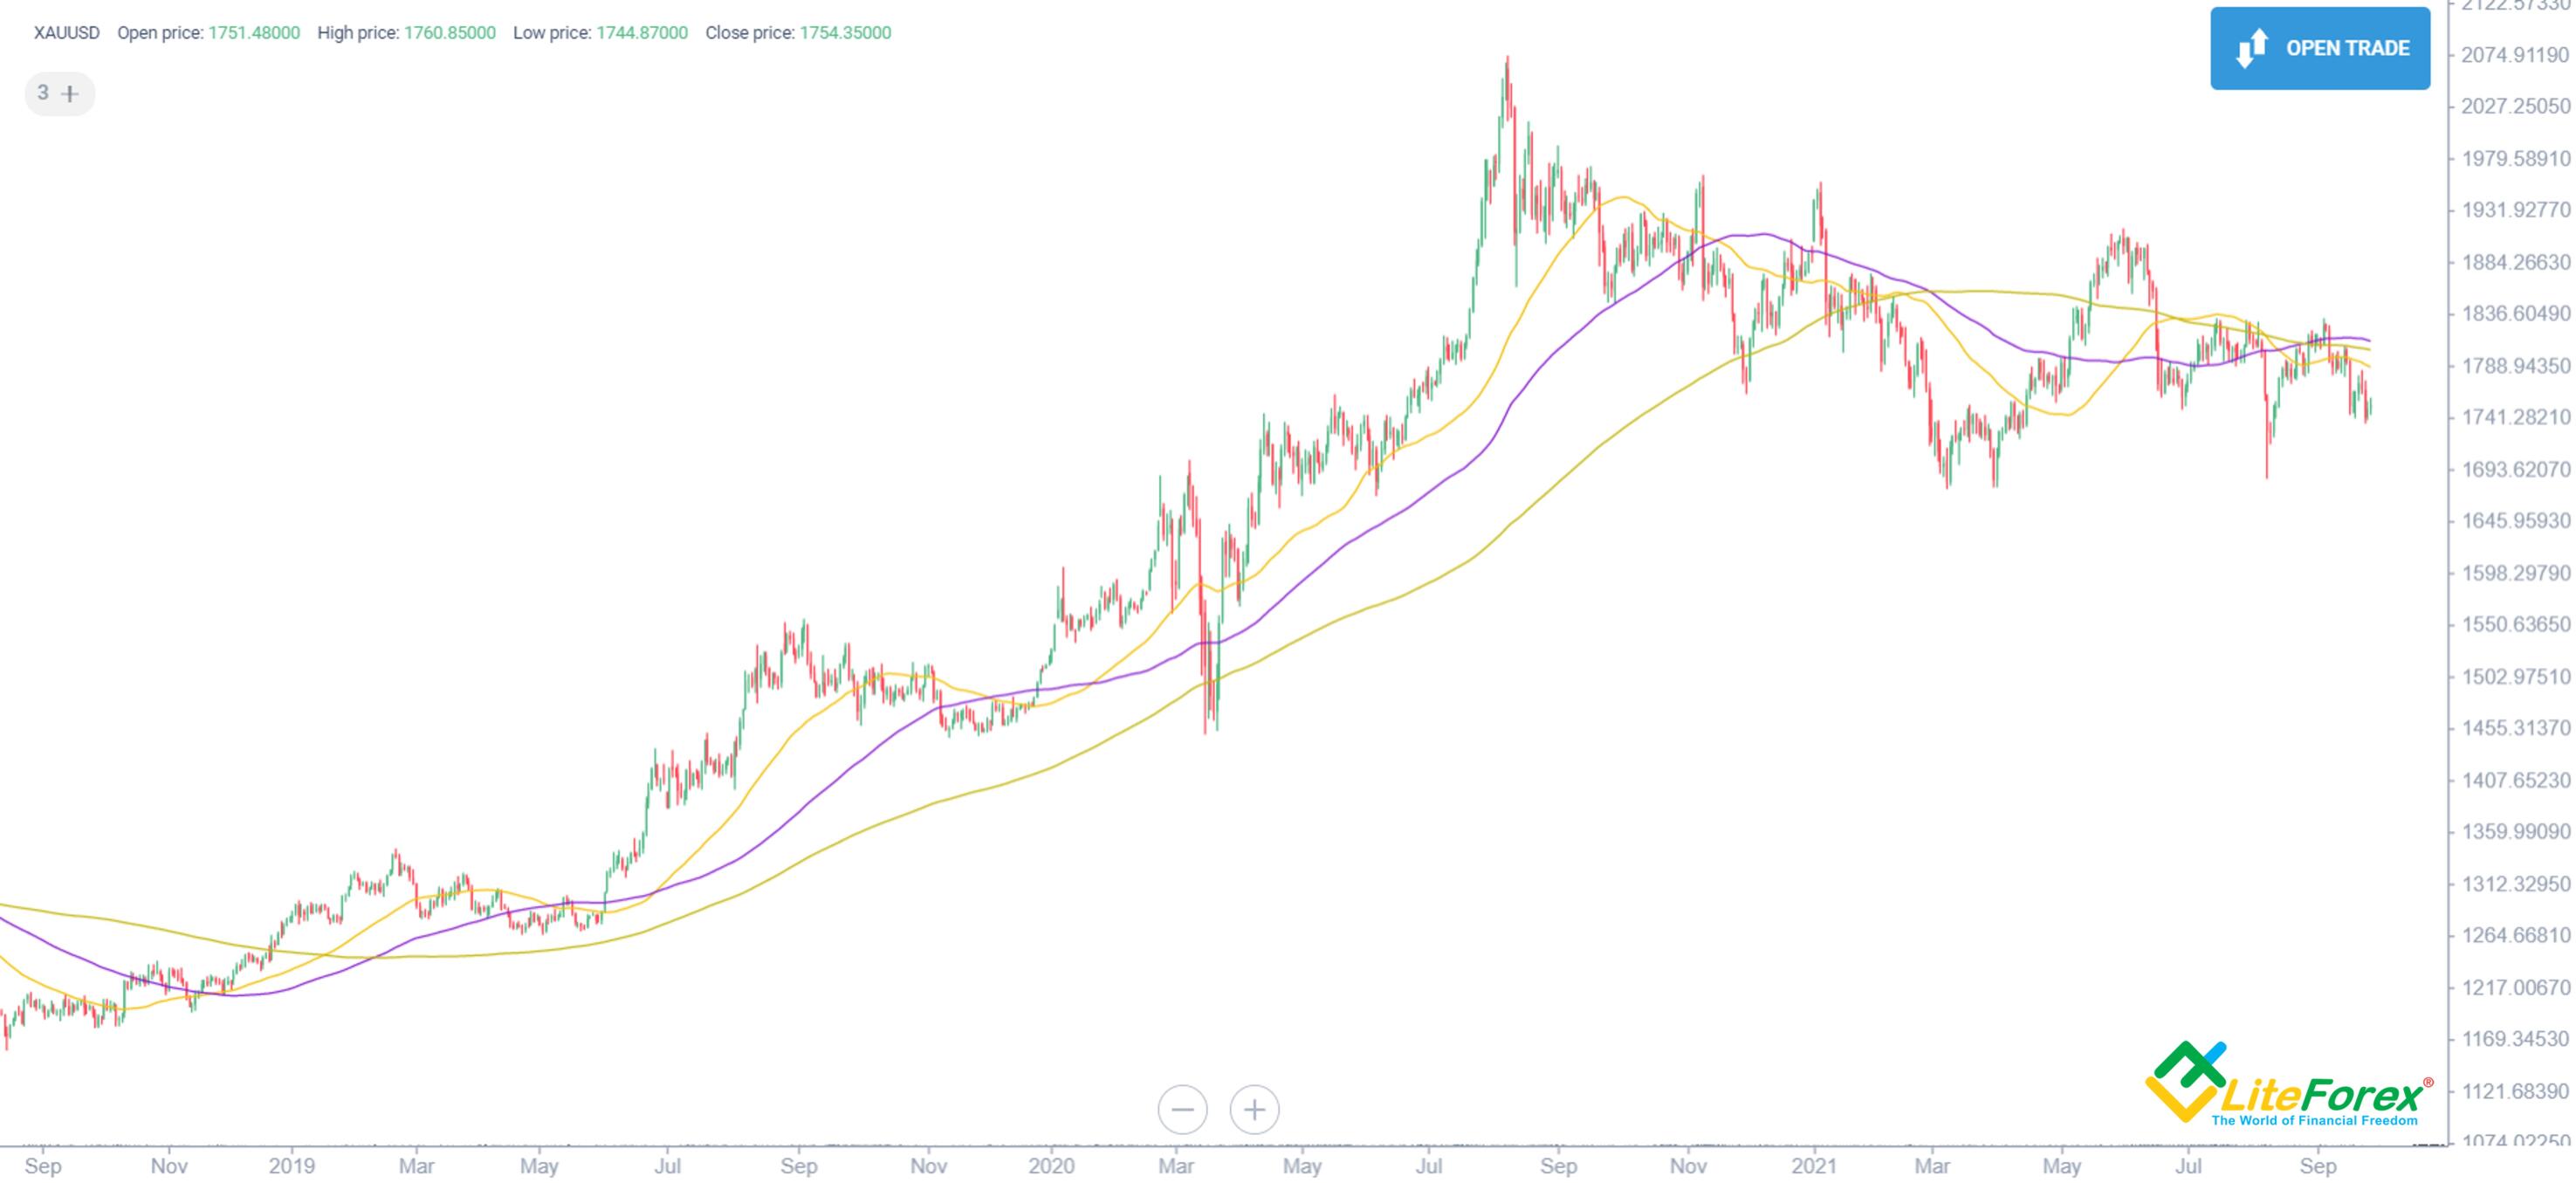
For a better understanding, I have used gold's example from my previous articles. If you do your analysis from scratch, you will need to determine local extremums first, as we did earlier to identify support and resistance levels. We need that step to define the right period for the MAs.
I'm using exponential moving averages, but that's not obligatory. You can pick another type of MA. However, EMAs proved to be the best in my practice.
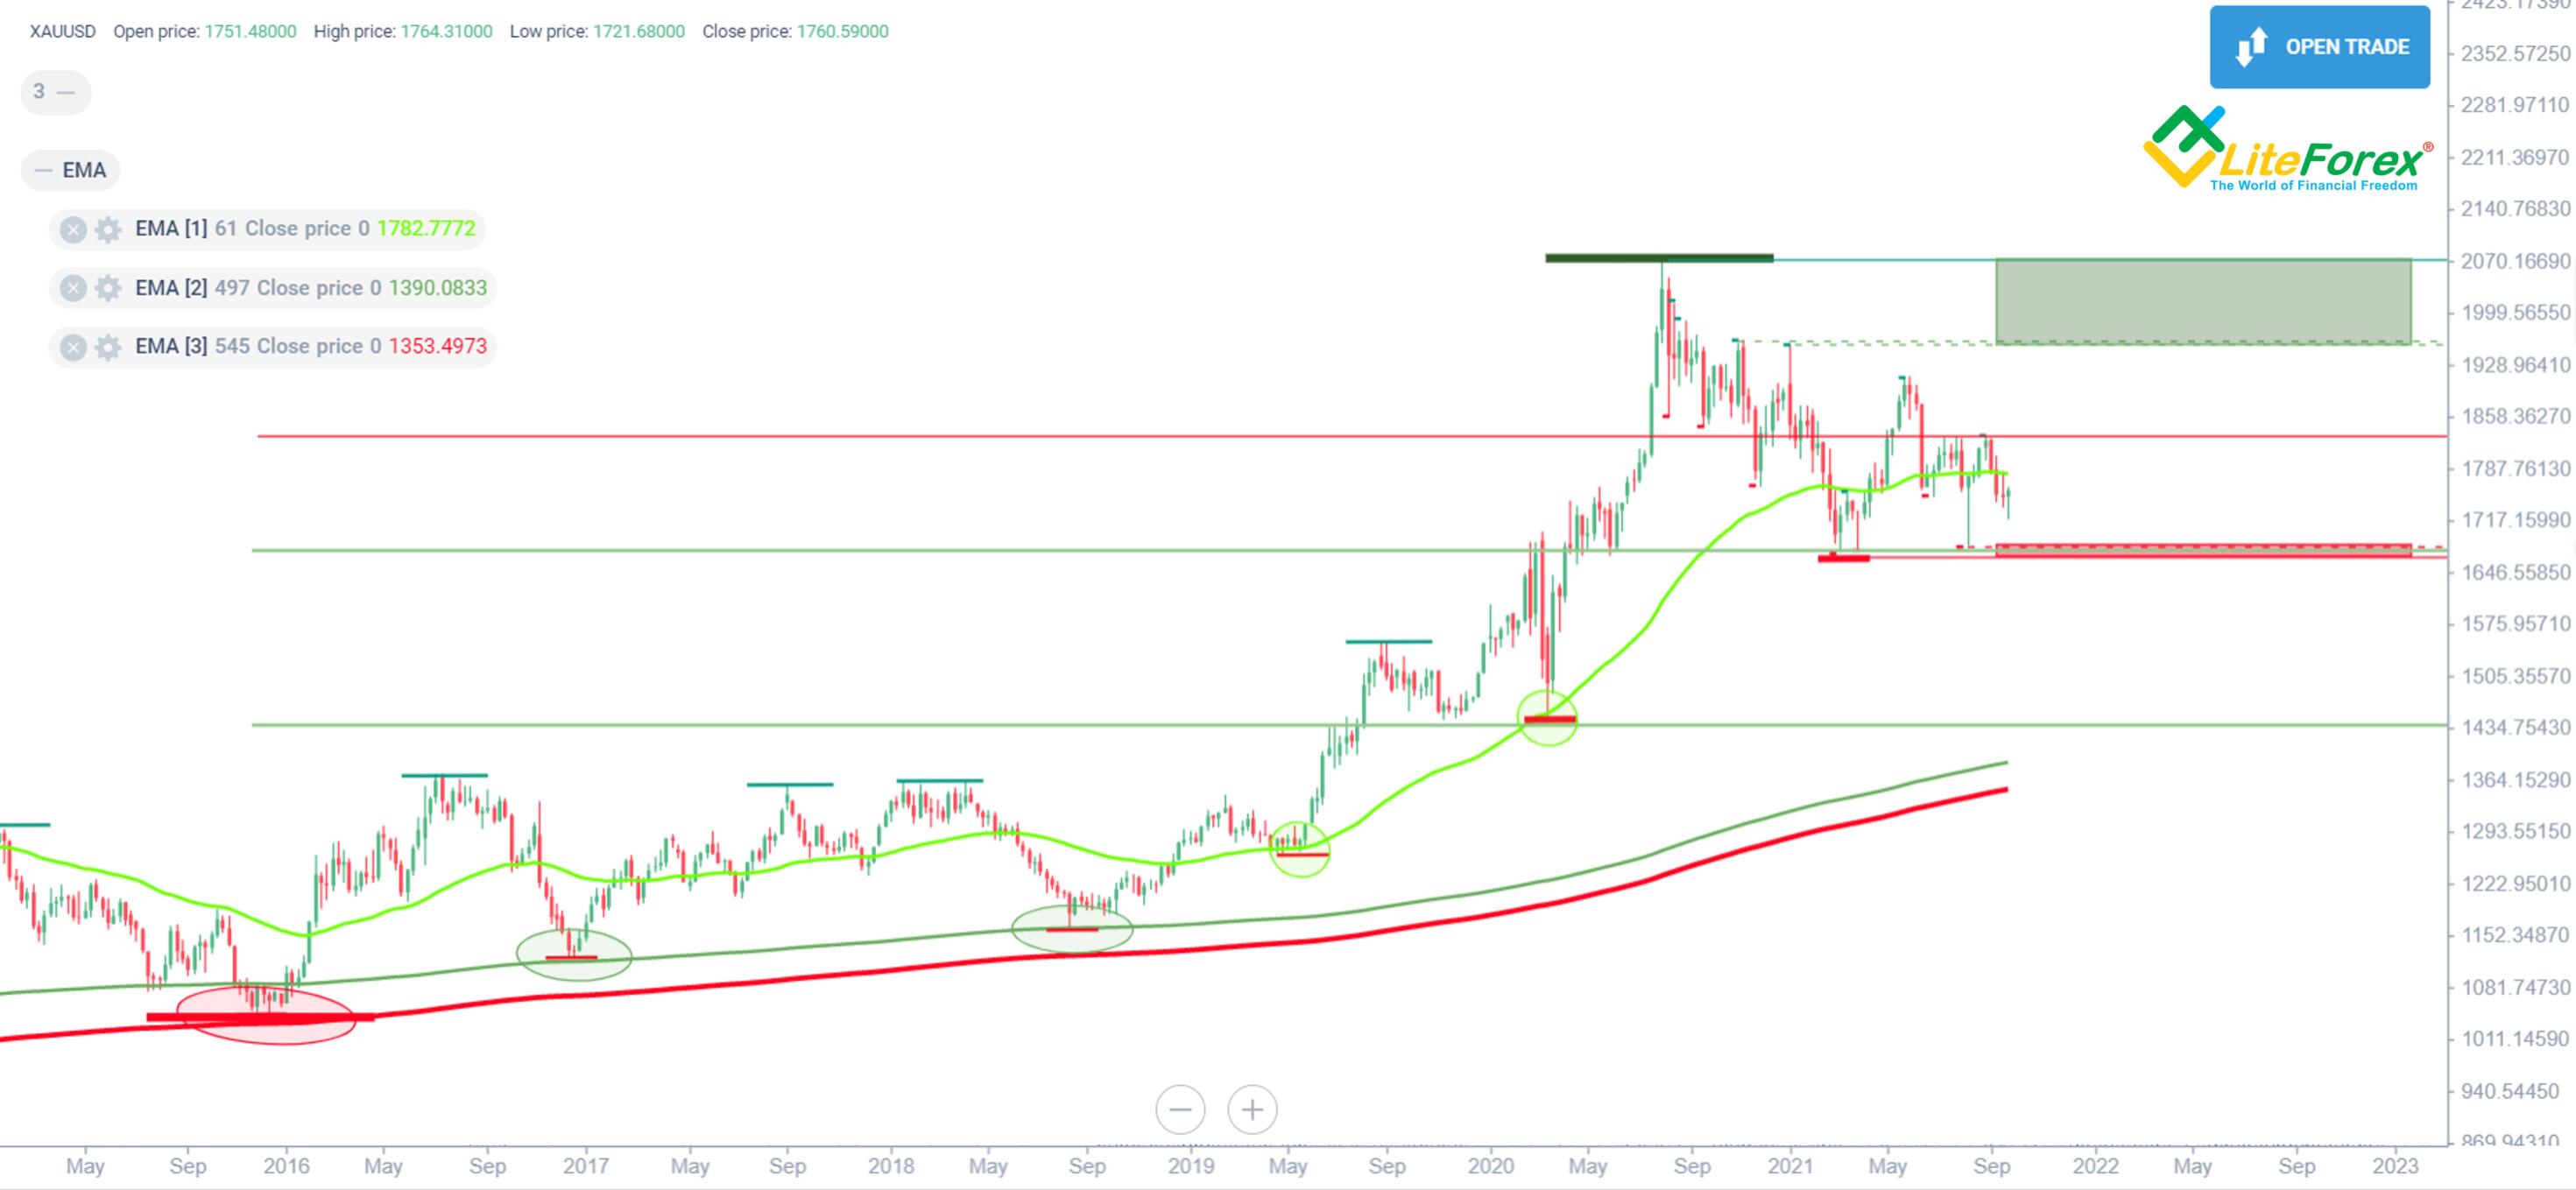
Add onto the chart three moving averages calculated when the candlestick's price closes. Choose a period for each EMA so that they cross as many chart extremums as possible. In my example, these are 61, 497, and 545 EMAs. The points of crossing the troughs are marked with circles on the chart above. The three moving averages formed are support lines. The longer a formation period is, the more powerful the support level is.
In our case, lines 497 and 545 are located nearby, so their impact on the market can be expressed as a single support area.
ЕMA(61) — the shortest one — indicates a change in price direction stages. We have a strong bullish movement if the price is above that line and retraces from it during a correction. If that line is crossed and the price is located underneath, we have a reversal or a flat market.
EMA(61) will produce similar signals in a downward movement too.
As EMA(497) and EMA(545) analyze longer periods, they are less prone to short-term changes. So, we can project their future locations and thus presume where those support levels will be shortly. This knowledge allows us to make a better trading plan.
One of the examples is presented in the chart above. We have already determined the nearest support zone using local extremums and Fibo ratios. Once that zone is broken, the next support level will be at 0.618 Fibo. We have already discussed that in the previous section.
Considering the location of our projections, we see that by the time the price has dropped to 0.618 Fibo, the long EMAs will be located somewhere close too, providing additional support. Moreover, since they reflect an upward movement, there is more and more bullish pressure put on bears with every new candlestick, and a bullish pullback is thus likely to happen. So, the target for short positions will be around 1,450 USD. It can be adjusted as moving averages are changing their location.
At the same time, that's a good area for opening short-term longs to exploit an eventual pullback. To open a long position, place Stop Loss on the other side of the MAs and 0.618 Fibo. The red zone becomes the nearest target, now showing resistance to more buyers.
Trend Lines usage

I have already mentioned that a dynamic support level can be used as a trend line. What about the opposite? Can a trend line be thought of as a support or resistance level?
First, let's specify the terms. What is a trend in technical analysis? It is marked as a segment or a ray reflecting the chart's ascending or descending direction. It sometimes occurs that the market doesn't move in one specific direction. Many traders can then say the market isn't trending or the market is flat. So, we understand a trend can be upward or downward. There isn't any other option.
The main sign of an uptrend is a progressive update of local lows. It’s the growth of minimum price values that indicates an uptrend. Why minimum price levels? That's all about supply and demand. Growing minimums indicate that the supply of an asset is far behind and can’t overcome demand in the market. The buyer is ready to buy without waiting for the price to fall to the previous level. Thus, an uptrend is formed through the price minimums and coincides with the support line. At the same time, maximums might not be updated for a while, so a dynamic resistance level might not coincide with a trend line in an uptrend.
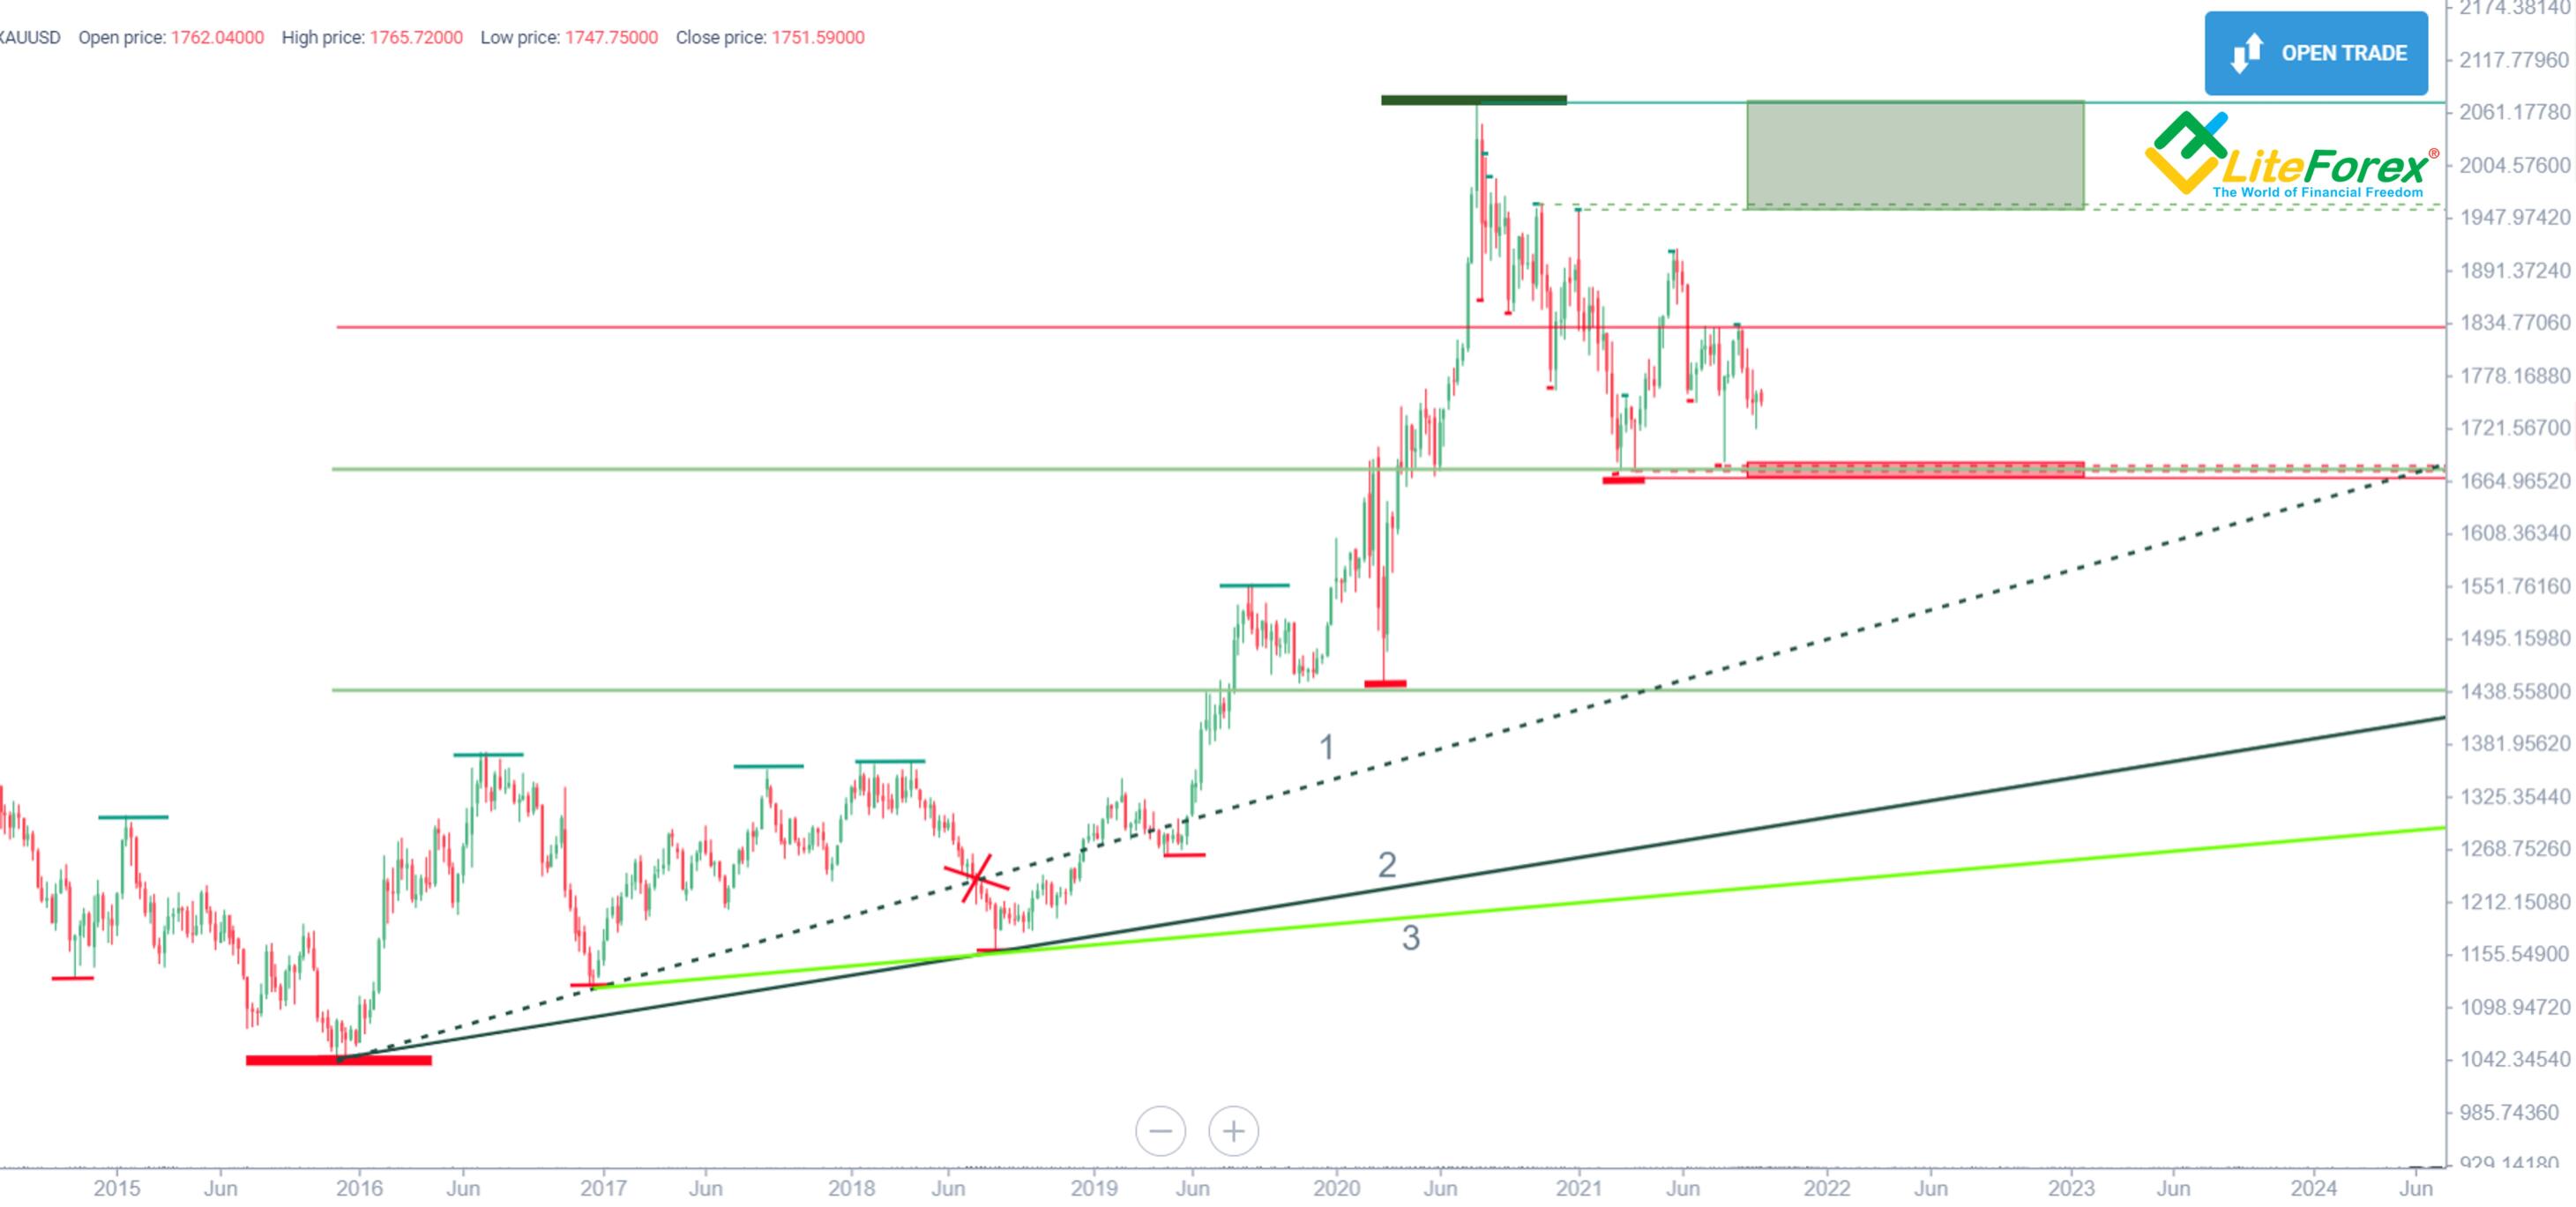
To draw a trend, we need at least two troughs. The strongest trend line starts from the lowest point - the minimum after which the direction changes. The next troughs form on price higher levels.
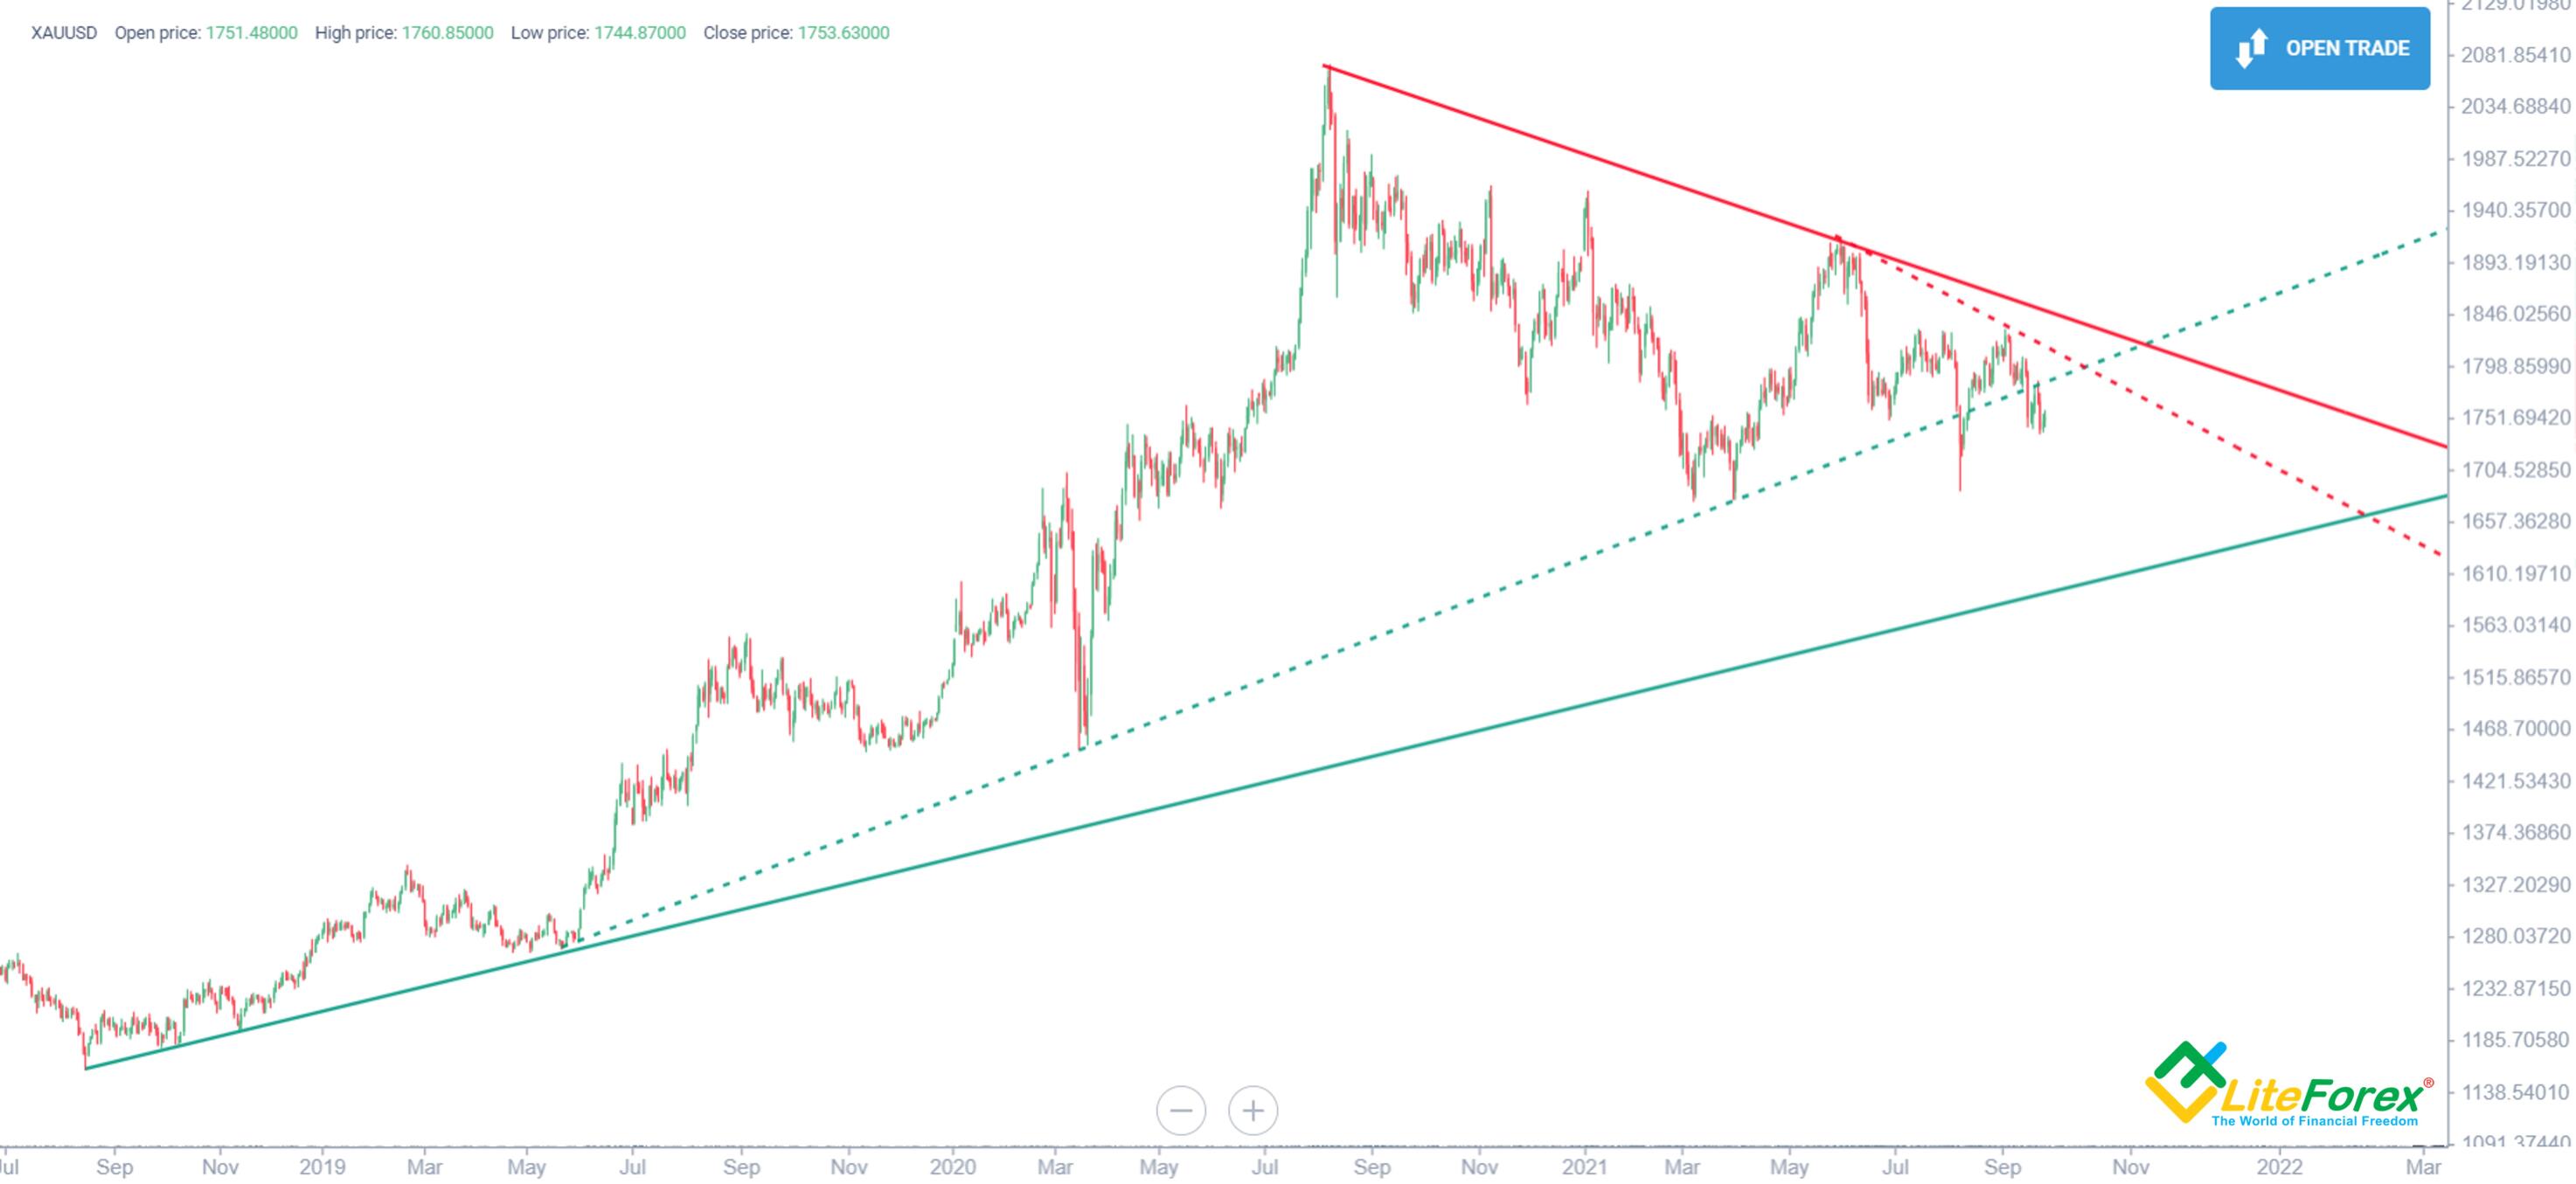
The chart above shows an example of such a trend line. The lowest point is marked with the bold red horizontal line. The next local trough serves as the second point. Thus, we can plot the line 1. In our example, it's crossed by the chart and cannot, therefore, be considered as a dynamic support line. To draw another trend line, we take the next trough as the second point. The second trend line is marked as trend line 2 on the chart.
An alternative option would be drawing a trend line whose starting point is the next local low. Such a dynamic level will be significant, but not as much so as a trend line starting from the price movement initial point. In our case, that dynamic level isn't significant as it's located below the main trend line. At the same time, trend line 2 is too far from the current market price levels and will be relevant only to long-term planning if the market faces a huge panic or starts correcting for a few years.
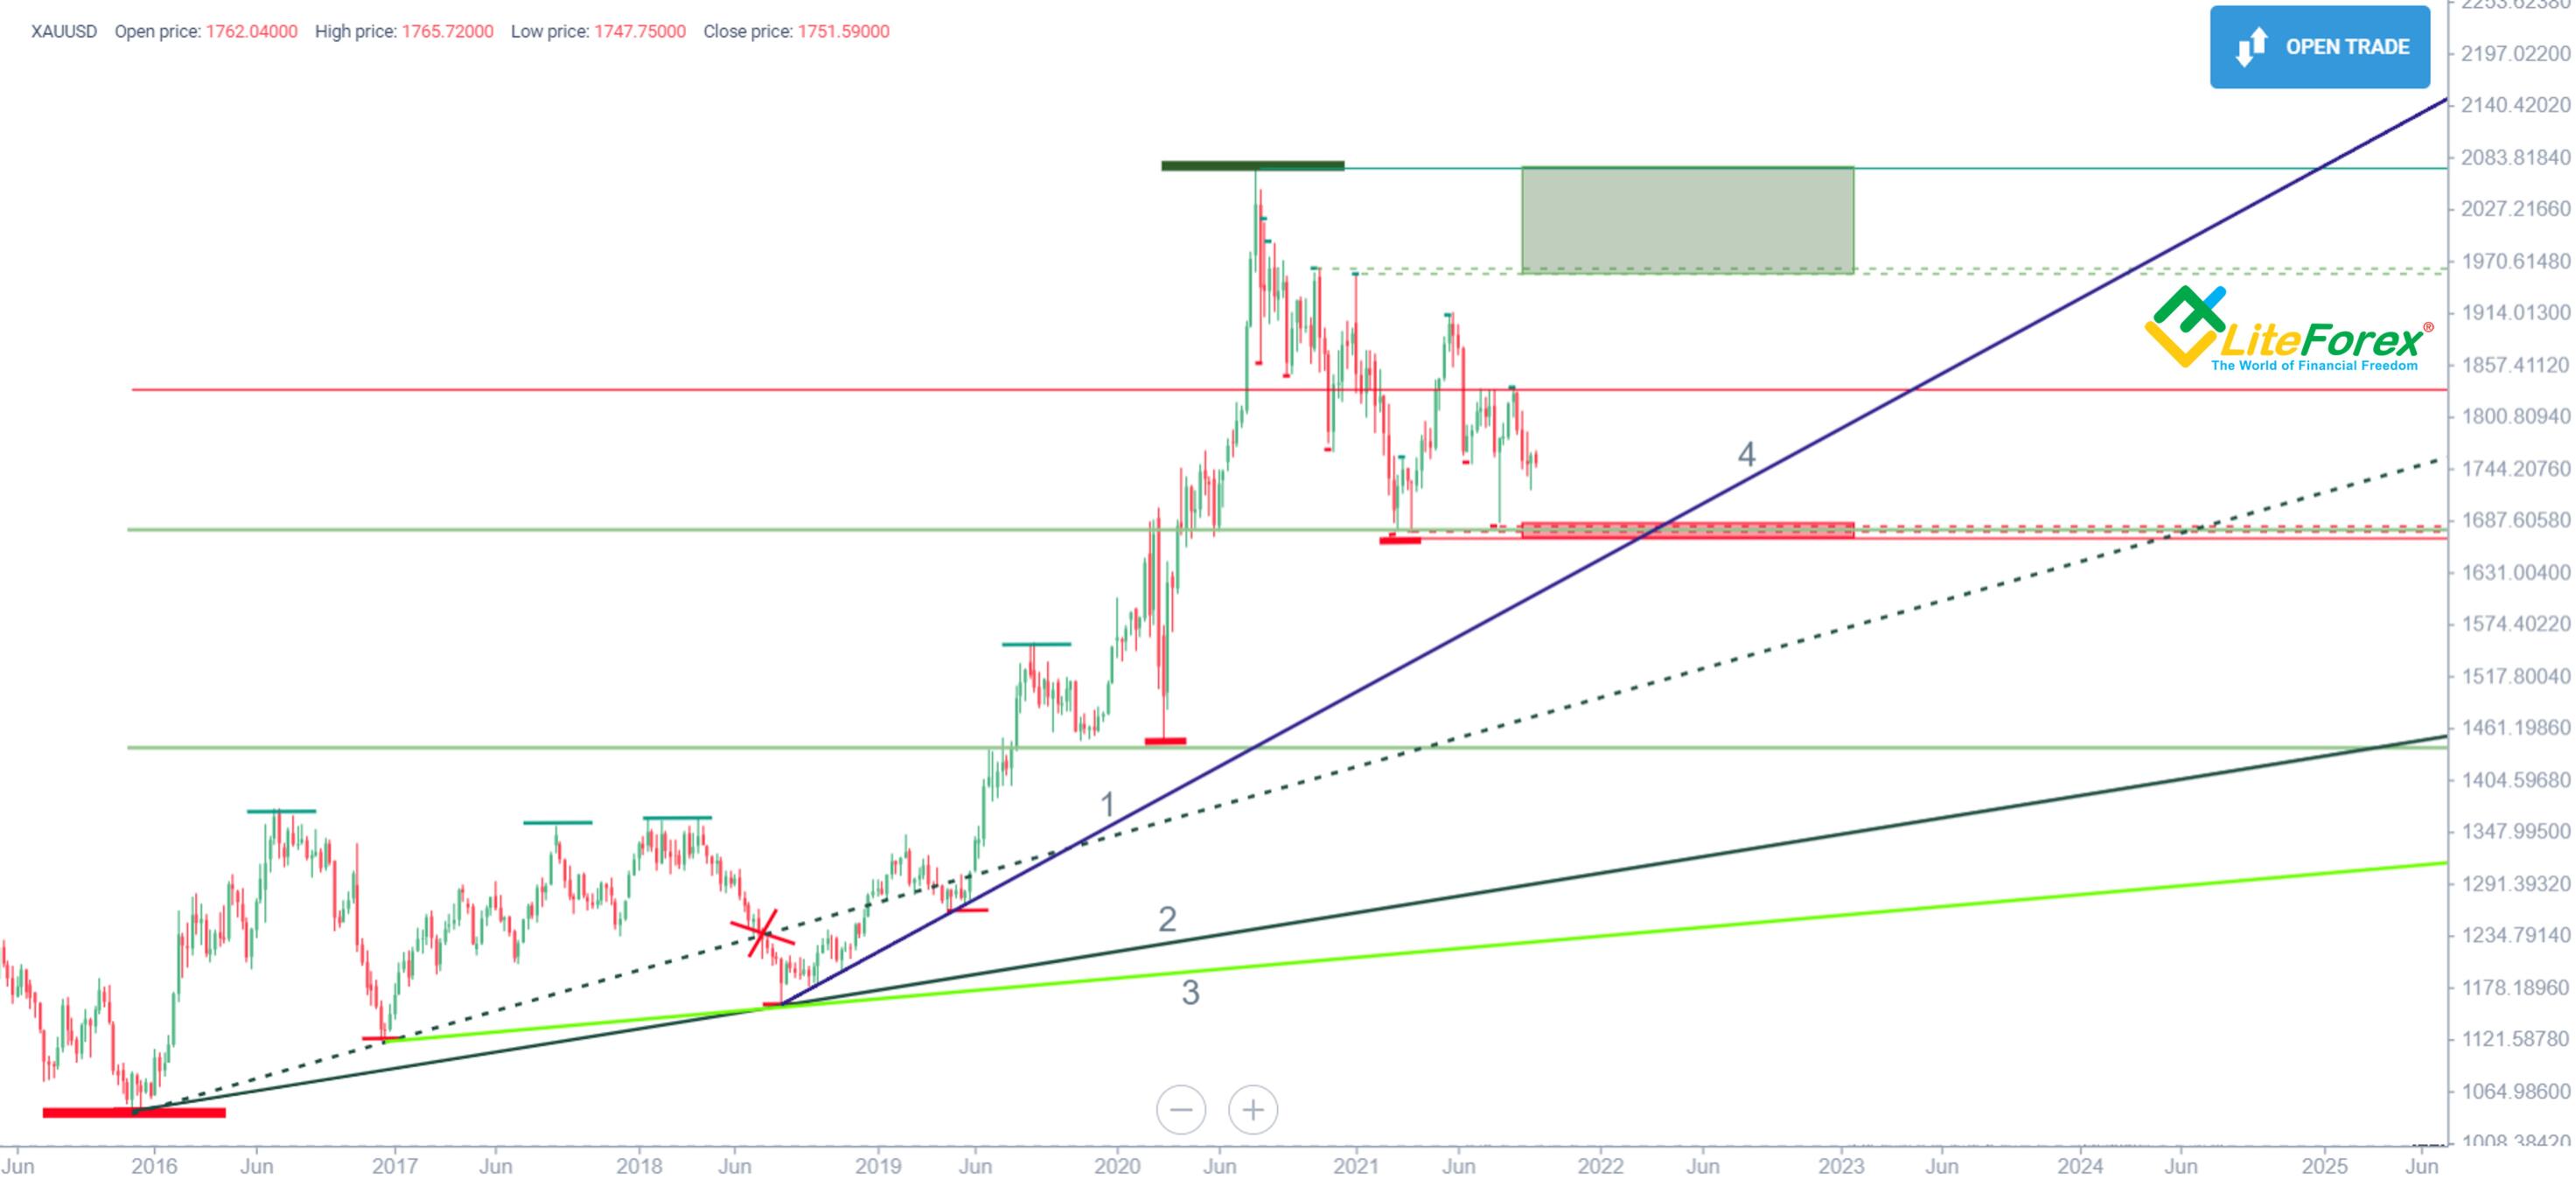
To allow for the market's development direction in our trading plan, we will draw one more local trend line through the subsequent troughs – ray 4 on the chart above. It crosses the red zone mentioned earlier and supports buyers. So, if we plan to open short positions at a breakout of that zone, we need to wait until the trend line itself is broken.
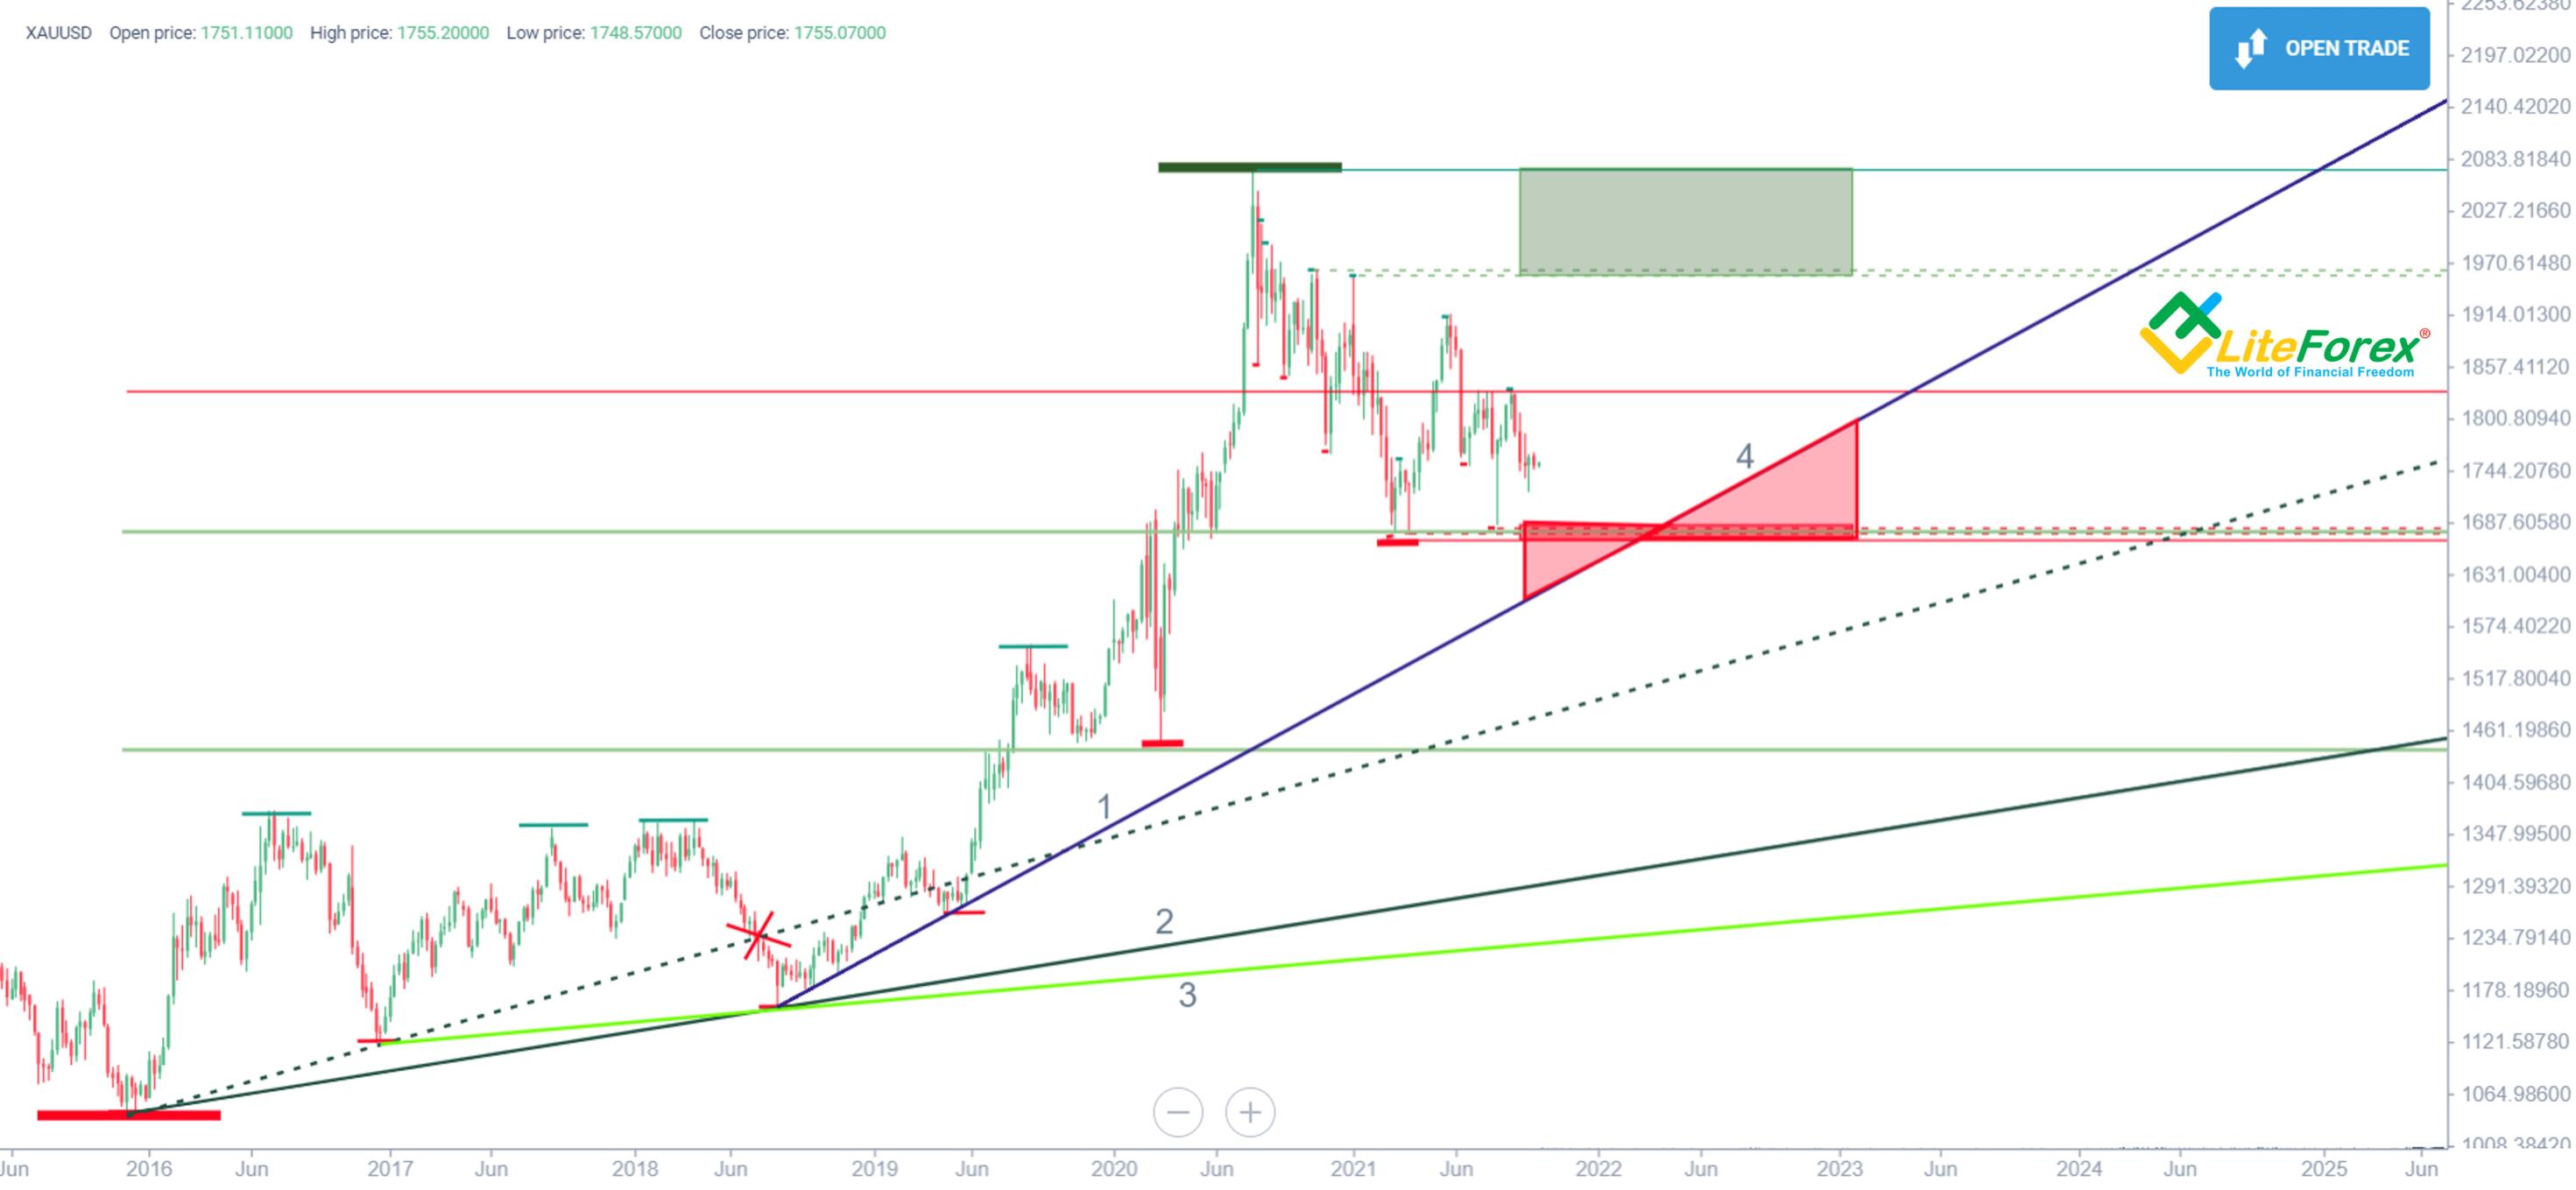
Thus, the area between the red zone and the trend line will also belong to the support zone. I've marked that zone on the chart above. It should also be considered in a trading plan to avoid false signals. In a downward price movement, lines are drawn in the same way based on maximum price levels.
Pivot Points
If you have never heard about Pivot Points, I recommend checking out the article where I've explained everything on the subject. Next, I'll talk about my experience of using that tool. PP is a fabulous support and resistance level indicator.
The key value - P - is calculated as an average between the lowest, the highest, and the closing price levels of the previous candlestick. The period is standardized: one day's, one week's, one month's, or one year's data is taken as a basis for calculation.
The types of Pivot Points are worth a mention, too. They have differing Support (S) and Resistance (R) calculation formulas. The most common PP types:
Traditional;
Fibonacci;
Woodie;
Classic;
Camarilla.
The indicator's type and analysis period are set in the settings. Check out this article for calculation models for each PP type. As for me, PP Fibonacci has turned the most convenient.
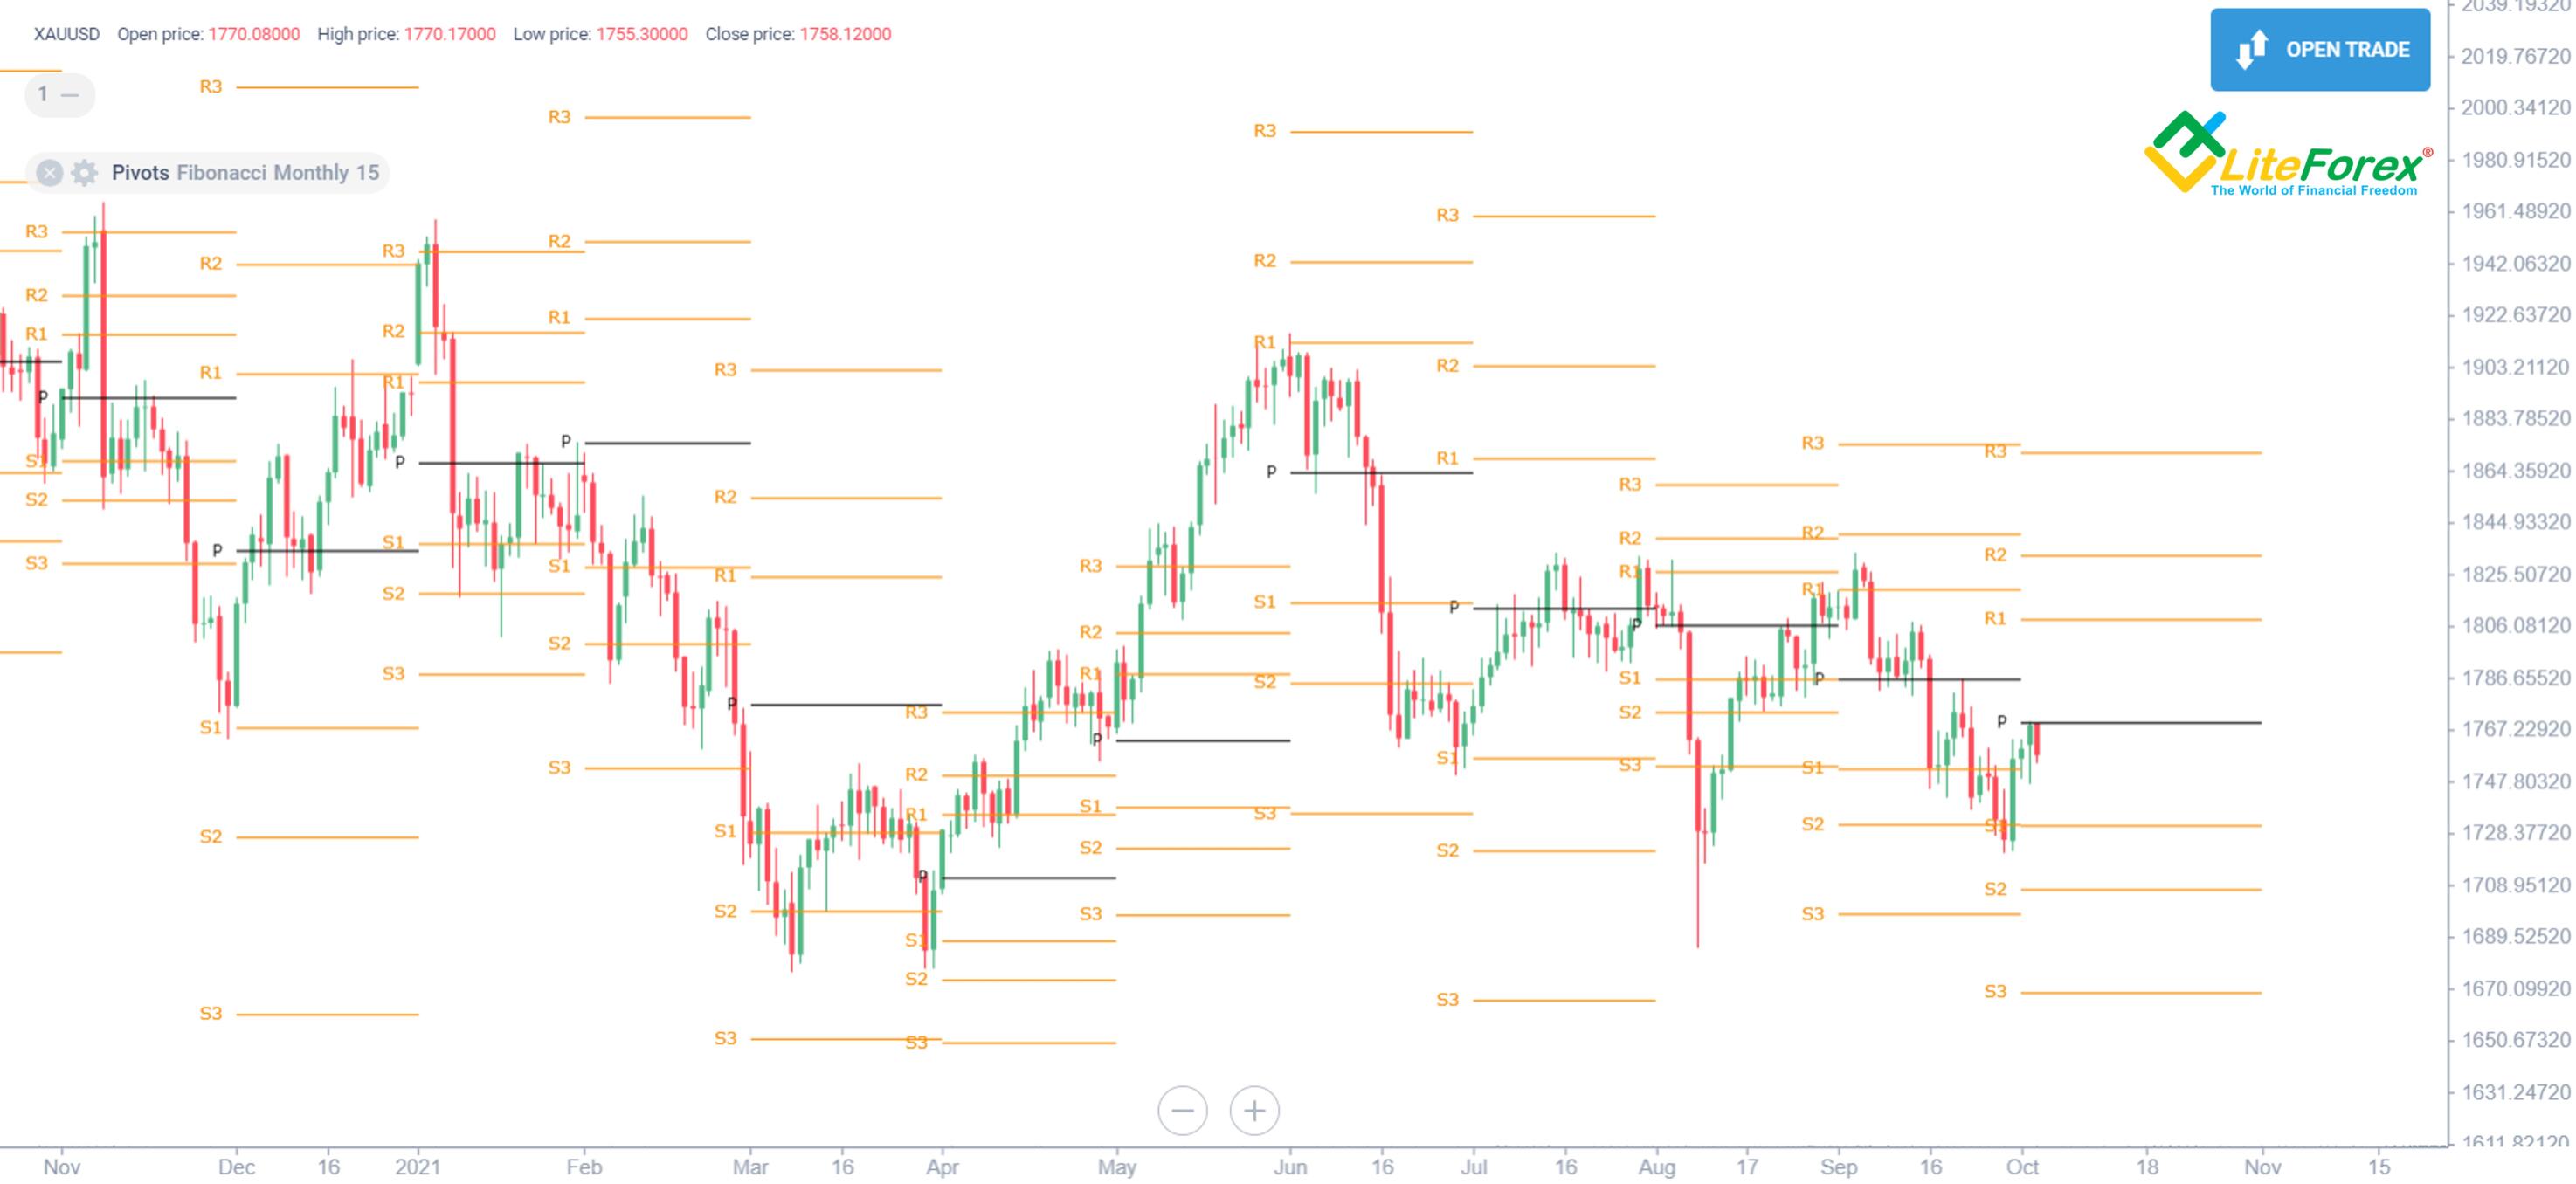
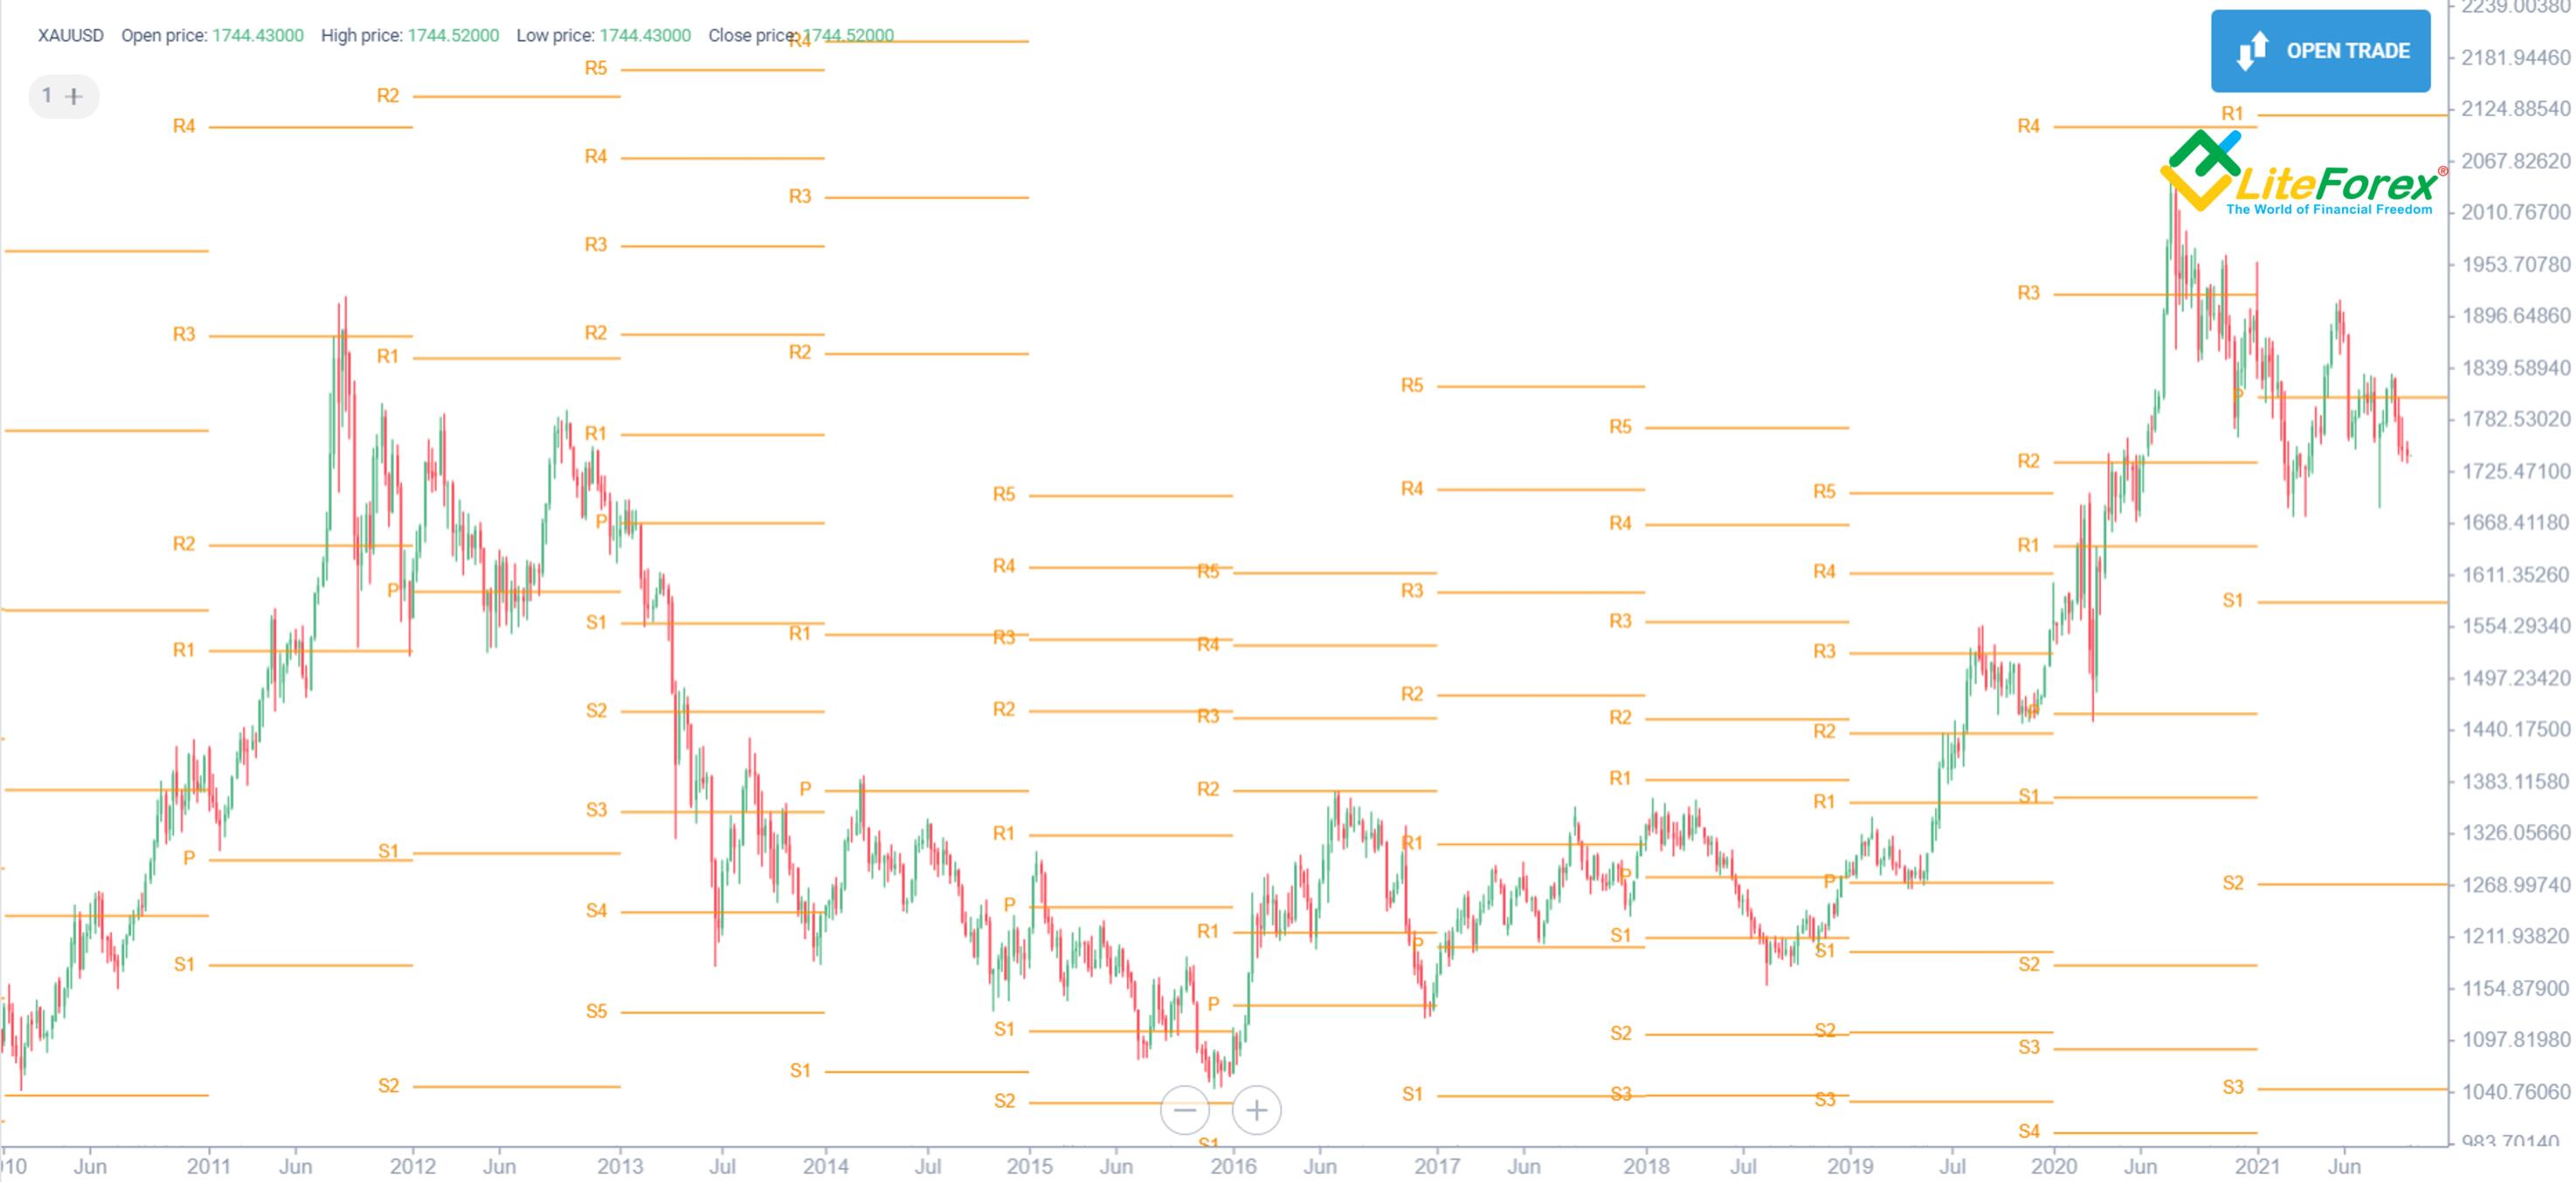
I also recommend setting a PP period two degrees longer than your time frame. If you work with a daily chart, select a monthly PP period; choose an annual period or older if you work with a weekly chart. I also suggest marking the (P) level in a different color. I chose black in the chart above. It's important because the Pivot value can produce several signals simultaneously:
it's usually located on a powerful resistance or support level.
(P) helps us determine the direction of a trend. If the price crosses that level, the trend will highly likely reverse.
If an asset is trading above the black mark, the market sentiment is positive, and vice versa.
The PP indicator also has support (S) and resistance (R) lines. In Fibonacci Pivot Points, there are three of them from each side. They mark support and resistance level areas. Now let's talk about their properties:
The price returns back after crossing the indicator's lines can have an opposite effect when a support level becomes resistance and vice versa.
When the price rises beyond the third support or resistance line, the market is oversold or overbought, respectively. We may then see a retracement to the third level, at least.
When several key levels overlap, coincide or come close to each other, their impact is even stronger.
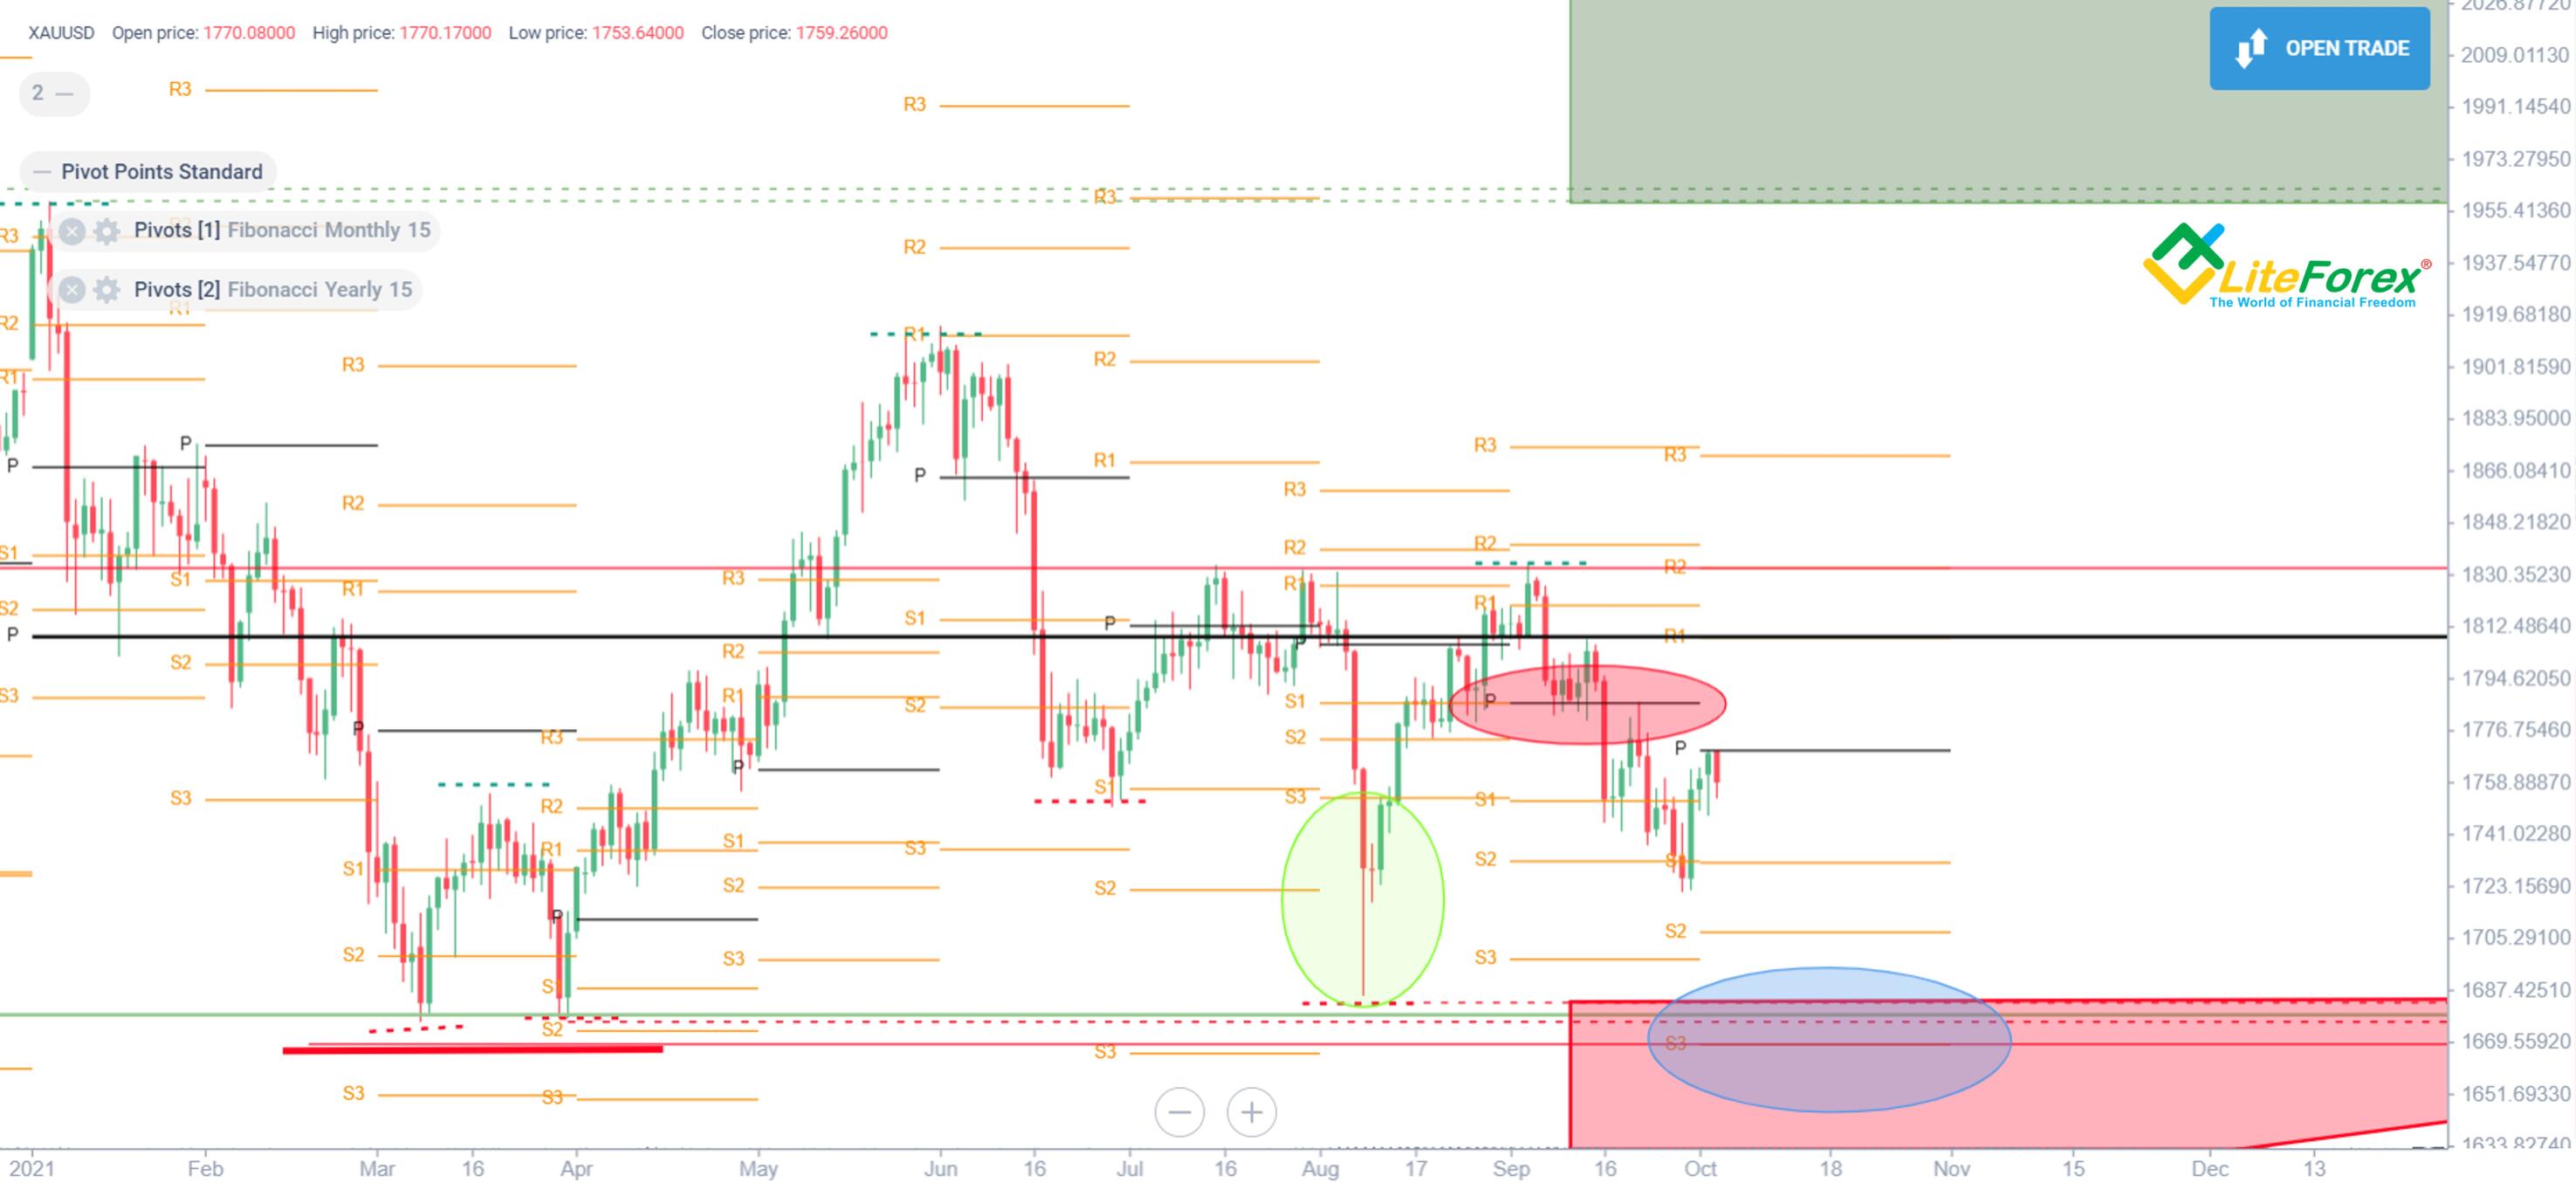
The chart above displays the three properties at once:
The opposite effect is marked with the red oval. We see that the Pivot line first served as support that the price failed to break through. Then, the price attempted to pull back after a crossover from above. (P) became a resistance line there.
The green oval marks an example where the price goes far beyond the third line. The trader had a signal of gold's overboughtness and could use scalping to buy the fall and make quick profits.
The blue oval marks several support and resistance levels’ overlay - the point where the S3 line, local troughs' key levels, and Fibonacci indicator coincide. That points to a better support quality at around 1,690 — 1,650 USD.
We can also see the annual long black Pivot line stretching across the screen on the daily chart. The price is mainly below that line, so the market sentiment is rather bearish. The same can be said of the monthly October Pivot line. The price is below that level. An attempt to cross the key level failed, and the correction will likely continue.
Psychological Price Points
This subject is easily understandable, but it still deserves our attention. Psychological Price Points are important to every trading instrument. That tool was adopted by marketing managers long ago when they understood buyers were afraid of round numbers. They would rather buy things at 99.99 USD than at 100. The same is in trading.
Let's examine psychological price points for the EURUSD pair in terms of market participants' behavior:
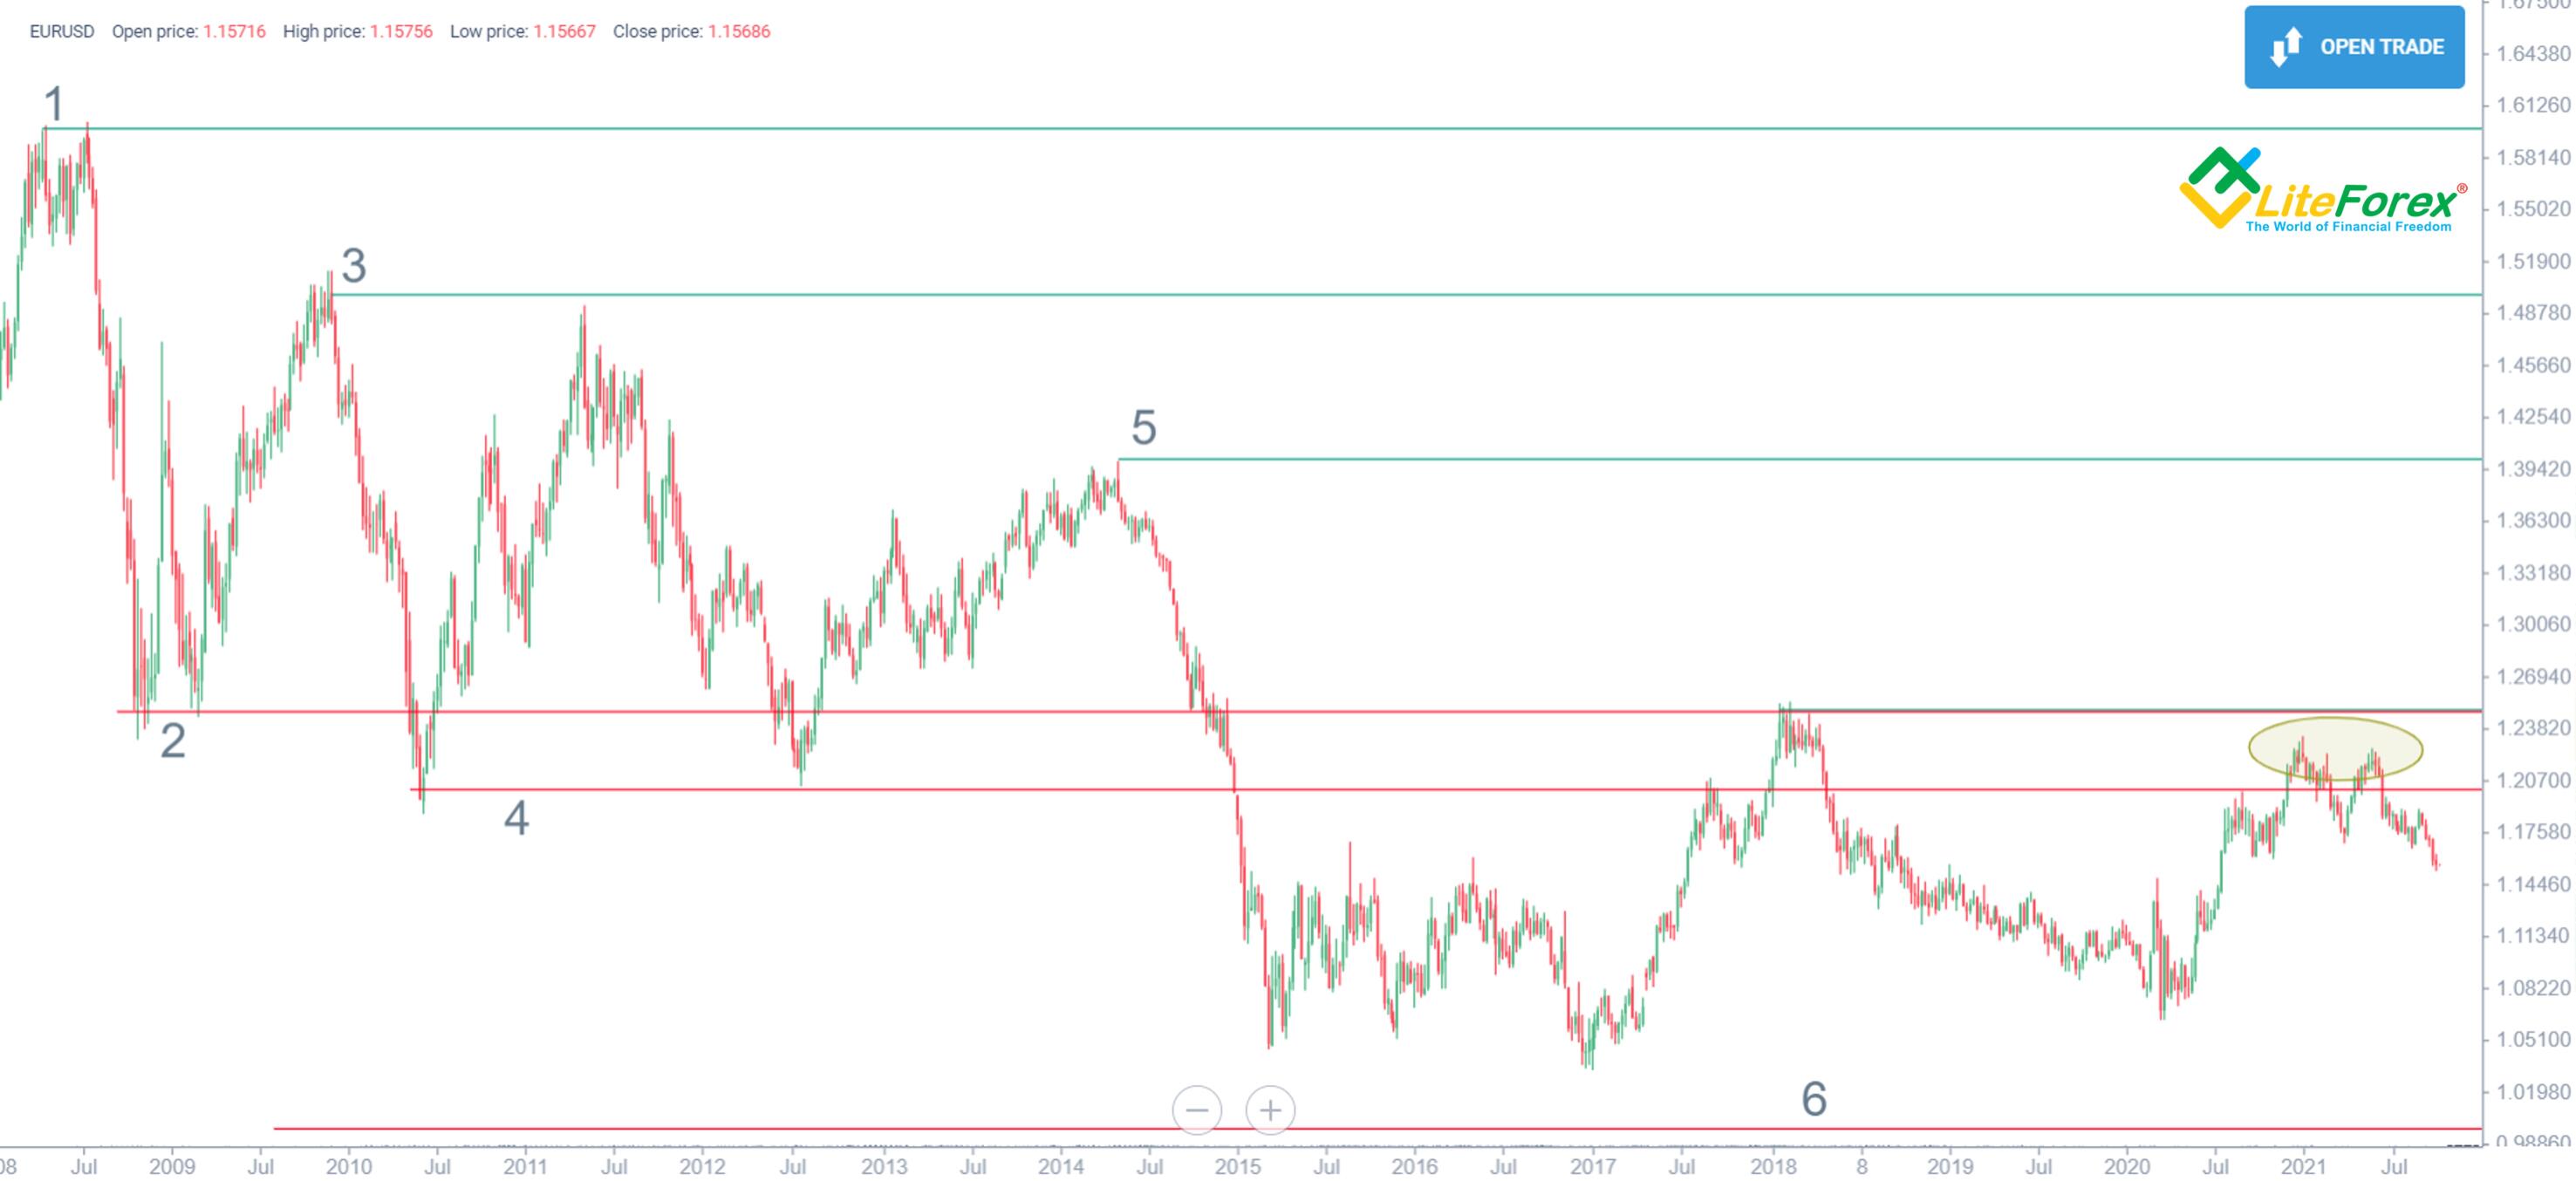
The price of 1.60 USD is the pair's all-time high. ATHs are usually round numbers that traders are finally unable to break through after a long ascending movement. The chart shows two attempts to break the 1.60 level. After the second one, the buyer gave in and started to fix profits.
Drastic price drops are often supported in the area close to round numbers, too. However, the middle between two round levels is quite often psychologically important as well. In our example, that's 1.25 USD. There's a simple reasoning here: the price of 1.20 seems too low. To be on time and buy cheap, many traders set pending orders one level higher. The trader's eye automatically "falls" onto the golden middle between 1.2 and 1.3, and we finally have a self-fulfilling forecast at around 1.25.
A drastic pullback naturally follows a drastic fall. Knowing that, traders plan their next target. They already know that the all-time high of 1.60 will attract sellers, so they will hurry to fix profits before that resistance level is reached. As we can see from the chart, someone planned to wait until a level of 1.55 USD was reached, but sales were triggered as early as at 1.50 USD because most participants eventually feared to be the last.
The value of 1.20 USD is another example of a round number among support levels. The buyer's weakness became obvious on the previous level 1. Most sellers grew enthusiastic and planned to fix profits at around 1.25. However, because of the market's inertia, buyers managed to stop the market movement only at around 1.20. Bears feared to go short below that level. The price on line 4 eventually became a new entry point for buyers.
The level of 1.5 was retested after the fourth wave. As that level had already been marked as the zone of the seller's interest, most buyers went short even before that level was reached. The peak became lower and lower after each of the buyer's further attempts to even the score. That's an important bearish signal. A level of 1.40 became the maximum after which bulls gave in completely. After that, the EURUSD rate could hardly come close to the psychological resistance level. At the same time, most market participants realized the buyer was too weak, and the price wouldn't rise further.
- There are important psychological levels that a price might not reach, but their impact is visible a long way. For the EURUSD, that would be a parity (1 USD for 1 EUR). Over many years of trading, market participants' behavior has been determined by the idea that the euro is always more expensive than the USD. So, every hint at reaching the parity level can provoke a stronger buying activity. As the chart suggests, the price tests reversing on the way to that value, and the distance between the psychological level and the price is significant here. The gap is gradually reducing. That's a clear indication of a bearish signal that speaks of the persistent selling pressure. If the situation doesn't change, the buyer will eventually get used to that price, and one euro costing one USD will no longer urge traders to buy the pair.
Thus, a lower price will become natural, and the psychological levels that used to be support will start working as resistance. Lines 2 and 4 on the chart above prove that. The EURUSD used to rebound from 1.25 - 1.20 level like a tennis ball. These days, the price tests dropping before approaching resistance levels.
Start trading with a trustworthy broker
Stock Support and Resistance Levels: How to trade them?
Using support and resistance levels in stock trading is a bit different:
In the long term, the stock market is bullish, so trading retracements and breakouts is popular in the stock market.
Unlike the Forex market, the stock market also provides non-liquid stocks that can break through all key levels and move contrary to technical analysis. I recommend using Support and Resistance trading range levels only in high-liquid stock trading. Such stocks must be included in stock indexes.
The US stock market is the world's busiest one. Trading top stocks there, pay special attention to psychological and dynamic price levels because most traders and trading algorithms consider them.
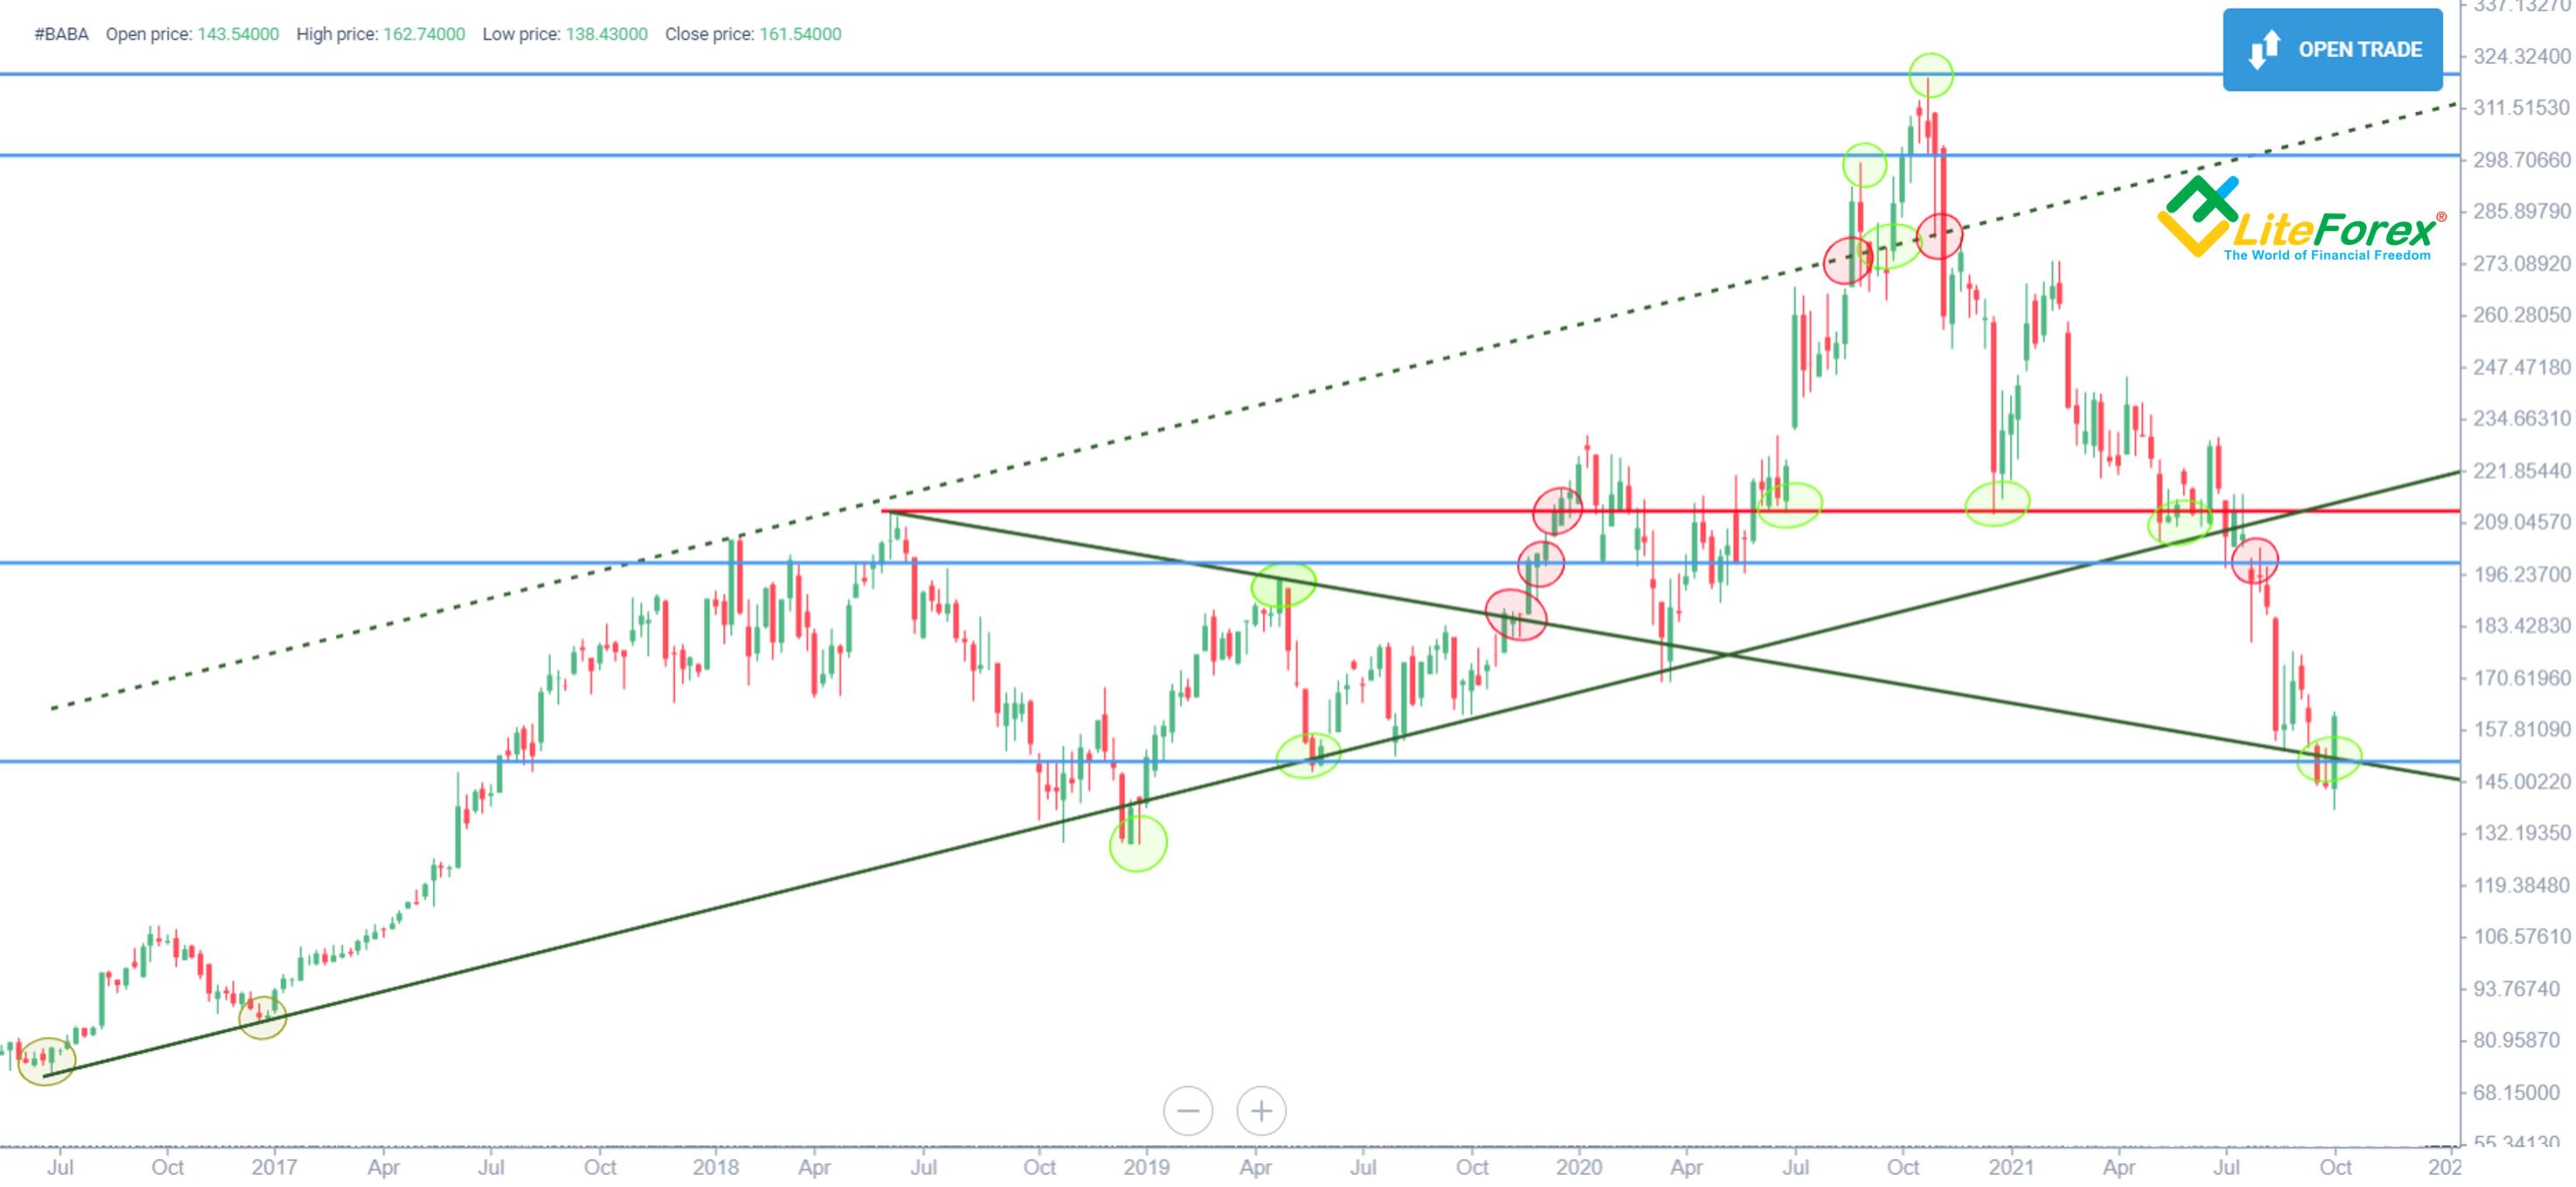
The chart above presents Alibaba Group's stock chart, including support and resistance levels. The blue lines mark psychological values. The red ray marks the local peak. The green trend lines mark dynamic support and resistance levels. The green dotted lines are a projected dynamic support line. The green circles mark pullbacks, and the red circles mark resistance breakouts.
Please have a thorough look at that chart. You will see that every time the price breaks out of the key line and every pullback from support are followed by a strong dynamic price movement. Using key levels in stock trading can improve your trading quality and make your trading safer.
Summary
Importance of Support and Resistance
I hope many practical examples and key takeaways I have provided in this article persuaded you to use support and resistance lines in trading. Having adopted this trading technique, you will improve your trading strategy, understand the market better, and see its development prospects and the nature of its behavior. If you’ve read the article from A to Z, you have:
found out about the principles of key levels formation;
learned about horizontal and dynamic support lines;
found out how to draw support and resistance lines correctly;
learned to determine support and resistance zones on MT4/MT5 and LiteFinance's online platform;
examined the main indicators of support and resistance trading range levels on the gold price chart;
found out about psychological levels using a real example;
examined support and resistance zones in the stock market.
If you're a beginner, I recommend:
bookmarking this article;
opening a demo account in two clicks on LiteFinance's online platform;
getting back to this article, and repeating all the exercises from each section yourself;
unsubscribing from all paying channels with trading signals and online courses. You can find everything for free;
gaining your personal trading experience. No money can buy that! Open a real money account only after you feel confident and risk only the amount you can afford to lose easily;
Remember that a beginner trader should avoid high risk strategies and strictly observe risk management!
Good luck and profits, everyone!
Support and Resistance FAQ
They represent the price of an asset that a considerable part of market participants believes to be interesting. On support levels, that's the price that pushes the market to continue moving in the previous direction and growing buying interest in the asset. On resistance levels, that's the price that pushes the market to start trending in the opposite direction and selling the asset.
Support determines a trading instrument's price that induces traders to support the previous trend. A support line is a graphic object that marks support on the chart. Support and resistance levels are strongly affected by buying and selling pressure in the following way:
Support: If there is strong buying pressure, the price may be able to break through a support level and continue to rise. On the other hand, if there is weak buying pressure, the price may struggle to break through the support level and potentially fall.
Resistance: If there is strong selling pressure, the price may struggle to break through a resistance level and potentially fall. On the other hand, if there is weak selling pressure, the price may be able to break through the resistance level and continue to rise.
The support and resistance trading range areas normally accumulate seeling or buying interest and many pending orders, which reflect trading targets, averaging, or loss limits. Knowing that, other market participants use support and resistance values to estimate the market condition, sentiment, and future moves. So, they make their trading plans based on that information. There are several methods to identify levels of support and resistance: trend lines, moving averages, previous Highs/Lows, etc. However, before taking decisions it's important to remember that these levels can change over time and multiple levels of support and resistance may exist for different financial instruments.
The most common way to identify levels of support and resistance is to analyze peaks and troughs. Moving averages, Fibonacci ratios, Pivot Points, and trend analysis also help determine support and resistance zones.
Formally, when the price crosses the support level from above. In practice, the price can cross the line and pull back shortly. That's called a "false breakout." To make sure the price breaks out for real, wait for consolidation: the current and the next candlestick price closes underneath the broken level amid increased trading volumes.
There are exceptions to every rule, and analyzing support and resistance zones or past performance cannot guarantee 100% trading success. However, that's one of the simplest ways to analyze market psychology, make a forecast, and form a trading plan.There are lots of traders that follow this technique and use it in practice, which makes it even more efficient. However, to increase efficiency of this indicator it’s recommended to implement it in combination with other technical tools such as stop losses, chart patterns, maving averages, etc.
Not shorter than a one-hour time frame are suitable for trading range. Leave short time frames to trading algorithms and robots. The longer your analyzed time frame is, the more reliable it is. End-to-end analysis shouldn't be ignored either. Examining several time frames for one trading instrument can add much to the general market picture.

The content of this article reflects the author’s opinion and does not necessarily reflect the official position of LiteFinance. The material published on this page is provided for informational purposes only and should not be considered as the provision of investment advice for the purposes of Directive 2004/39/EC.