The Heikin-Ashi chart looks very similar to your usual Japanese candlesticks, which are an extremely popular and convenient technical analysis tool. However, Heiken-Ashi is calculated based on a unique formula, which is completely different from the standard one. Today, I’m going to tell you how the Heiken-Ashi bars work, and how they differ from Japanese candlesticks, how to read their signals, and how to trade in the Forex market.
The article covers the following subjects:
- What Are Heikin-Ashi Candlesticks?
- How Does Heiken-Ashi Work?
- Japanese Candlesticks vs. Heikin-Ashi Candles
- How to Read Heiken-Ashi Candles
- Heikin-Ashi Formula - Heiken-Ashi Candle Calculation
- Heiken-Ashi Candles Models
- Heikin-Ashi Trends
- Heiken-Ashi patterns
- Heikin-Ashi Candlesticks Trend Analysis Example
- How to Use the Heiken-Ashi Indicator in Forex Trading
- Heikin-Ashi Trading Strategy
- Heiken-Ashi Scalping Strategy
- Ichimoku and Heiken-Аshi
- How to use Heiken-Ashi Indicator With MT4
- Benefits and Limitations
- Heikin-Ashi vs Renko
- Heikin-Ashi indicator FAQ
- Summary
What Are Heikin-Ashi Candlesticks?
"Heikin Ashi" means "average bar" in Japanese. Interestingly, there is no correct spelling of this phrase in the Latin alphabet. Some well-known technical traders and publications use "Heikin-Ashi". Others use "Heiken-Ashi."
The indicator is used to filter out market noise. This stems from the unusual design of the Heikin-Ashi candlestick - it is built by averaging four parameters: open, close, max, and min (maximum and minimum price data values).
To put it differently, the standard Japanese bar chart is redrawn into an average price form with minor price data fluctuations smoothed out. Therefore, for simplicity’s sake, Heiken-Ashi can be called a kind of candlestick moving average.
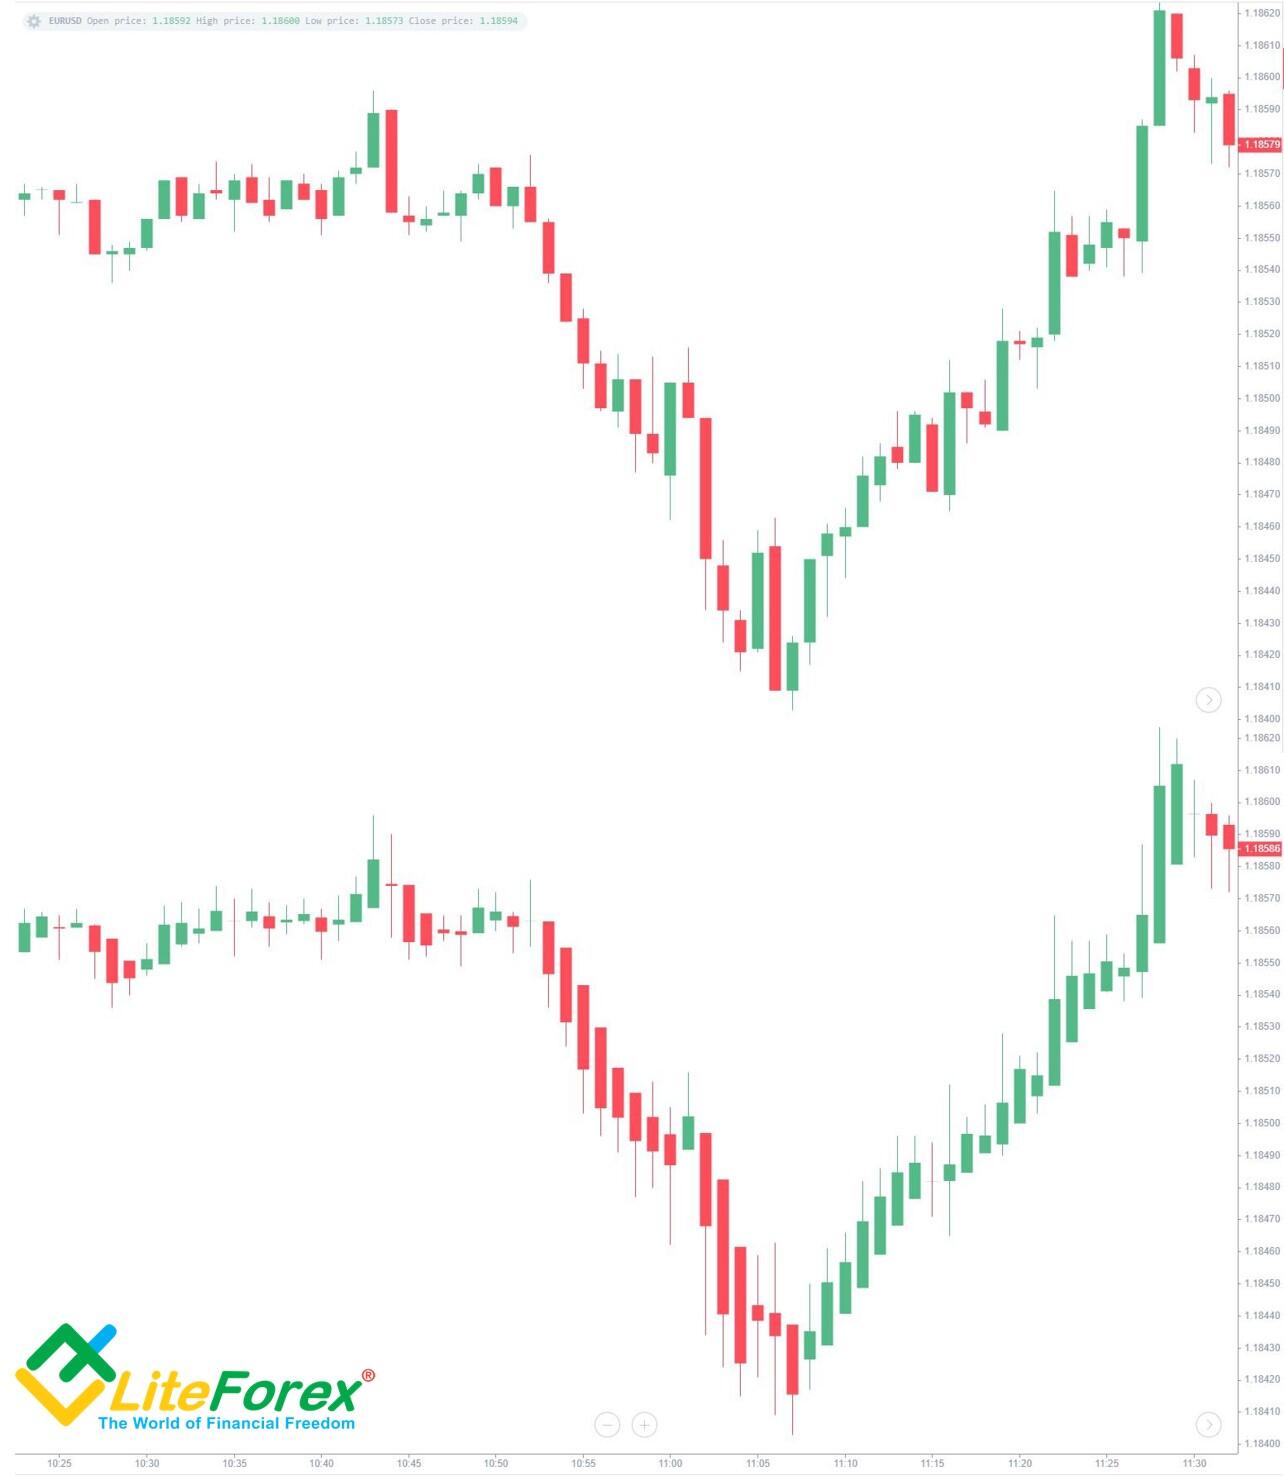
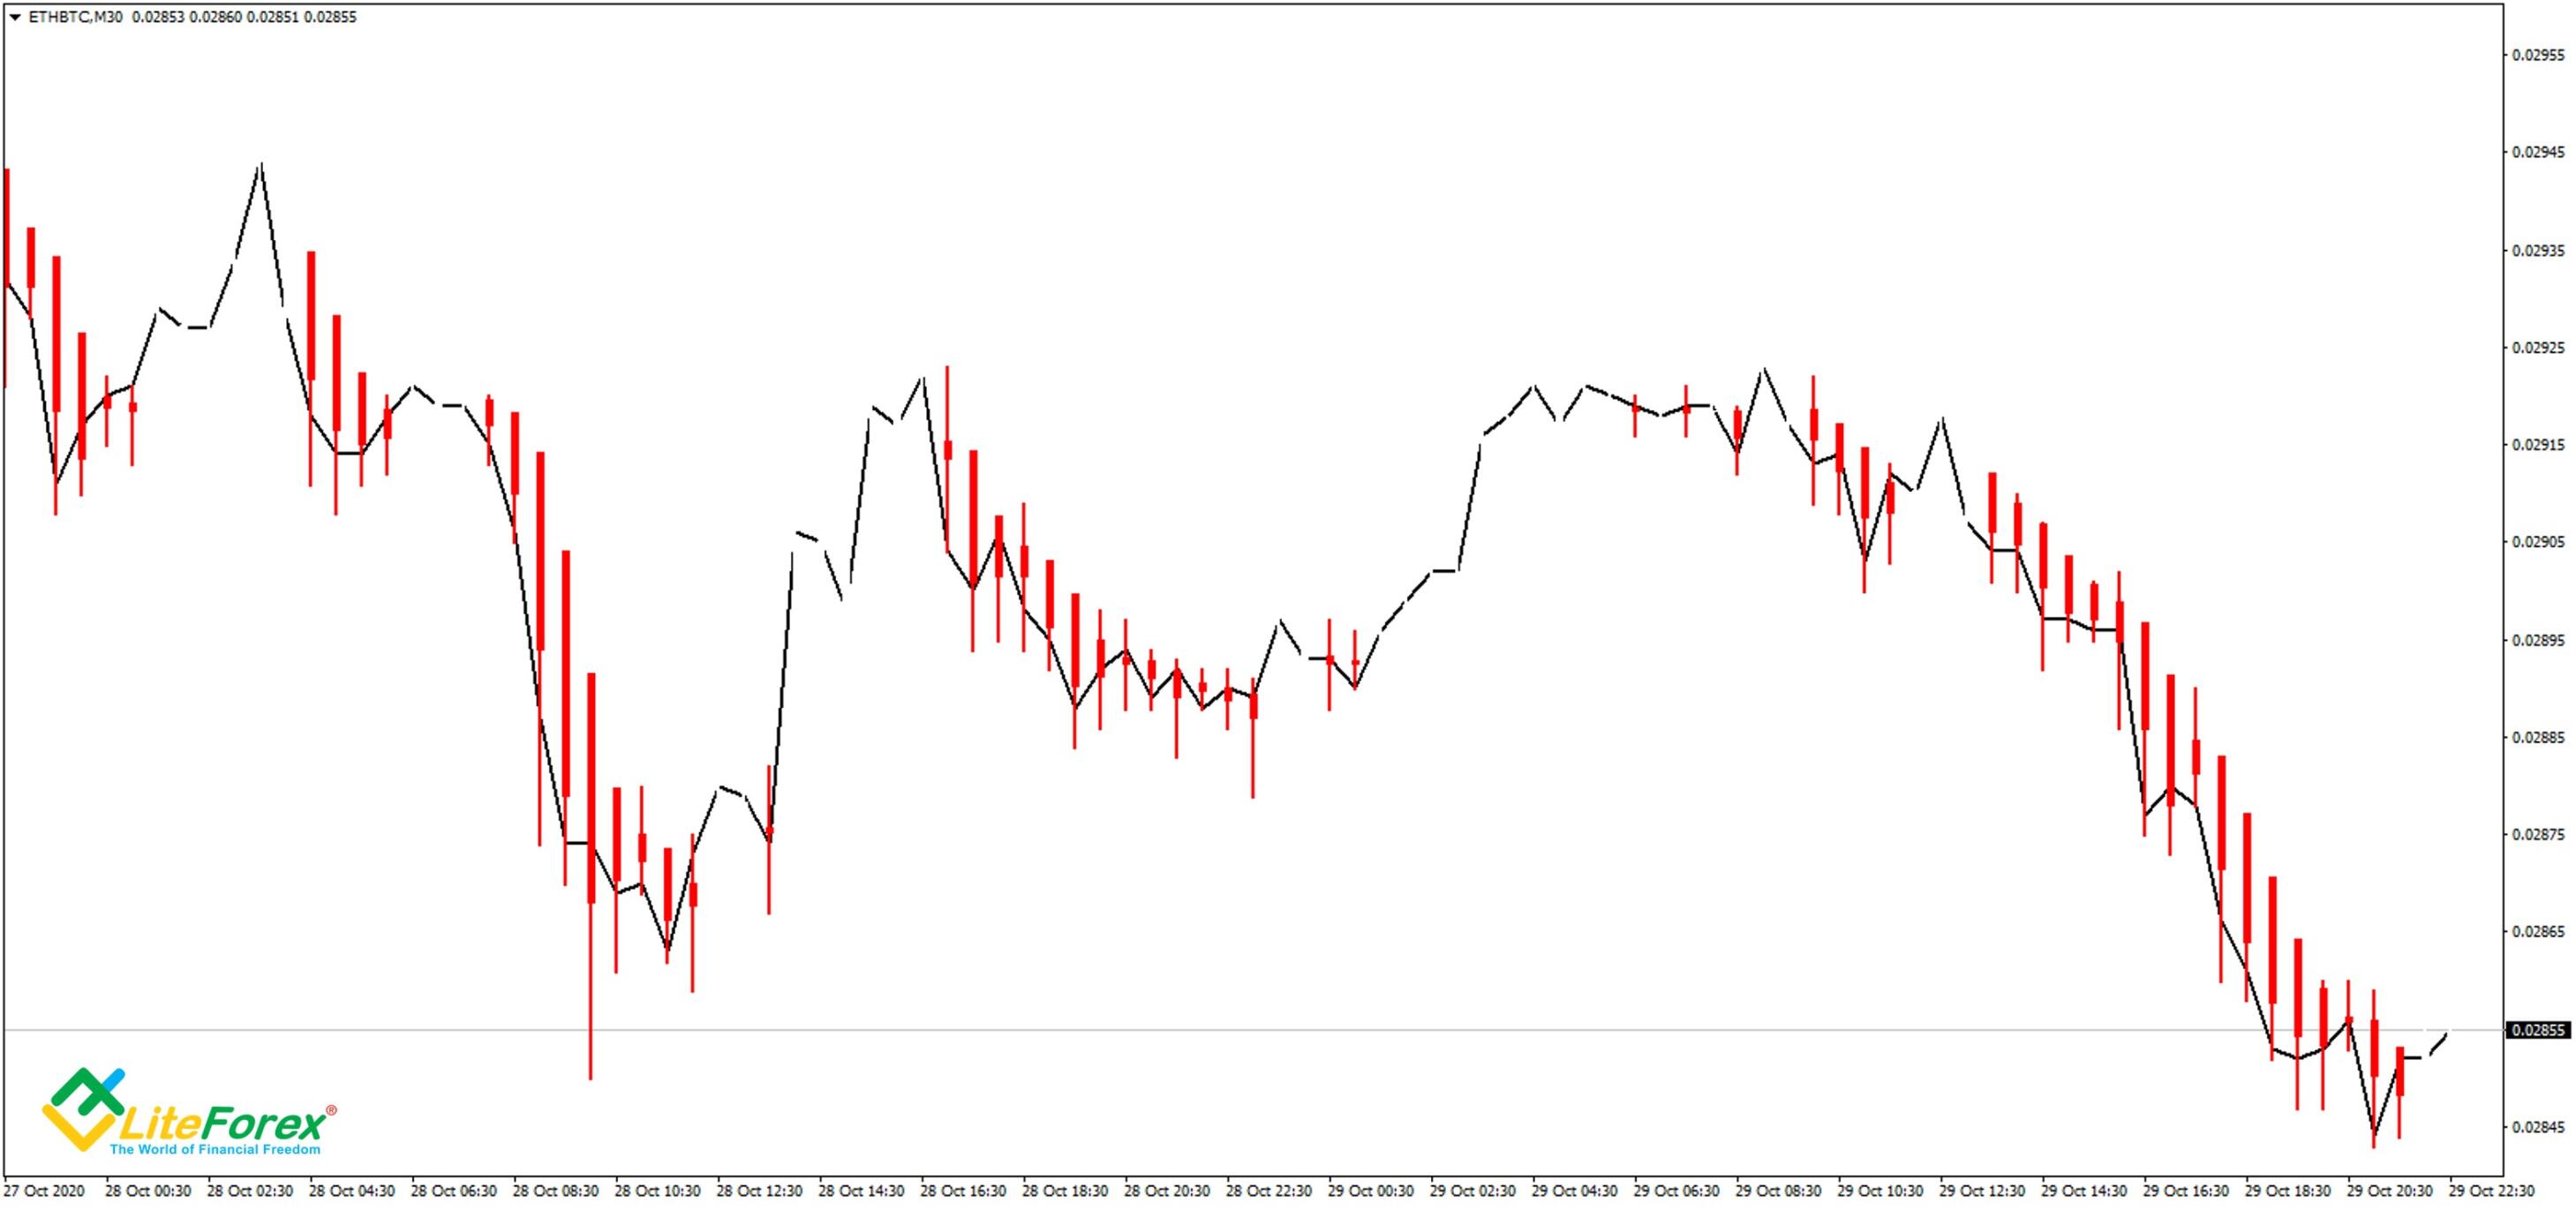
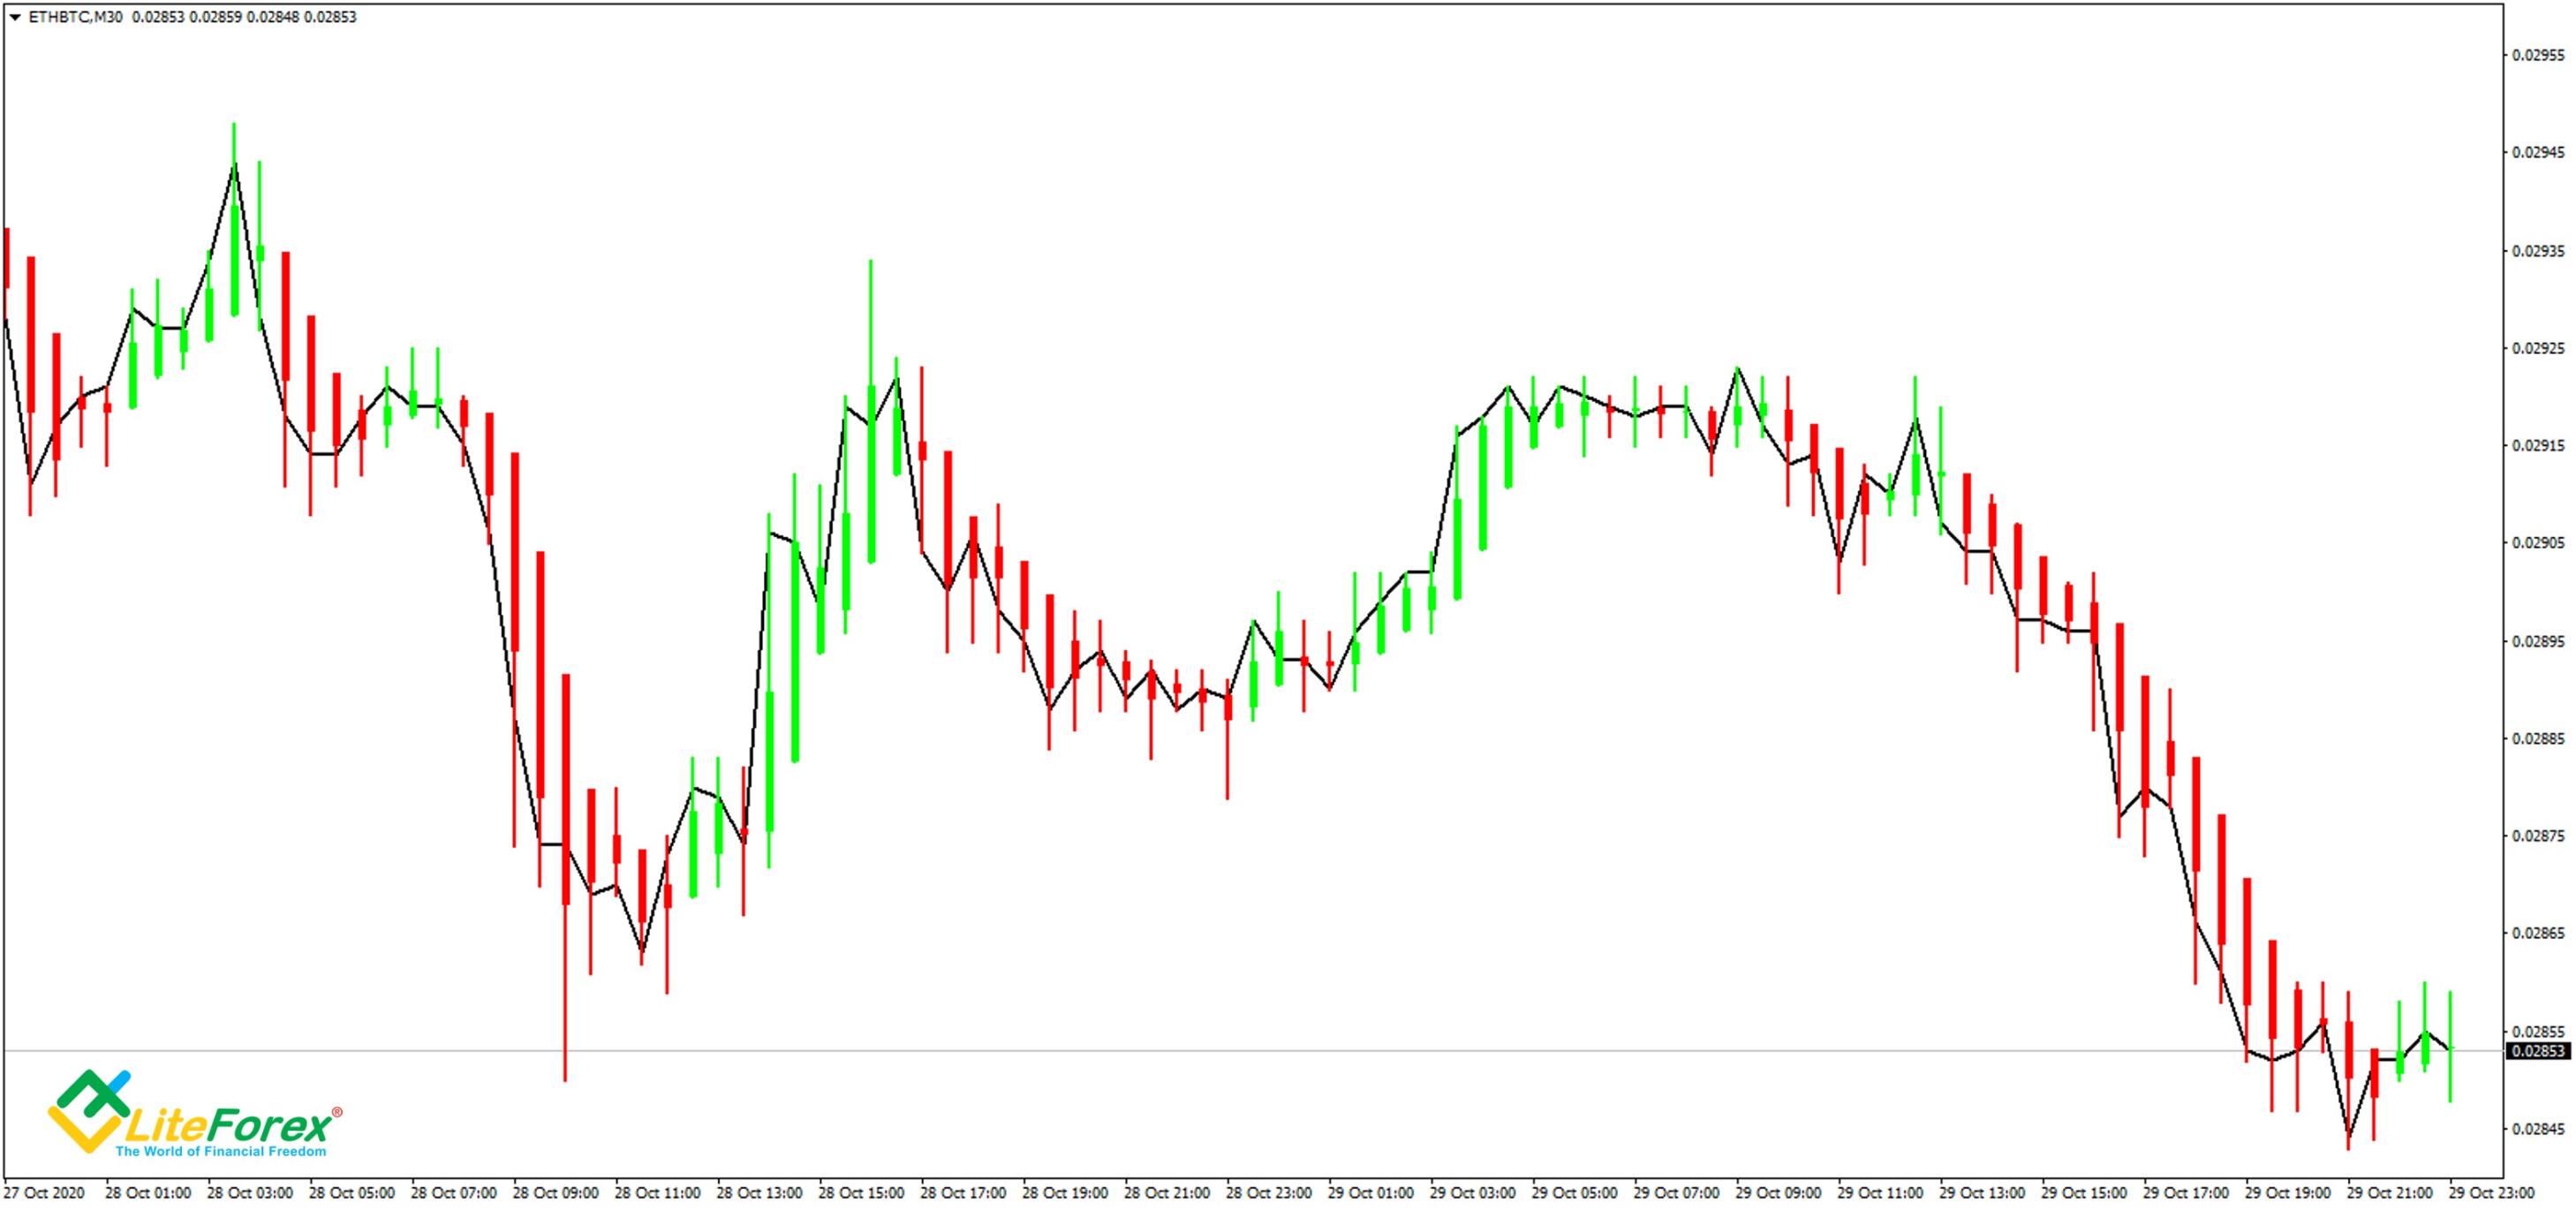
The upper part of the EURUSD chart shows traditional Japanese candlesticks, and the lower part shows the Heiken-Ashi. By comparing them visually, you can see that the lower chart is smoother. It shows no gaps, and many bars are opened closer to the middle level of the previous bars.
By the way, you can only access Heikin-Ashi candlestick charts in the online terminal. You can open it in any browser without logging in. In the MetaTrader 4 platform, this tool looks like an indicator placed over a candlestick chart. I’m going to describe how to use it below.
The Heikin-Ashi typical candlestick chart is often used as a trend indicator. Moreover, the Price Action reversal patterns developed for traditional candlestick charts can give powerful signals as well.
Another feature of the indicator is the latency in calculations. New Heiken-Ashi bars are only formed after the following Japanese candlesticks appear on the Ashi charts. Therefore, the tool is very efficient for highly volatile assets on small timeframes.
Some of the currency pairs that fit the description are CADJPY or GBPJPY. For these pairs, using the Heikin-Ashi will effectively remove noise and prevent false breakouts and market trends reversal signals.
What Is the Heiken-Ashi Indicator?
In MetaTrader 4, you can add Heikin-Ashi candlestick charts for free since it’s included in the standard set. So, you don't need to download it elsewhere.
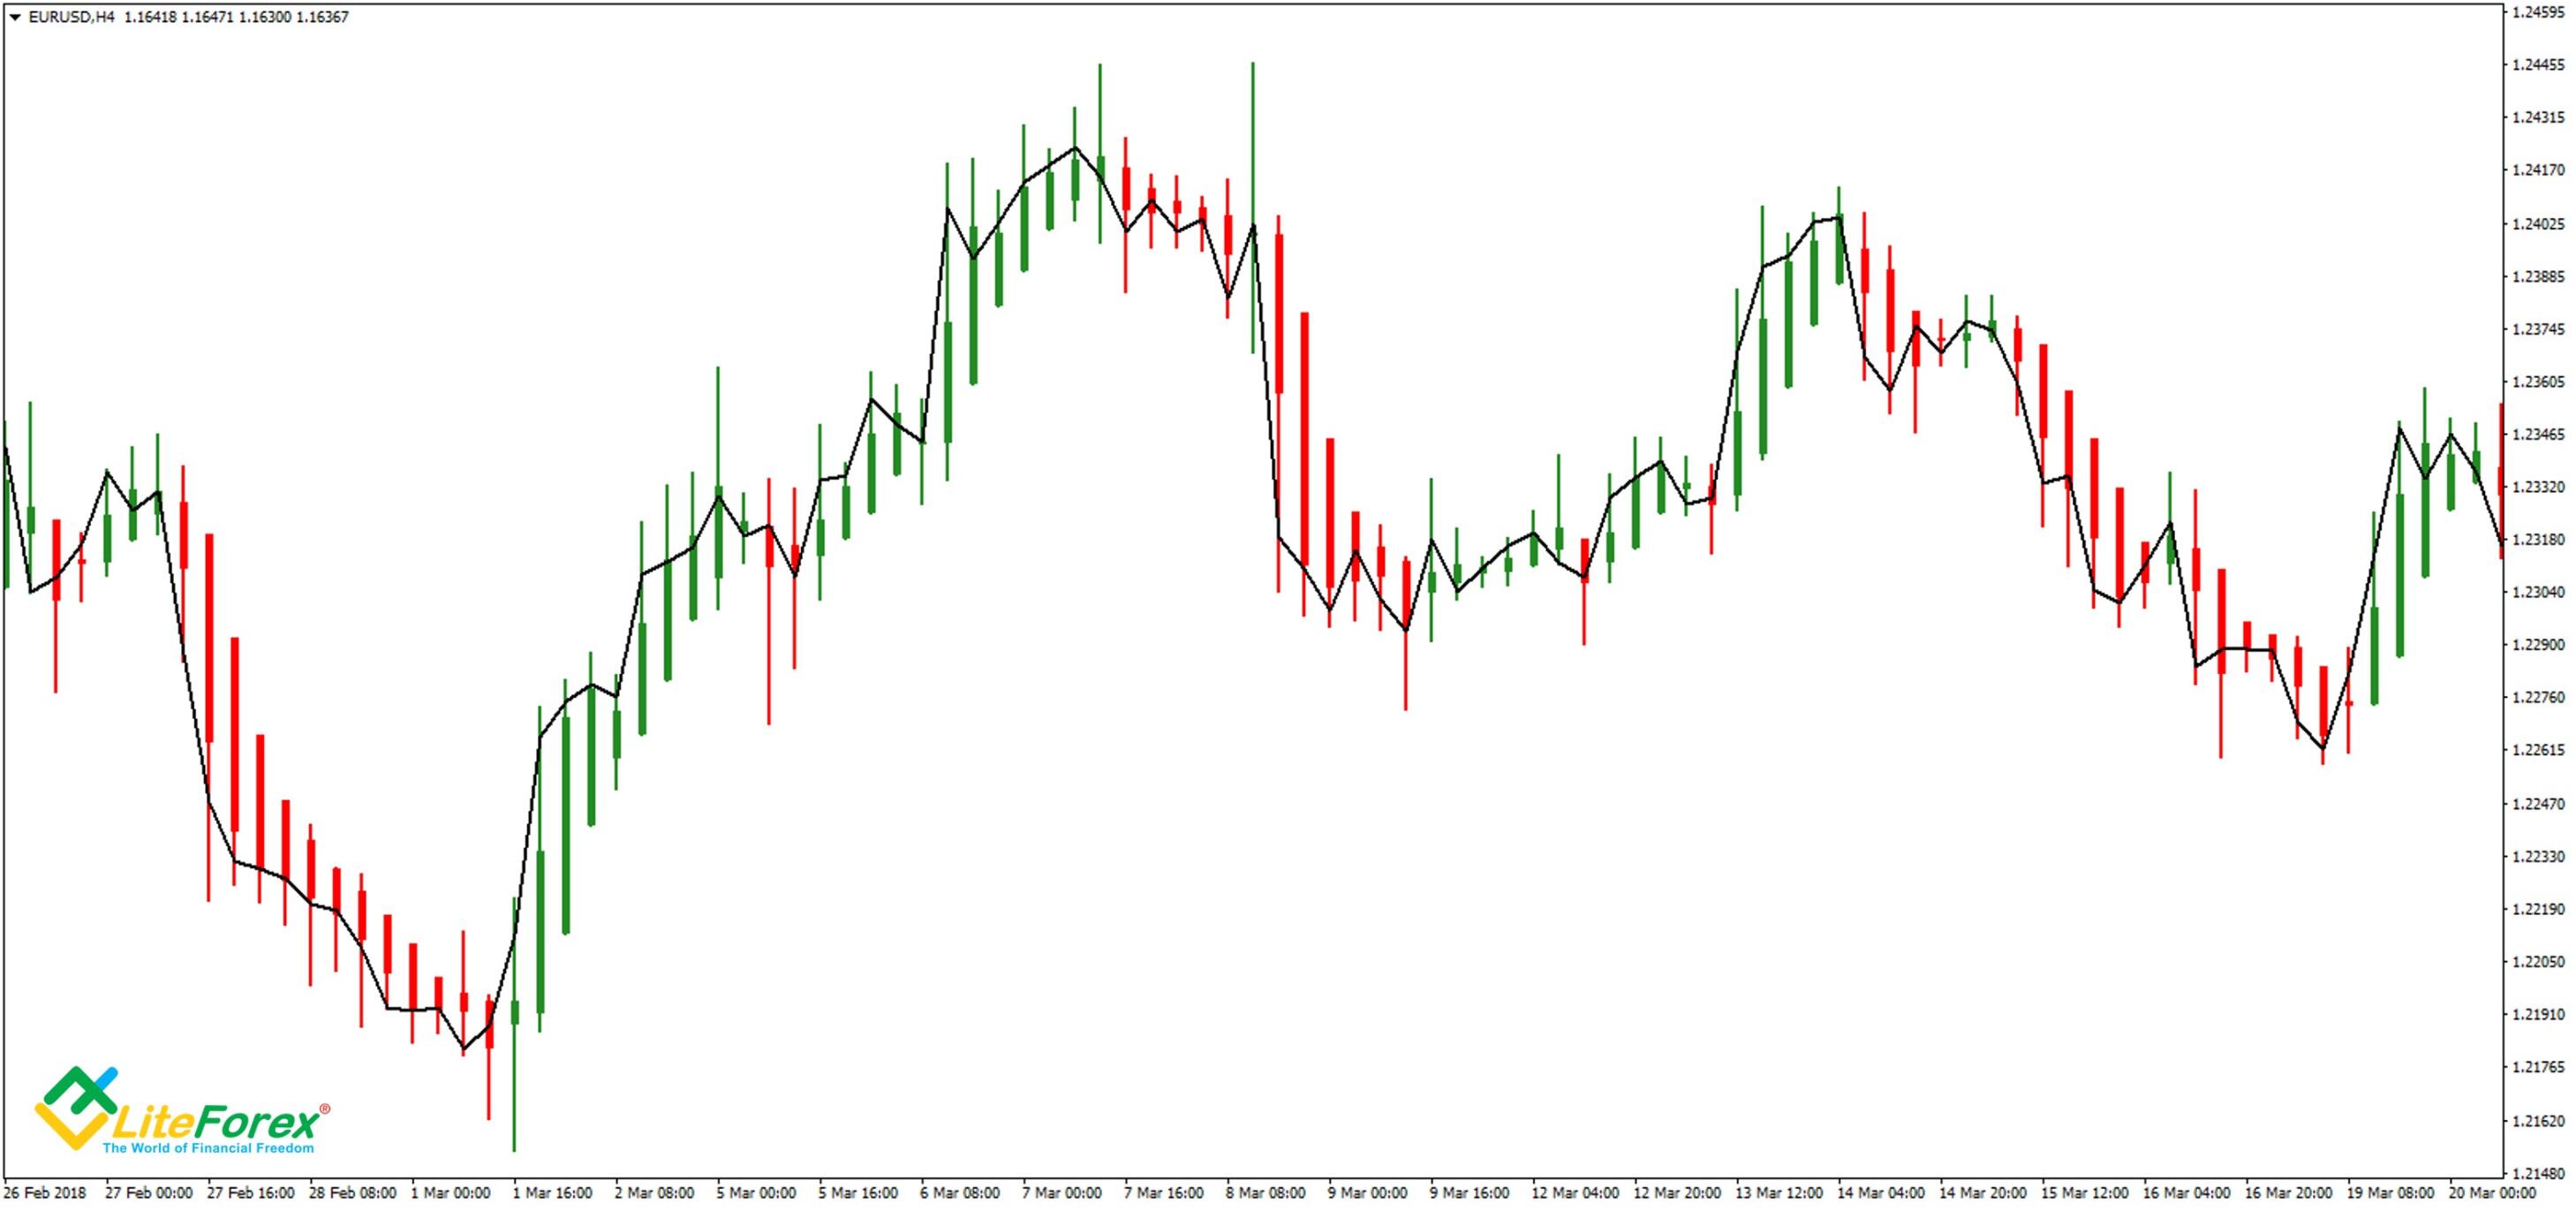
The tool works best with a moving average. This way, it will not be drawn on top of Japanese candlesticks. On the contrary, it will make the Heikin Ashi chart easier to understand and show smoothed Heikin Ashi candles of the indicator.
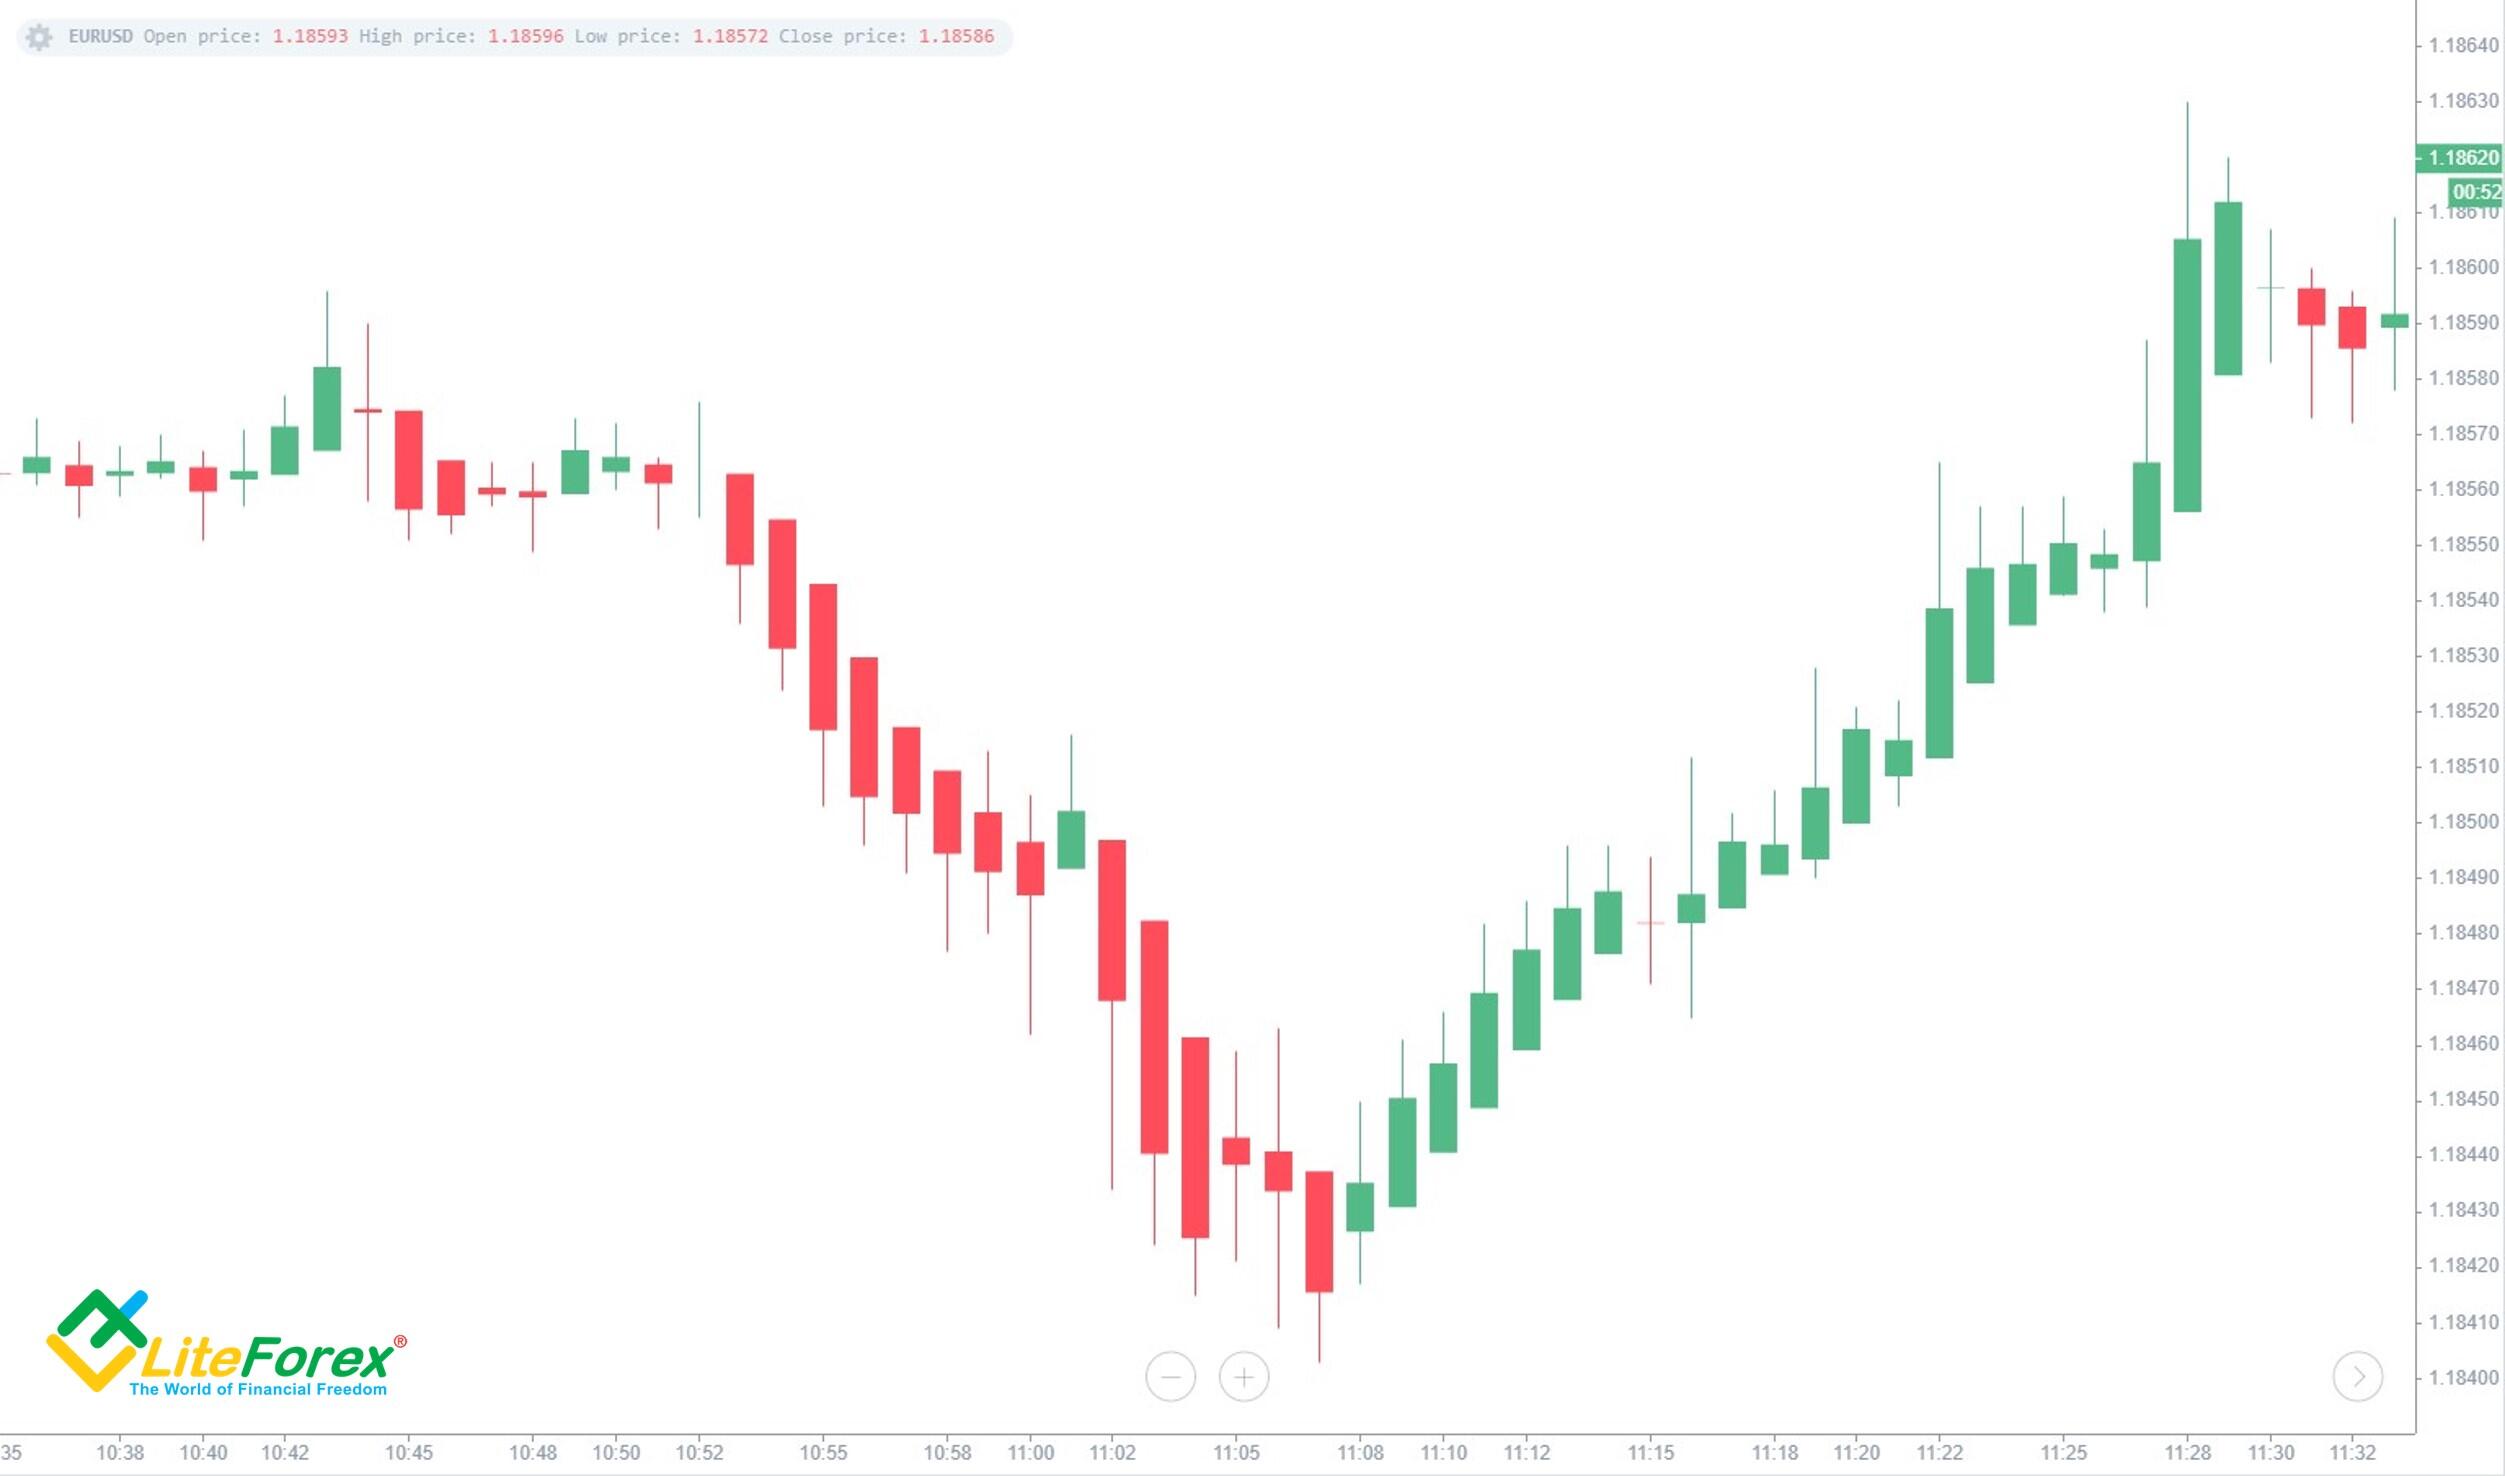
For comparison, here is what the Heikin-Ashi candles look like in the online terminal. Comparing this Heikin Ashi chart and MT4, you can see that Japanese candlesticks have been completely replaced on the price chart.
How Does Heiken-Ashi Work?
The Heikin-Ashi traditional candlestick chart smoothing is performed by averaging four parameters of Japanese candlesticks: open, close, max, and min.
Each of these four parameters is formed as follows:
Open - (open + close of the previous bar)/2.
Close - (open + high + low + close of the current bar)/4.
Max (or High) - the highest value of the current period's Heikin Ashi high, or the current period's Heikin-Ashi open or close.
- Min (or Heikin Ashi Low) - the lowest value of the current period's low, or the current period's Heikin-Ashi open or close.
Now you know how to calculate Heikin-Ashi bars. Therefore, you understand that the extremum of HA-bars can vary in both directions compared to the Japanese candlestick in the same positions. Beginners often overlook this fact and place stops at the extremes of Heikin-Ashi bars.
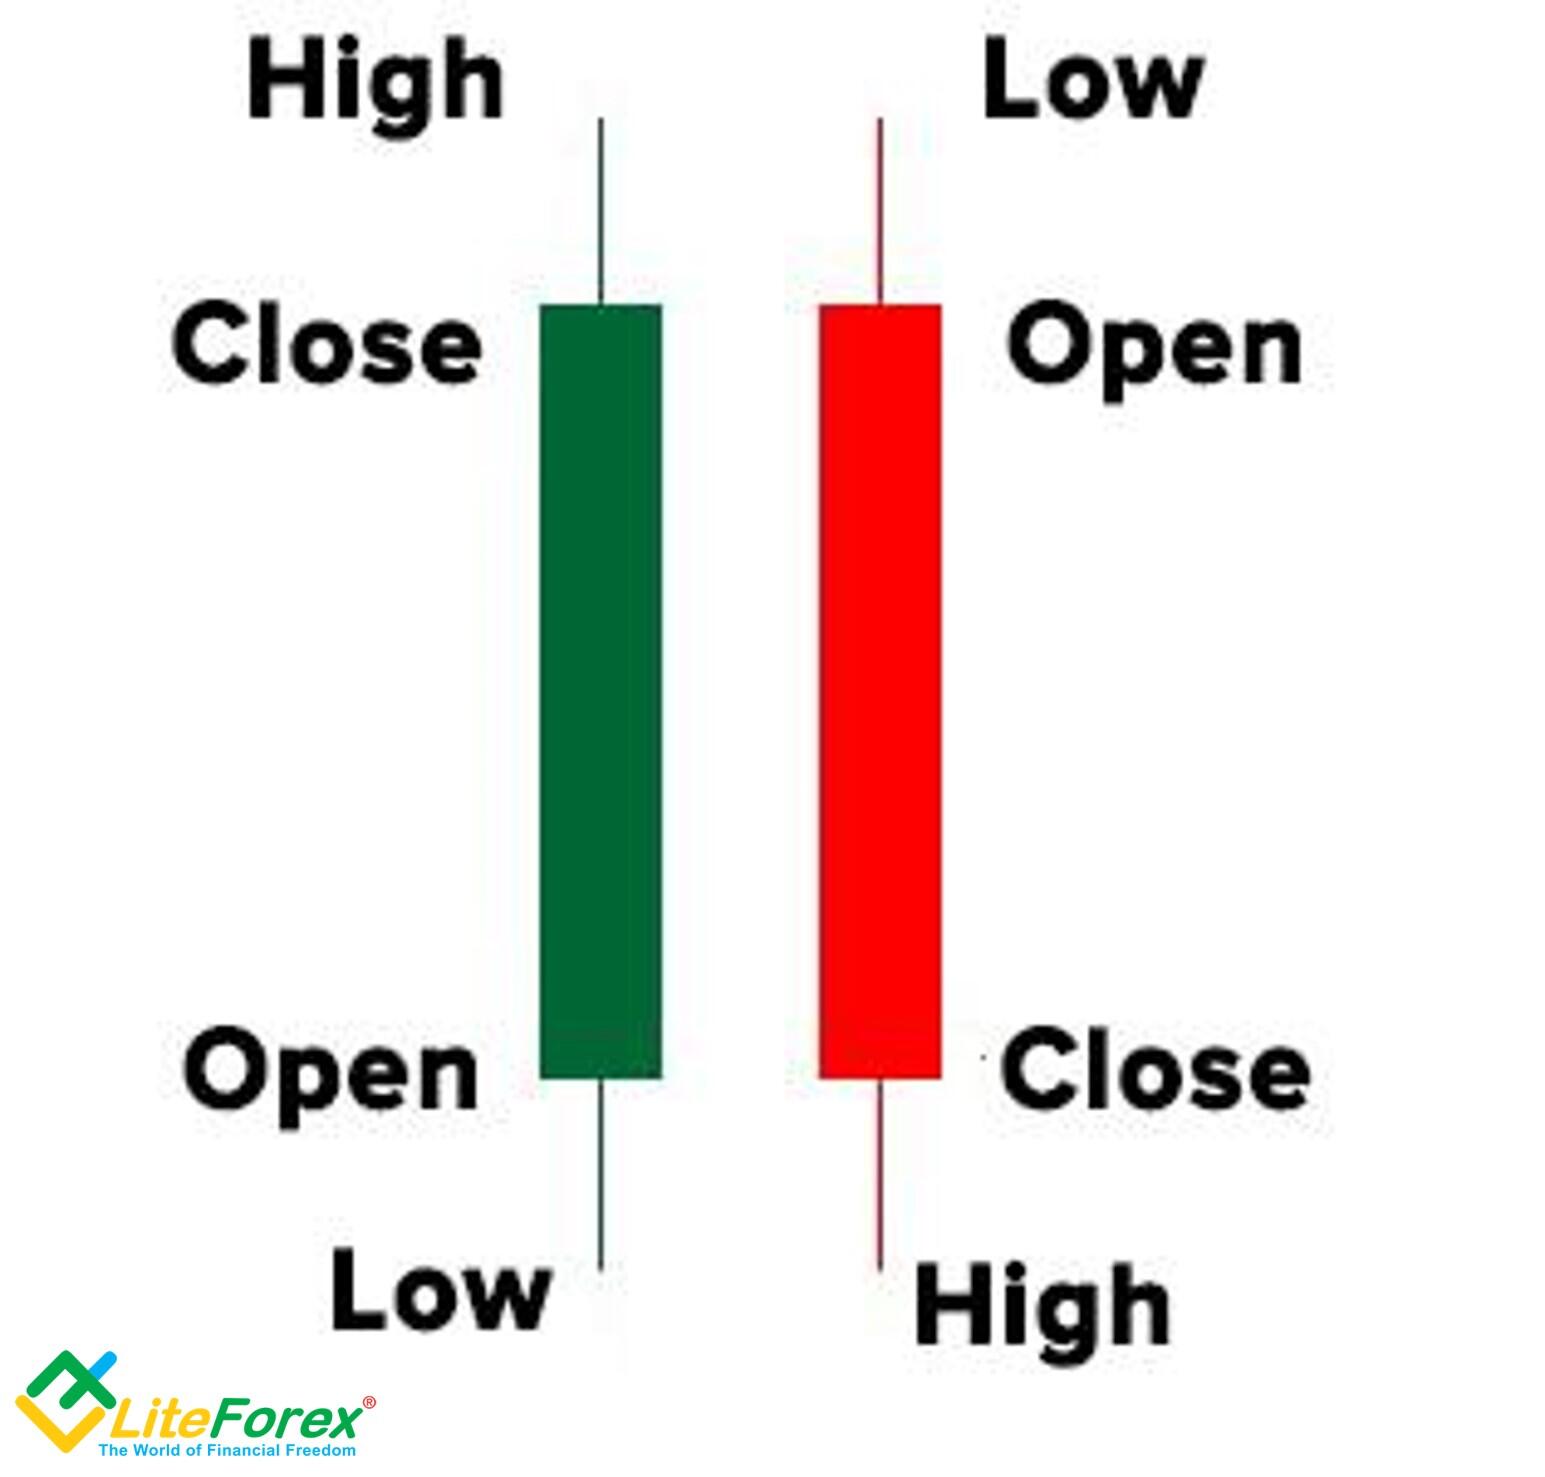
The body of an HA candle has the same value as the Japanese ones and indicates the current balance of power in the market. A white or green bar means a bullish market, and a black or red bar points to a bearish market.
Japanese Candlesticks vs. Heikin-Ashi Candles

Japanese Candlesticks | Heikin-Ashi Candles |
Long shadows | Short shadows |
The body starts near the close of the previous bar. | The body starts approximately in the middle of the previous bar. |
The bars show the real price situation. | Due to smoothing, the bars are formed with a slight lag, reflecting the trend rather than the exact price movement. |
At first glance, Heikin-Ashi technique vs a normal candlestick chart is the same. But if you look closely, you will notice one crucial difference - smoothed bars have lower wicks, and the max may not reach the actual extremum of the candlestick. At the same time, the body of each Heikin-Ashi bar starts near the middle point of the former bar.
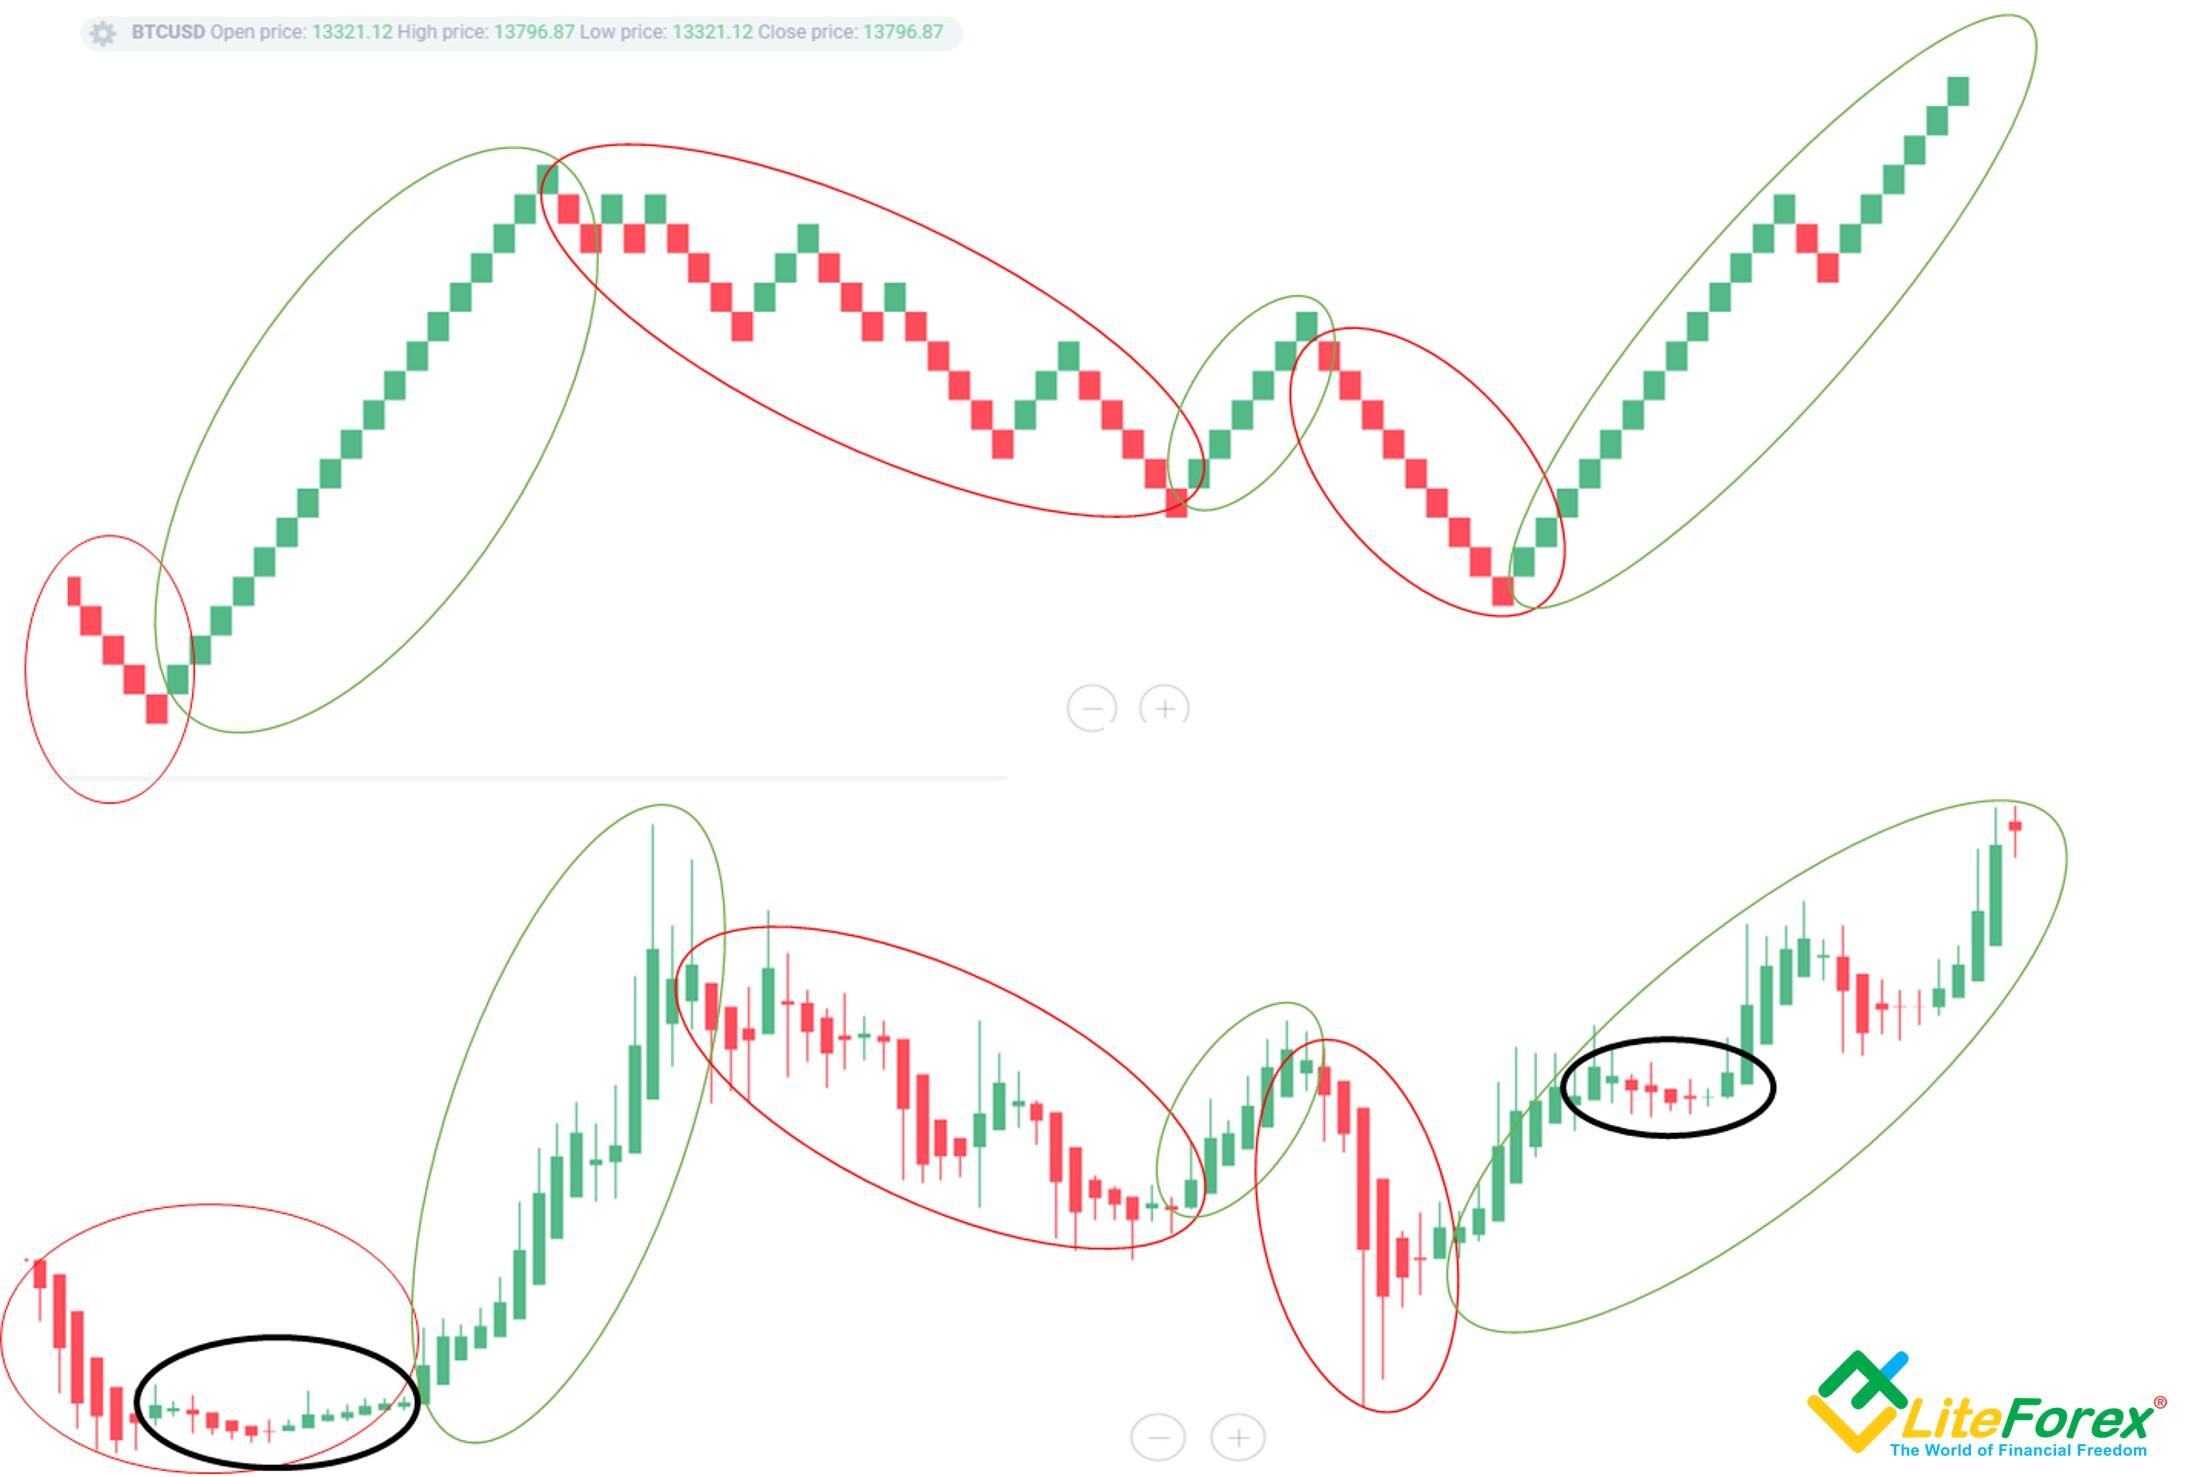
There is one more thing: because of smoothing, the Heikin-Ashi indications have a slight lag. To illustrate, I compared the two candlestick charts - the Heikin-Ashi technique on the left and the Japanese candlesticks on the right.
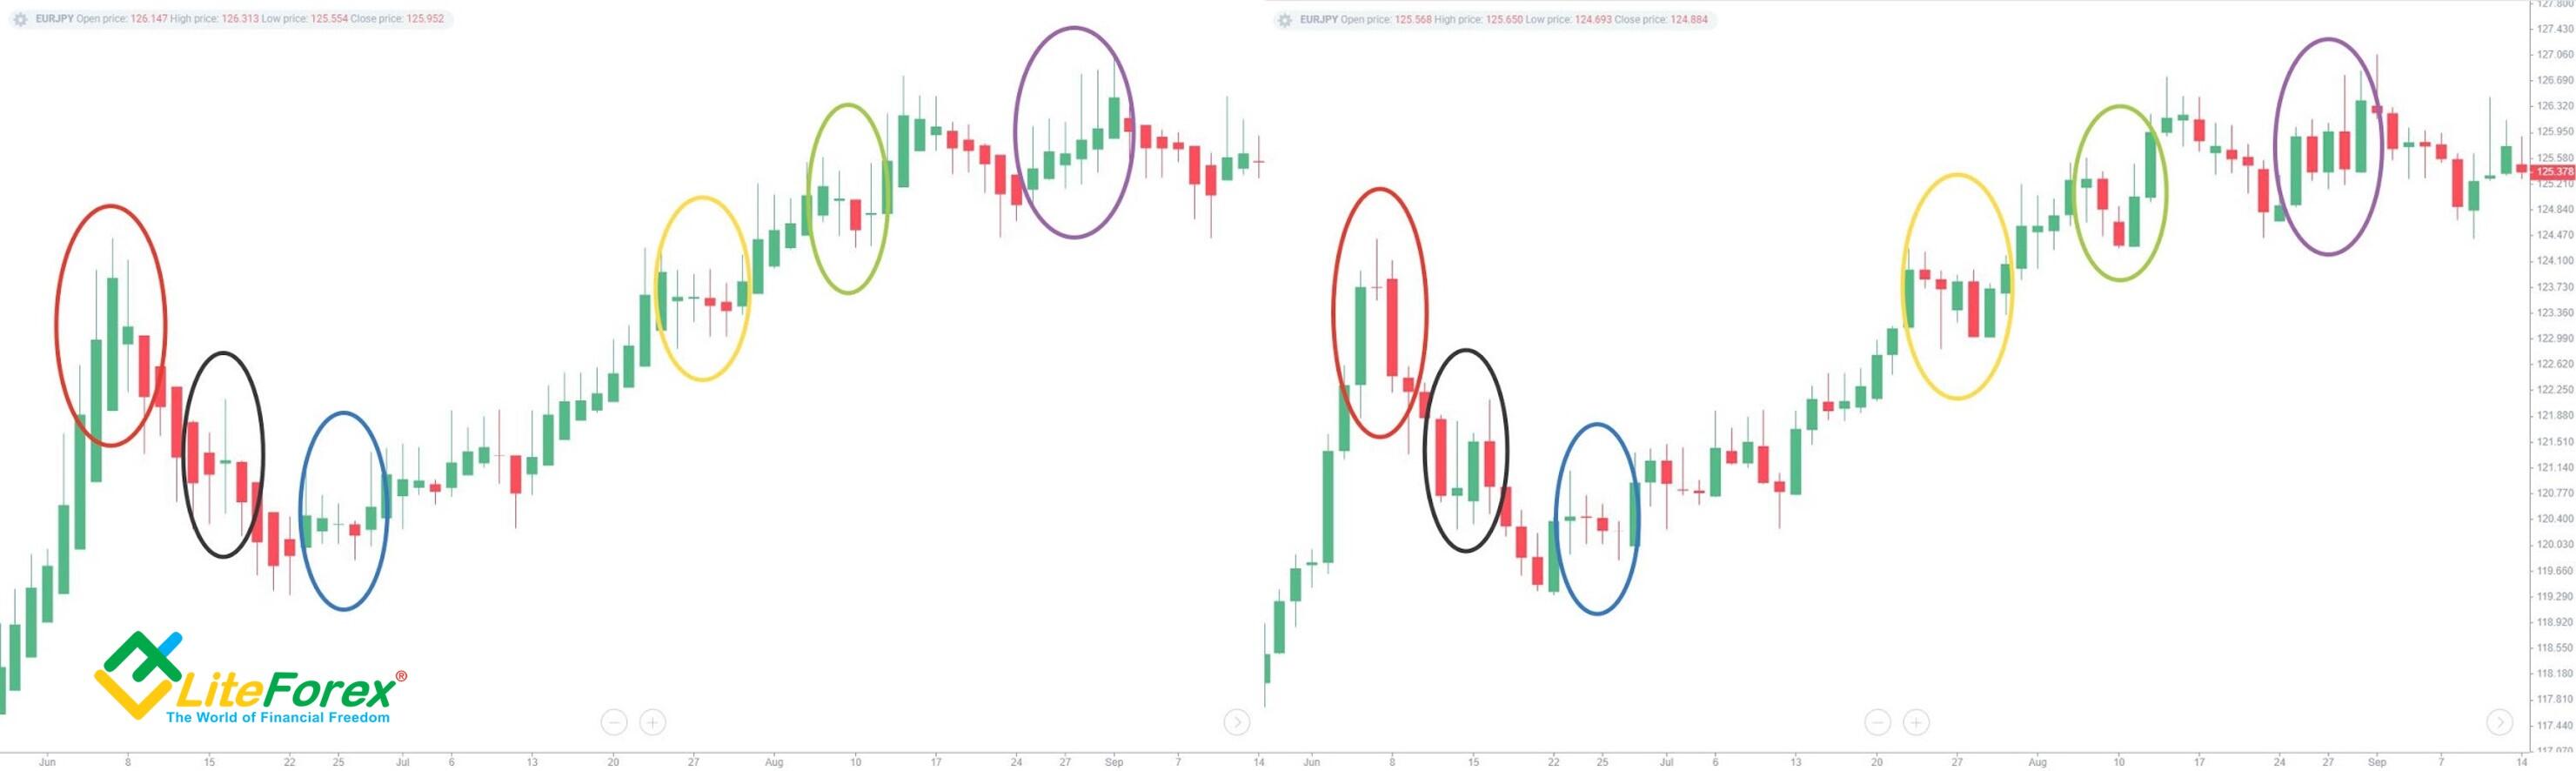
The colored circles point to the areas with the biggest differences. You can clearly see the lag in the first red circle. The Japanese candlestick has already formed a long red body, while the HA candlestick is still green. Later on, we will cover how to find such differences and what to do with them.
How to Read Heiken-Ashi Candles
Knowing the Heikin-Ashi technique secrets, you can determine both the current bullish or bearish trend and its starting and ending points. If there is a minimal shadow (or no shadow at all)with a steady rise or fall in prices, it’s an important sign.
This signal indicates the trend’s strength and that it will continue in the near future. So, with a steady bearish movement, you can see a drop in the upper shadow, and with a stable bullish - in the lower shadow.
The bar’s open level is an indirect sign of a stable movement in a certain direction. In this case, it is in the middle of the previous bar. The third piece of evidence supporting the price direction is the candles’ color. If such Heikin-Ashi candlestick charts mostly show rising bars (green candles in the online terminal), the trend is bullish. If there are falling bars (red candles), it’s bearish.
An indirect indication of the trend’s strength is the ratio of the bar sizes. If each new candle’s body is larger than the previous one, the trend’s strength increases. If the bars are progressively getting smaller, especially together with increasing shadows, expect the movement in the current price direction to end soon.
The image above shows a trend. Note that almost all bars have small lower wicks. It also meets another condition - the forming bars predominantly have the same color. When the trend’s strength increases, candlestick bodies become larger, and before and during short-term corrections, they become smaller.
In trend trading, most traders enter the market after a series of identical bars. For example, three Heiken-Ashi candles of the same color and direction can be the conditions for opening a position.
Additional indicators can be used as another way of determining the right time to enter the market. Most of them work well both for Heiken-Ashi and a traditional candlestick chart. For example, during a reverse, the touch or crossover of the Bollinger Band can be used as a signal. I’ve covered this in more detail in the article "Forex Bollinger Bands Indicator."
Regardless of the method, it’s important to remember that bars are calculated with a formula. Therefore, their bodies and extremums don’t reflect real price values. Now, let's take a look at the Heikin-Ashi data formula!
Heikin-Ashi Formula - Heiken-Ashi Candle Calculation
To draw the HA-bar, the indicator needs to define four candlestick parameters:
Opening level (HA-Open);
Closing level (HA-Close);
Maximum (HA-High);
Minimum (HA-Min).
Here are the Heikin-Ashi data calculation formulas:
The HA-Open for the first candlestick is a regular bar’s opening price. For the second candlestick,
where "-1" is the values of the previous bar.
Here, "0" denotes the current bar, and if there’s no "HA" prefix, the calculation is based on its actual values.
HA-High = Maximum of the High (0), HA-Open (0) or HA-Close (0)
HA-Low = Minimum of the HA Low (0), HA-Open (0) or HA-Close (0)
The picture above shows where to take the values of bullish and bearish bars. Remember that for bullish Heikin Ashi candlesticks, the max is at the top and the min is at the bottom, while for bearish Heikin Ashi candlesticks, it’s the other way around. So, reading depends on the price’s direction.
How to Calculate Heikin-Ashi in Excel
For a full understanding, I prepared an Excel calculator that you can download here.
After clicking on the link, click on the arrow-shaped icon in the upper right corner.
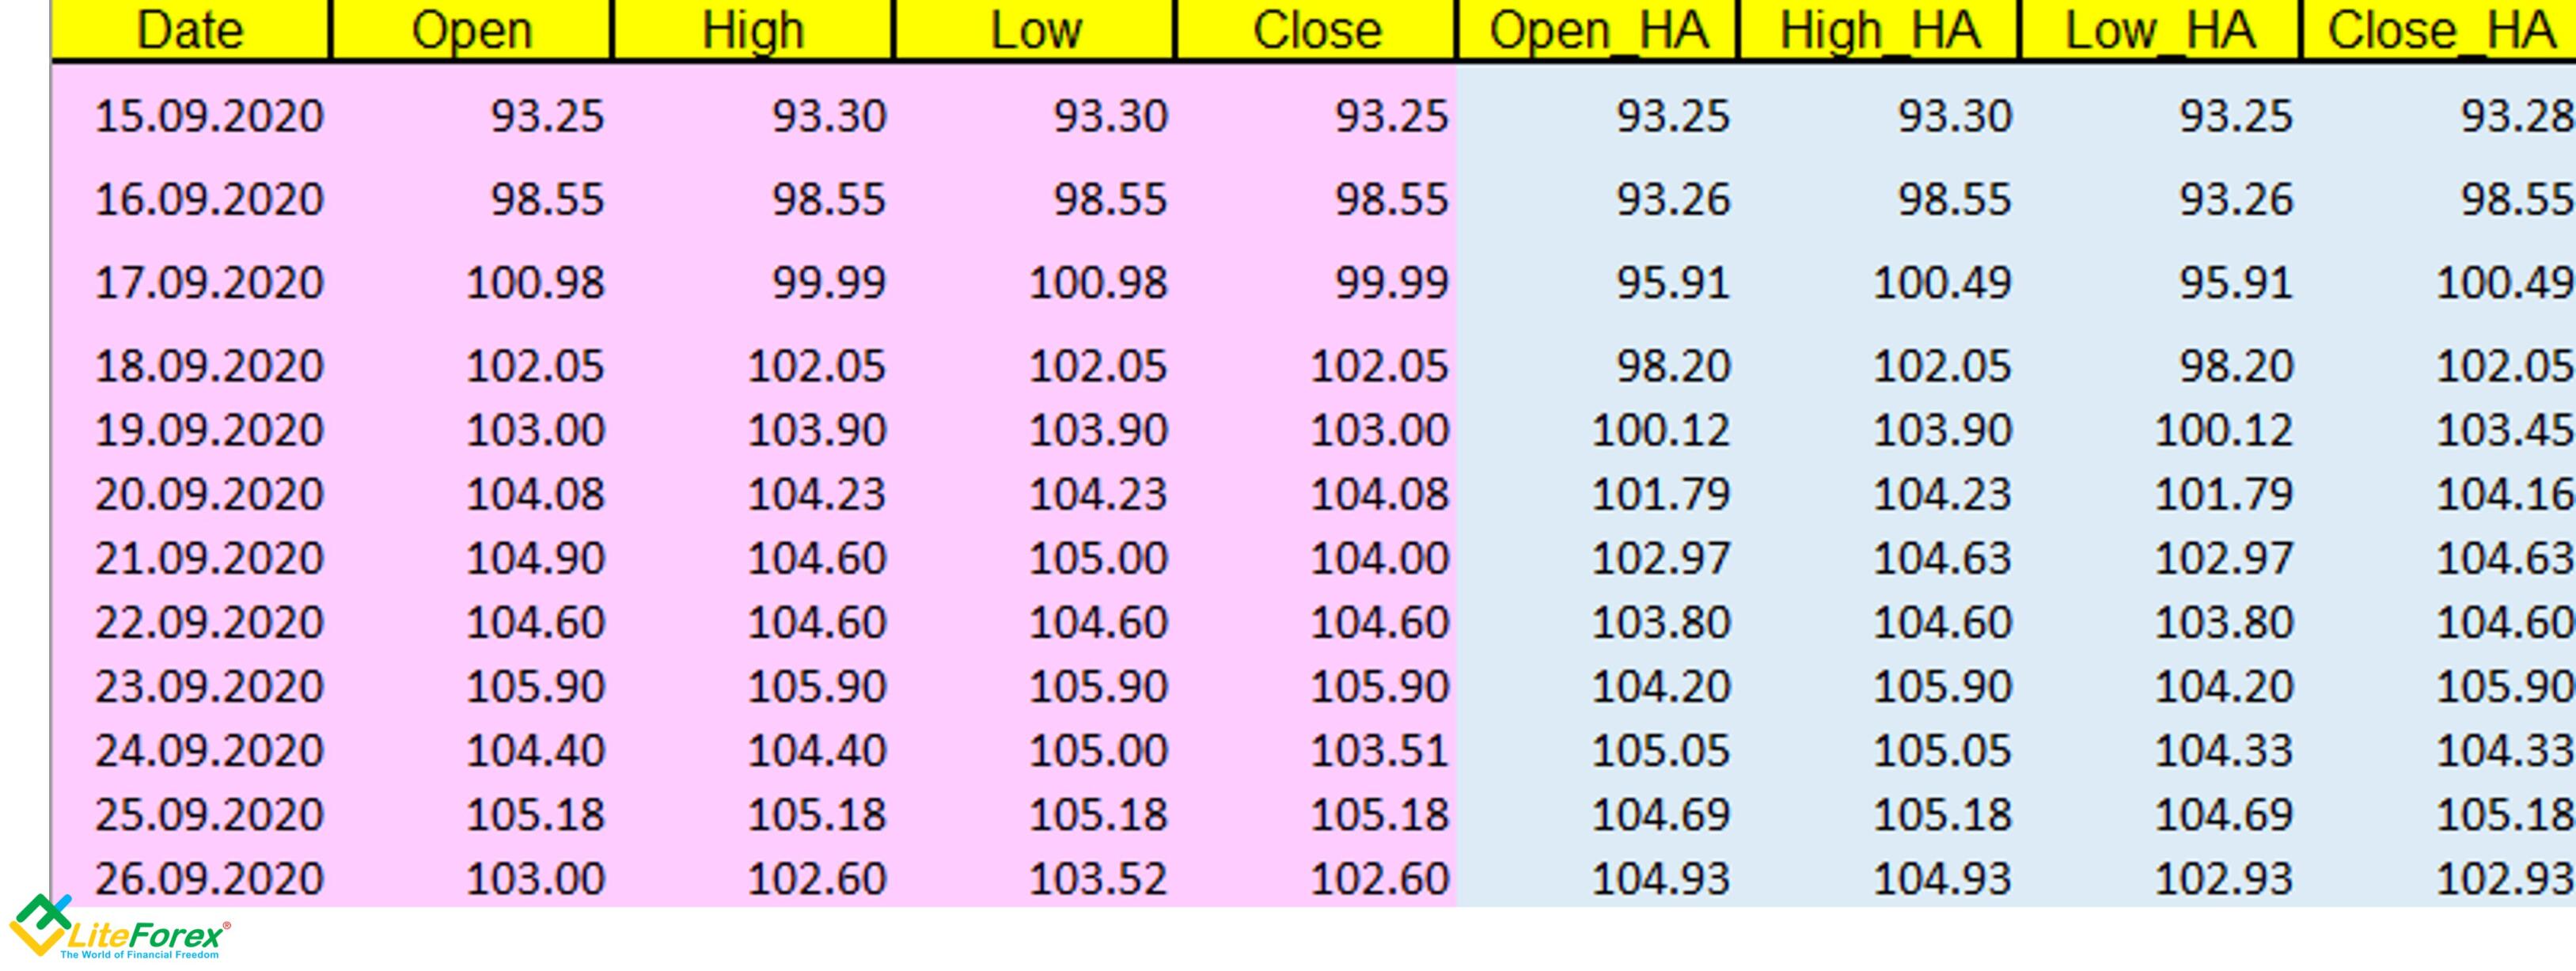
The design of the calculator is very simple - the purple cells on the left side of the table need to be filled in with:
The date (you can just specify the order number);
The opening and closing levels, and high and Heikin Ashi low levels of the Japanese candlestick.
Important! Delete the existing values before entering your own.
The blue cells show where the values are automatically calculated when you fill in the purple cells, so you don’t need to enter anything.
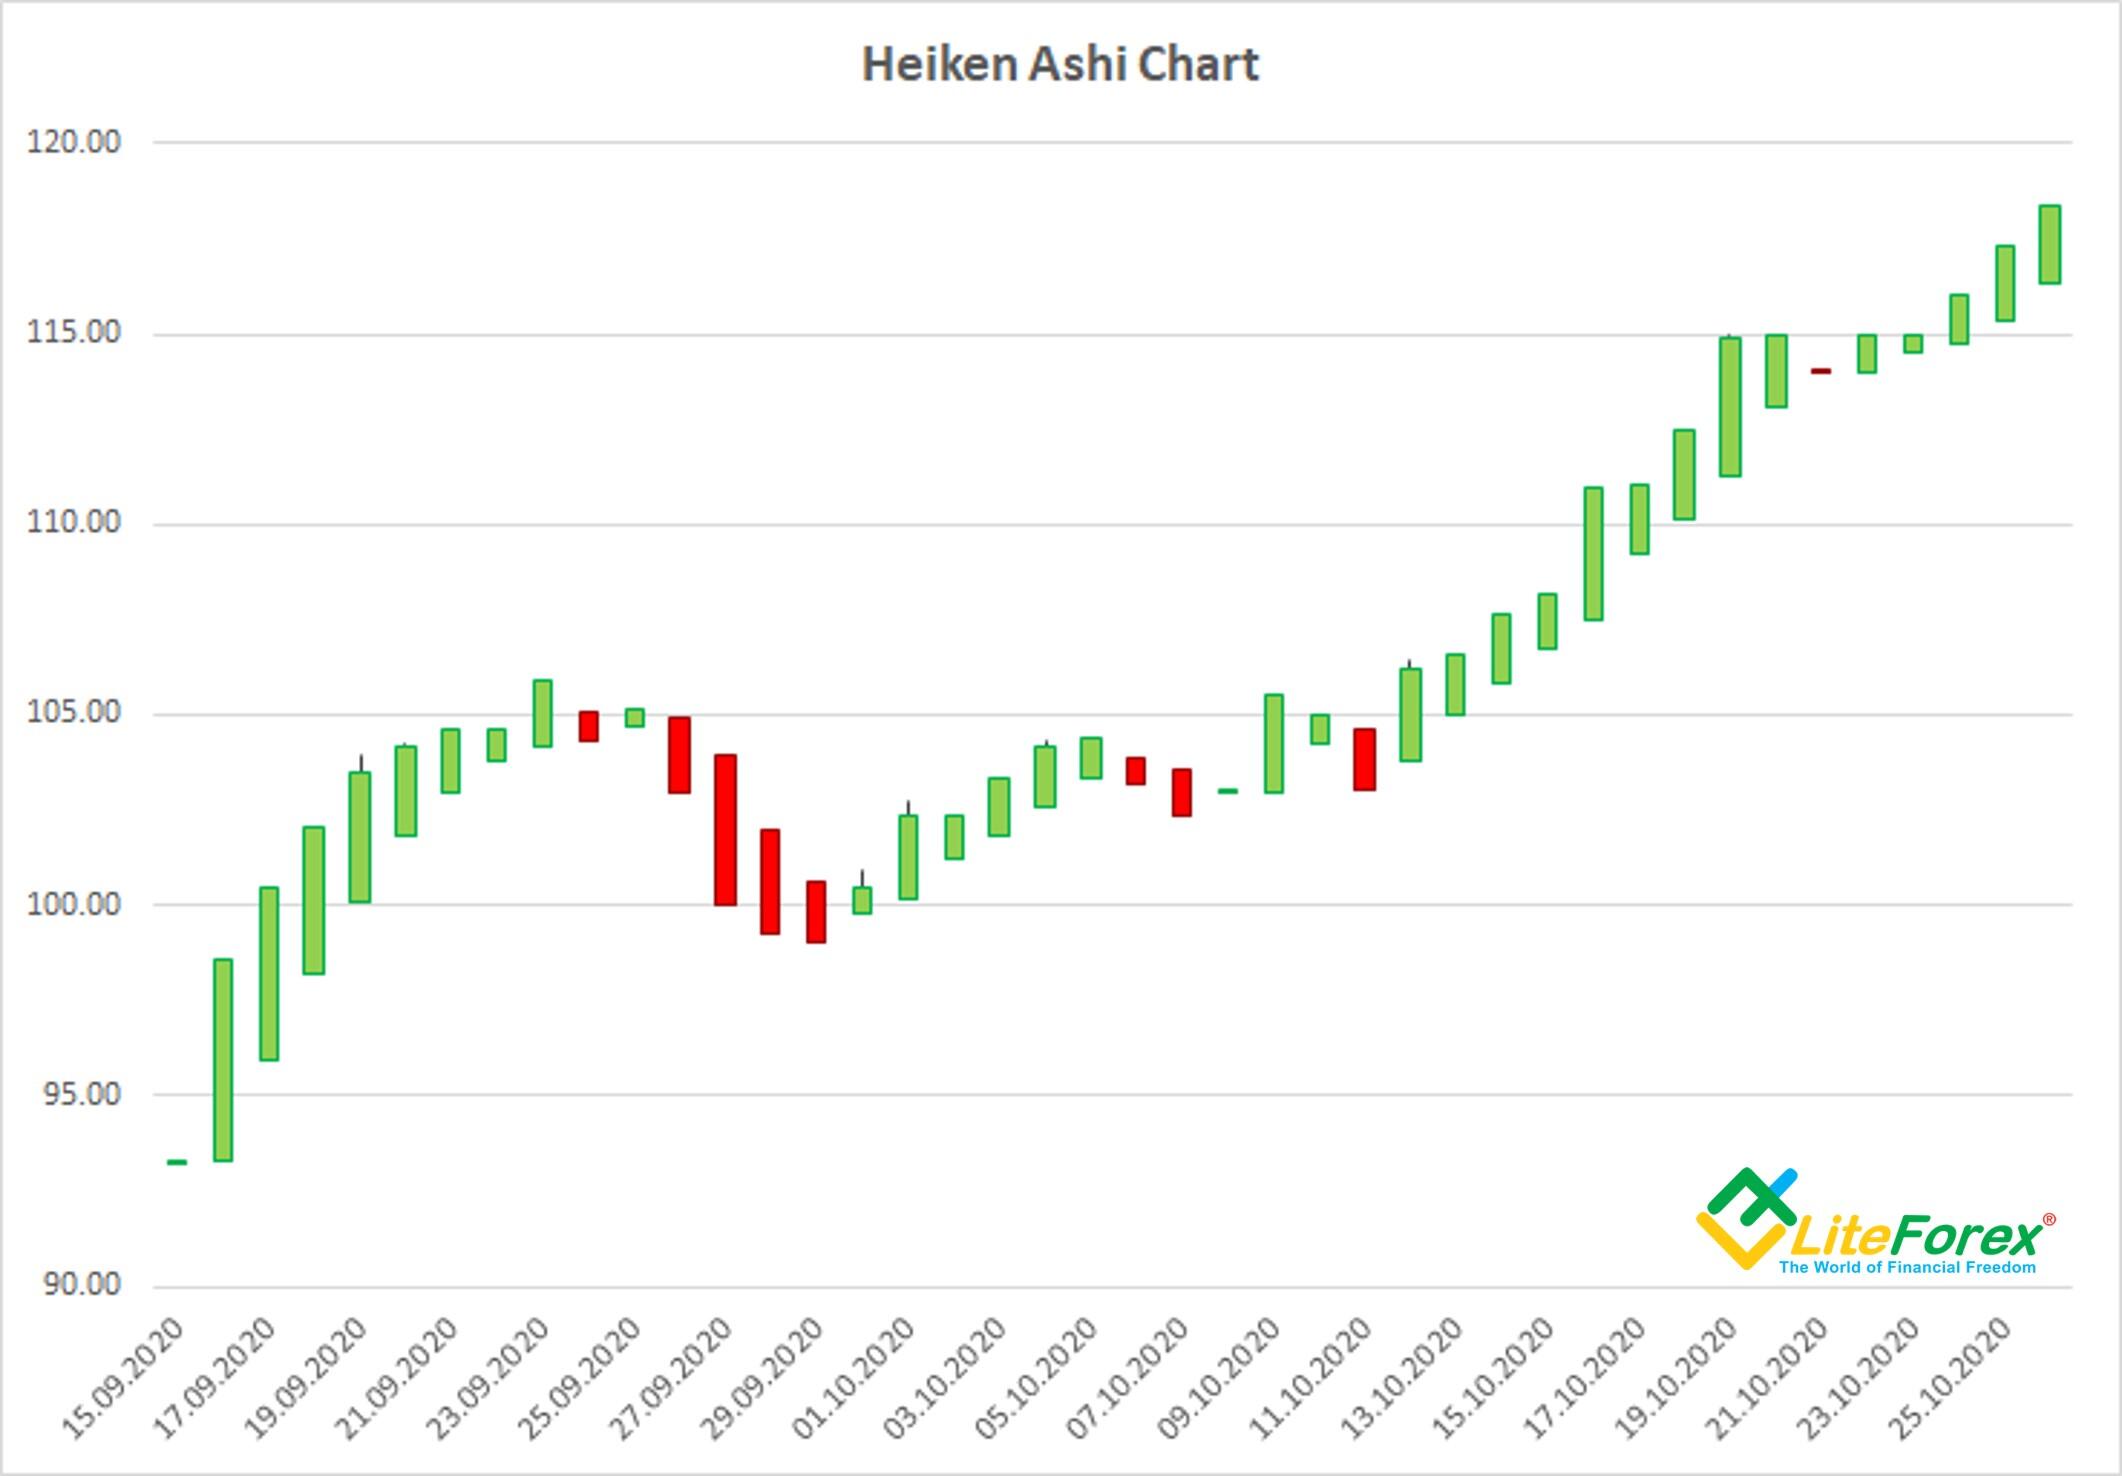
On the right, you will see the updated Heikin-Ashi candlestick chart, similar to the one drawn in the LiteFinance terminal.
Heiken-Ashi Candles Models
When trading Heiken-Ashi, candlestick patterns are often used to determine the right time to enter the market. In this article, I’ll describe the most popular patterns with the most accurate Heiken-Ashi signals:
Doji;
Cross;
Hammer;
Falling star;
High wave.
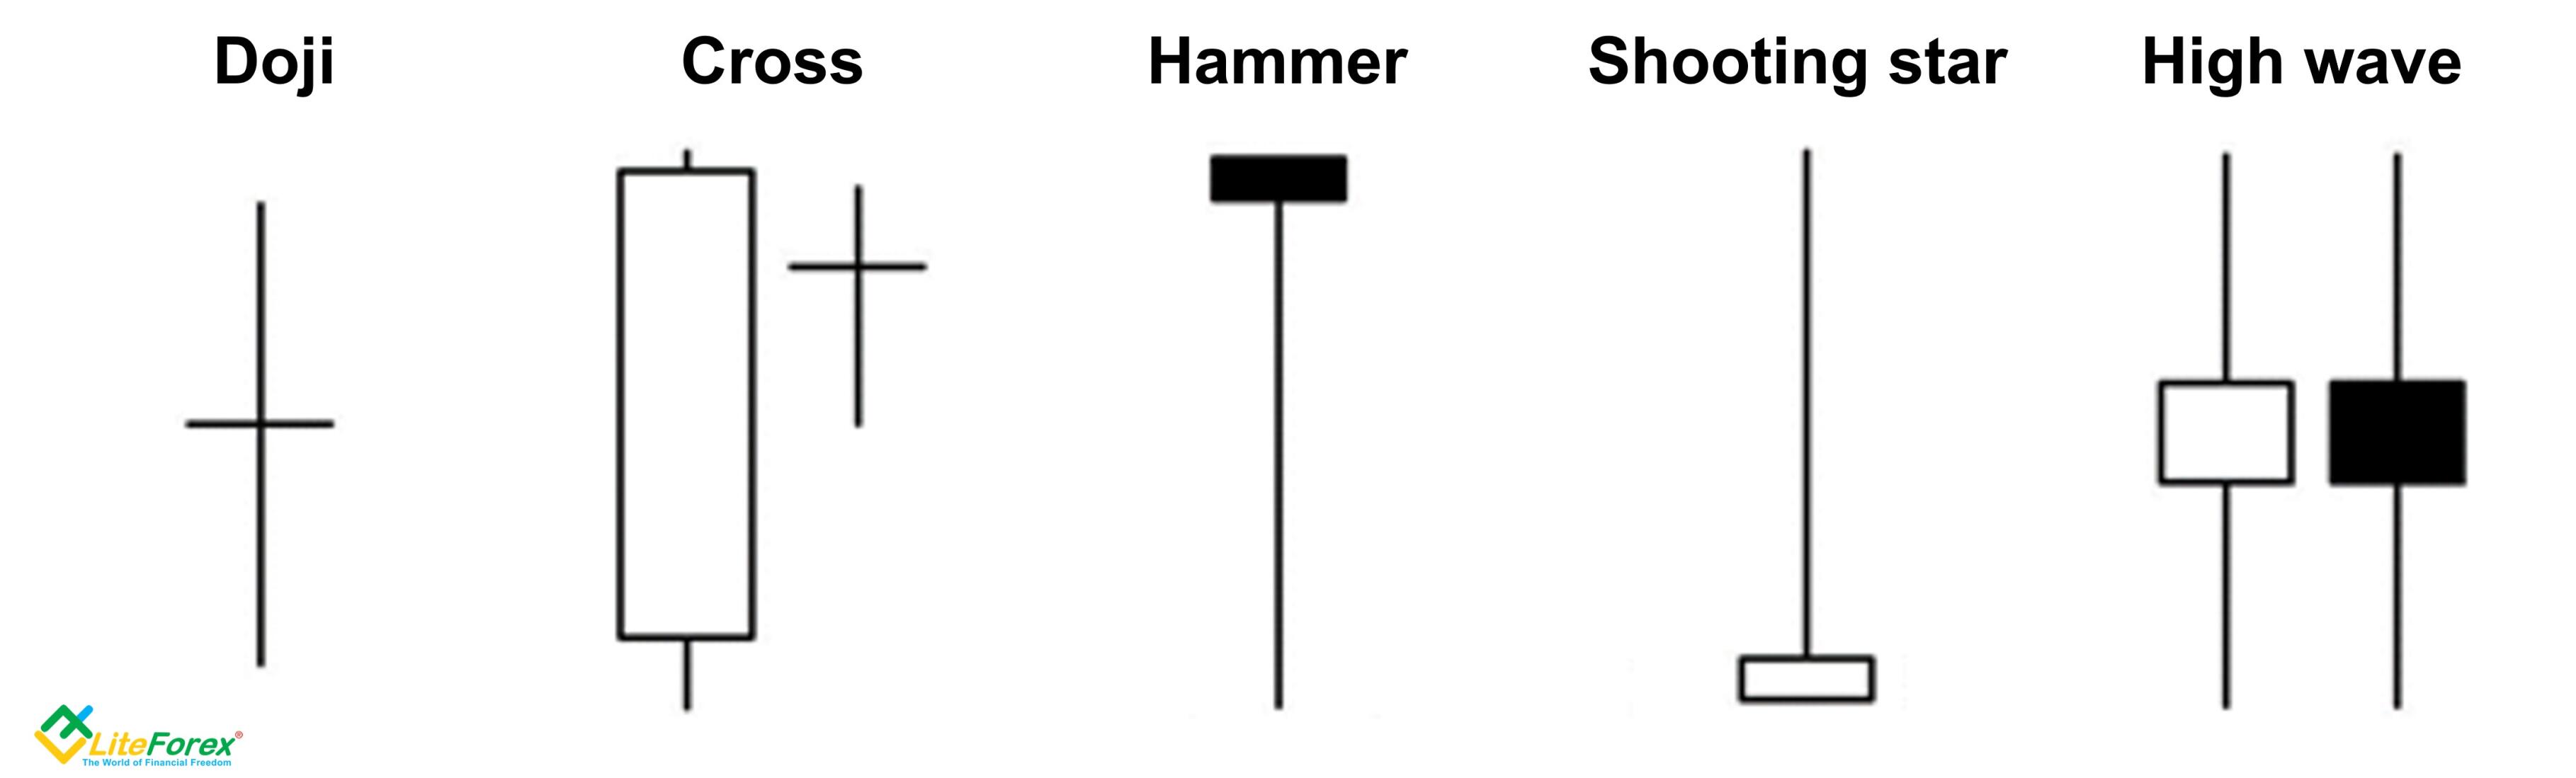
The image above shows all the listed Heiken-Ashi patterns, and you can use it as a cheat sheet. Black candles are the same as red candles while empty candles stand for green candles.
Now let's take a closer look at each pattern.
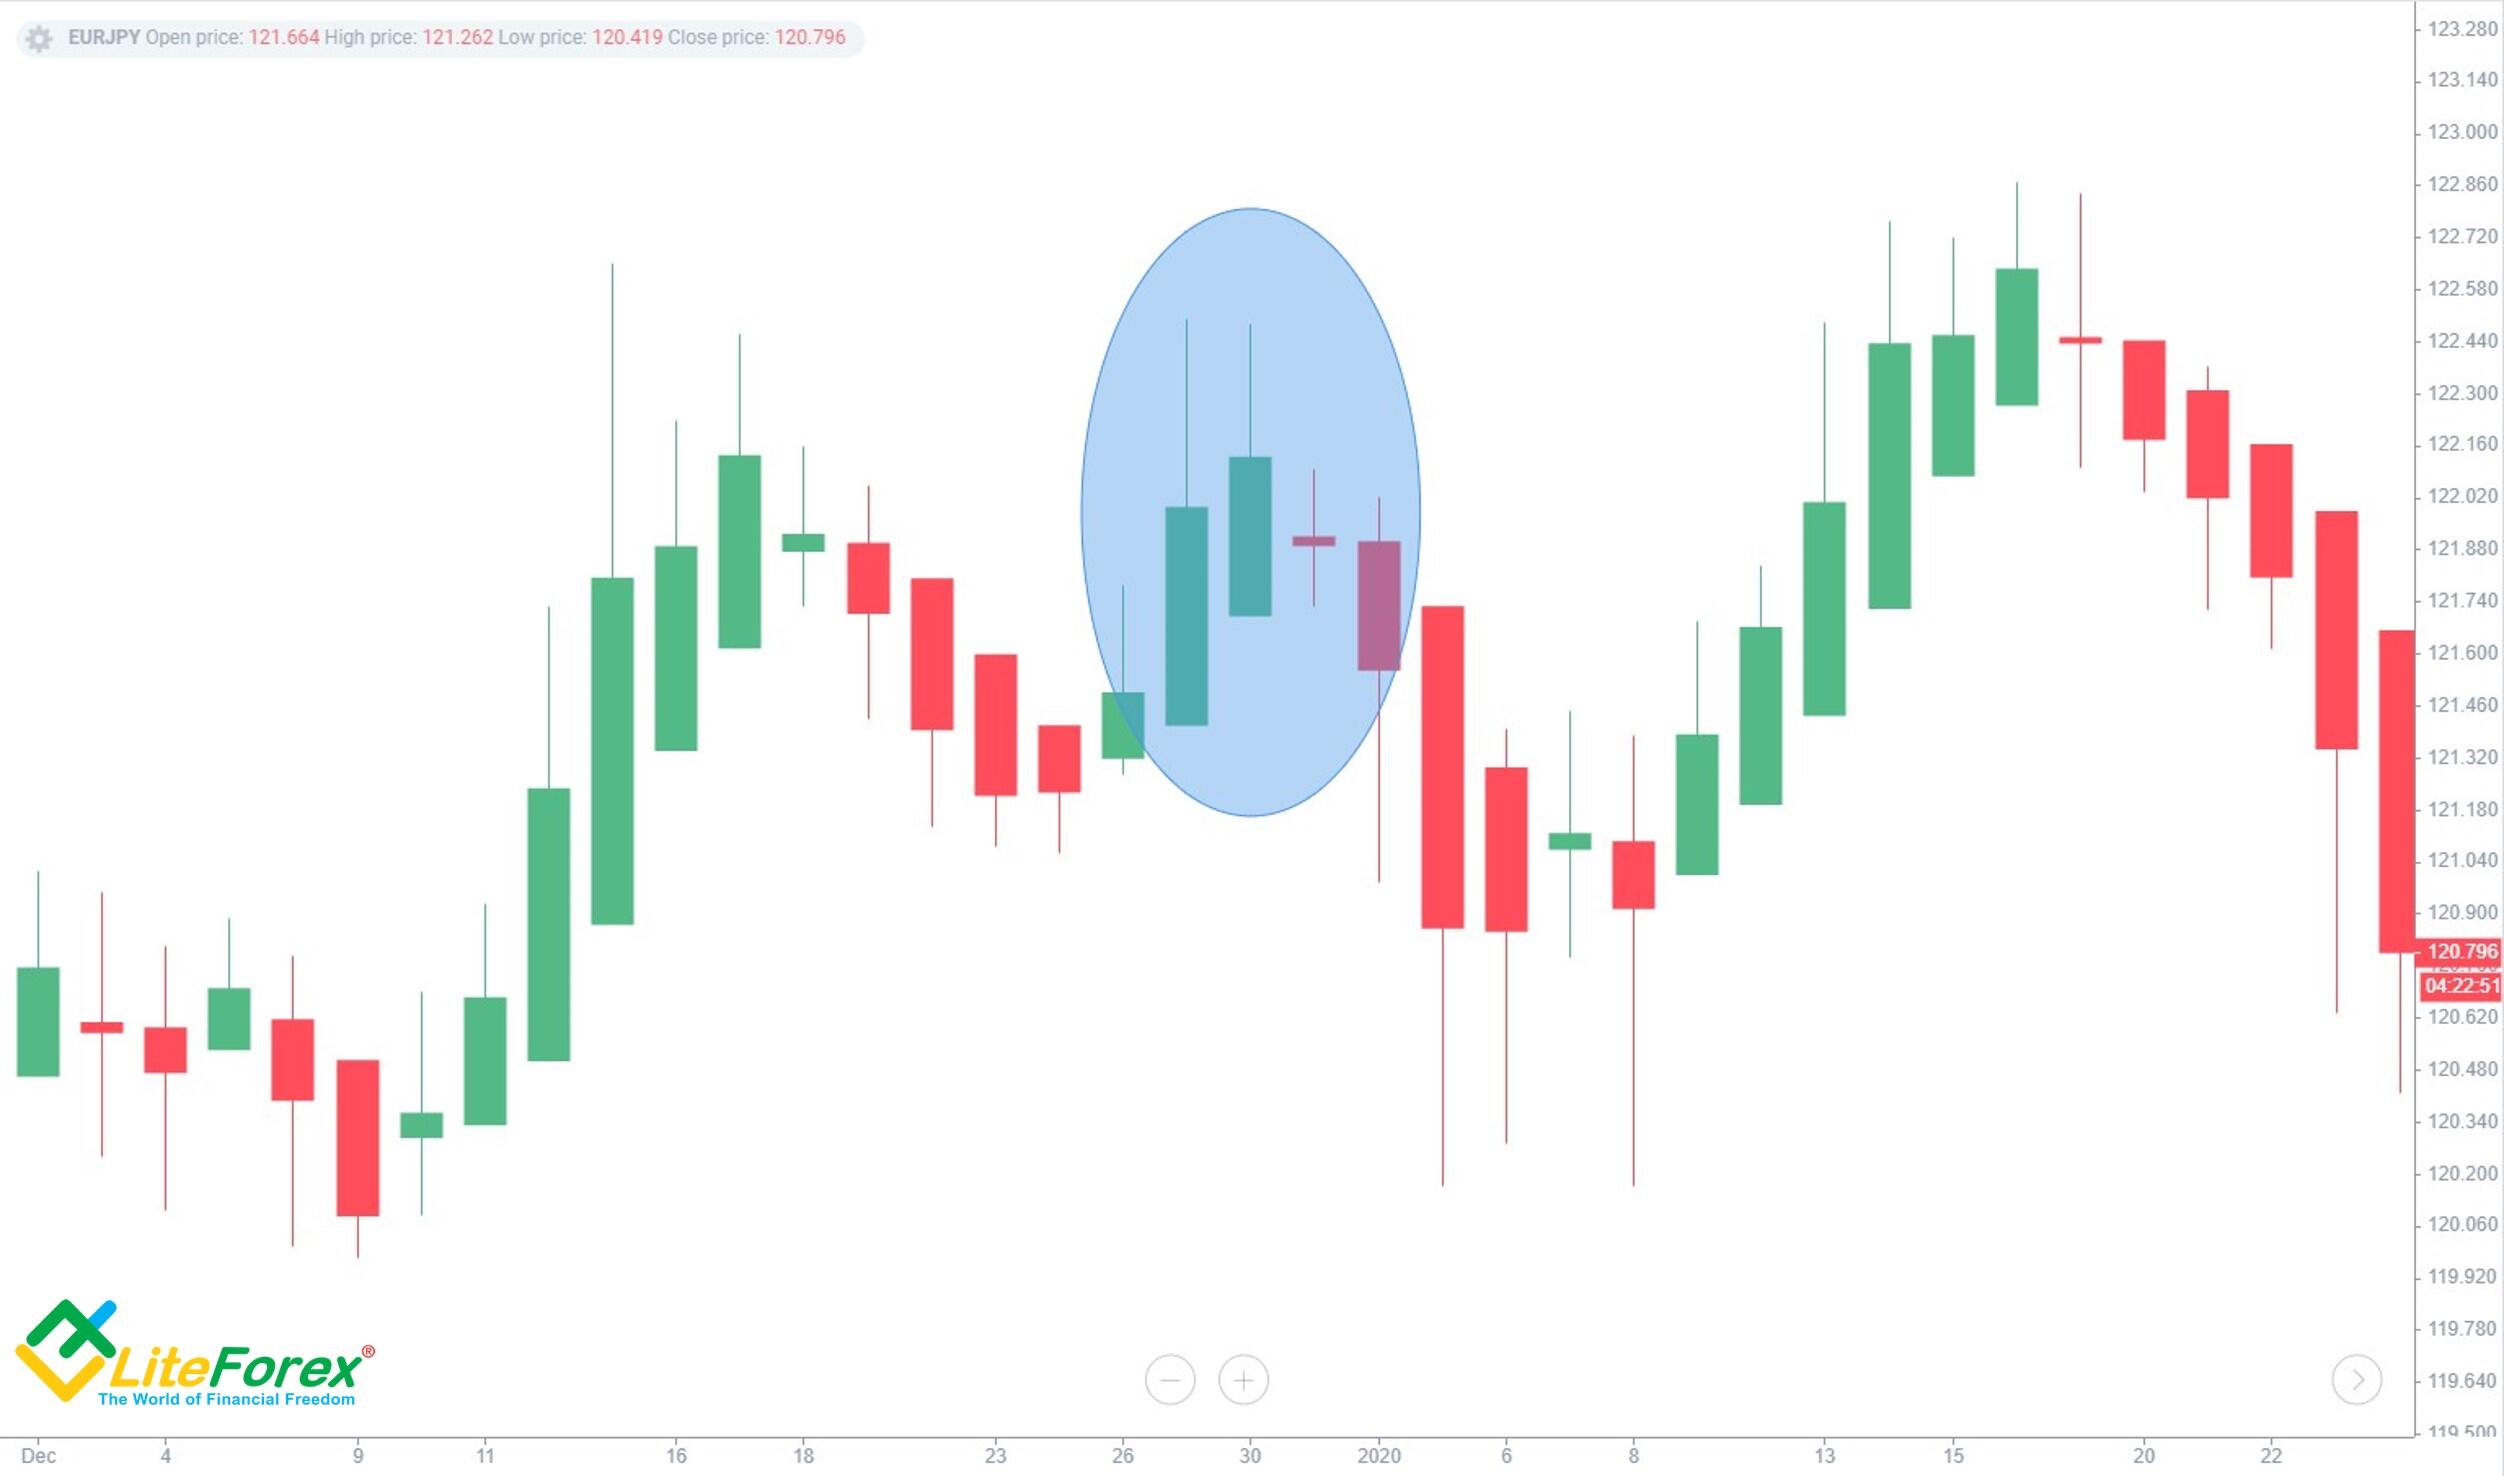
Heiken-Ashi Doji
This forms when the opening and closing prices are almost the same. At this moment, bulls and bears are equally strong, showing uncertainty in the market. Therefore, when Doji appears at the top of an uptrend, prepare to open a short position, and at the bottom of a bearish trend, open a long trade. To maximize reliability, combine Doji with an oscillator, such as Stochastic.
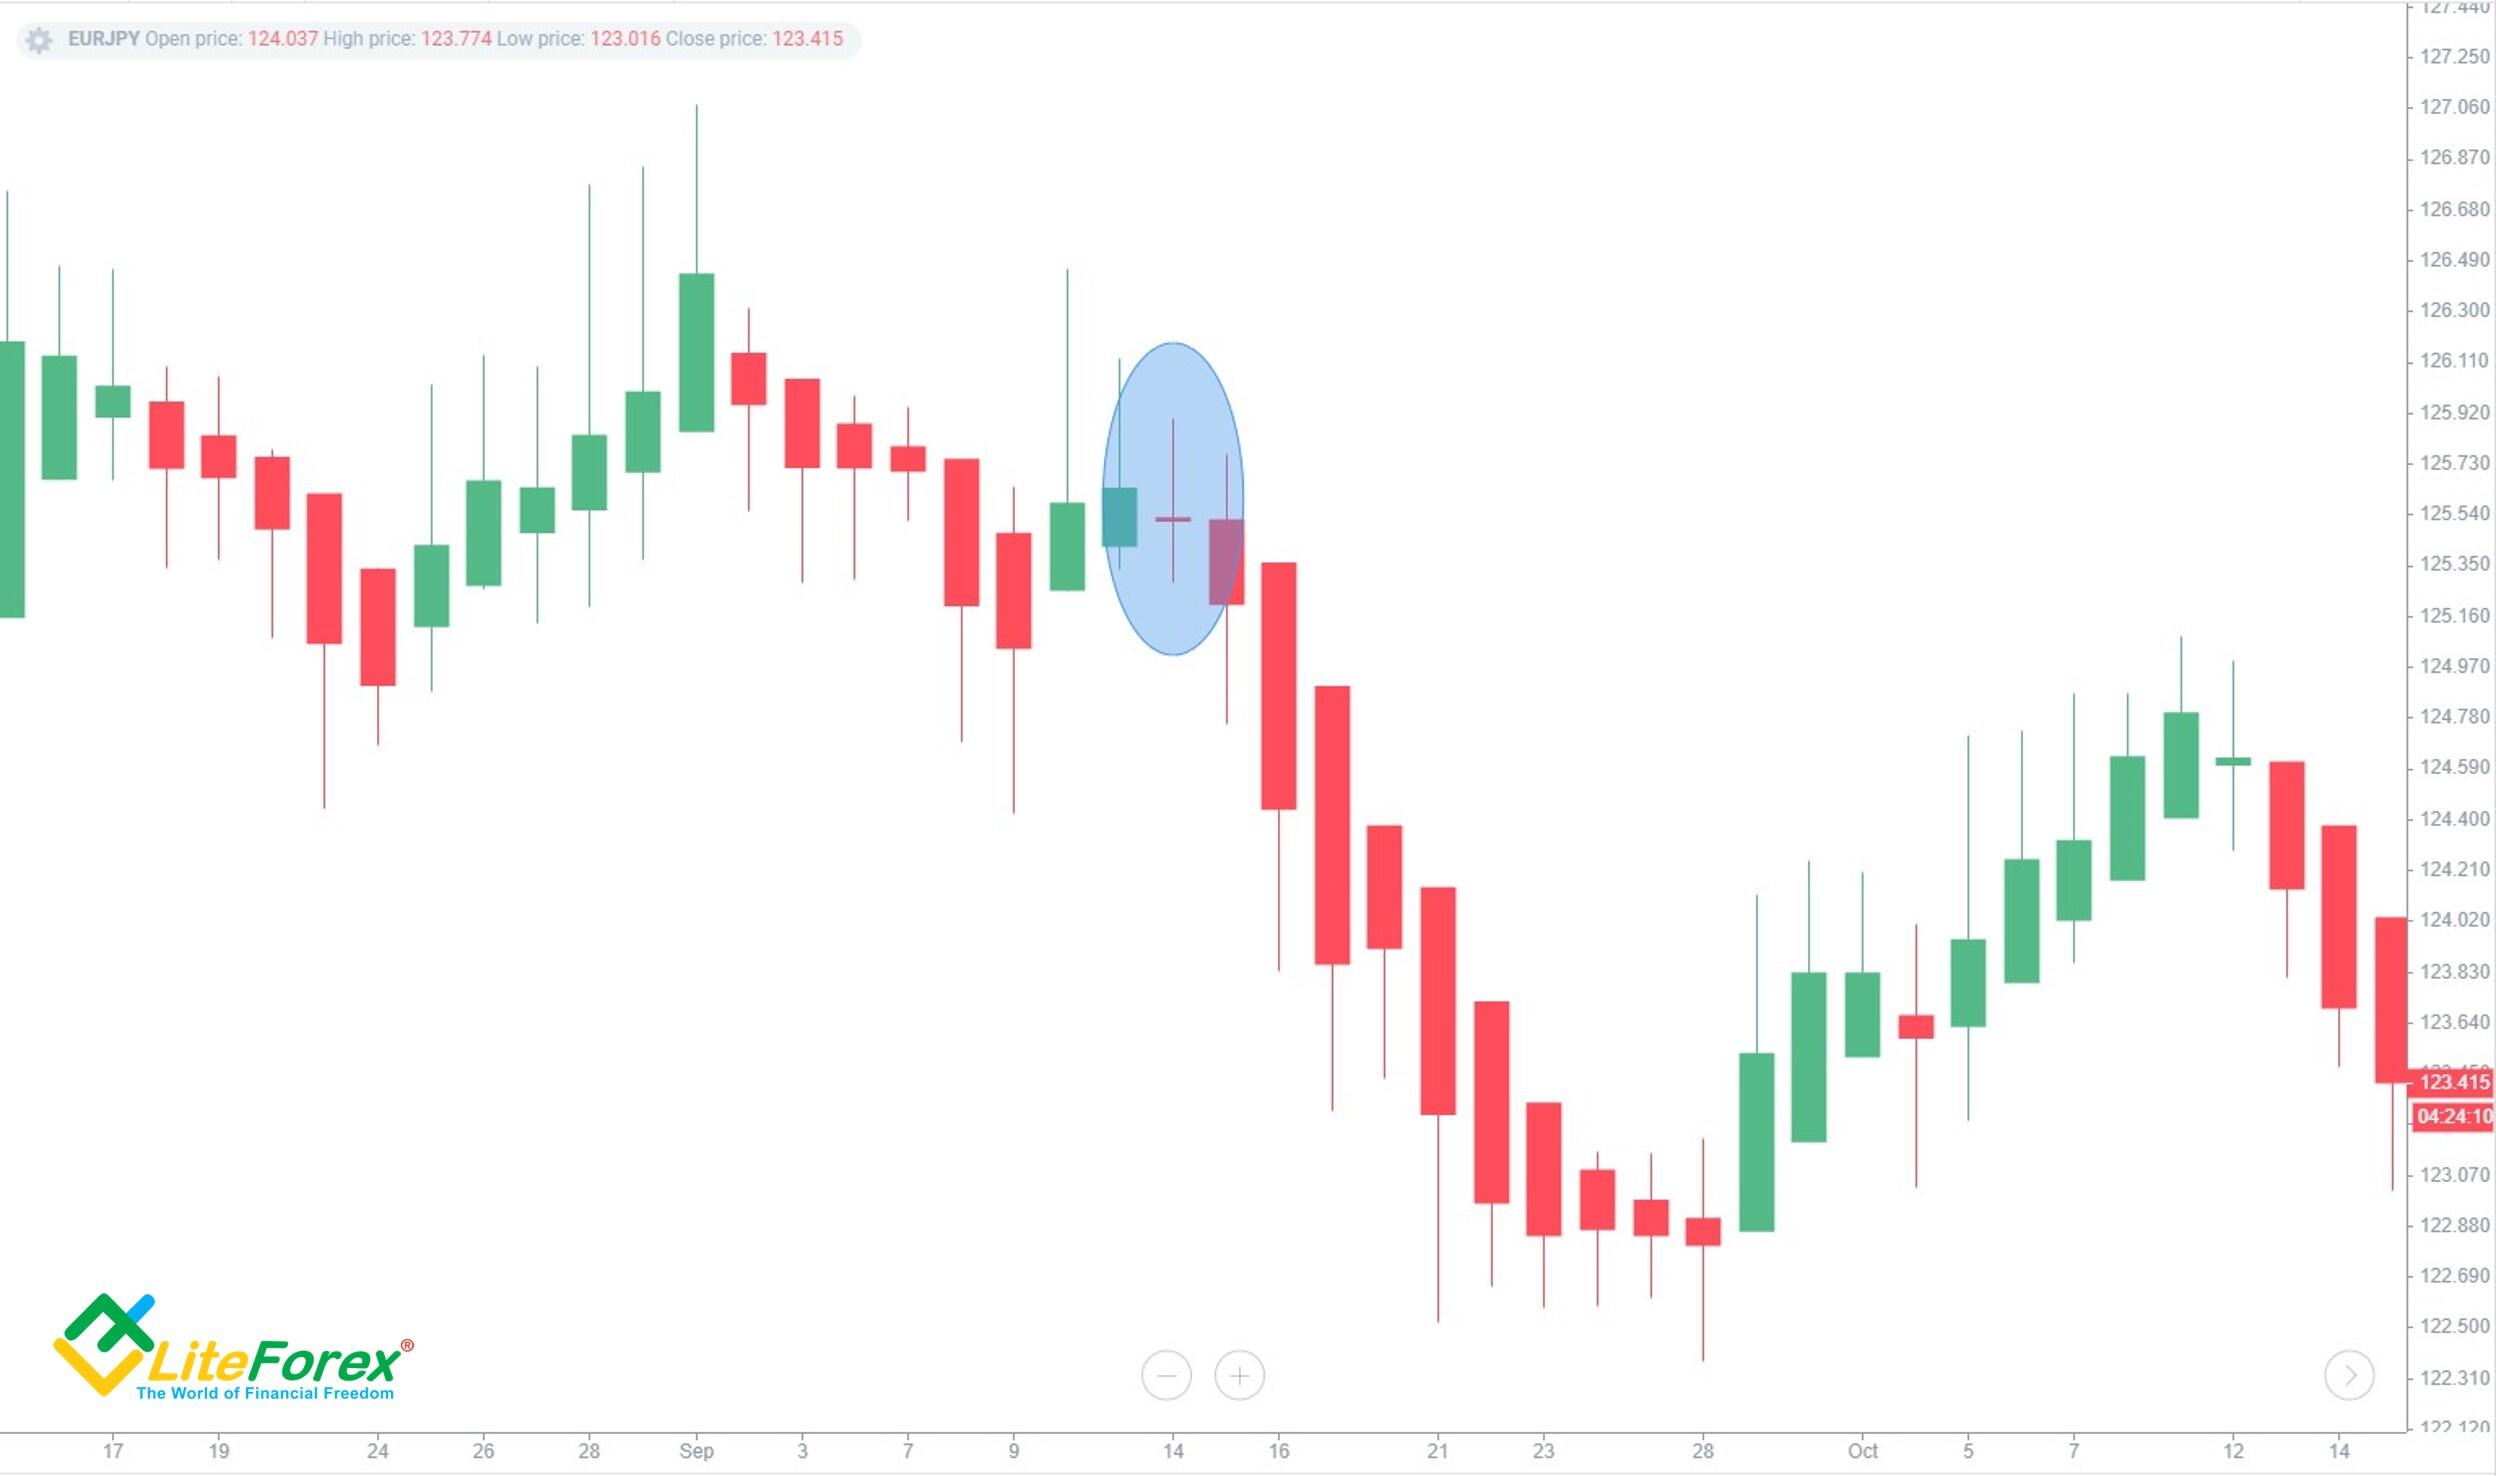
On the EURJPY Heikin Ashi chart, Doji candlesticks are marked with a blue oval. Note that the body is very small and looks like a narrow strip.
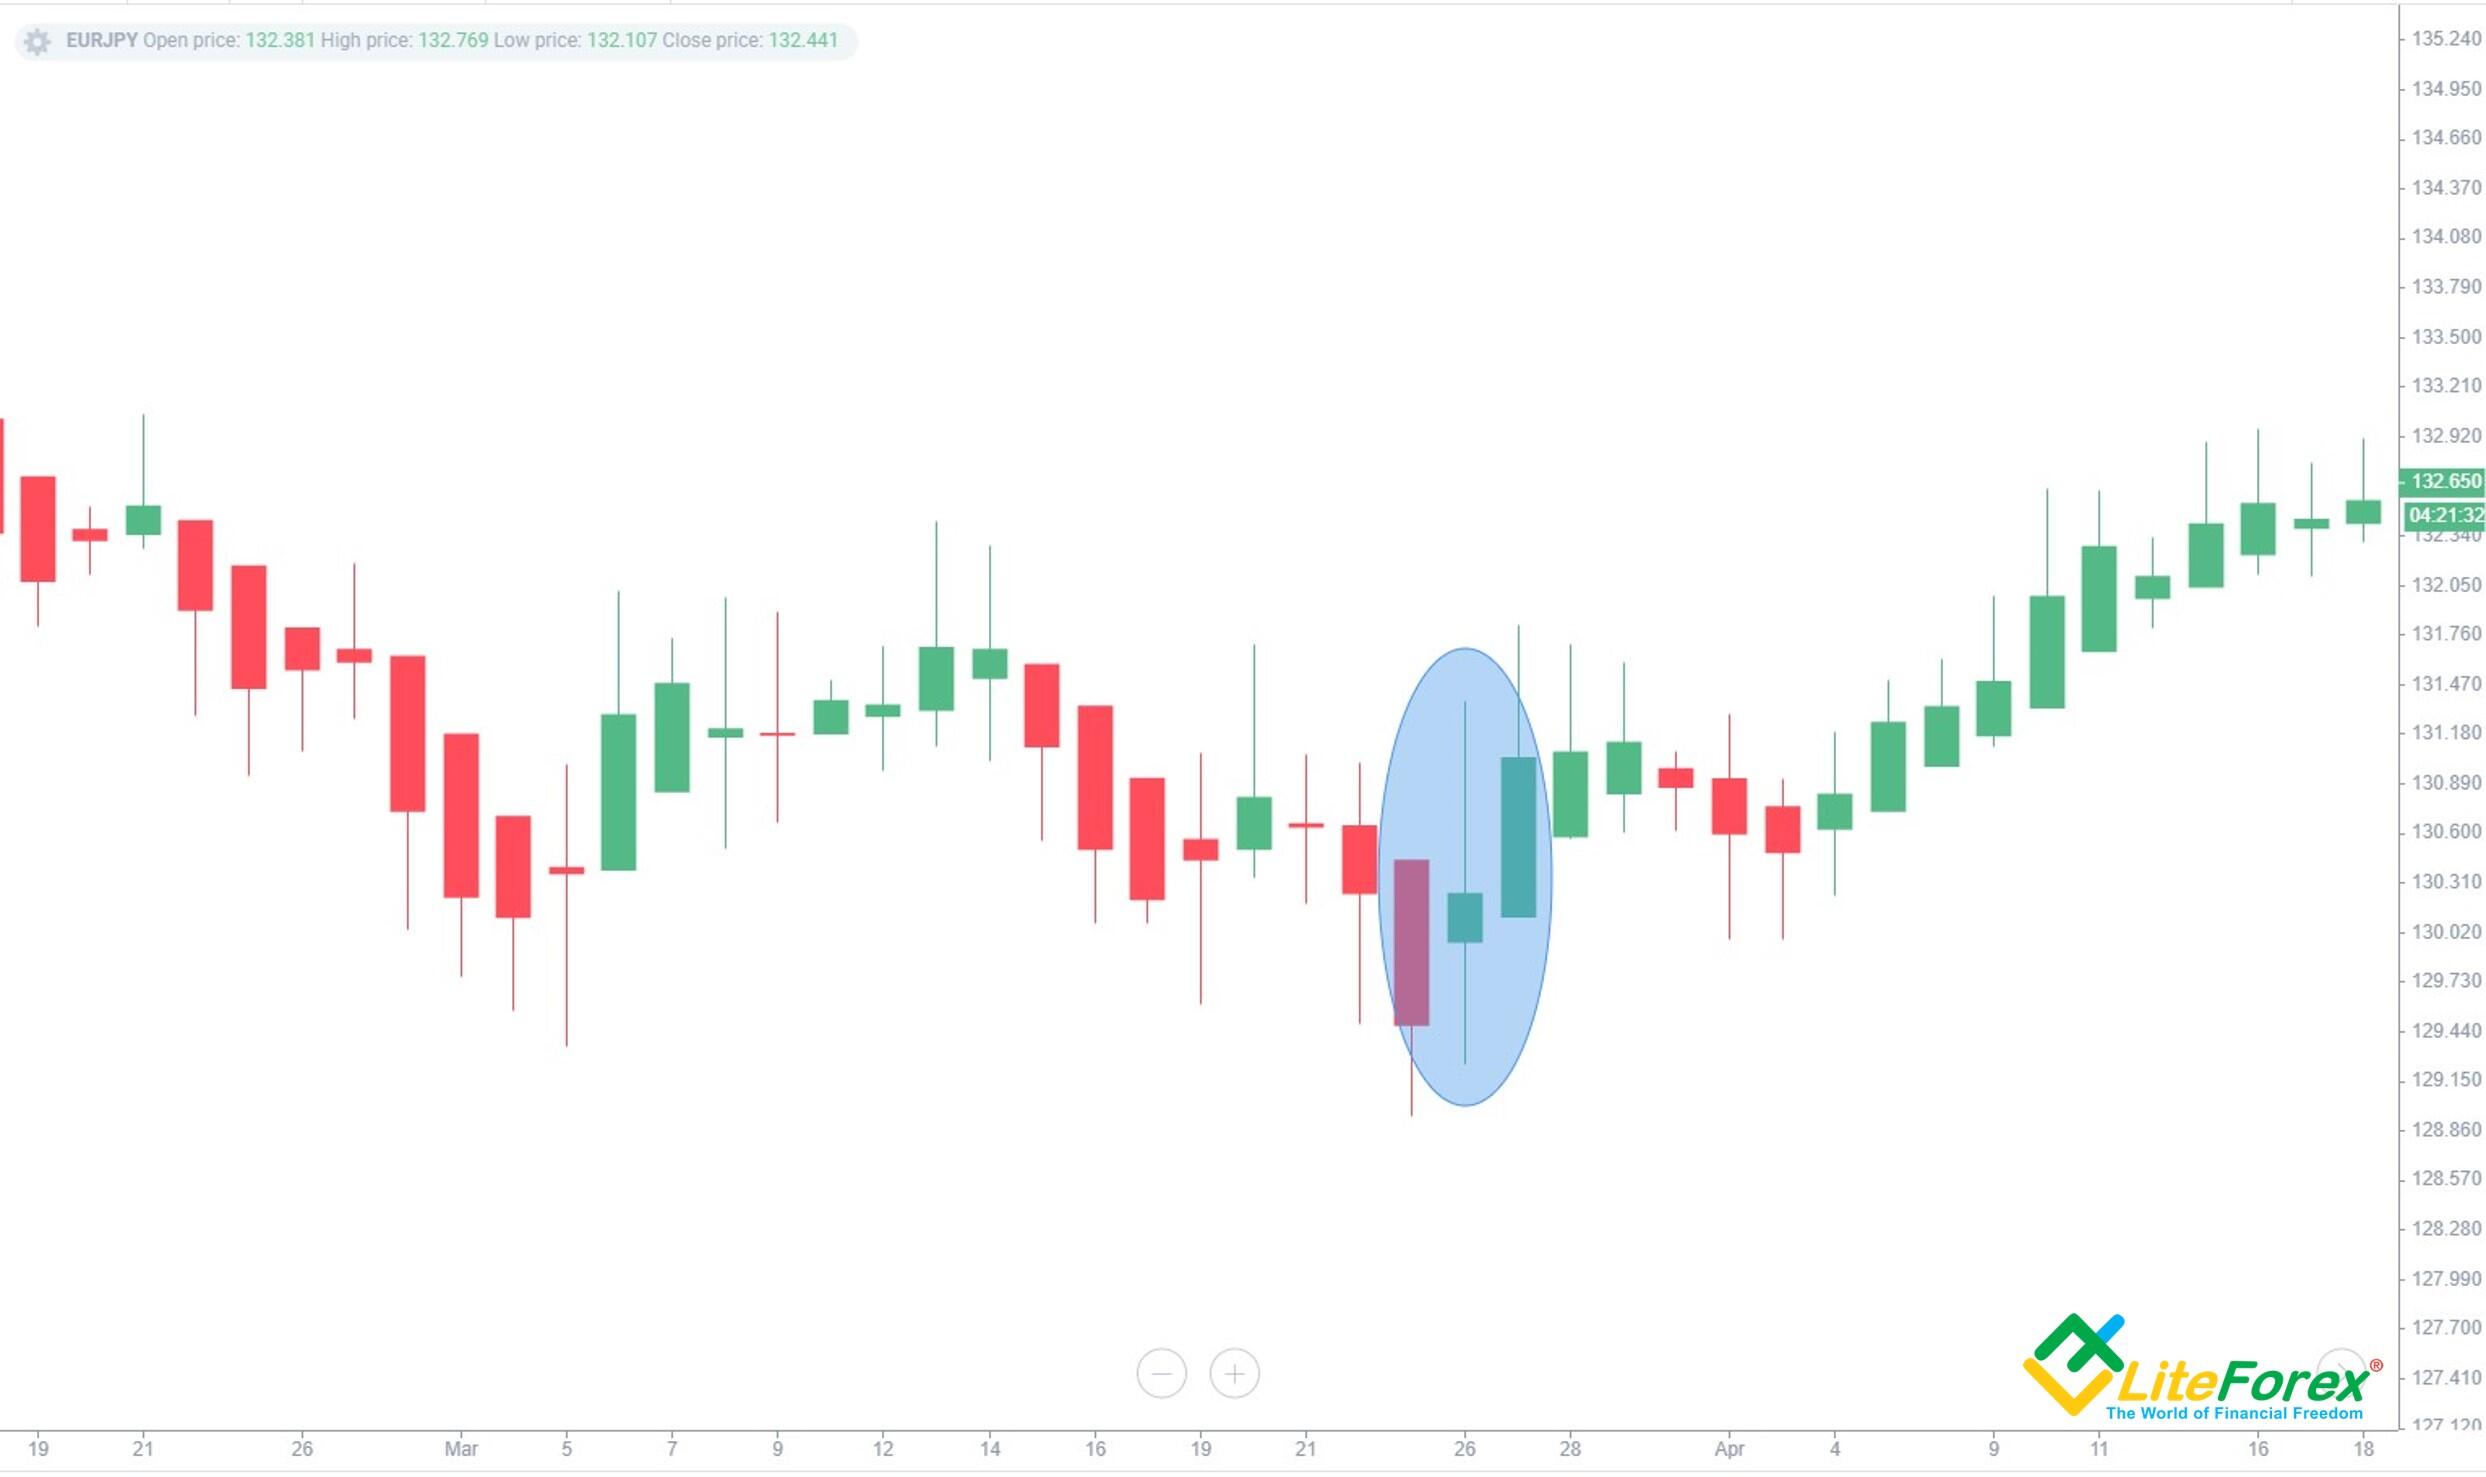
Cross
The Harami Cross (or, simply, the Cross) belongs to powerful reverse patterns. It helps determine a trend’s end and the beginning of a new one. This pattern consists of two candlesticks. The first has a fairly large body, and the second is small, similar to Doji. At the same time, the second bar shouldn’t exceed the first one.
Above is an example of a cross. Please note that the second HA candle has a small body and is located within the range of the previous one.
Hammer
The Hammer, also sometimes called the Hanging Man, is a pattern with small bodies, small or no upper shadows, and long lower shadows. During an uptrend, the pattern is referred to as the Hanging Man. During a downtrend, it’s called the Hammer. In technical analysis, these patterns signify overbought or oversold conditions. Therefore, they indicate that a trend reversal is highly probable. Unlike Japanese candlesticks, HA Hammer can only be red candles or black, regardless of where it’s formed relative to the market trends.
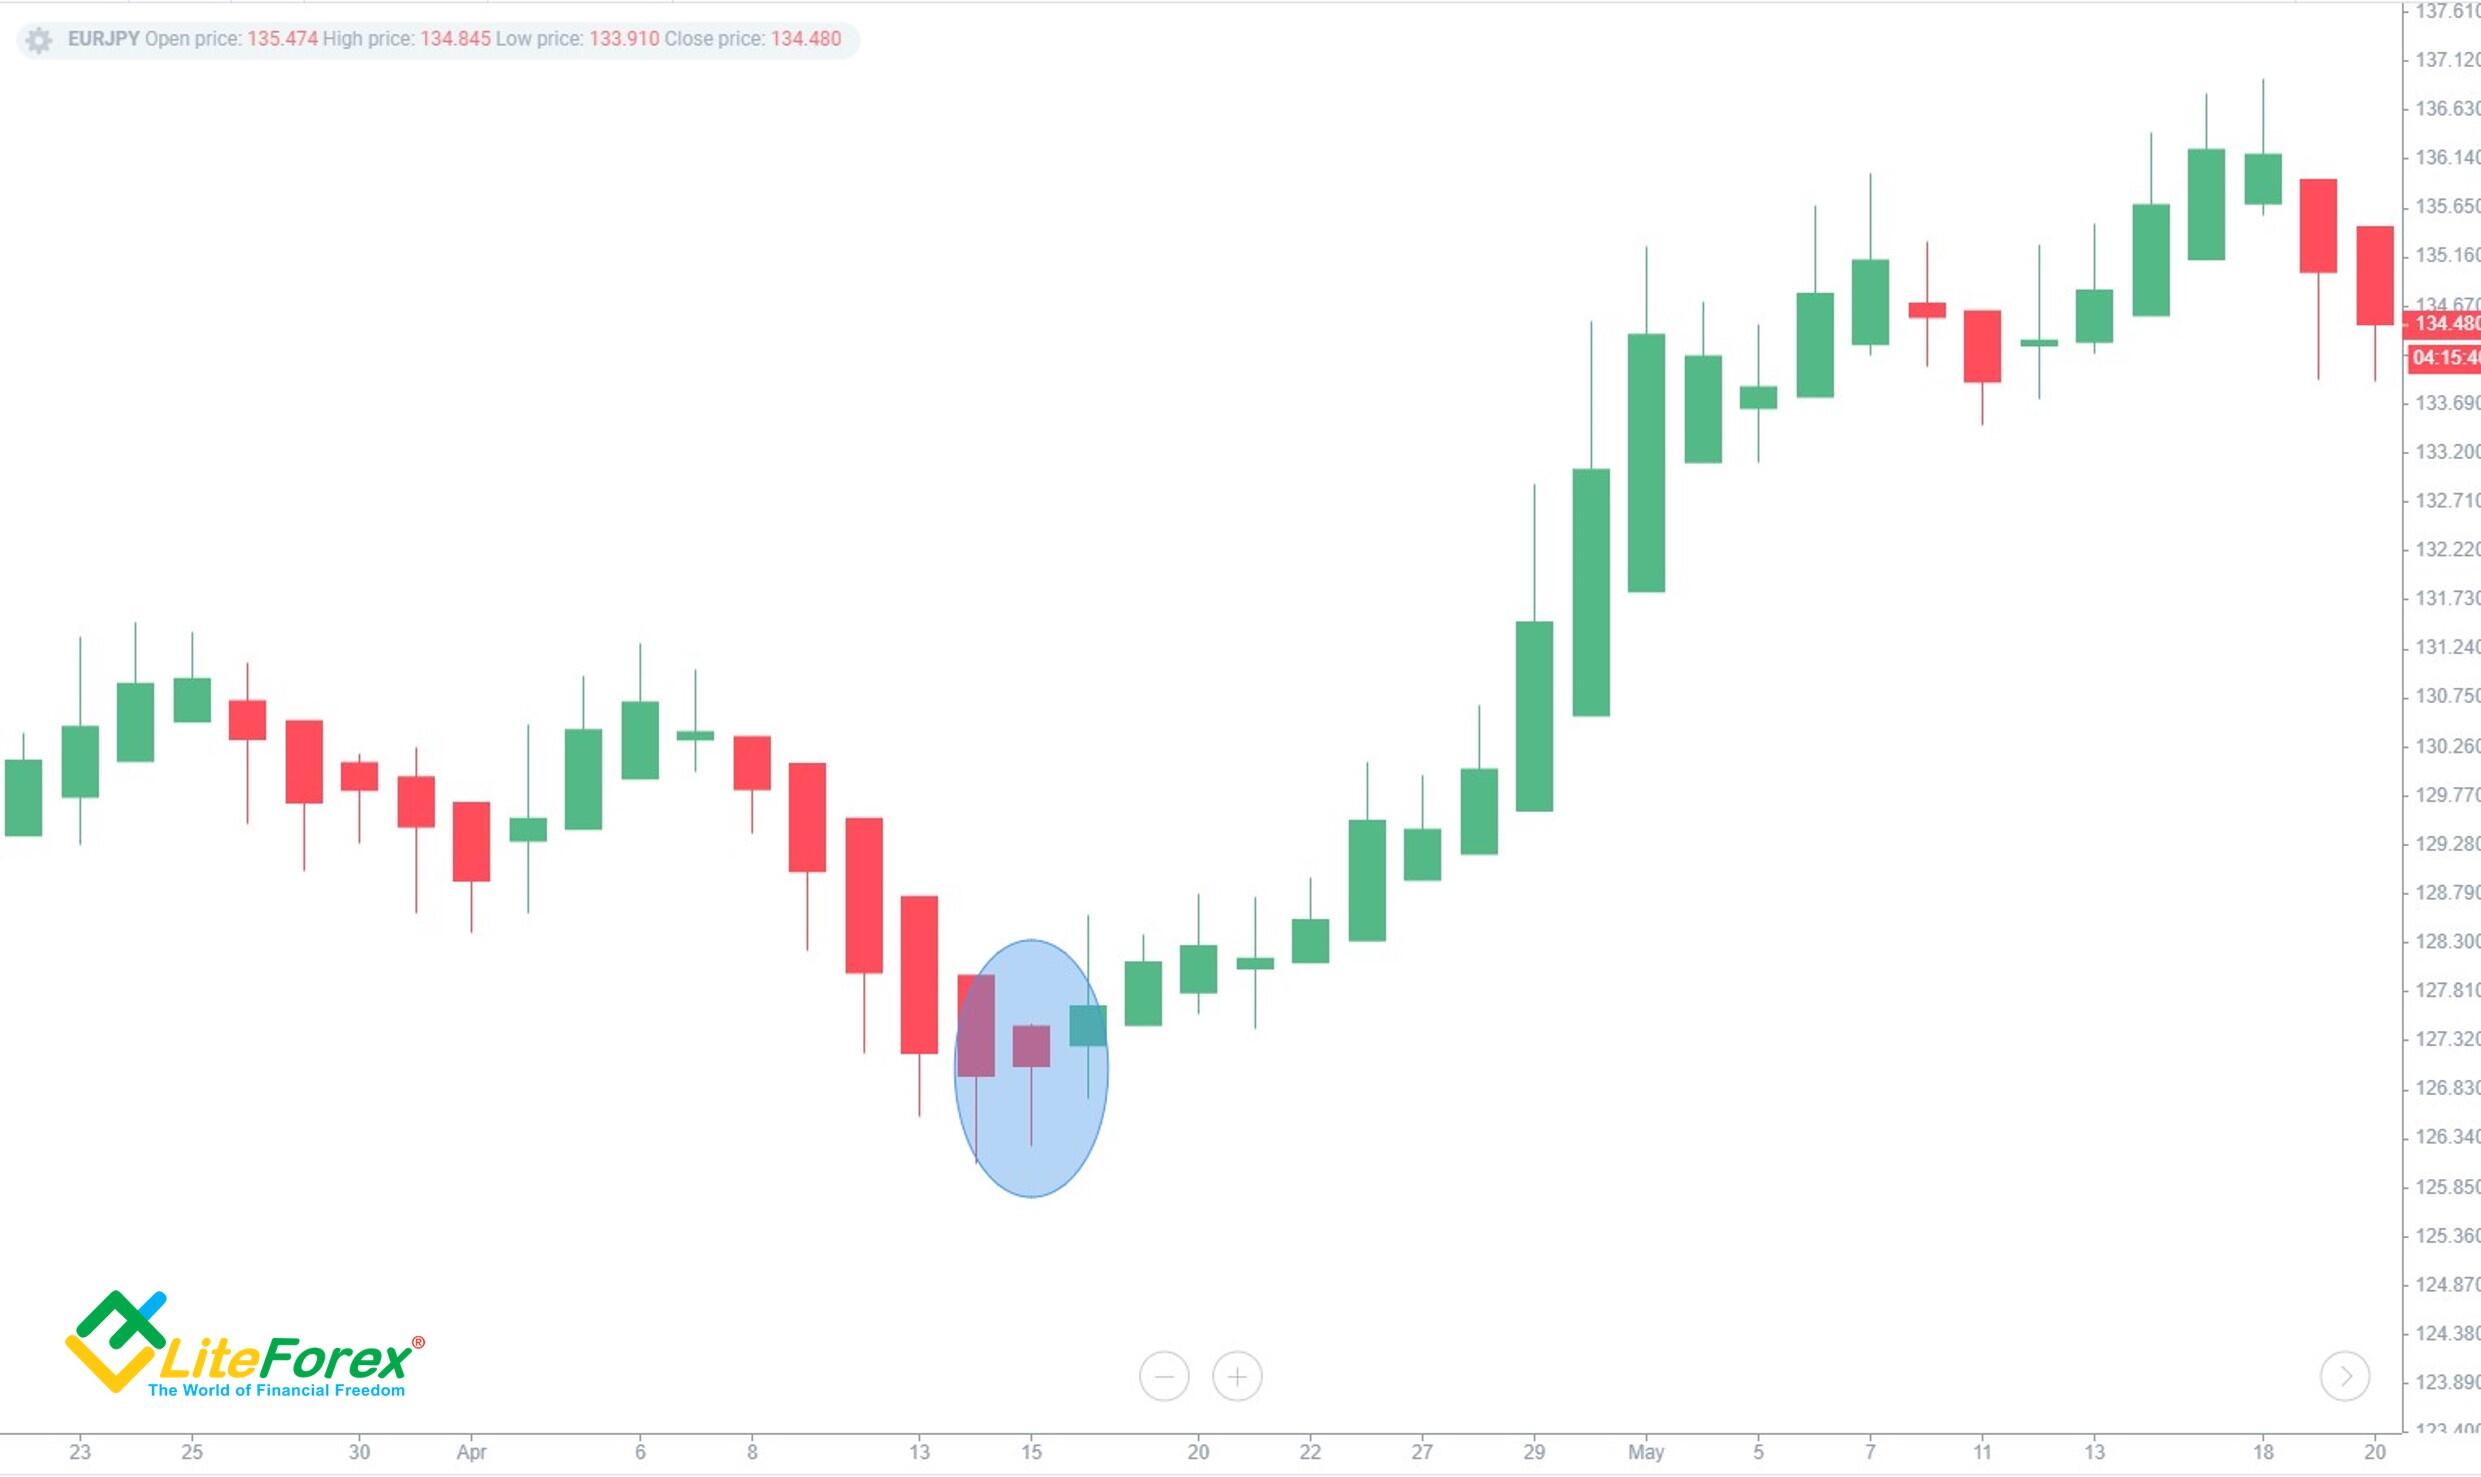
In the chart above, the Hammer is marked with a blue oval. It has no upper shadow, and the lower one is elongated. After the pattern is formed, the bearish trend pauses and then changes to the bullish one.
Shooting Star
This pattern looks like a shooting star or comet, hence the name. It appears at the top of a strong bullish trend and signals a downward reversal very soon. Remember a few simple rules to identify it accurately:
The bar’s body must be at least two times smaller than the upper shadow;
The lower shadow should be 10% of its body or lower.
As with the Hammer, the HA shooting star is only a bullish green/white candlestick, even though it usually forms just before a bearish reversal.
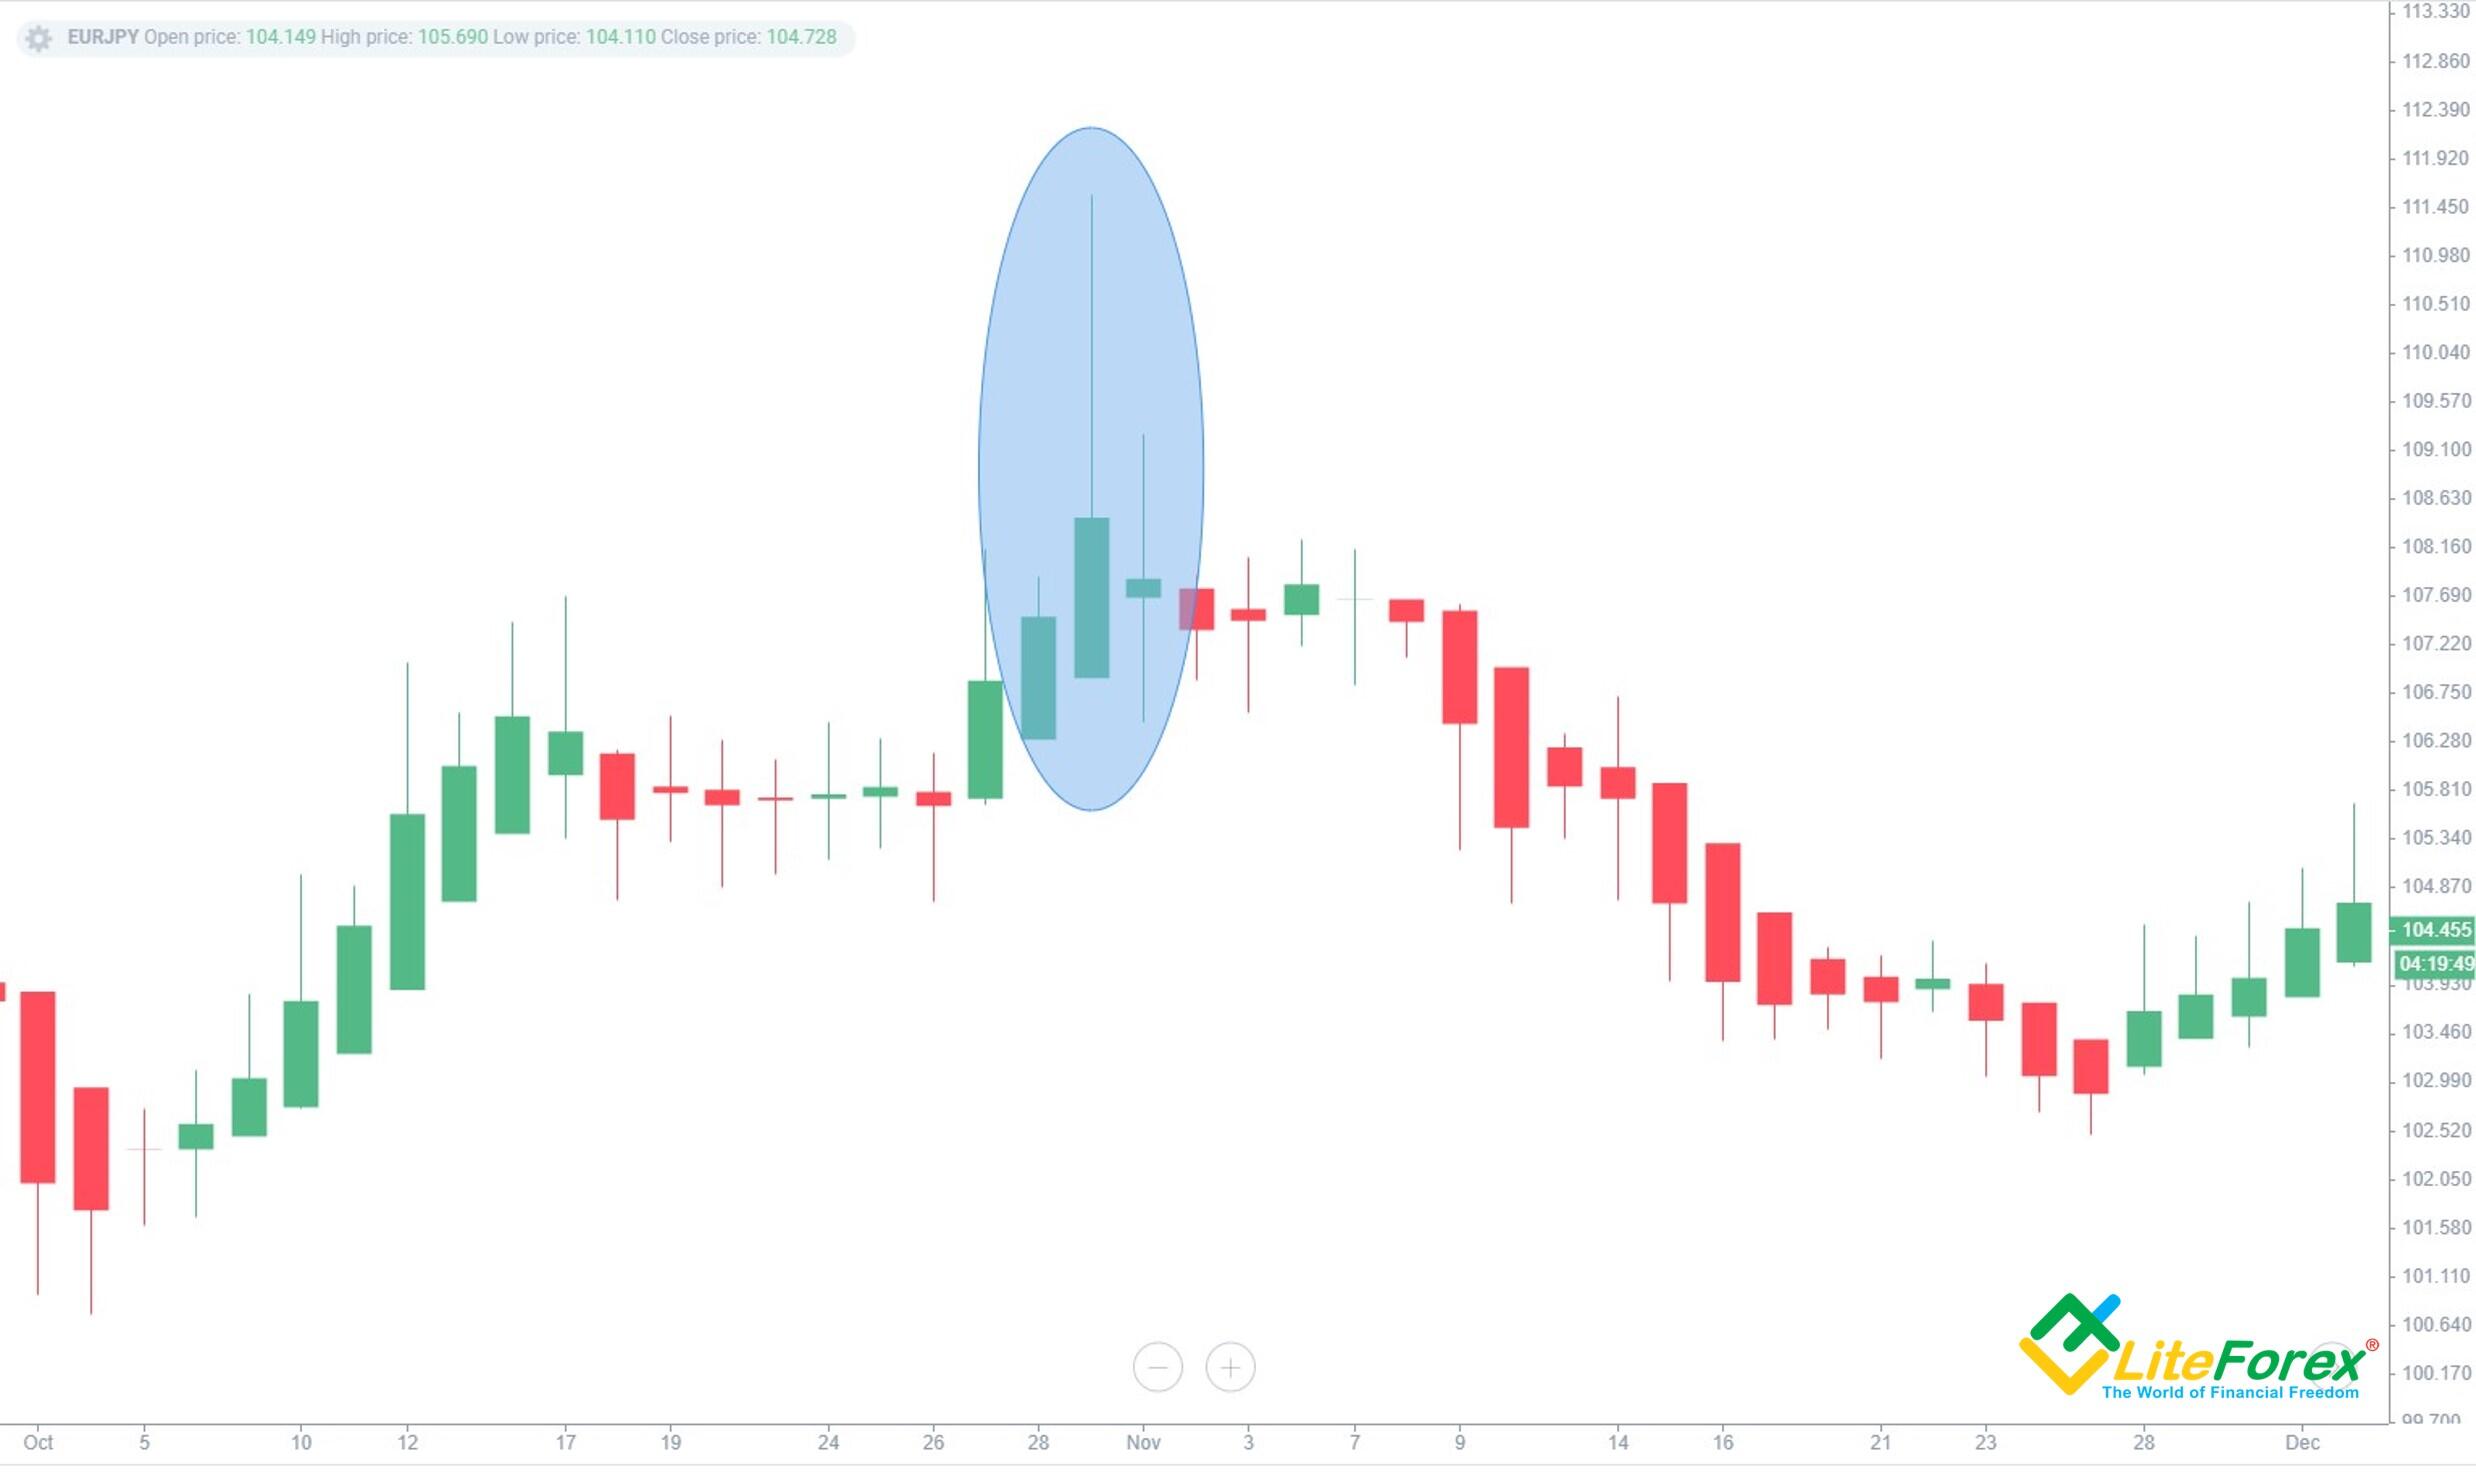
In the chart above, the blue oval shows a shooting star. This bar has no lower shadow, and its body is about three times smaller than the upper shadow/tail.
High Wave
High waves are bars with long and roughly equal upper and lower shadows. They can be of any color. Such patterns, like Doji, indicate the balance of buyers and sellers and may be the first signal of a bullish or bearish trend movement that is coming to its end.
The Heikin Ashi chart shows an example of a high wave. Its shadows are many times larger than the body and are approximately the same in length.
Heikin-Ashi Trends
In terms of Heikin-Ashi vs. candle, it’s easier to detect a trend direction with Heikin-Ashi while also getting better trading results. Experienced traders look at several factors at once:
The body’s length and its change over time;
The ratio between the body’s size and shadows;
Whether the bullish or bearish movement is predominant;
The direction of price movement.
Below, I will give step-by-step instructions on how to identify trends (bullish and bearish) with these signs.
Bullish Heikin-Ashi Trend
The bullish trend direction matches the following conditions:
The price momentum is going up.
There are mostly green candles that look like upward bars on the chart.
If the bars’ bodies increase over time, the bullish movement intensifies and vice versa. Small bodies signify the trend is ending soon.
- With a strong, stable upward movement, Heiken-Ashi candlesticks form small or no lower shadows.
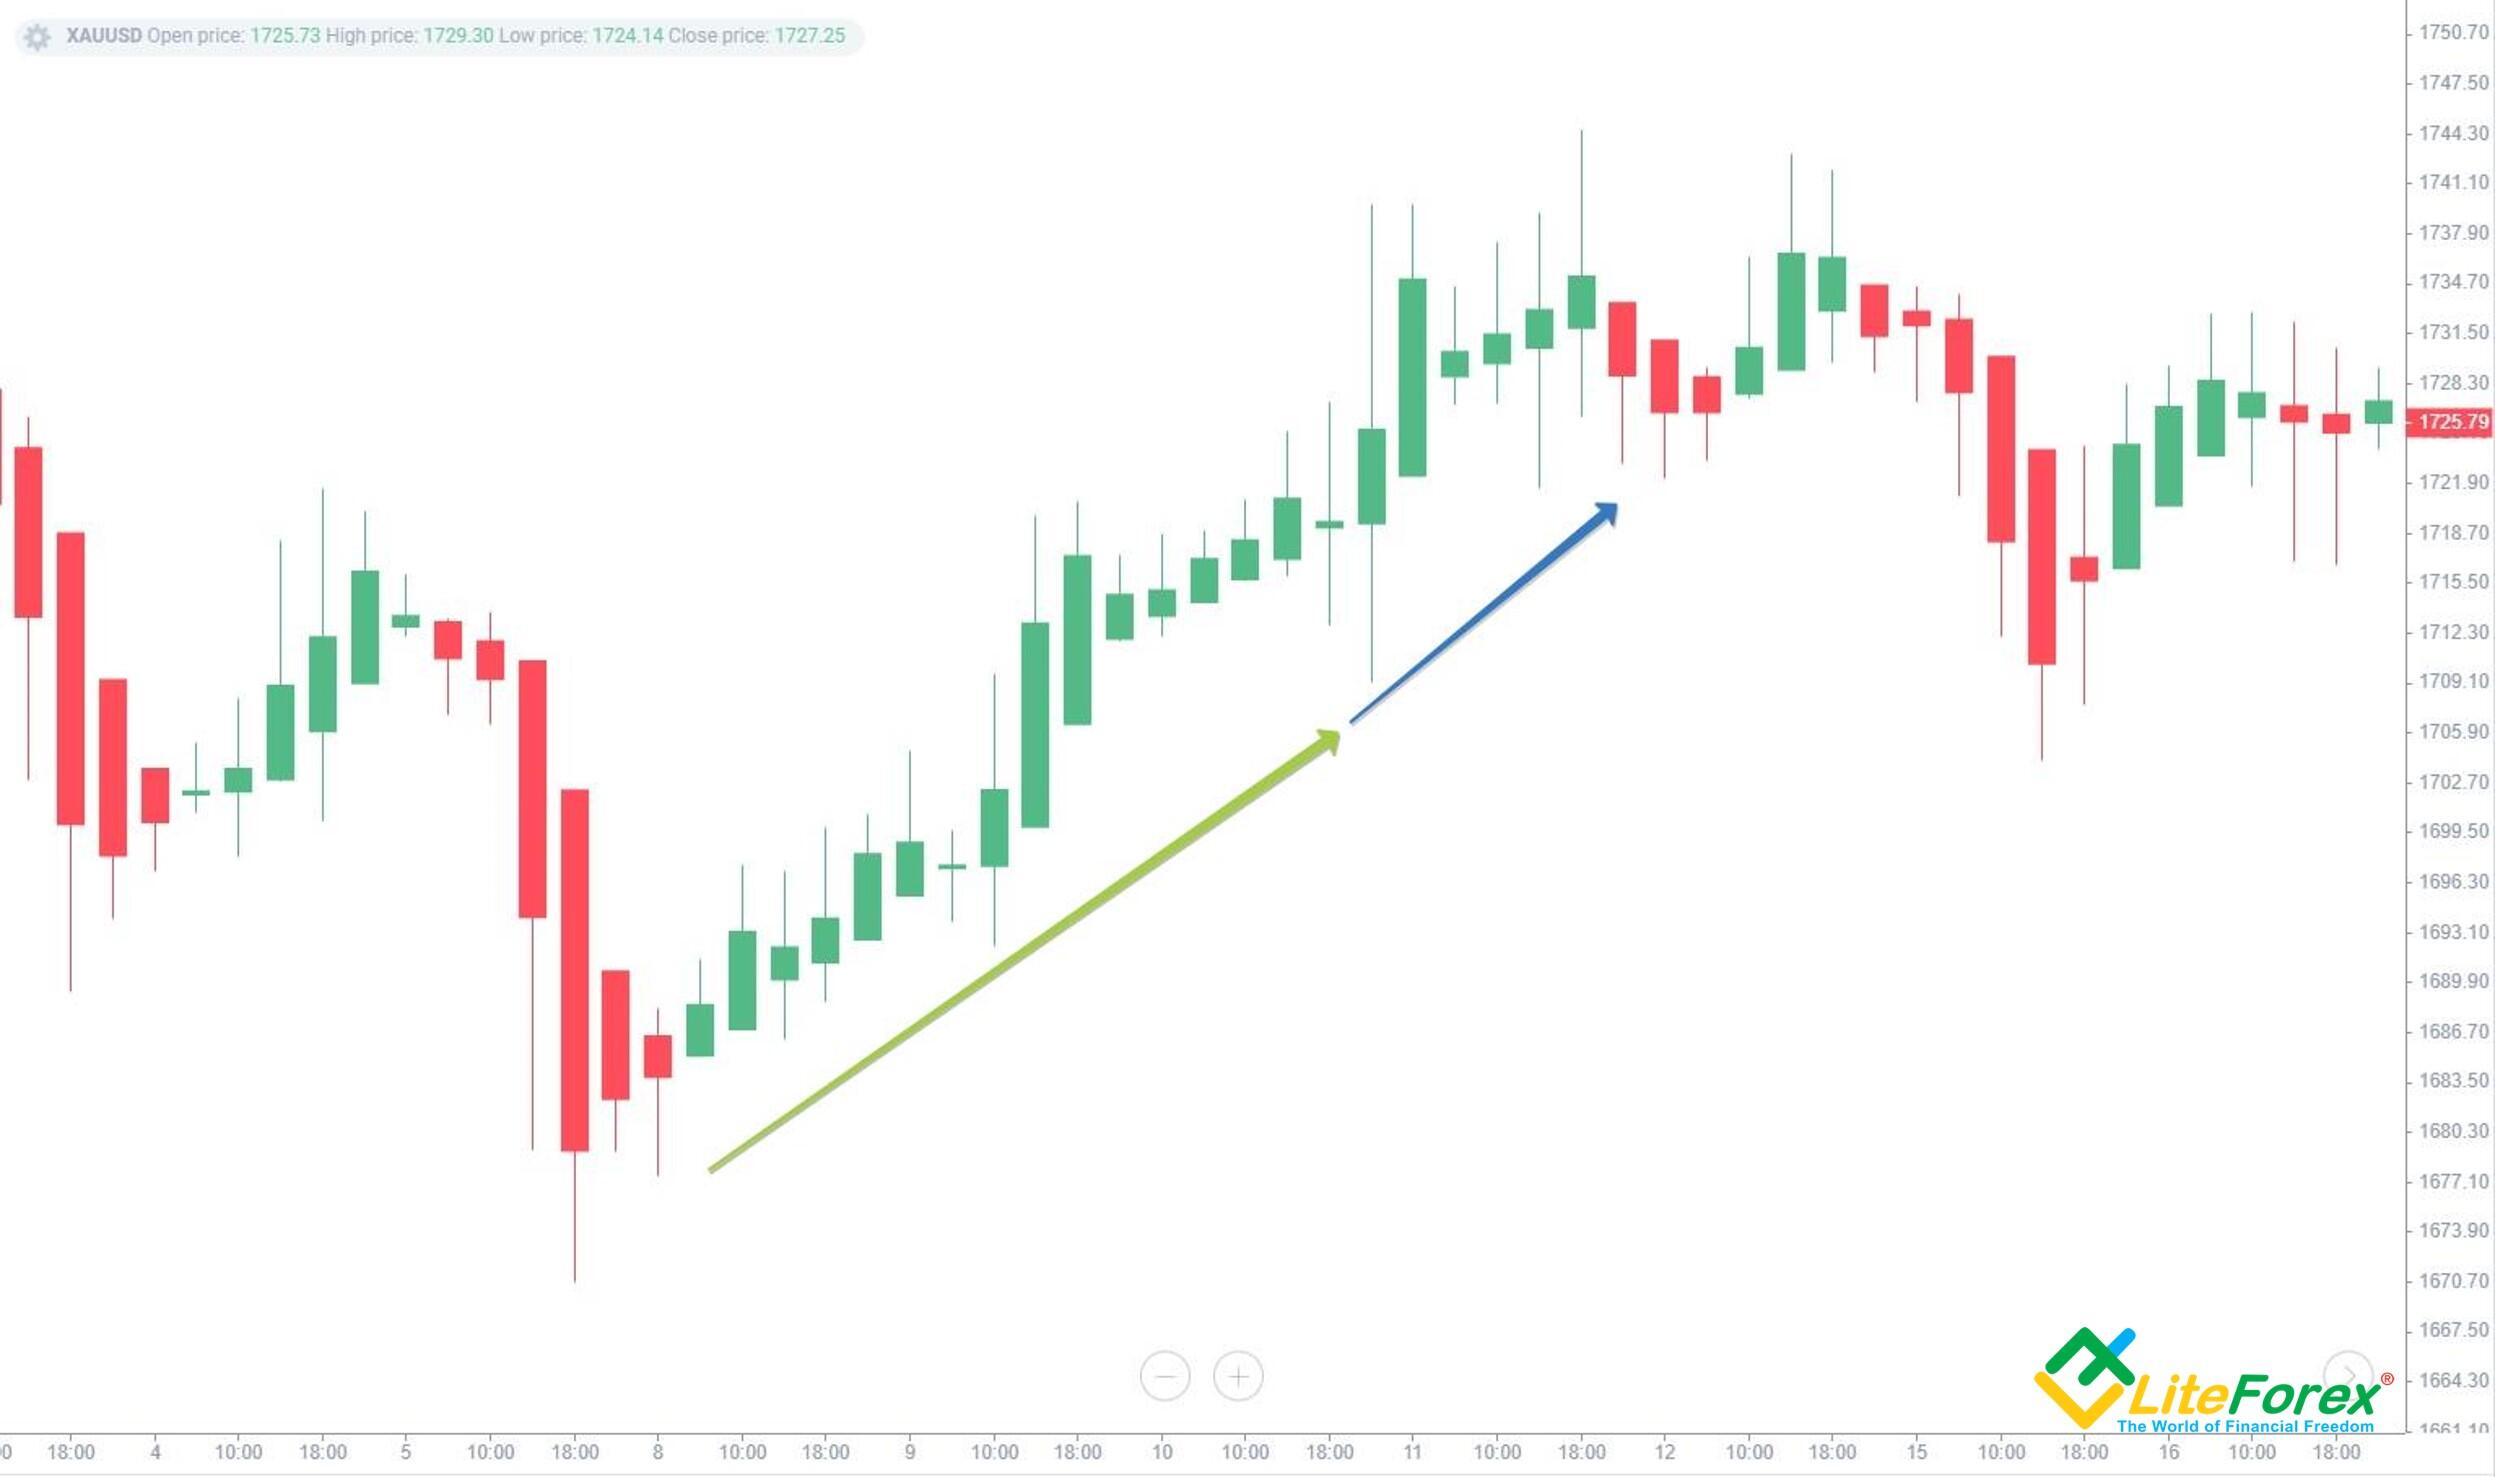
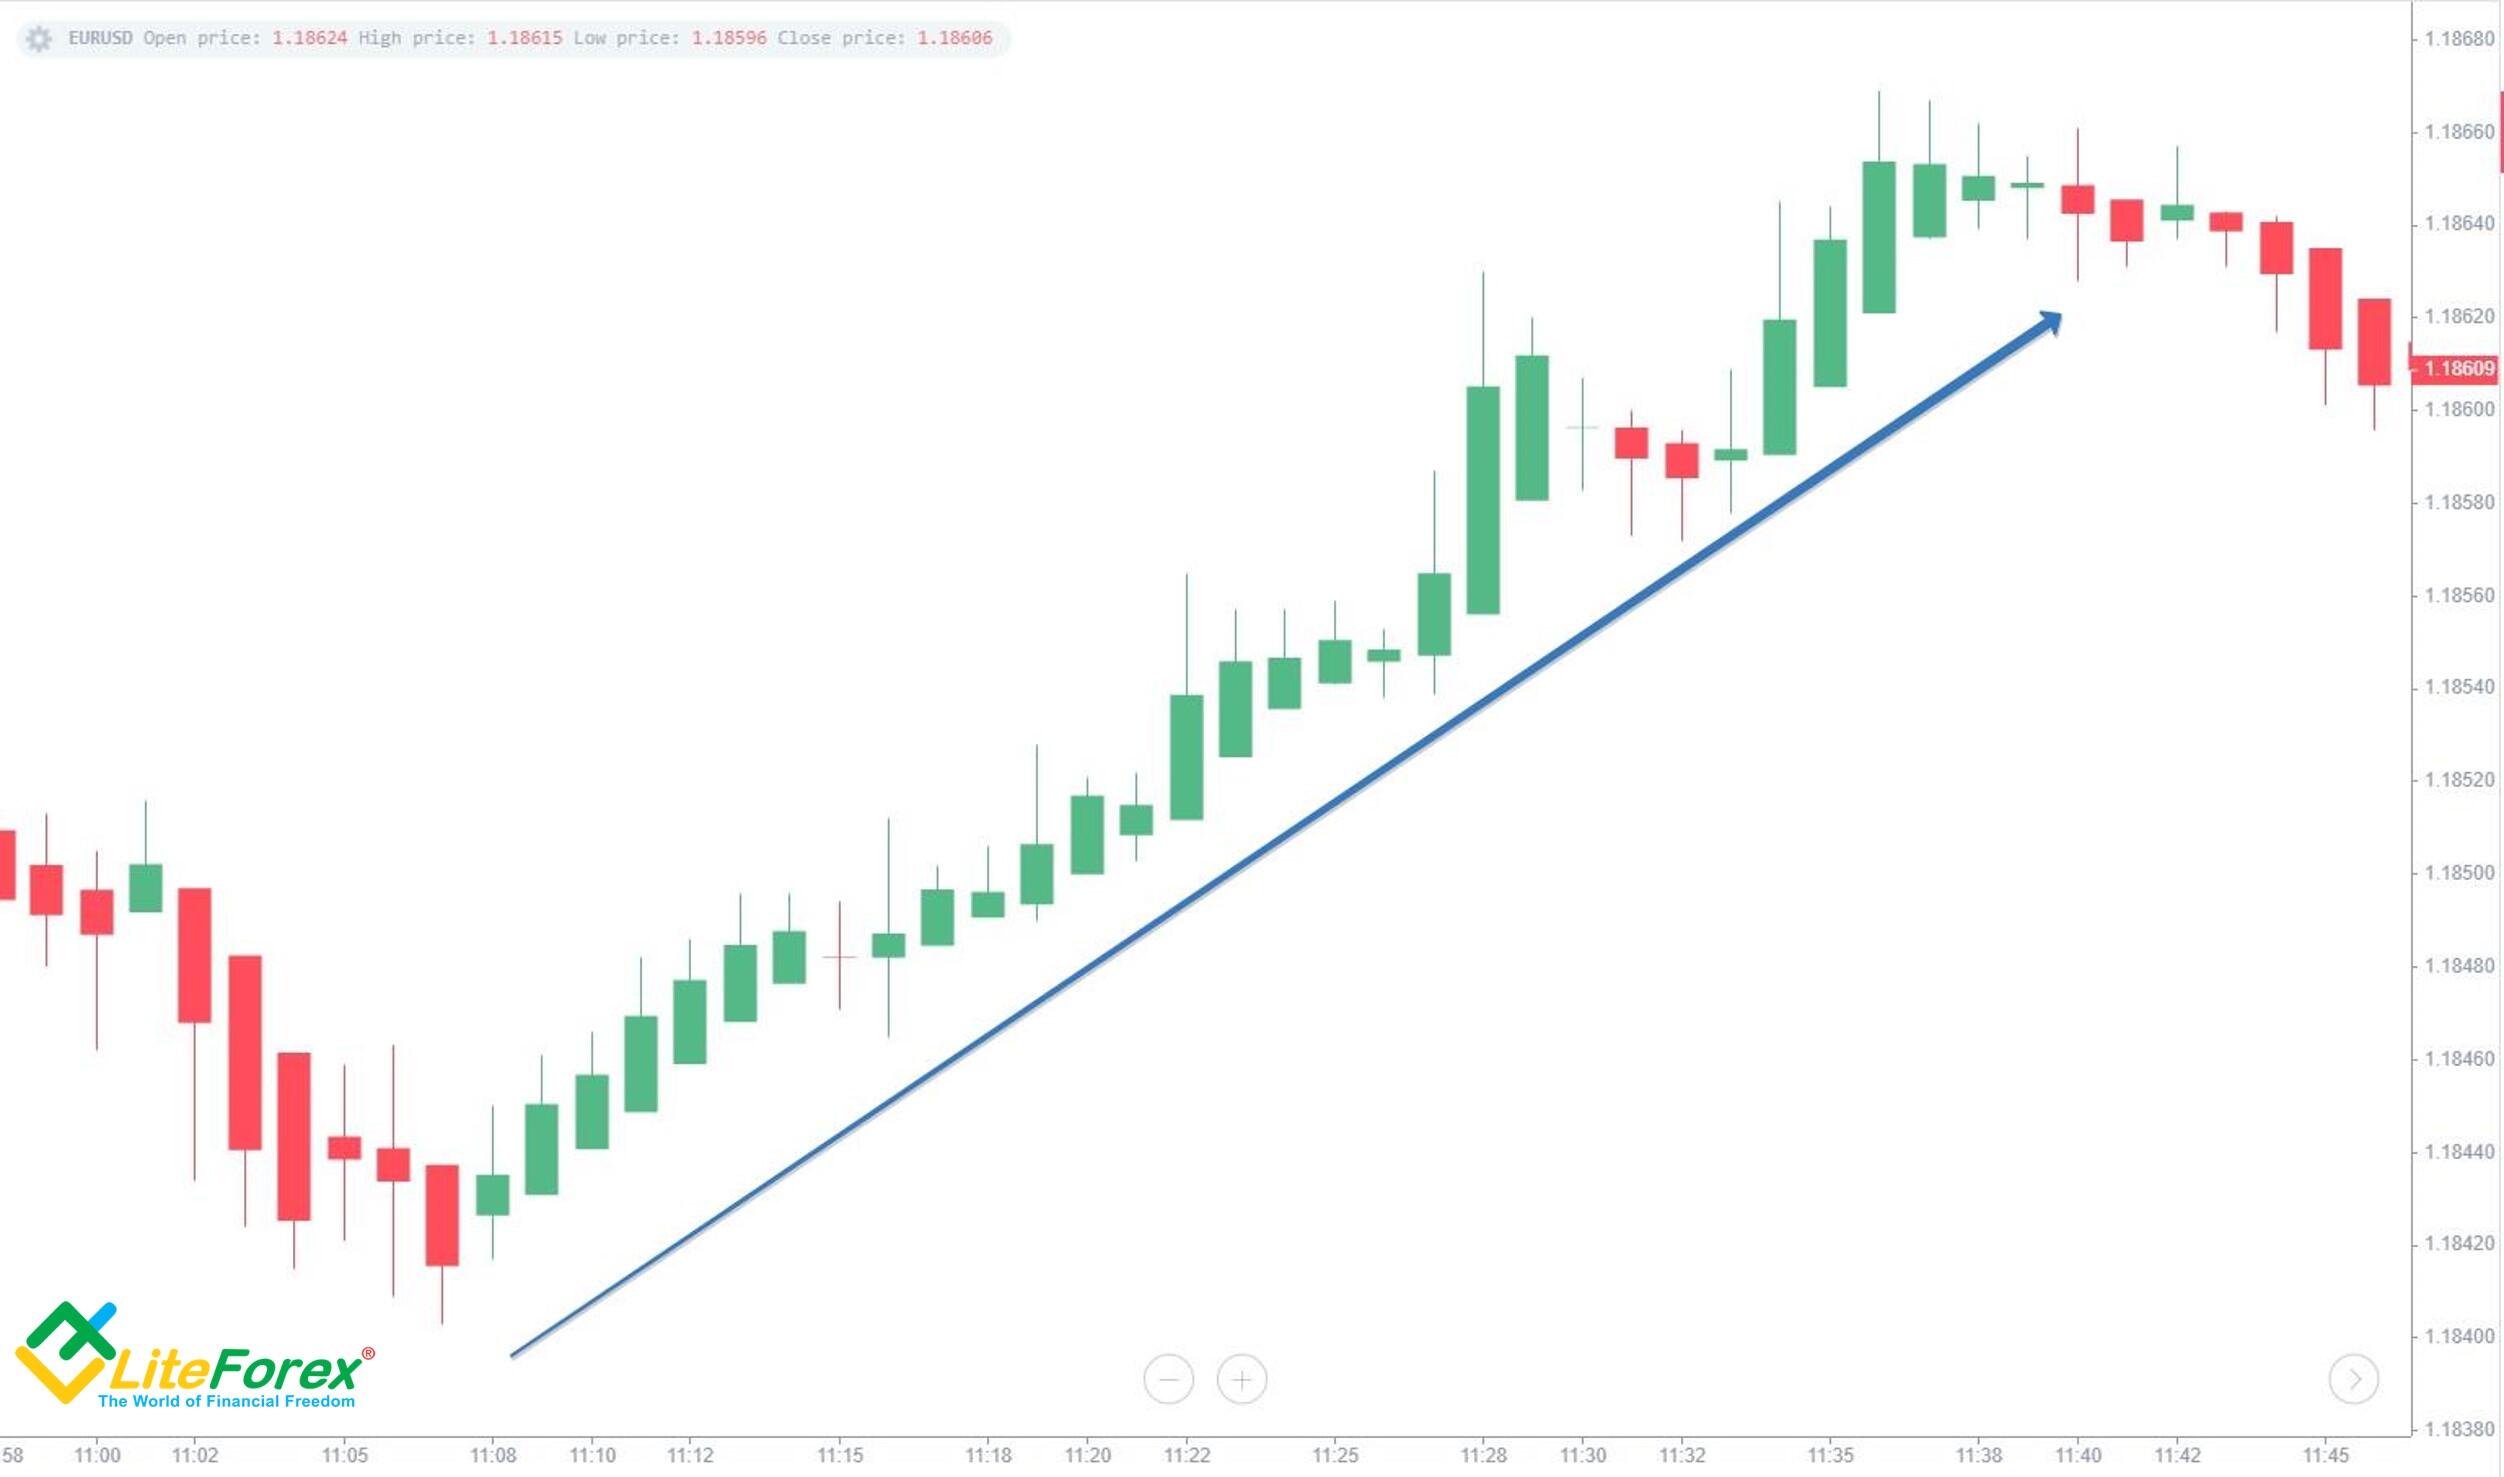
The XAUUSD chart shows a bullish trend direction where the consecutive colored candles are. At first, there are almost no lower tails (indicated by the green arrow). Before the upward movement ends, this changes and nearly every bar shows a lower shadow.
Bearish Heikin-Ashi Trend
The bearish trend direction follows these rules:
The price momentum is going down.
The chart is filled with red candles that look like falling bars.
If the bars’ bodies increase over time, the bearish movement increases, and vice versa. Small bodies signify that the trend is ending soon.
In a strong, stable downtrend, candles have small or no upper shadows.
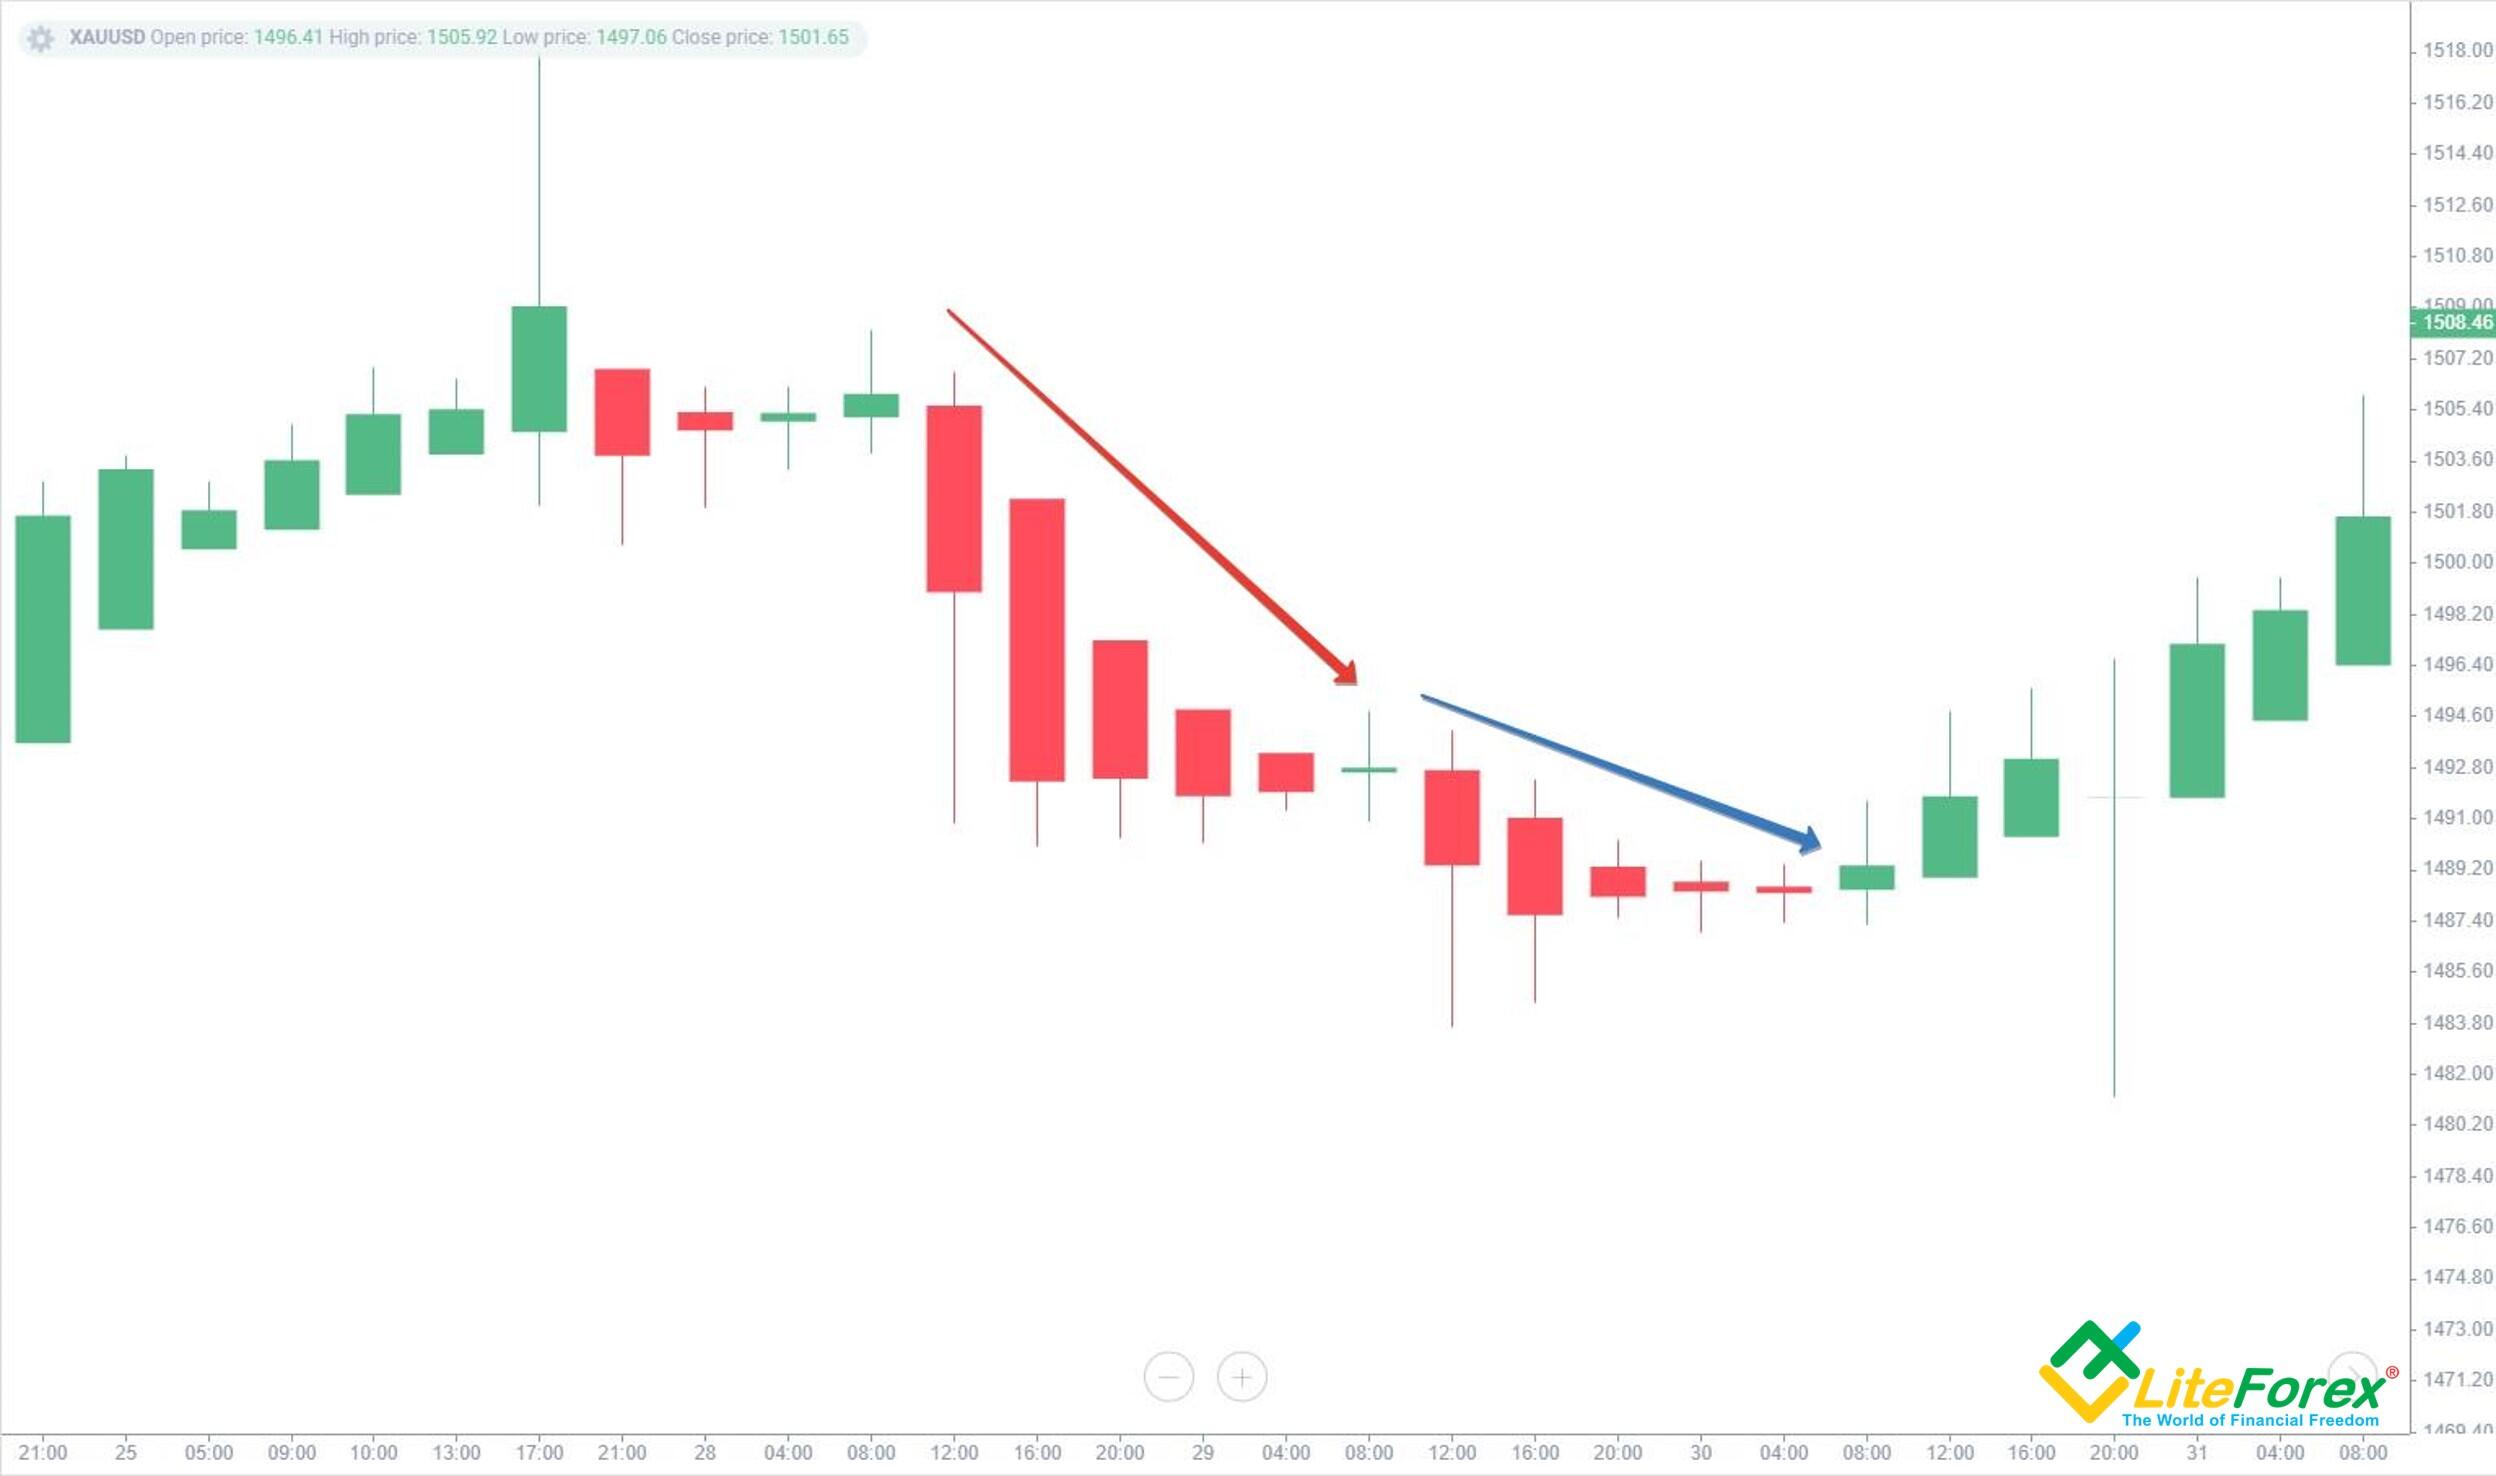
There is a strong downward trend at first (marked with a red arrow). Bars form without upper tails, and the narrowing begins just before a short-term correction. The next stage (marked with a blue arrow) shows an even more drastic narrowing that ends with the Doji.
Heiken-Ashi patterns
There are other patterns that help predict market behavior in the near future. Most often, Heiken-Ashi forms the so-called expanding triangles and wedges. Let's take a look at them.
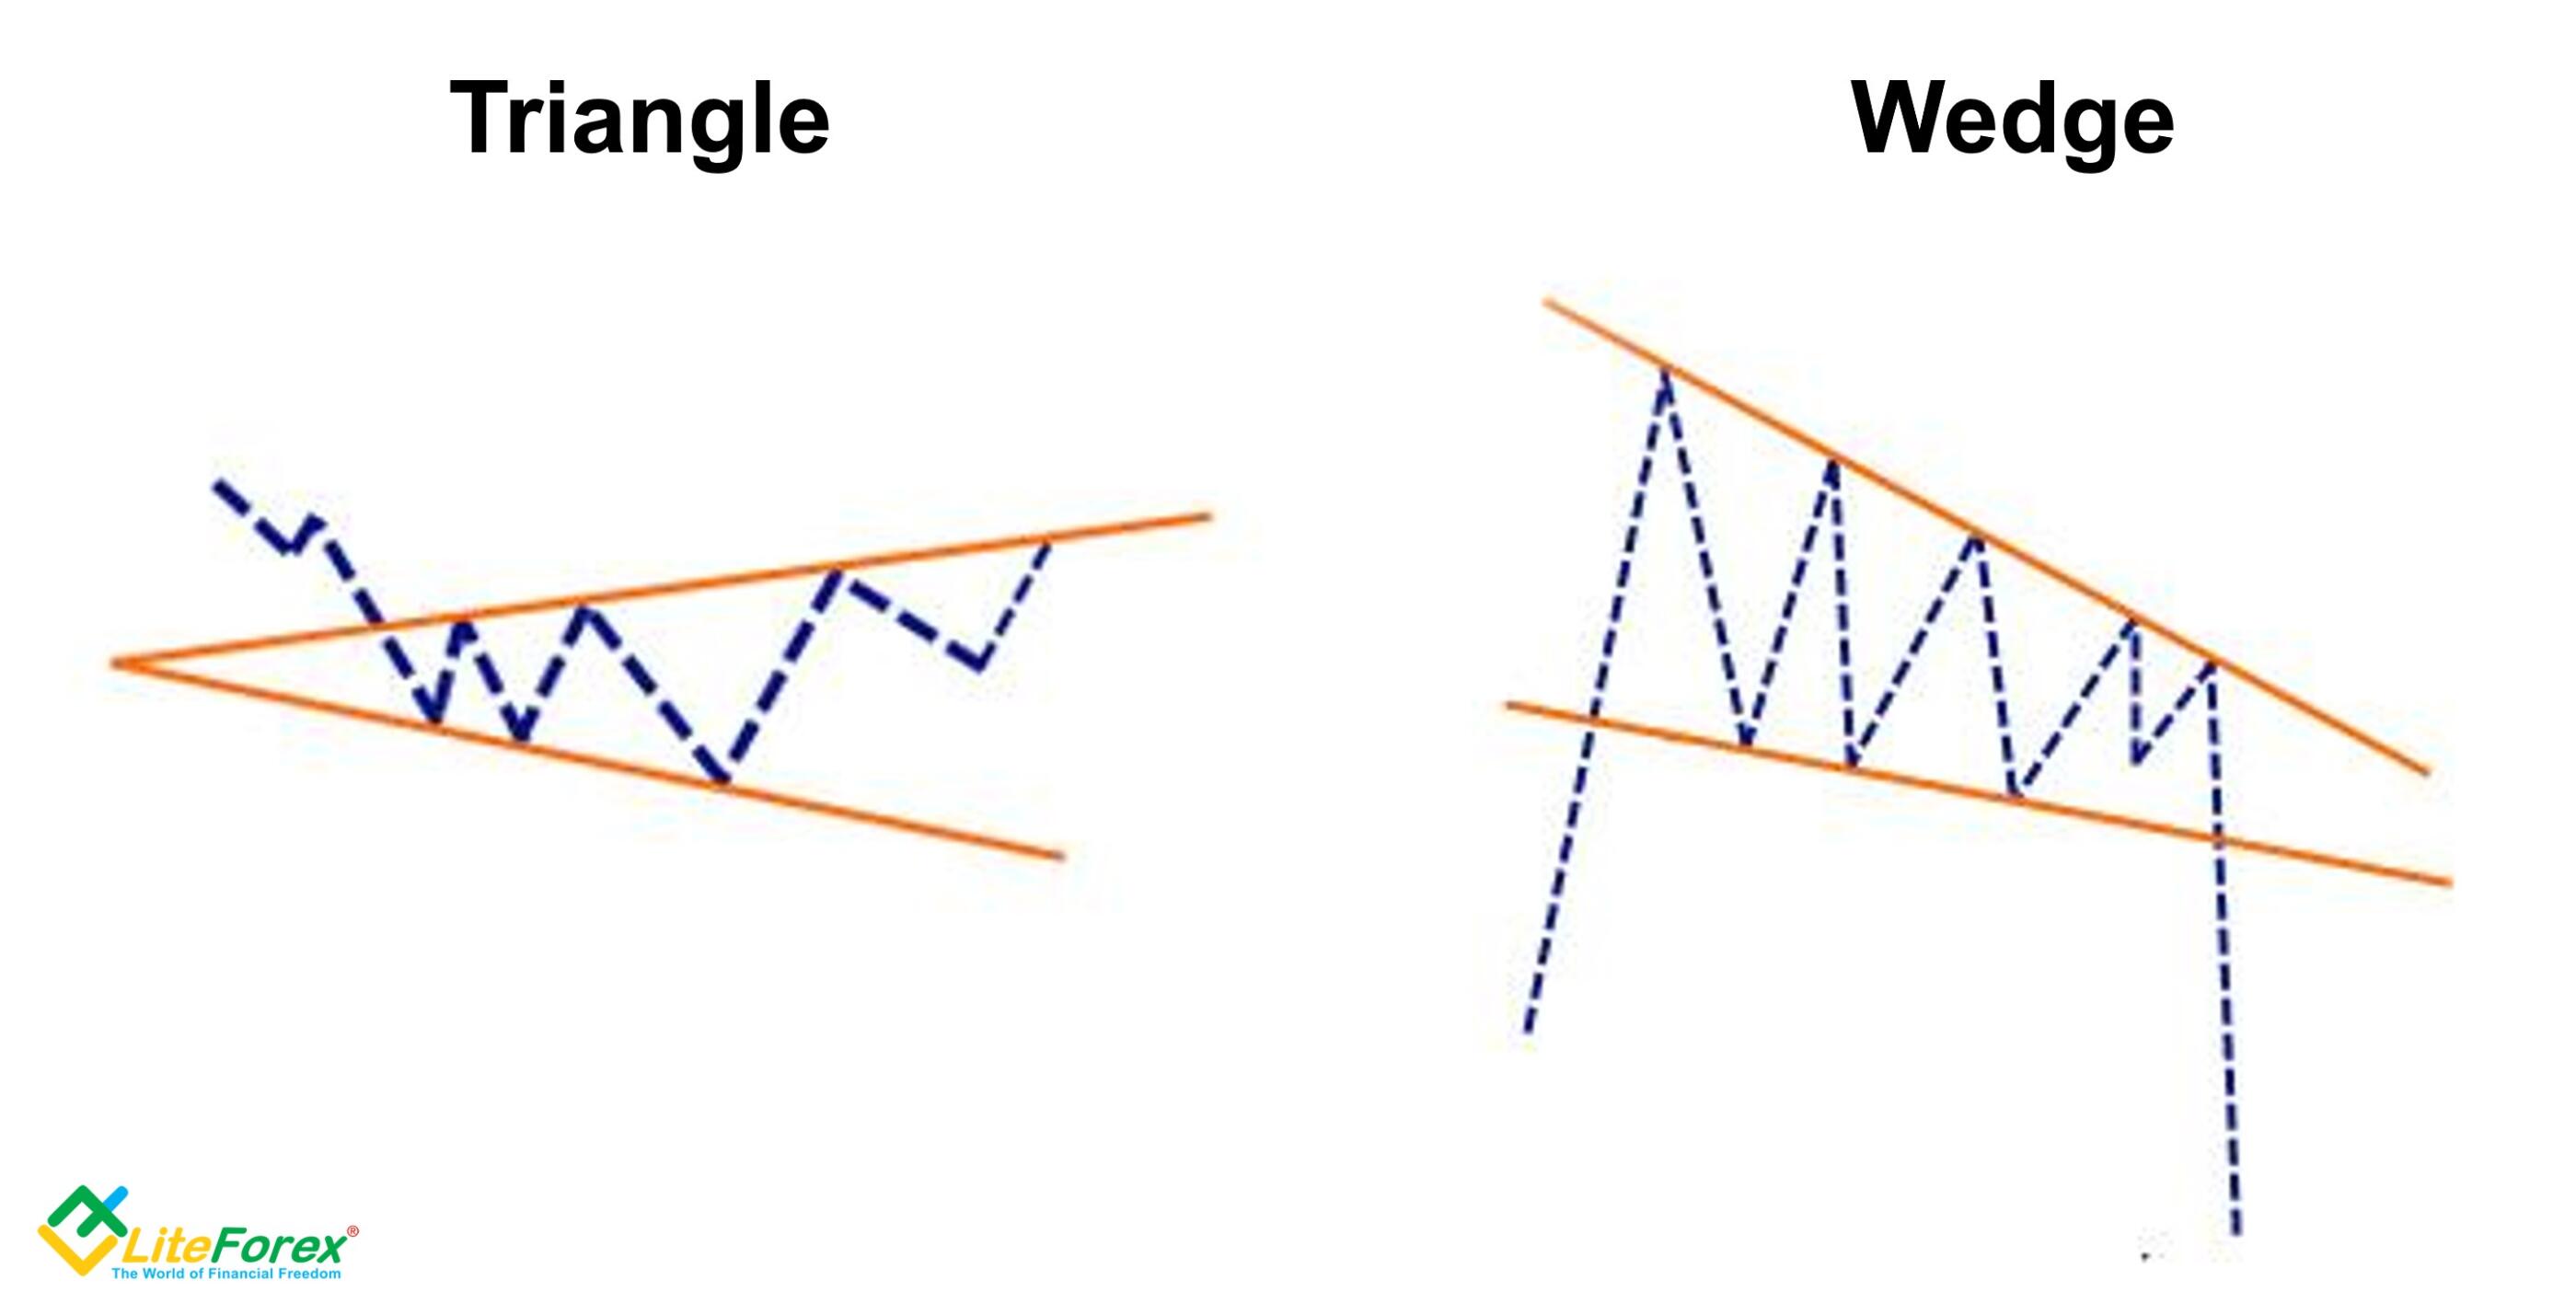
With the figure above the Heikin Ashi chart shows an example of different patterns.
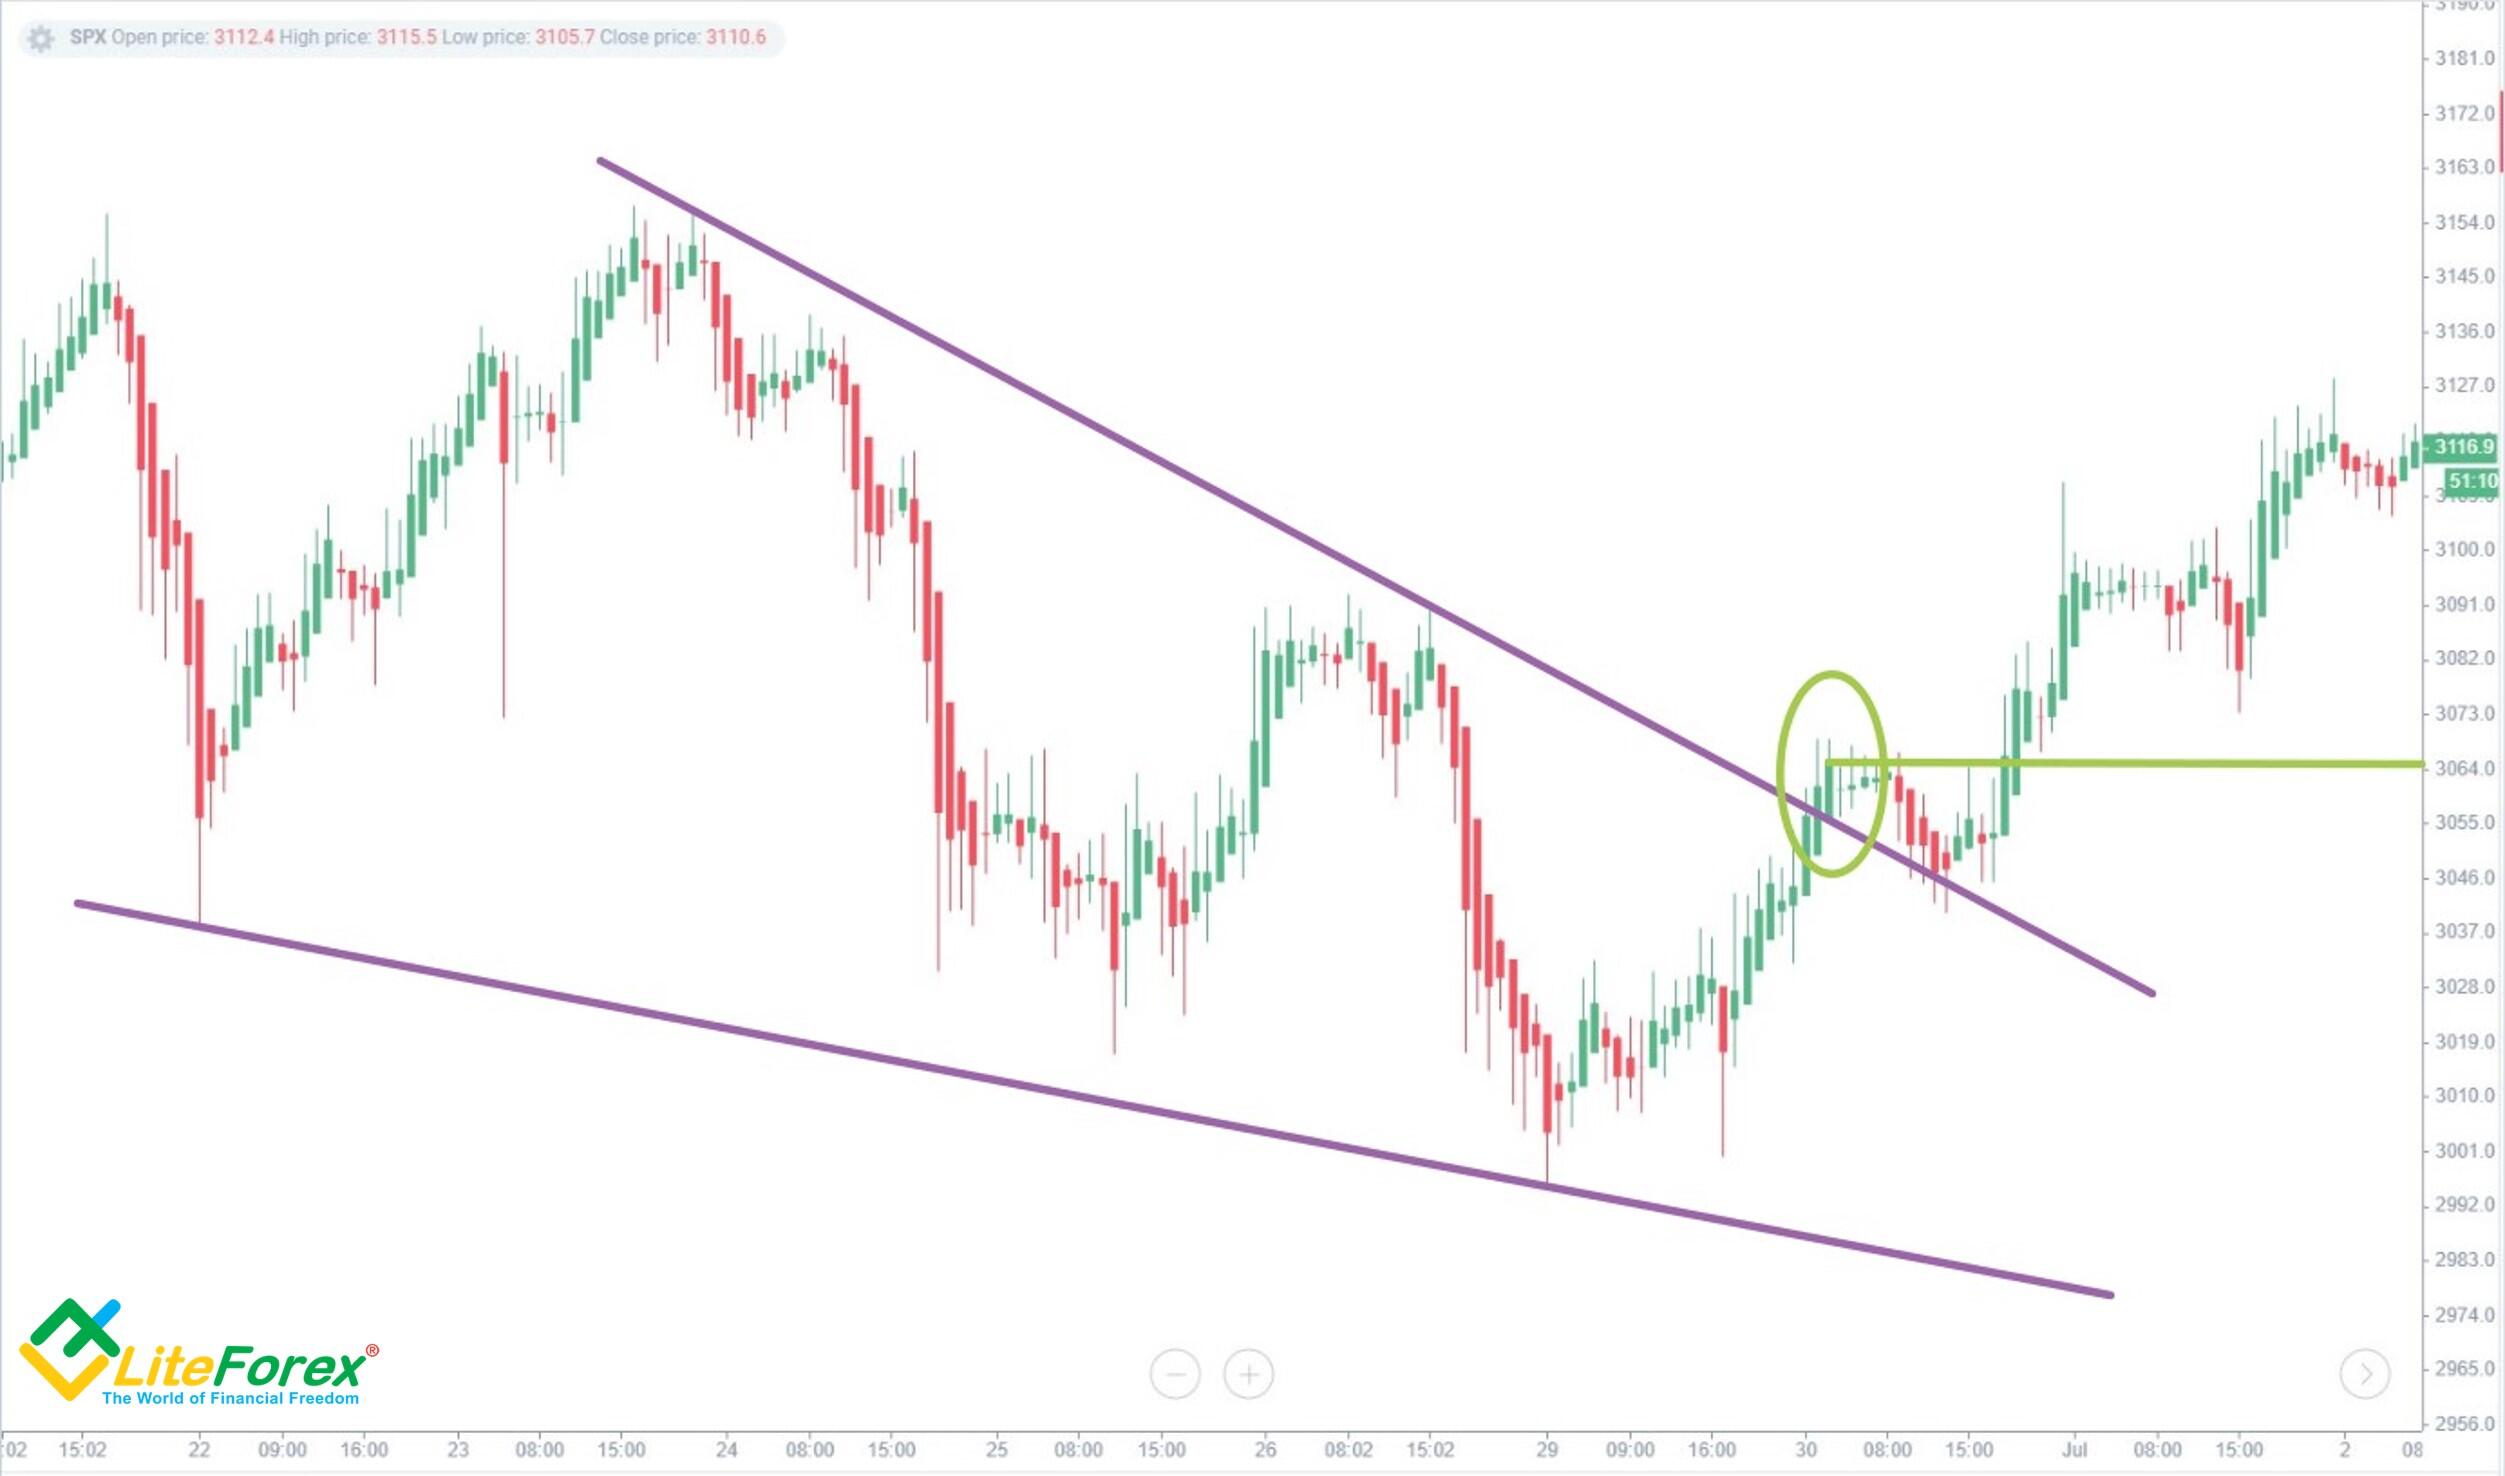
Triangles
This is the most common pattern in Heiken-Ashi. The borders are akin to support and resistance levels. If the upper border is broken during the previous uptrend, open a long position since the uptrend will continue. If the price breaks the lower border, expect a reversal, and open a short position. The opposite is true with a bearish trend.
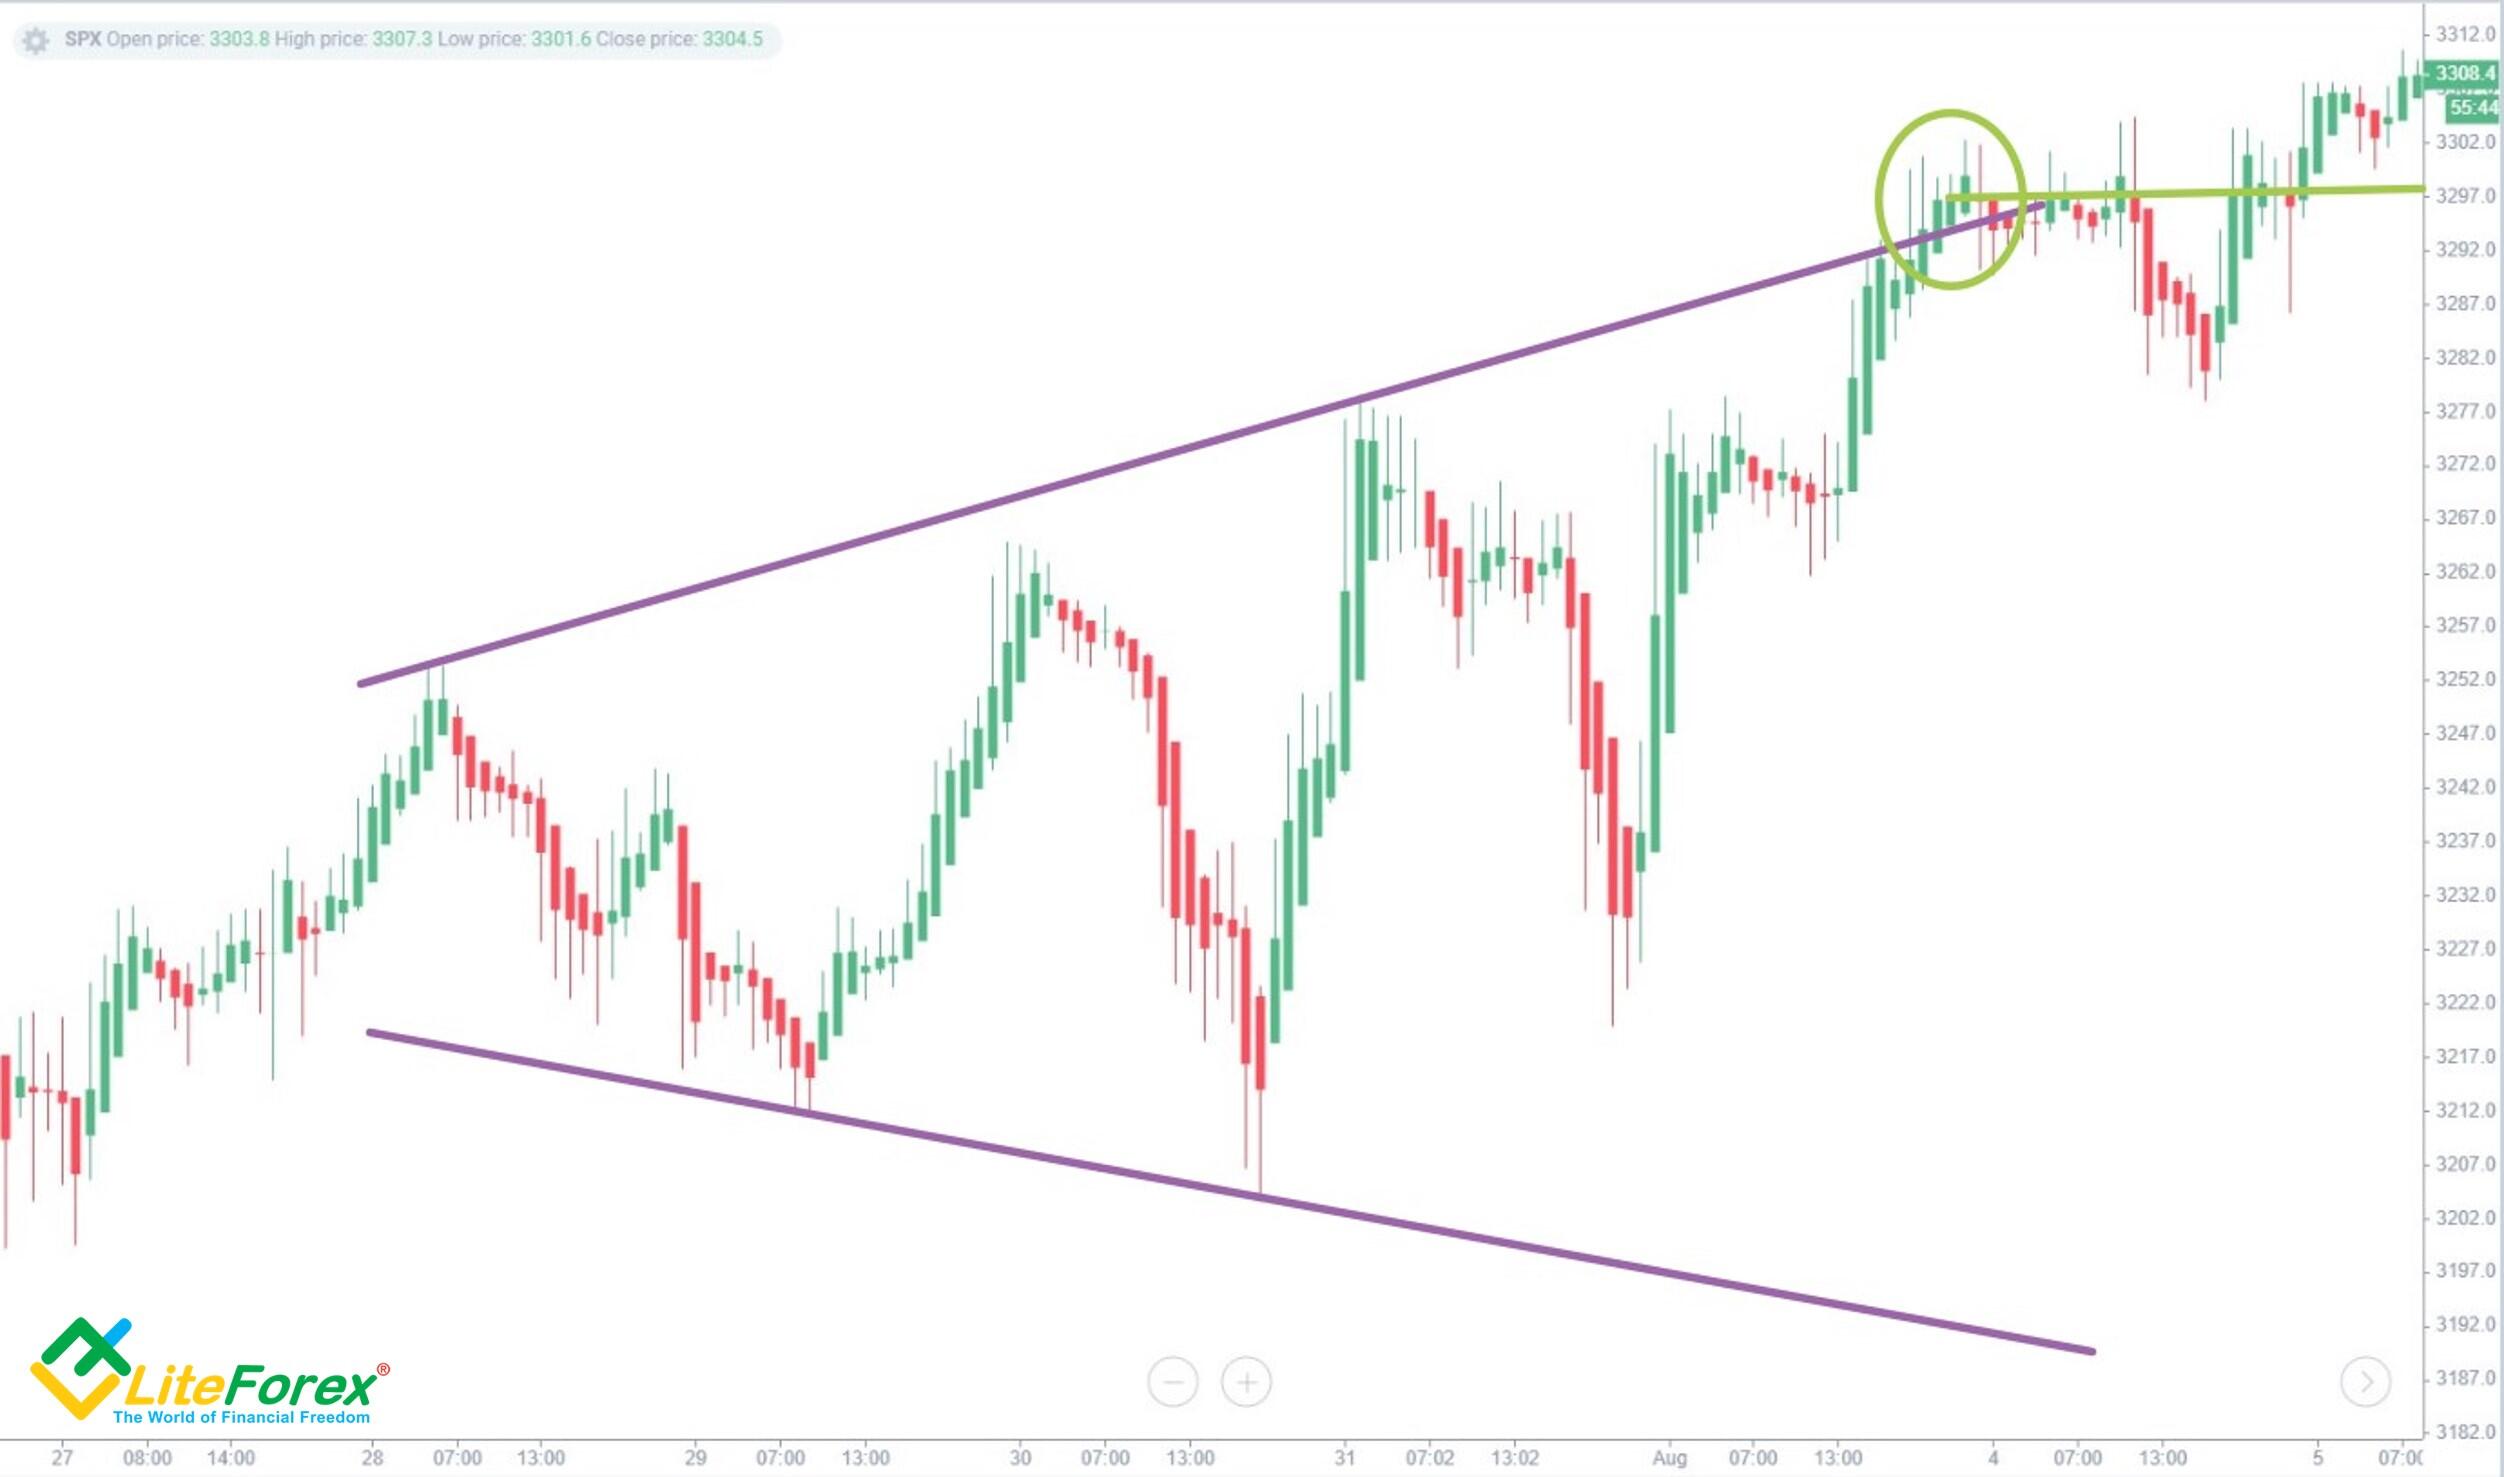
On the S&P500 chart, purple lines show the triangle boundaries. Later on, the price breaks the upper border (green circle). At this point, you can open a long position (green line).
Wedges
This pattern is also often seen on the Heiken-Ashi chart and looks like a narrowing triangle. There are two types:
Rising - moving upward, forming before a bearish trend.
Falling - moving downward and preceding an upward reversal.
A falling wedge is marked with purple lines. Therefore, expect an upward reversal. Our predictions are confirmed when the price breaks the upper border (green circle). At this point, the buying pressure starts to rise and you can open a buy trade (green line).
Heikin-Ashi Candlesticks Trend Analysis Example
Let's master the trend analysis using Heikin-Ashi traditional candlestick charts on the BTCUSD chart.
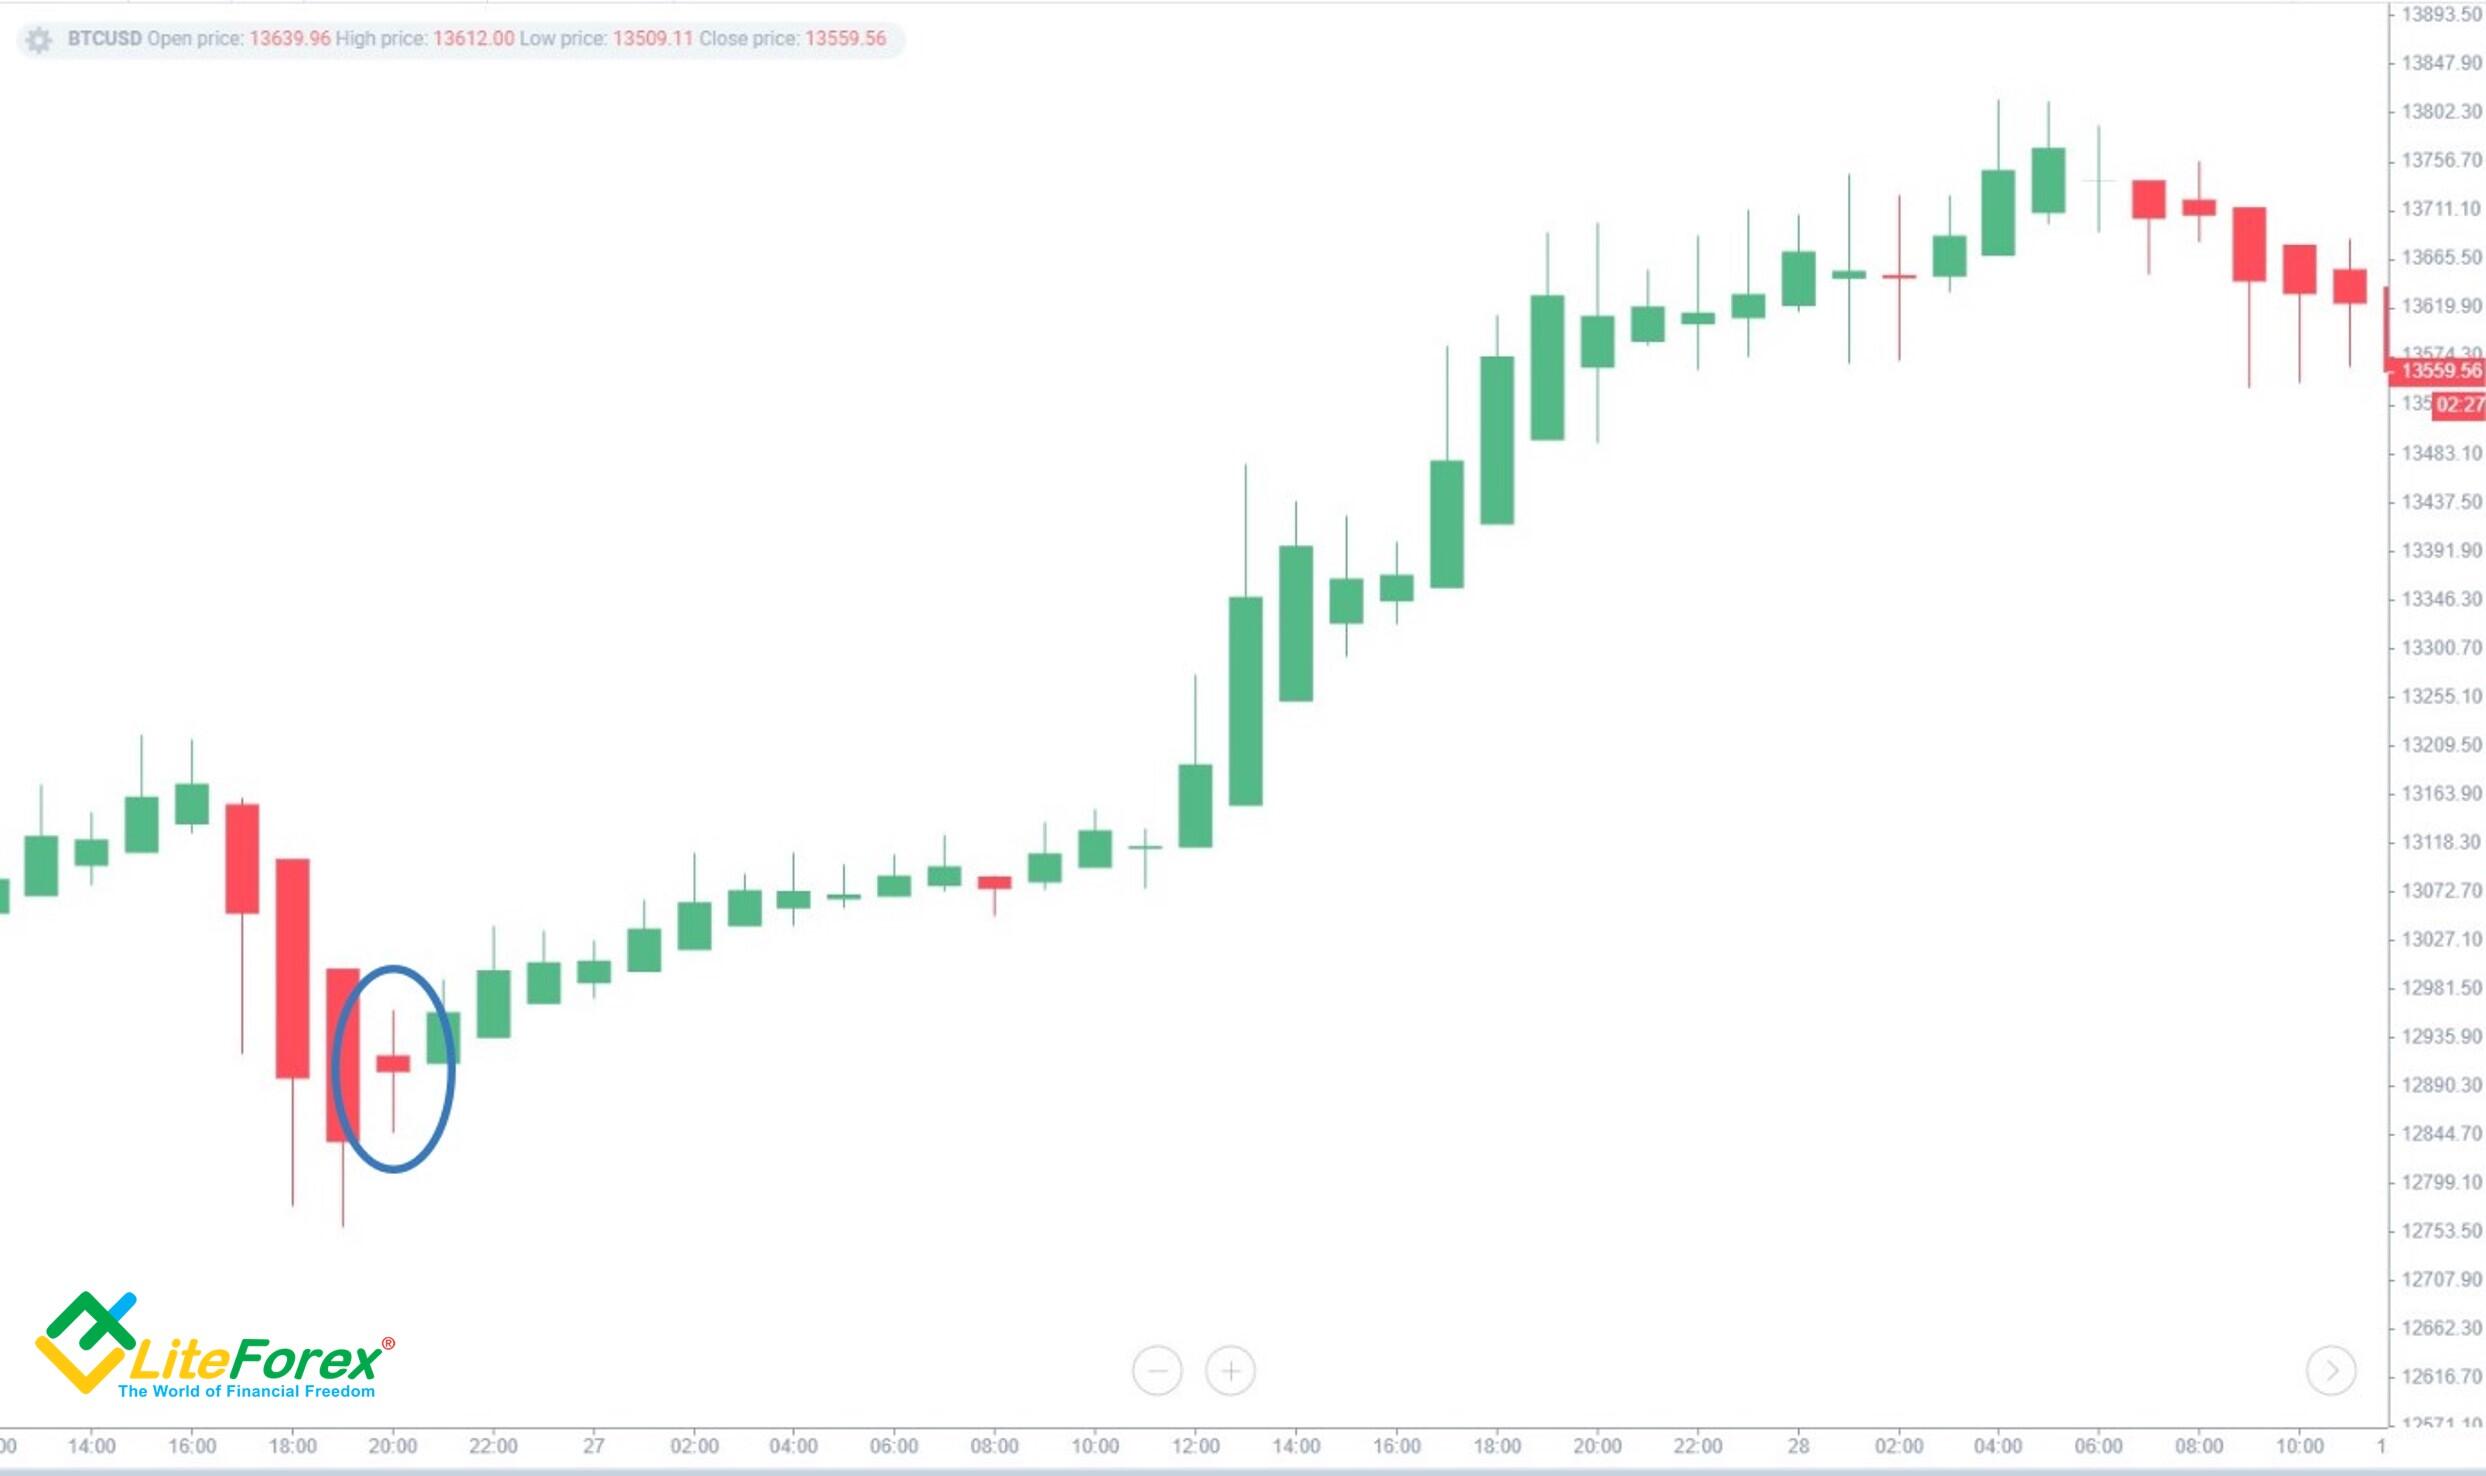
After a long-term bearish movement there is a high wave (blue oval) where the green concecutive colored candles begin. As described above, this is a reversal pattern. So, we can expect a strong uptrend.
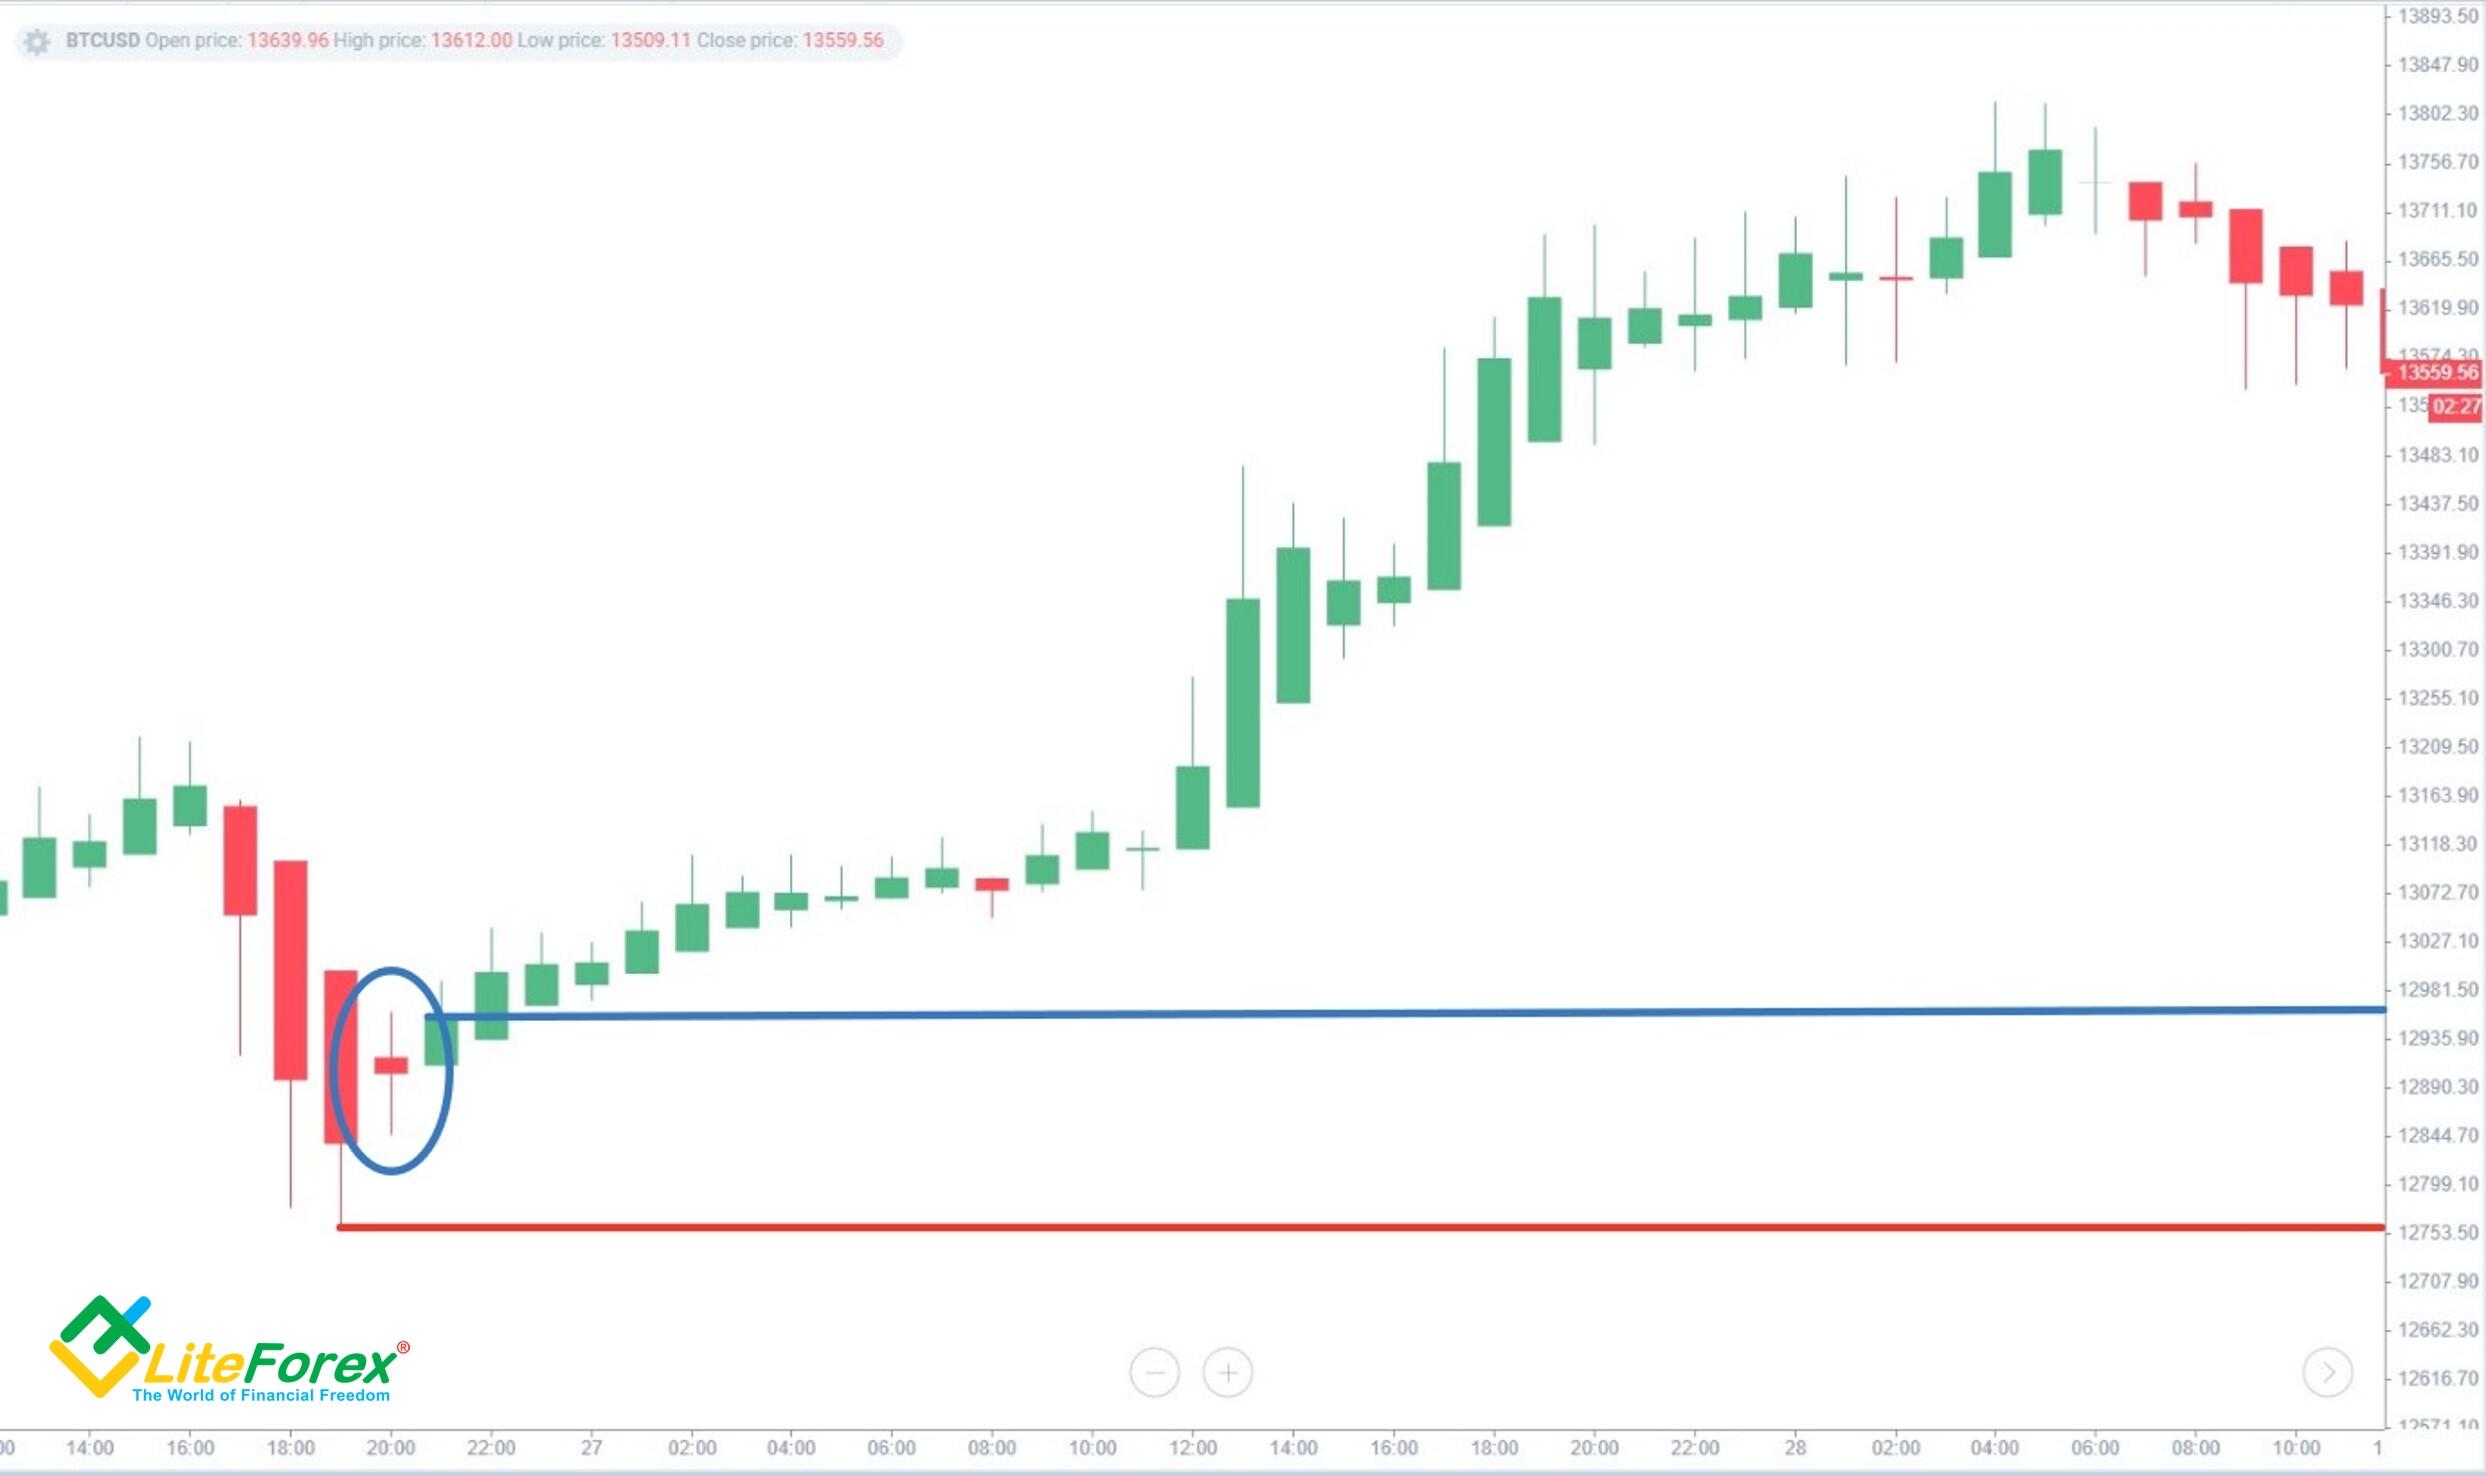
The next bar is rising, and its body is larger than the previous high. Therefore, our next step is to open a sale (blue line). Set the stop loss at the nearest local minimum (red line).
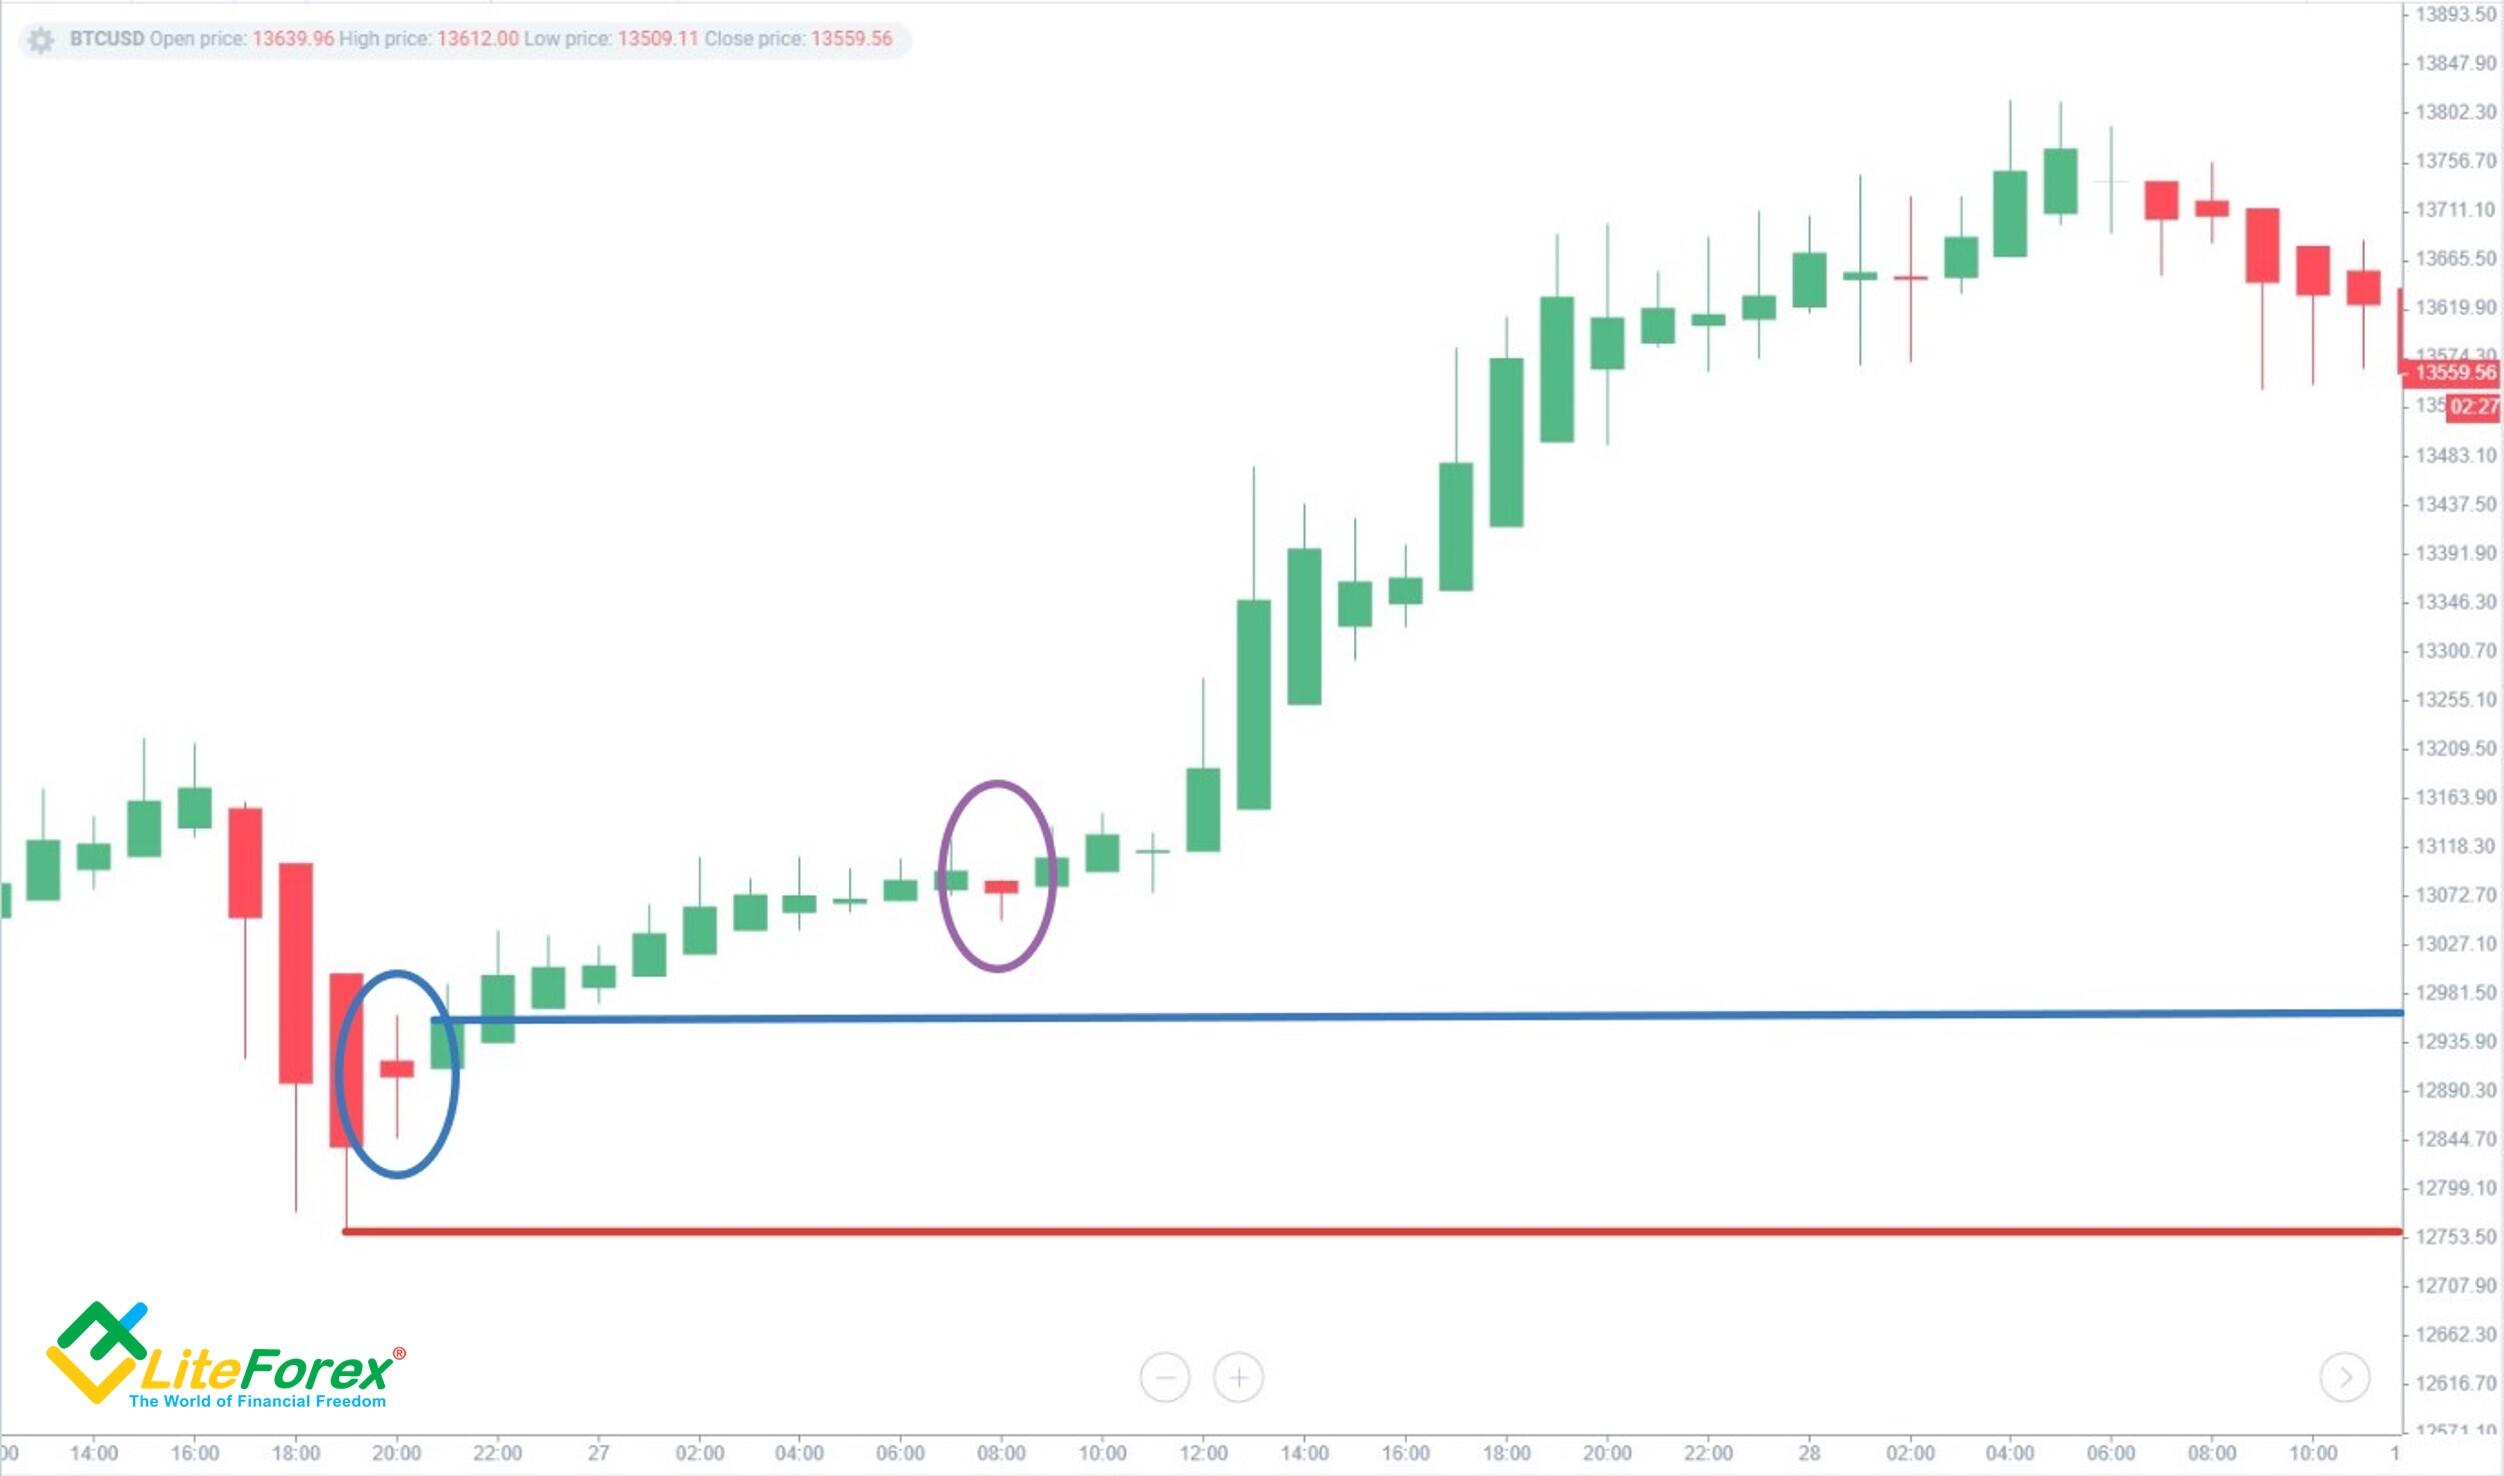
After a short-term upward movement, the price goes down. But we don’t see any signals of a reversal, and the bar itself doesn’t have a large range (purple circle). Instead of closing, monitor the market because the drop in the Heikin-Ashi chart may be a short-term correction.
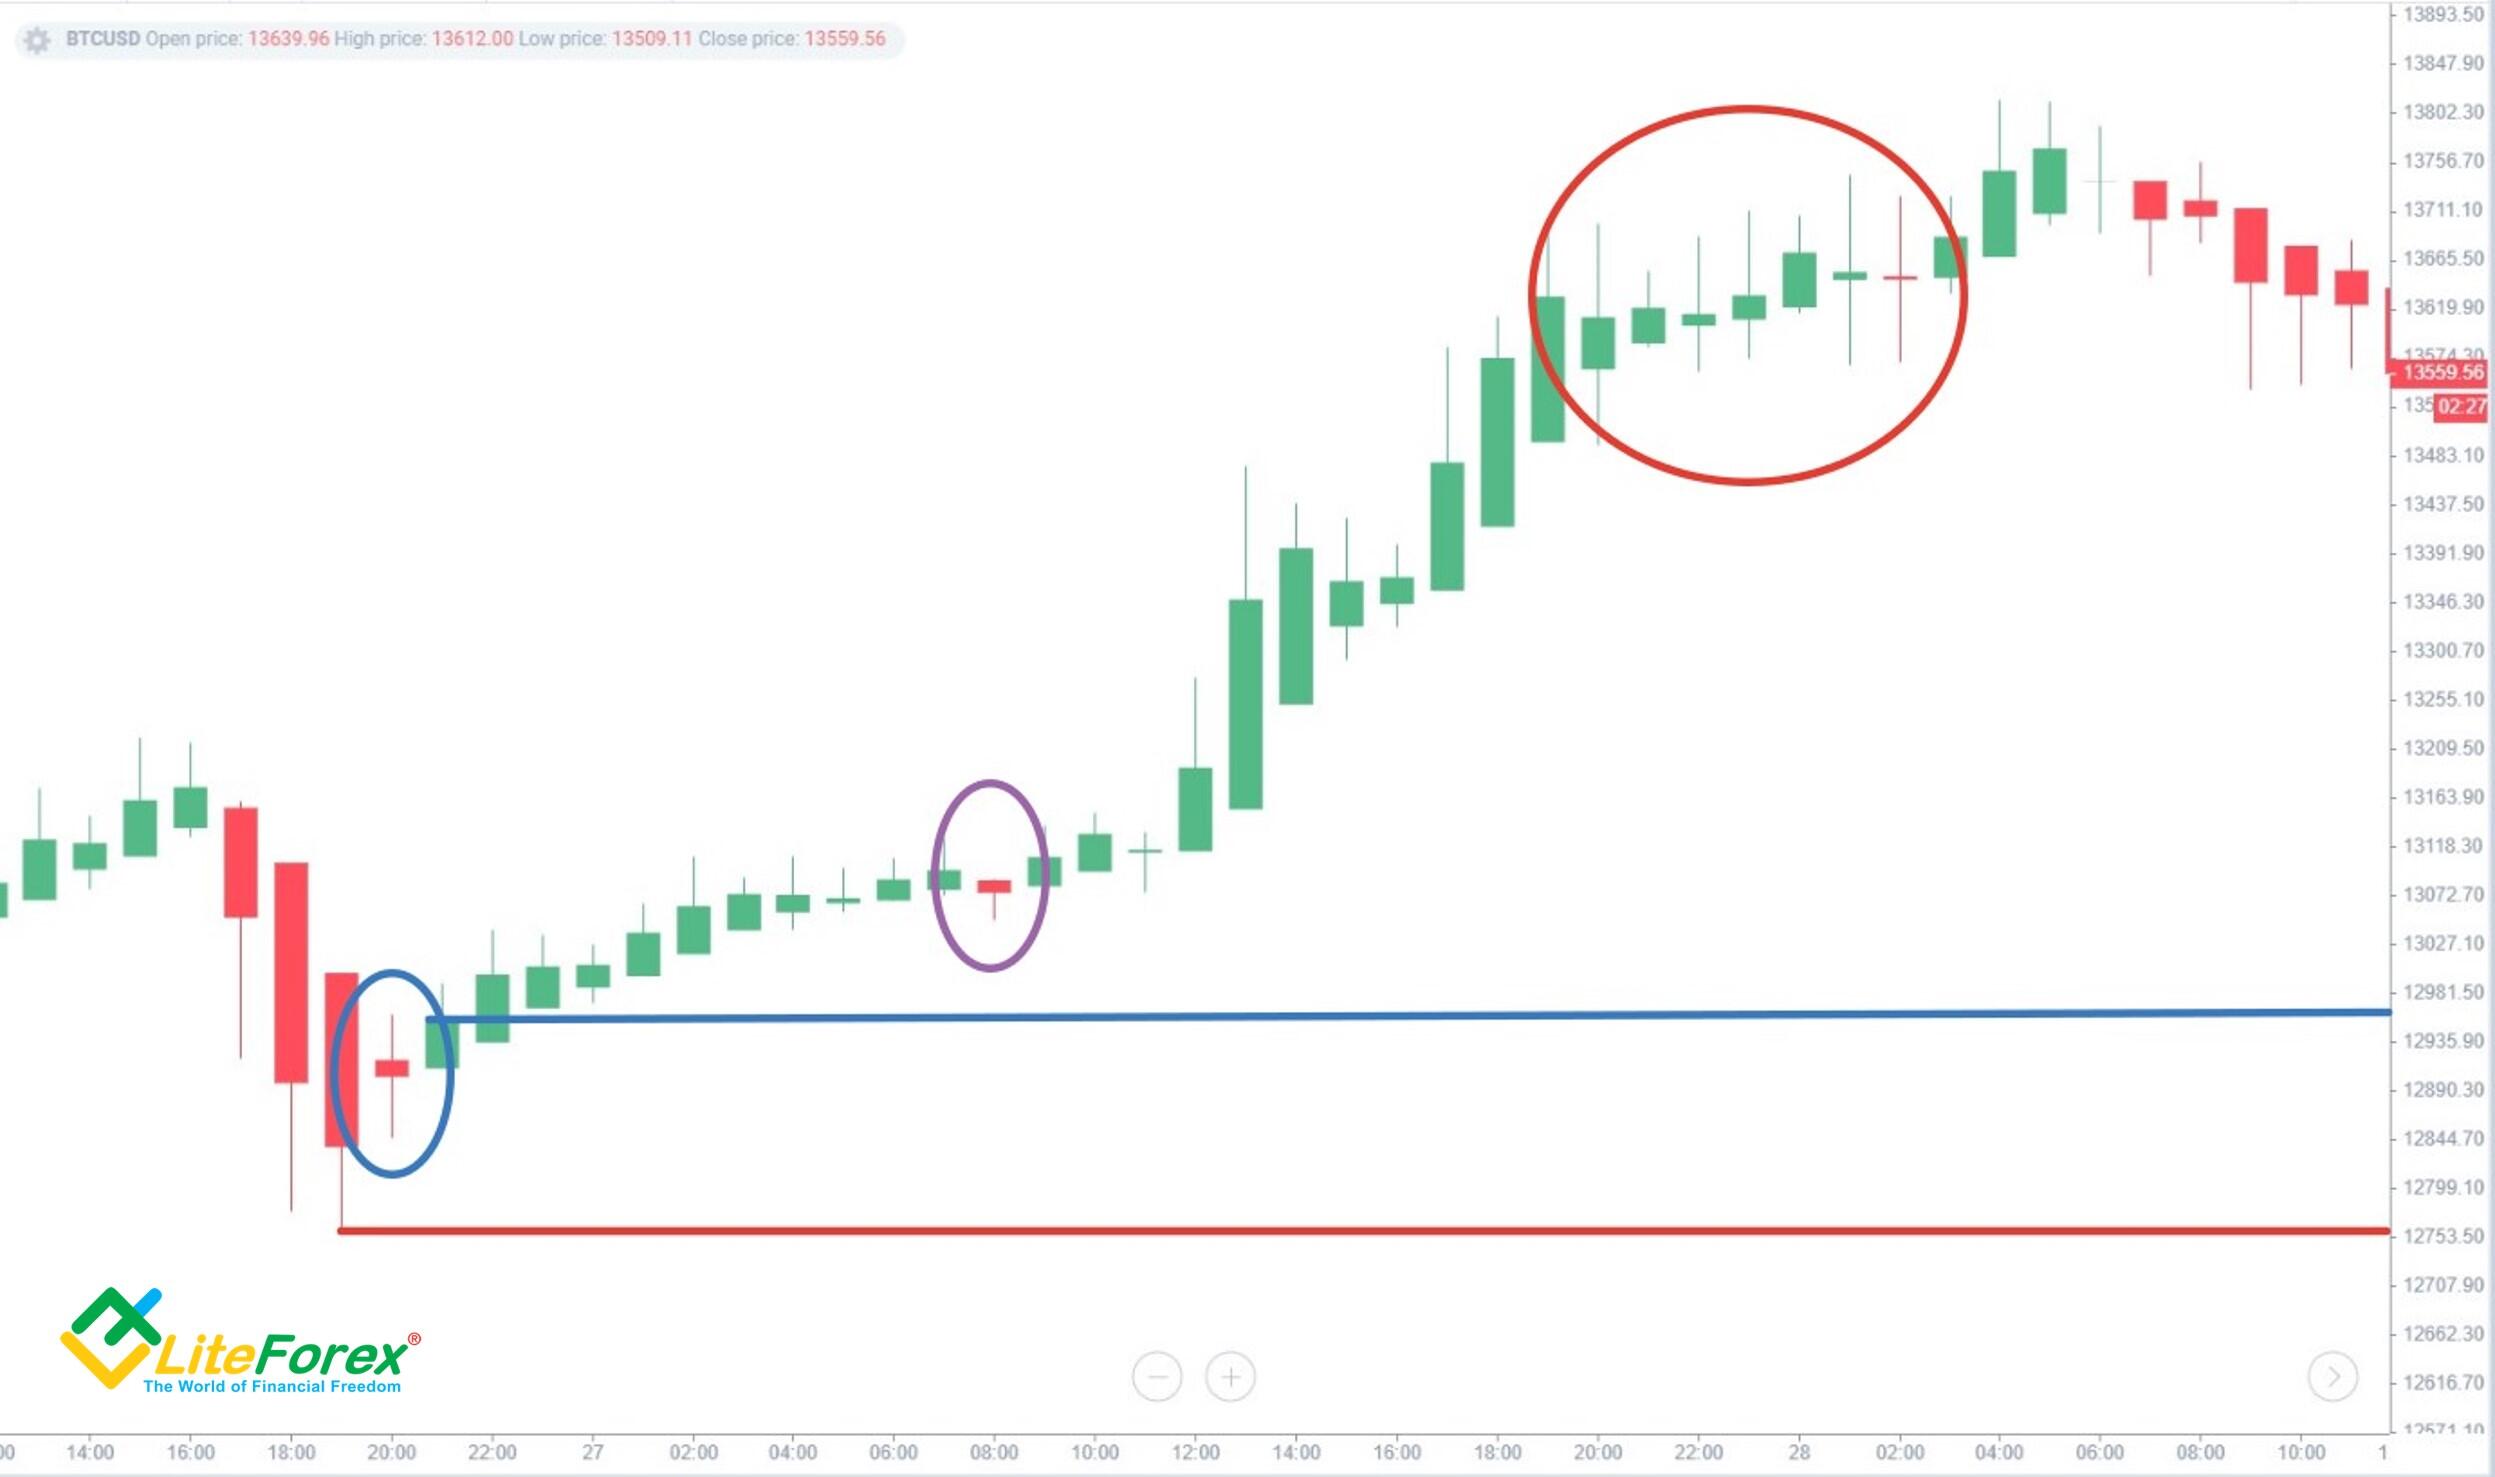
Pay attention to the area marked with a red circle. Here, almost every Heiken-Ashi candlesticks has a noticeable lower tail. This could be a sign of the upward movement ending.
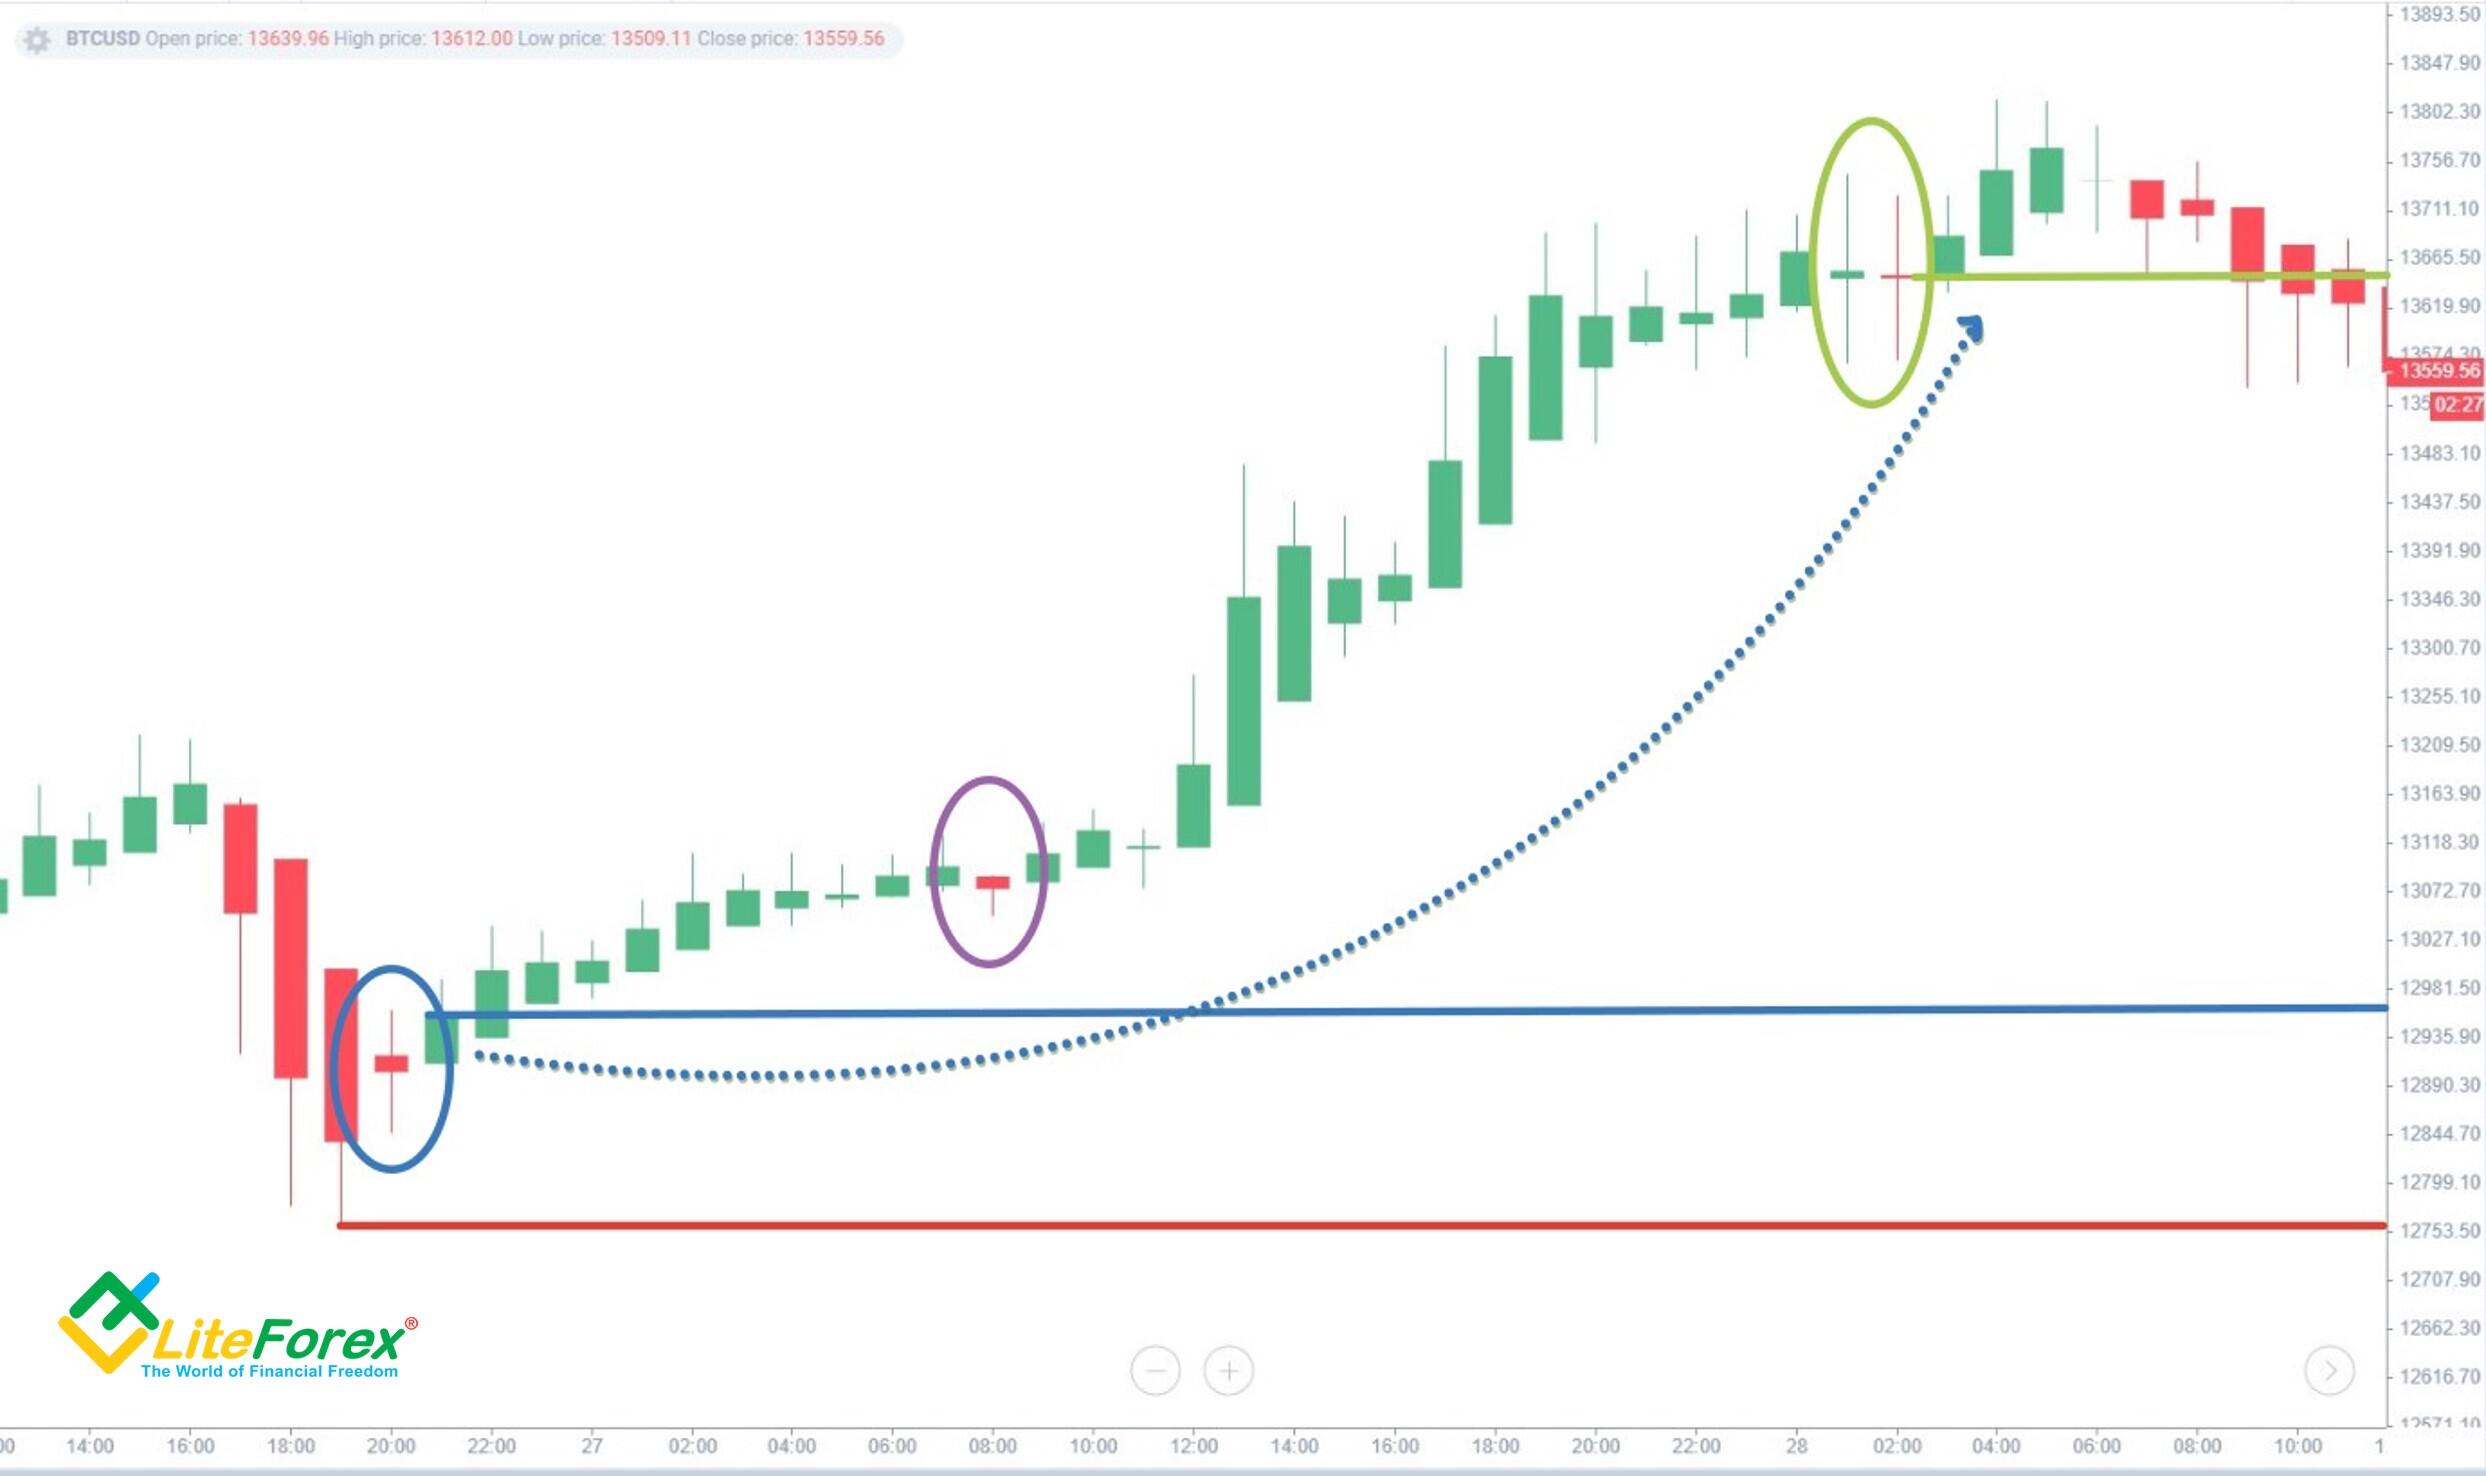
A bit later, there is a powerful reversal signal - a Double Doji (green oval). Two consecutive bars have a small body surrounded by bigger Heikin Ashi candlesticks and long lower and upper shadows. At the close of the red candle, exit the market with a profit (green line).
How to Use the Heiken-Ashi Indicator in Forex Trading
Now, let's look at Heiken-Ashi candlestick chart on Forex trading. Any currency pairs that show a long-term trend movement can be profitable instruments.
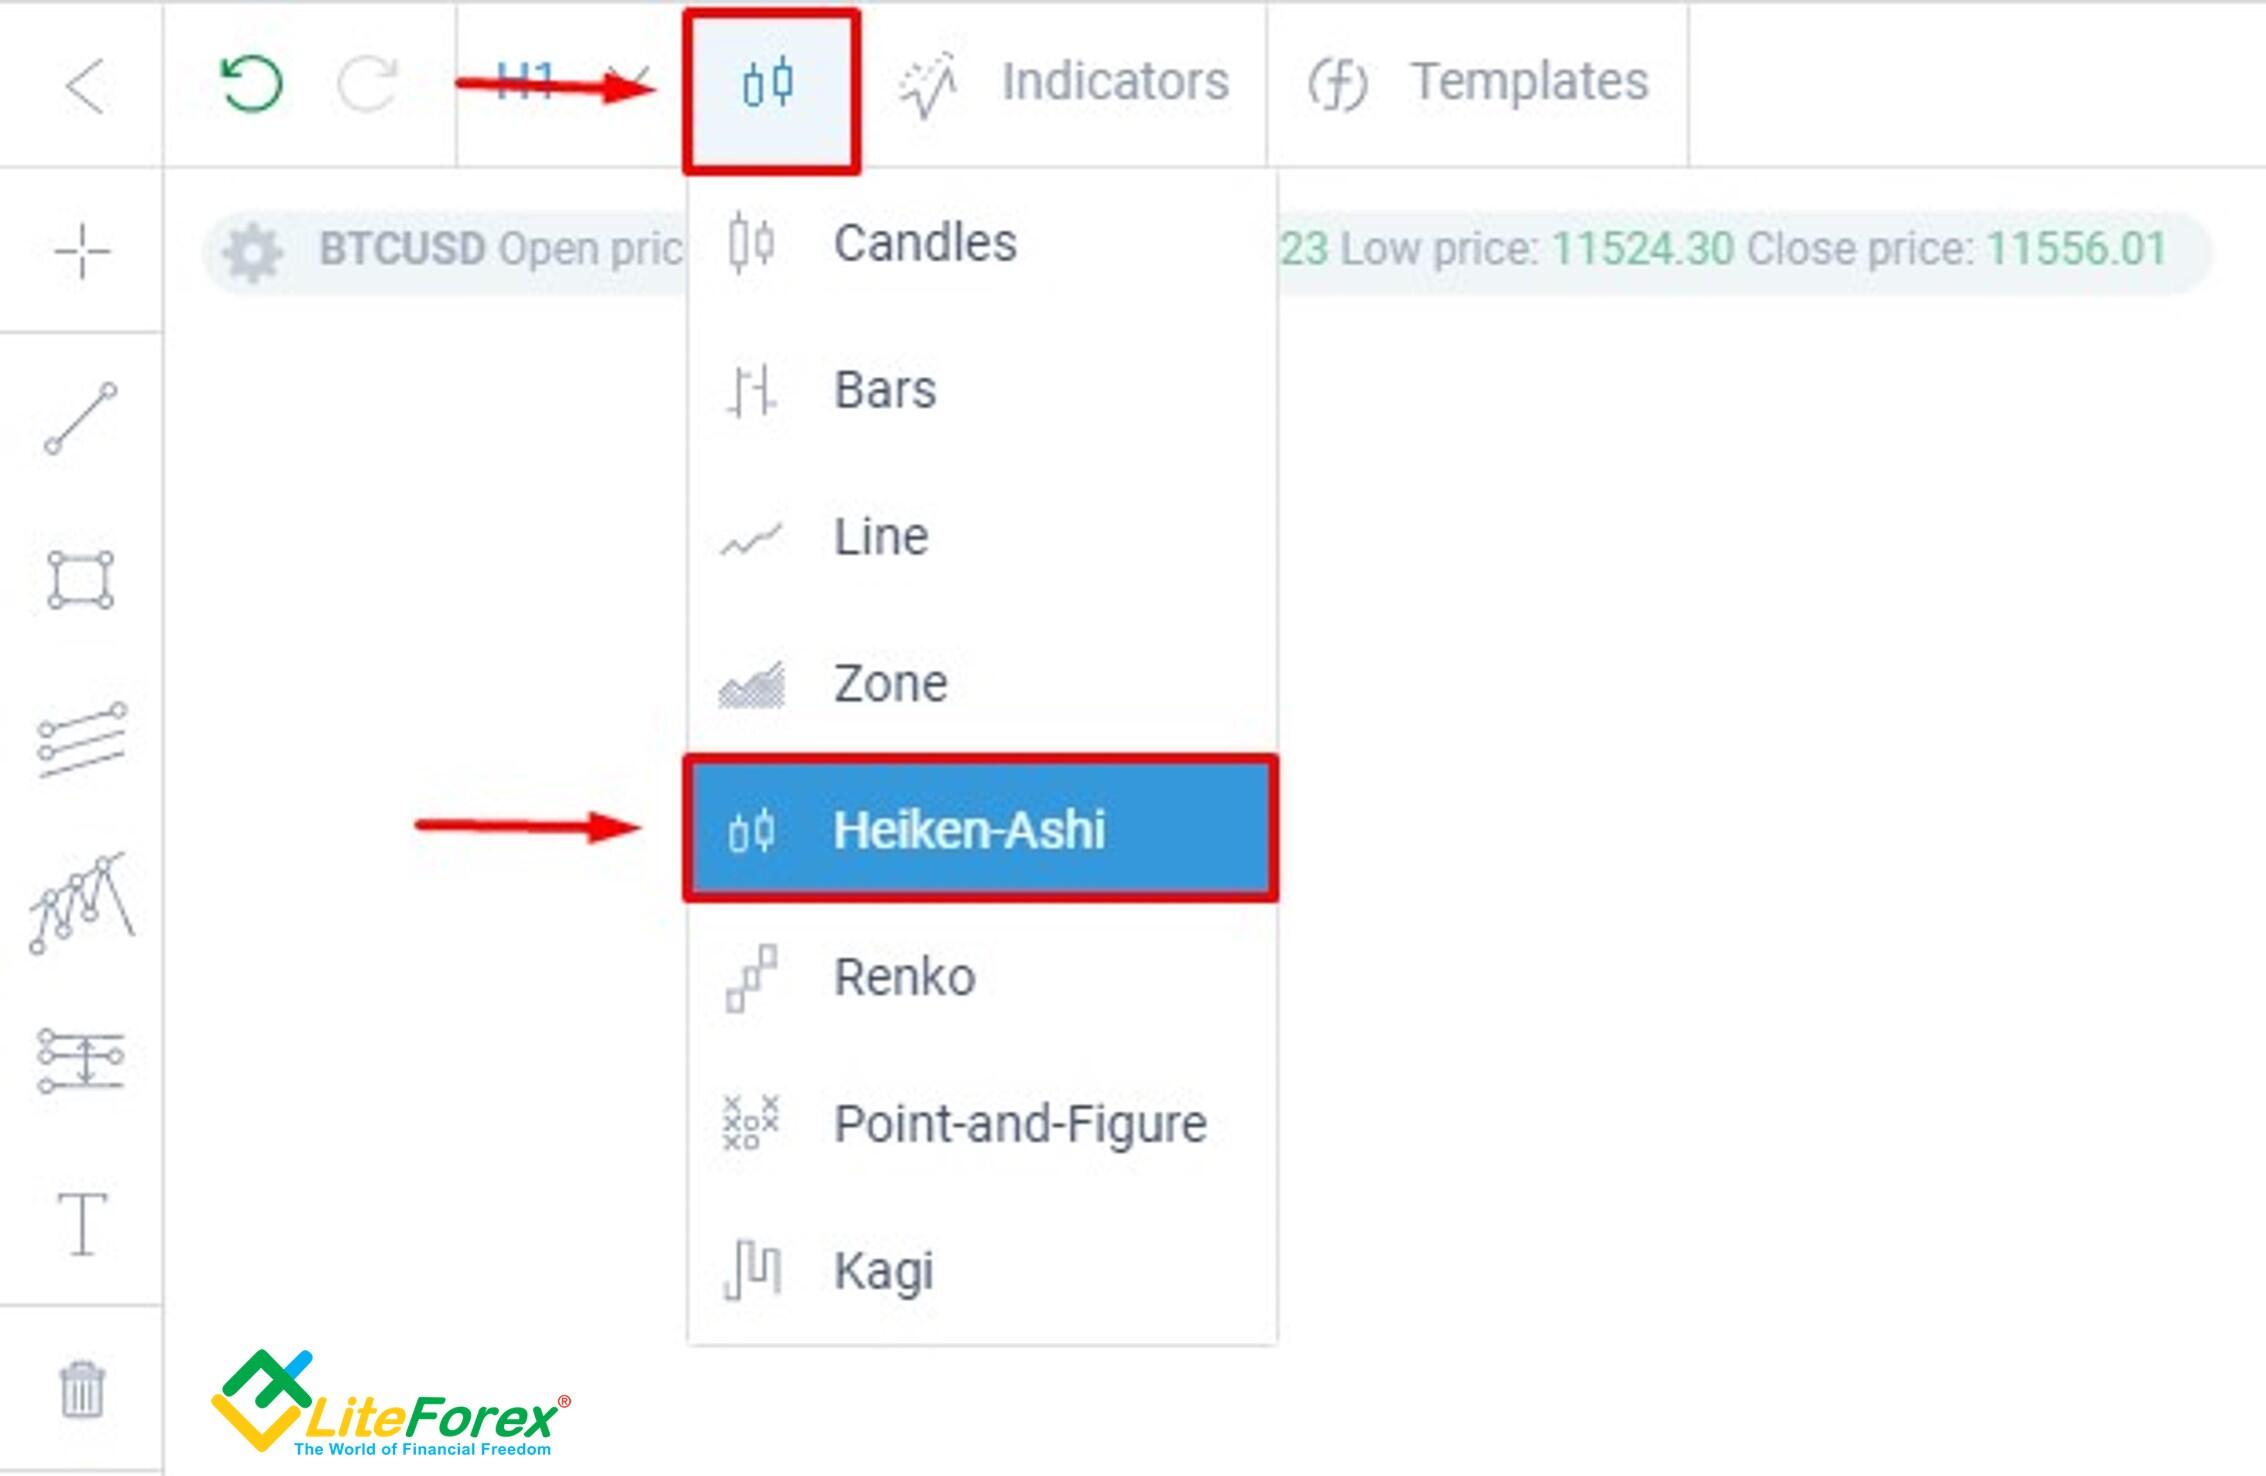
To use it in the LiteFinance online terminal, click on the candlestick icon and select "Heiken-Ashi". In MetaTrader, the process is about the same. Let me tell you more about adding an indicator to MT4.
The goal of Heiken-Ashi trading is to identify long-term, stable trends and search for chart patterns on HA-bars. Due to lesser price noise on the Heikin-Ashi traditional charts, it’s much easier than on Japanese Ashi candlesticks. At the same time, remember that stop loss and take profit shouldn’t be placed based on the ashi candlesticks’ extremum. For this, I recommend using classic bars or Japanese candlesticks to avoid losing money rapidly from a wrong exit signal.
Heikin-Ashi Trading Strategy
Let’s examine the first Heiken-Ashi strategy, which involves a step-by-step market analysis:
Determine stable directional movement;
Detect a change in the movement direction;
Confirm a reversal using patterns;
Open a position;
Set a stop loss;
Set a take profit.
Let's take a closer look at the strategy using the GBPUSD currency pair.
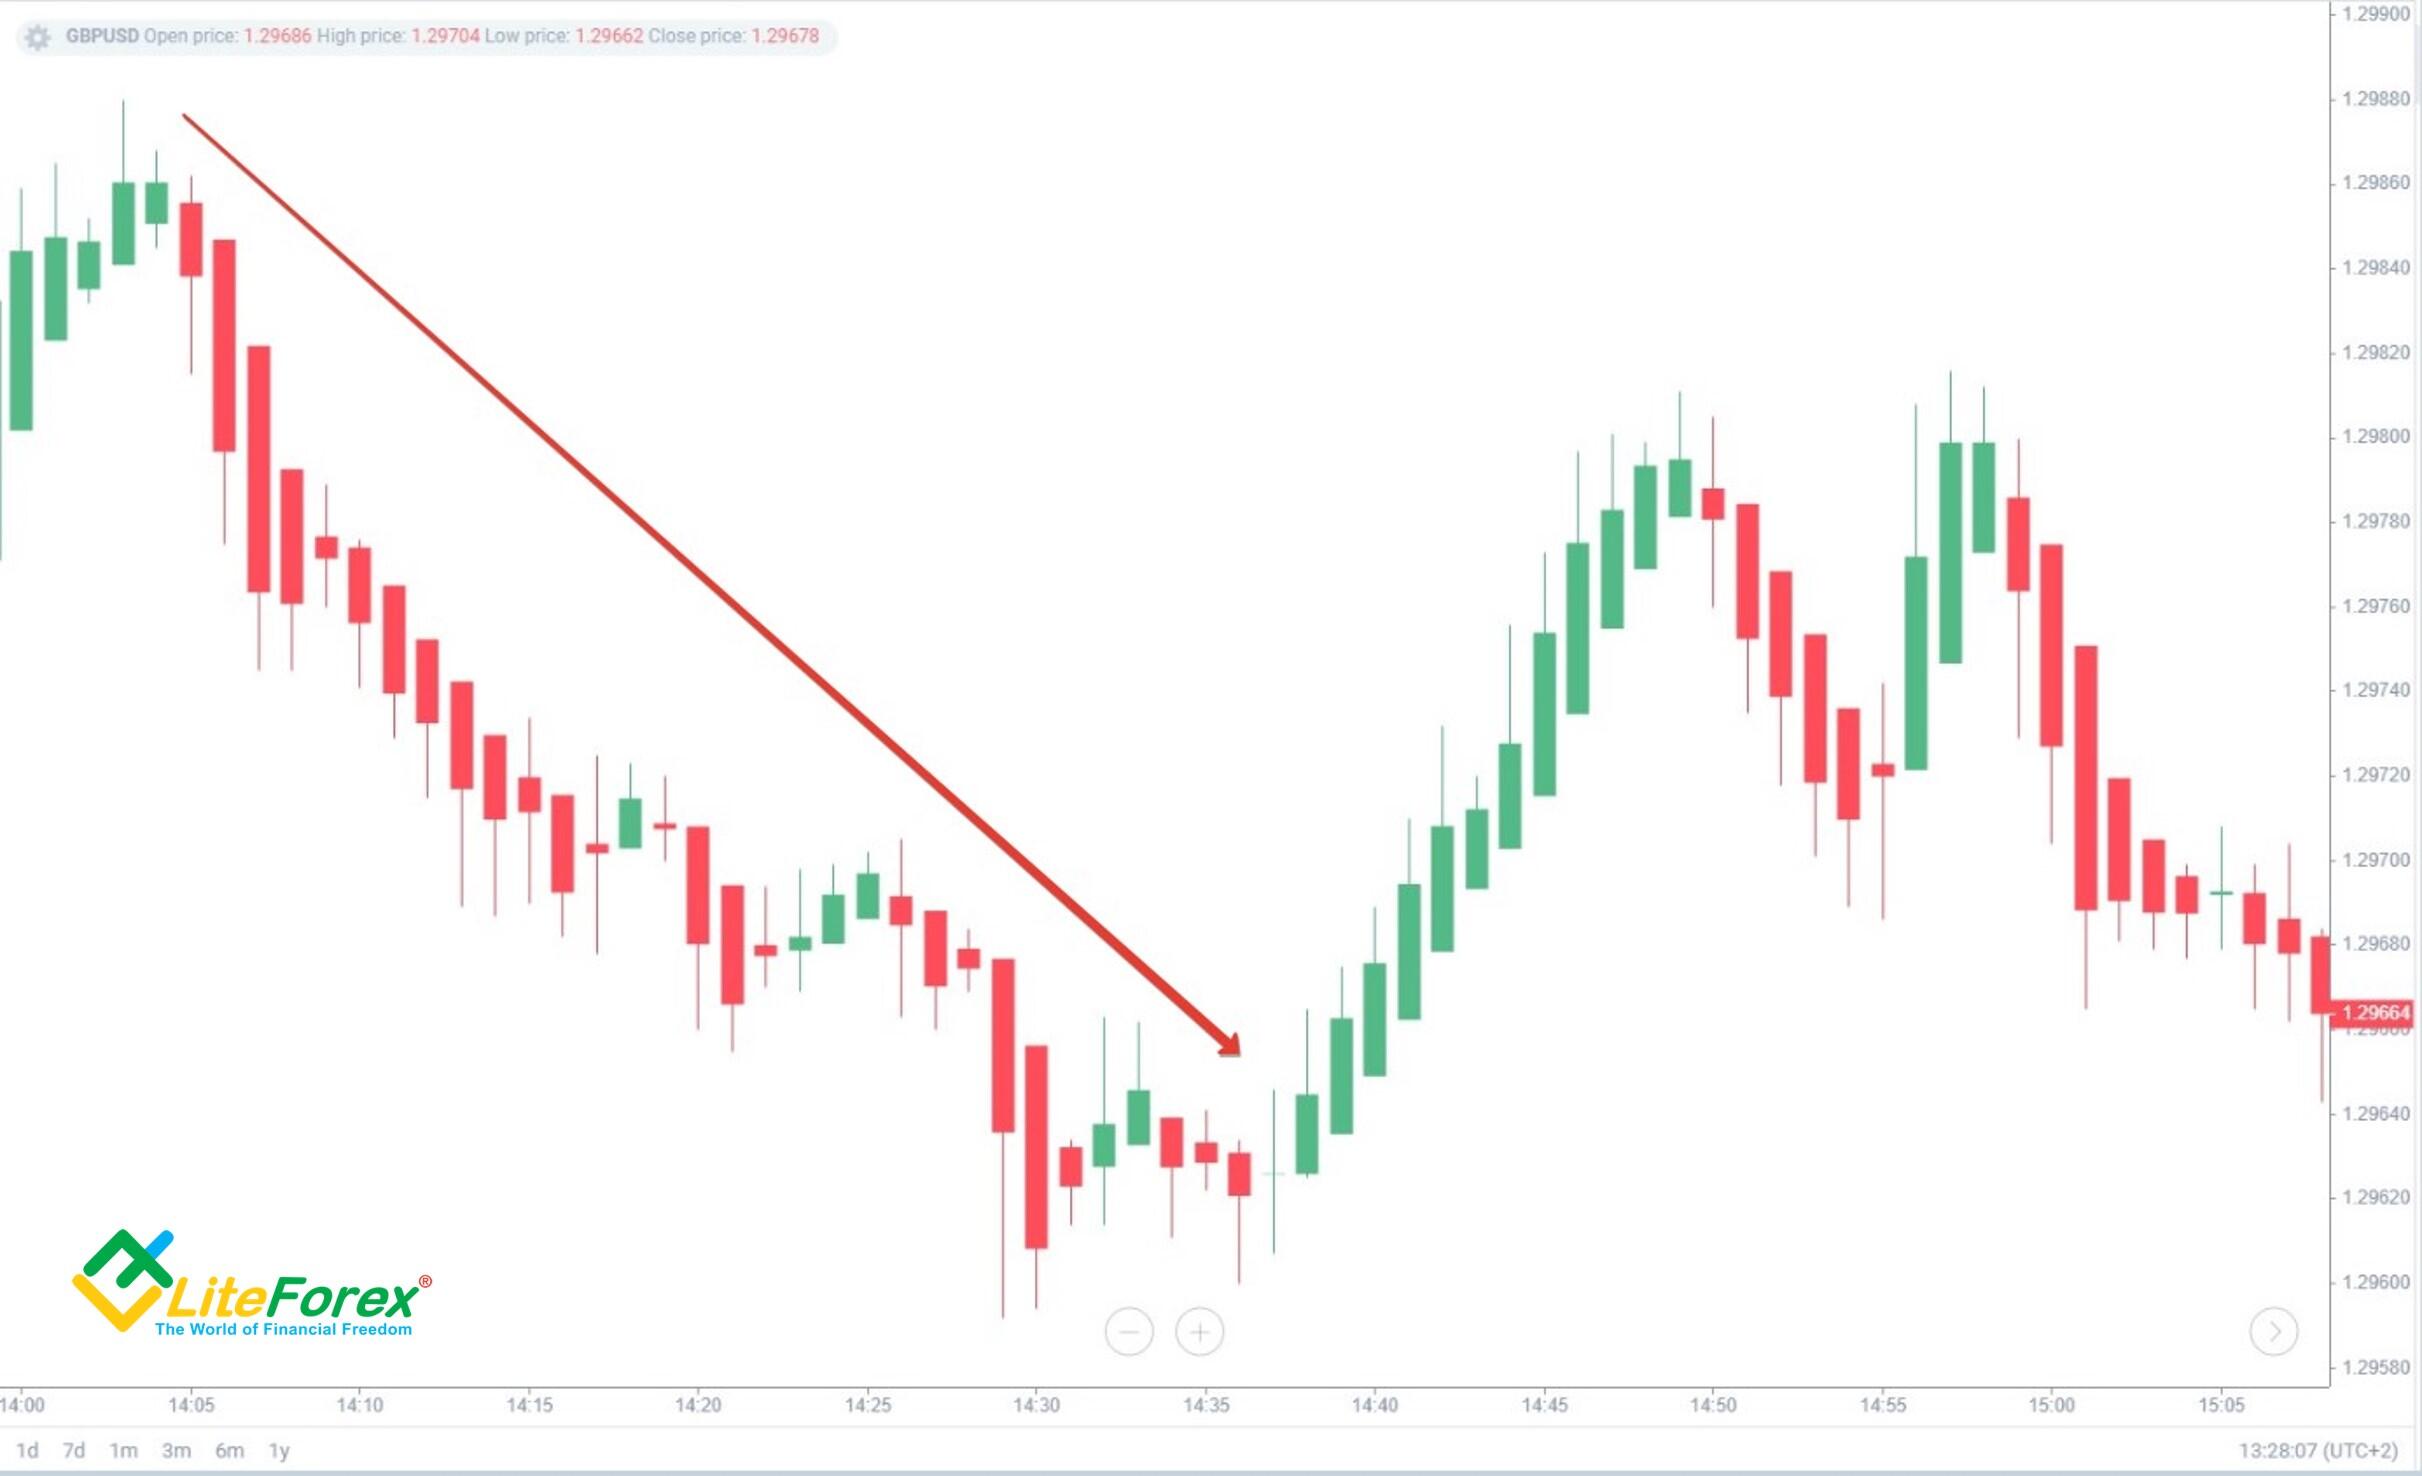
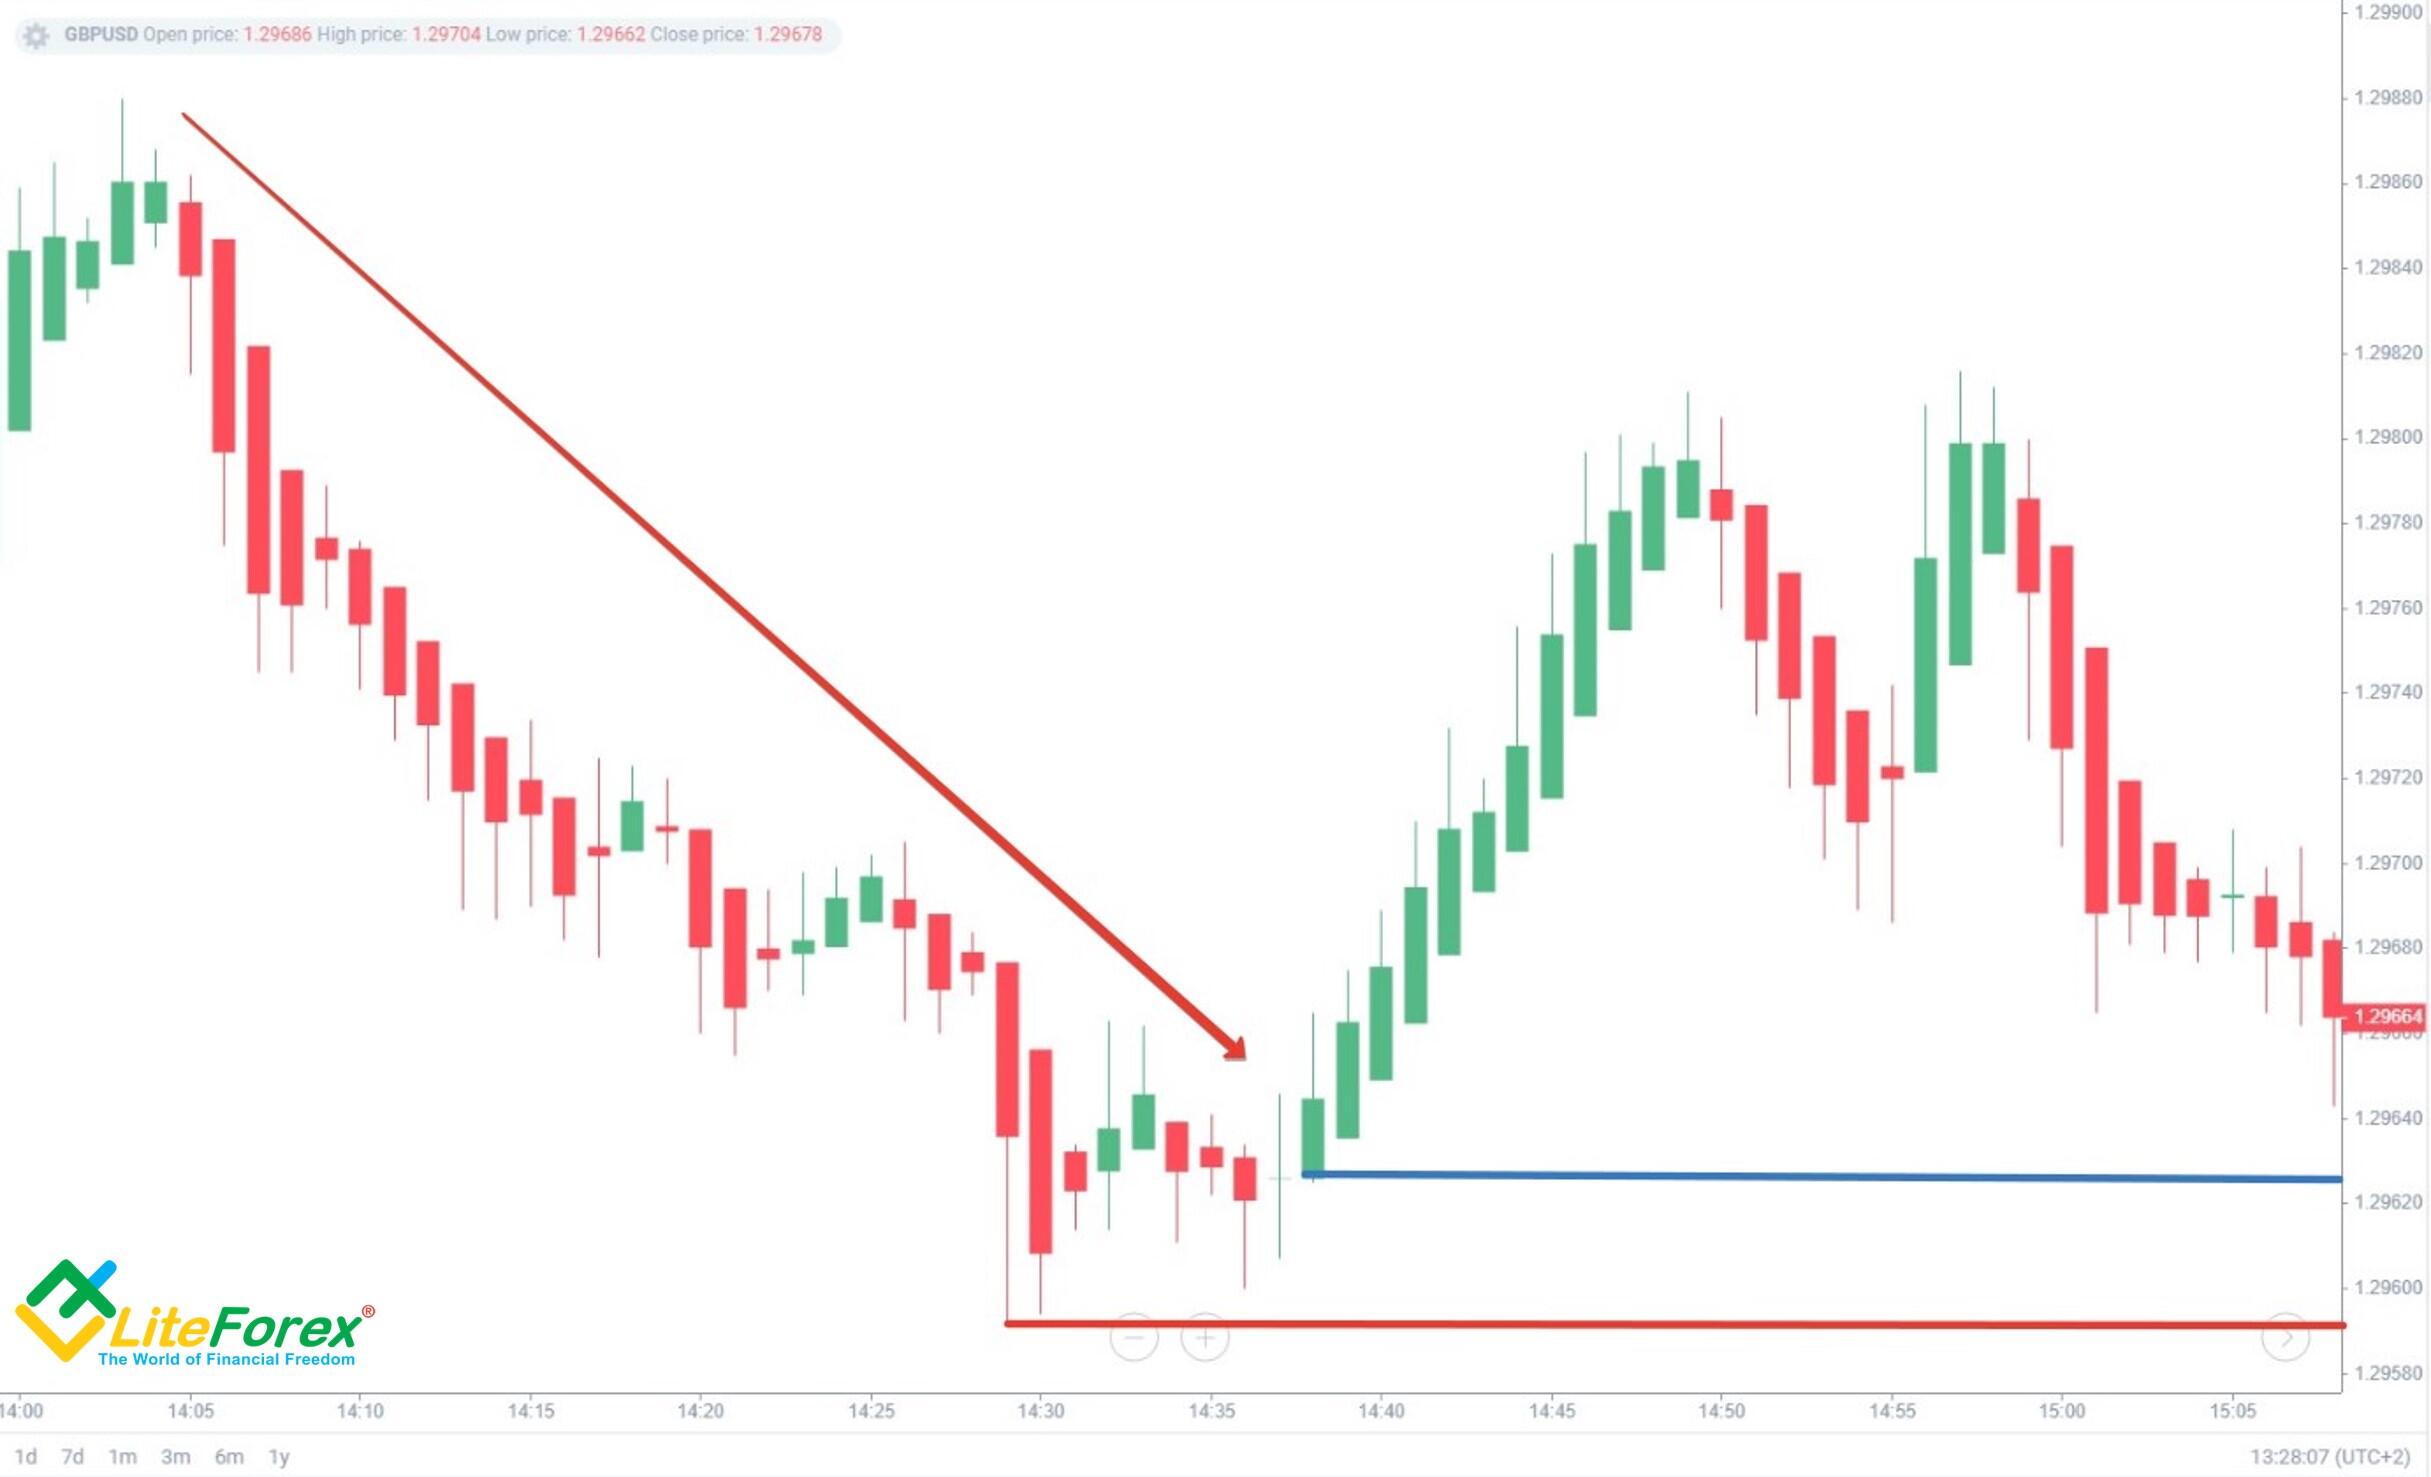
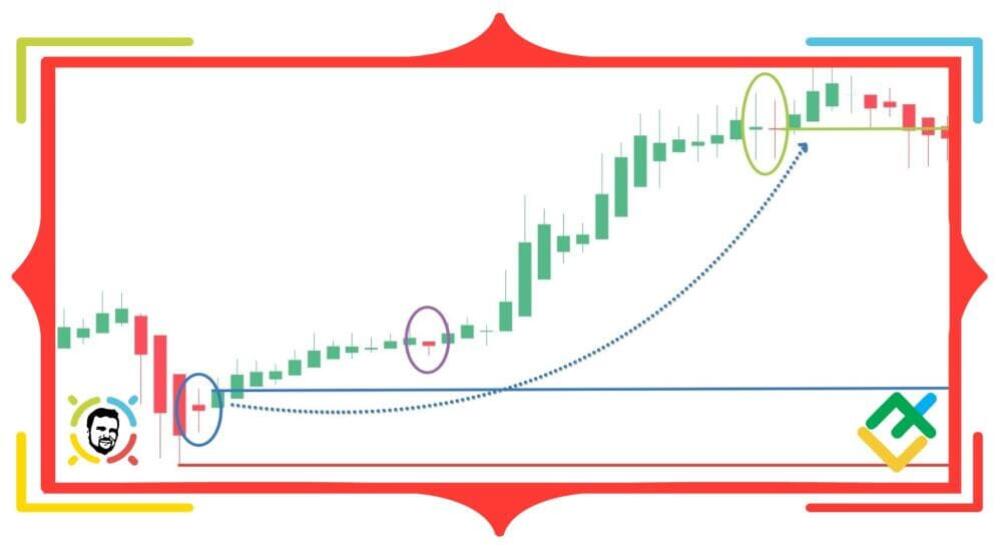
Step 1. Identify the strong downtrend. Use the signs from the "Bearish Heikin-Ashi Trend" section. Here, there are more red candles that formed with small or no upper tails.
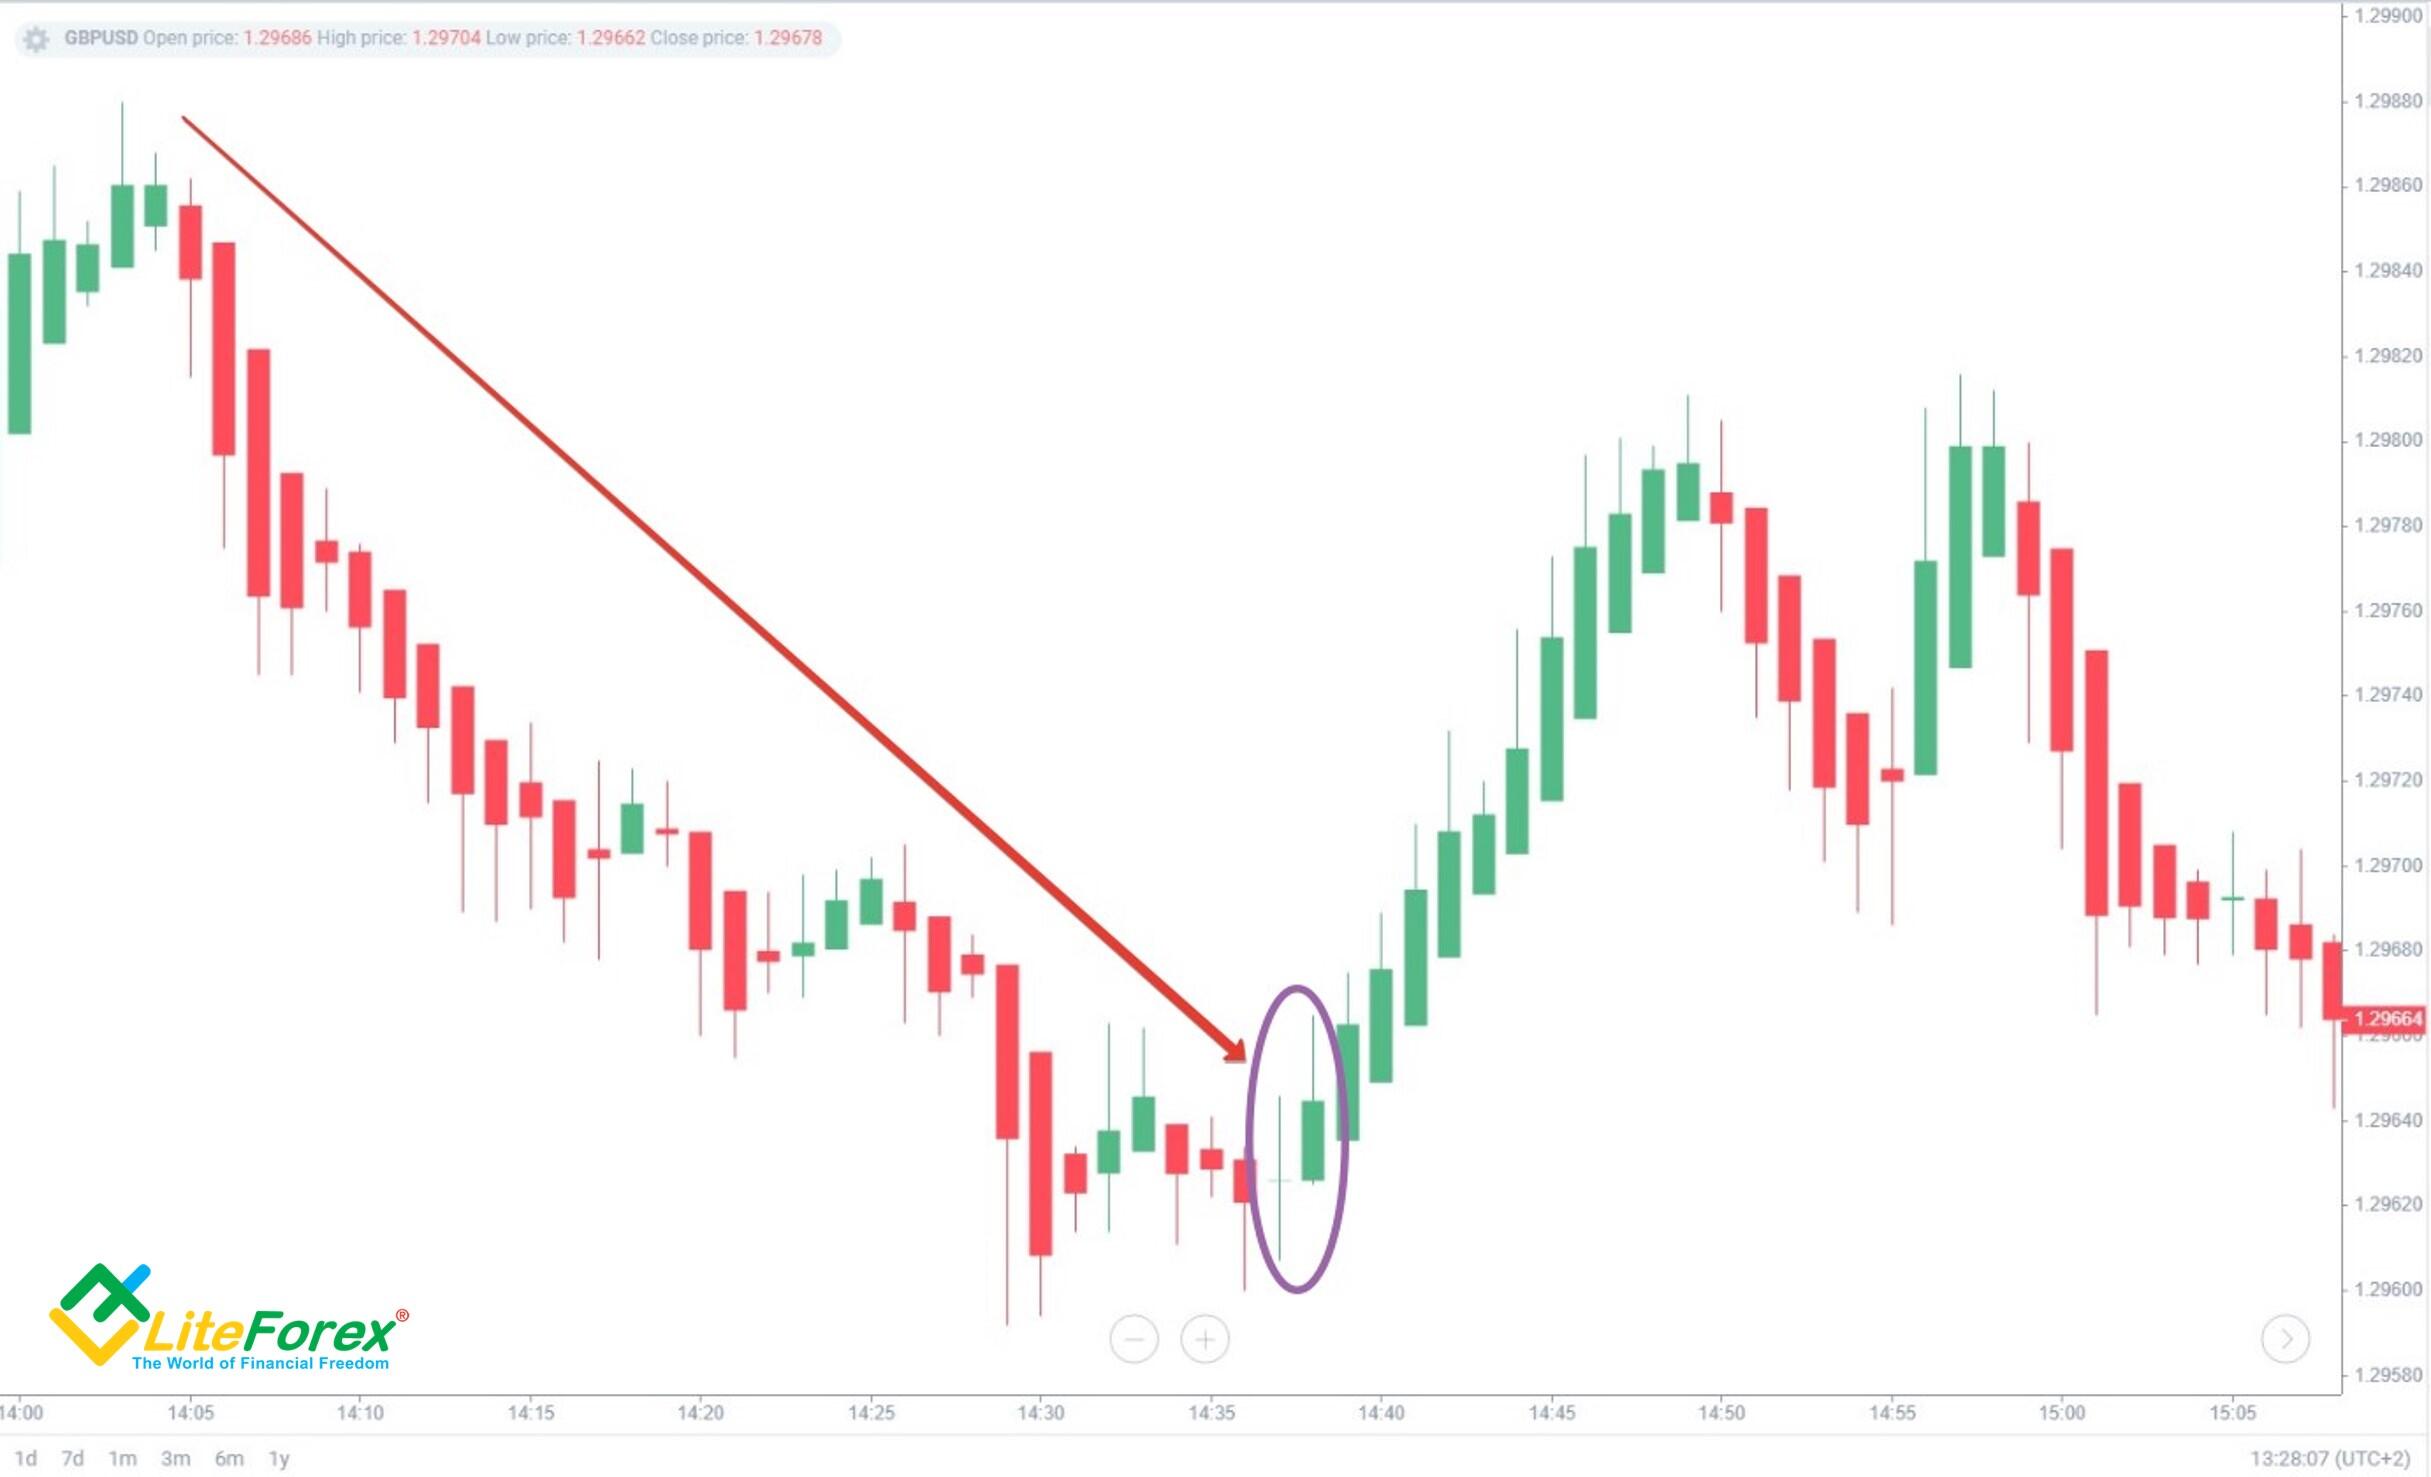
Step 2. We see an upward bar (purple oval). Take a closer look at the nearby bars to detect a reversal signal where the las few candles of the bearish trend are formed.
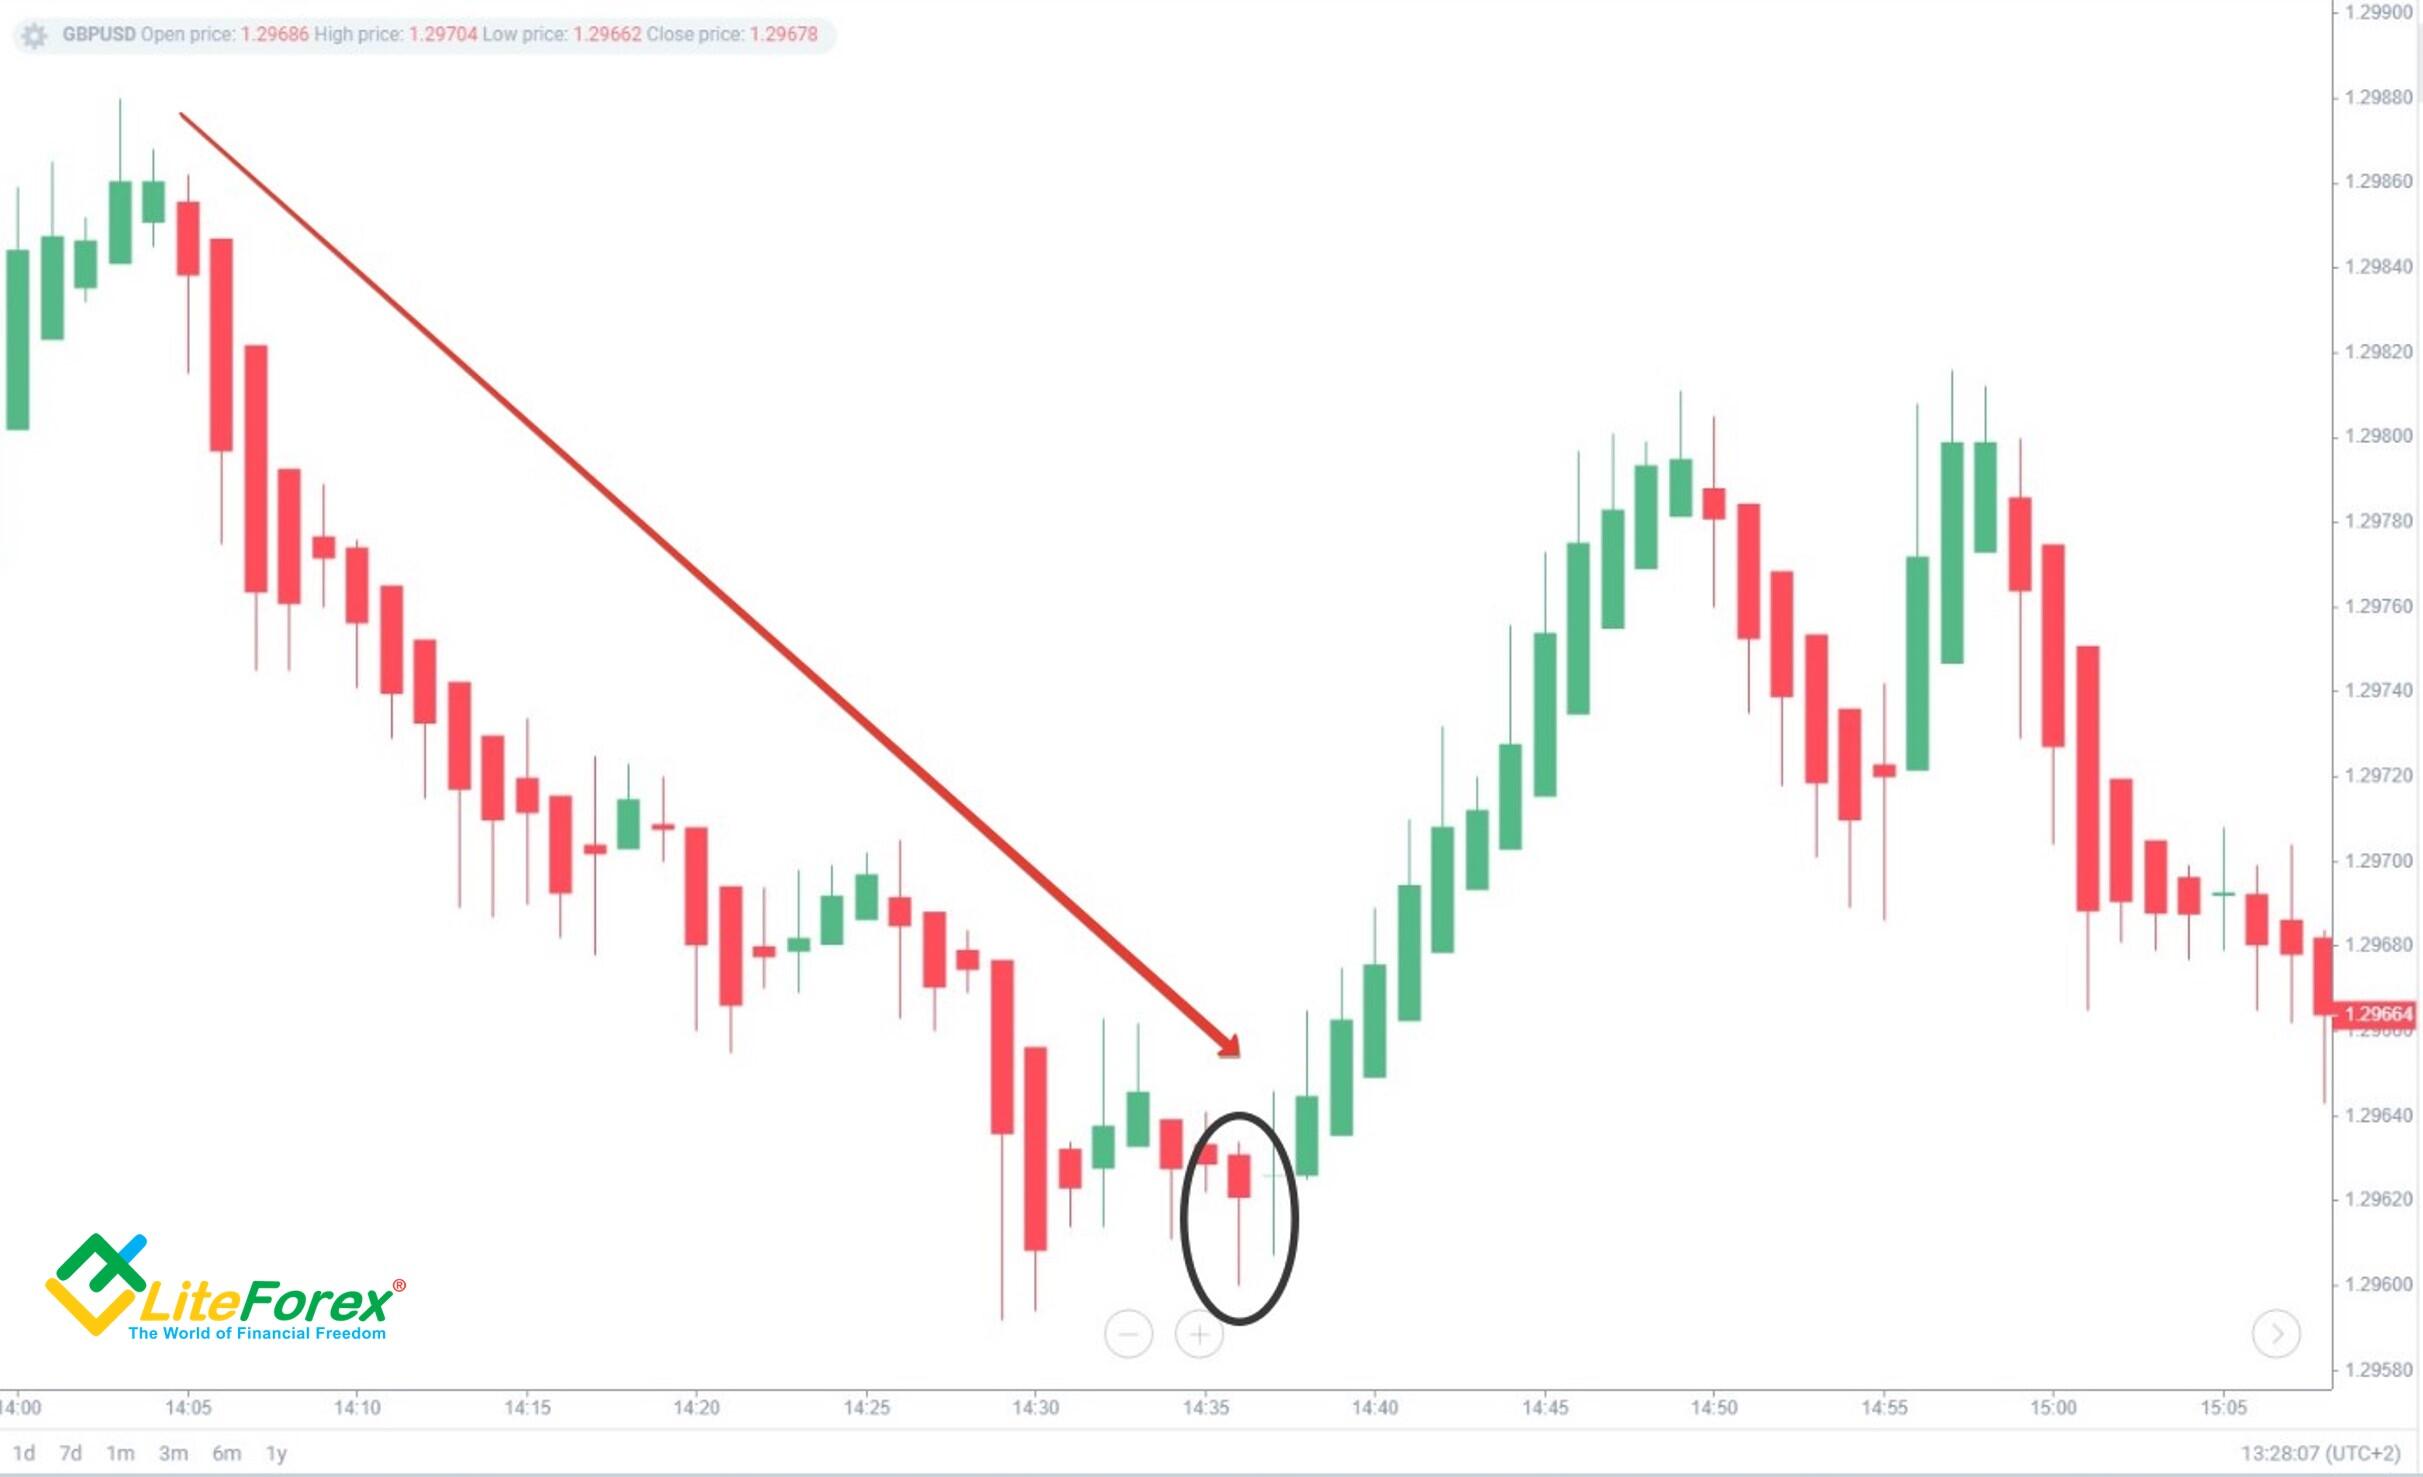
Step 3. Detect Price Action patterns or reversal patterns using technical analysis. The first reversal pattern is the last red Hammer bar (black oval where the last of the red candles is shaped).
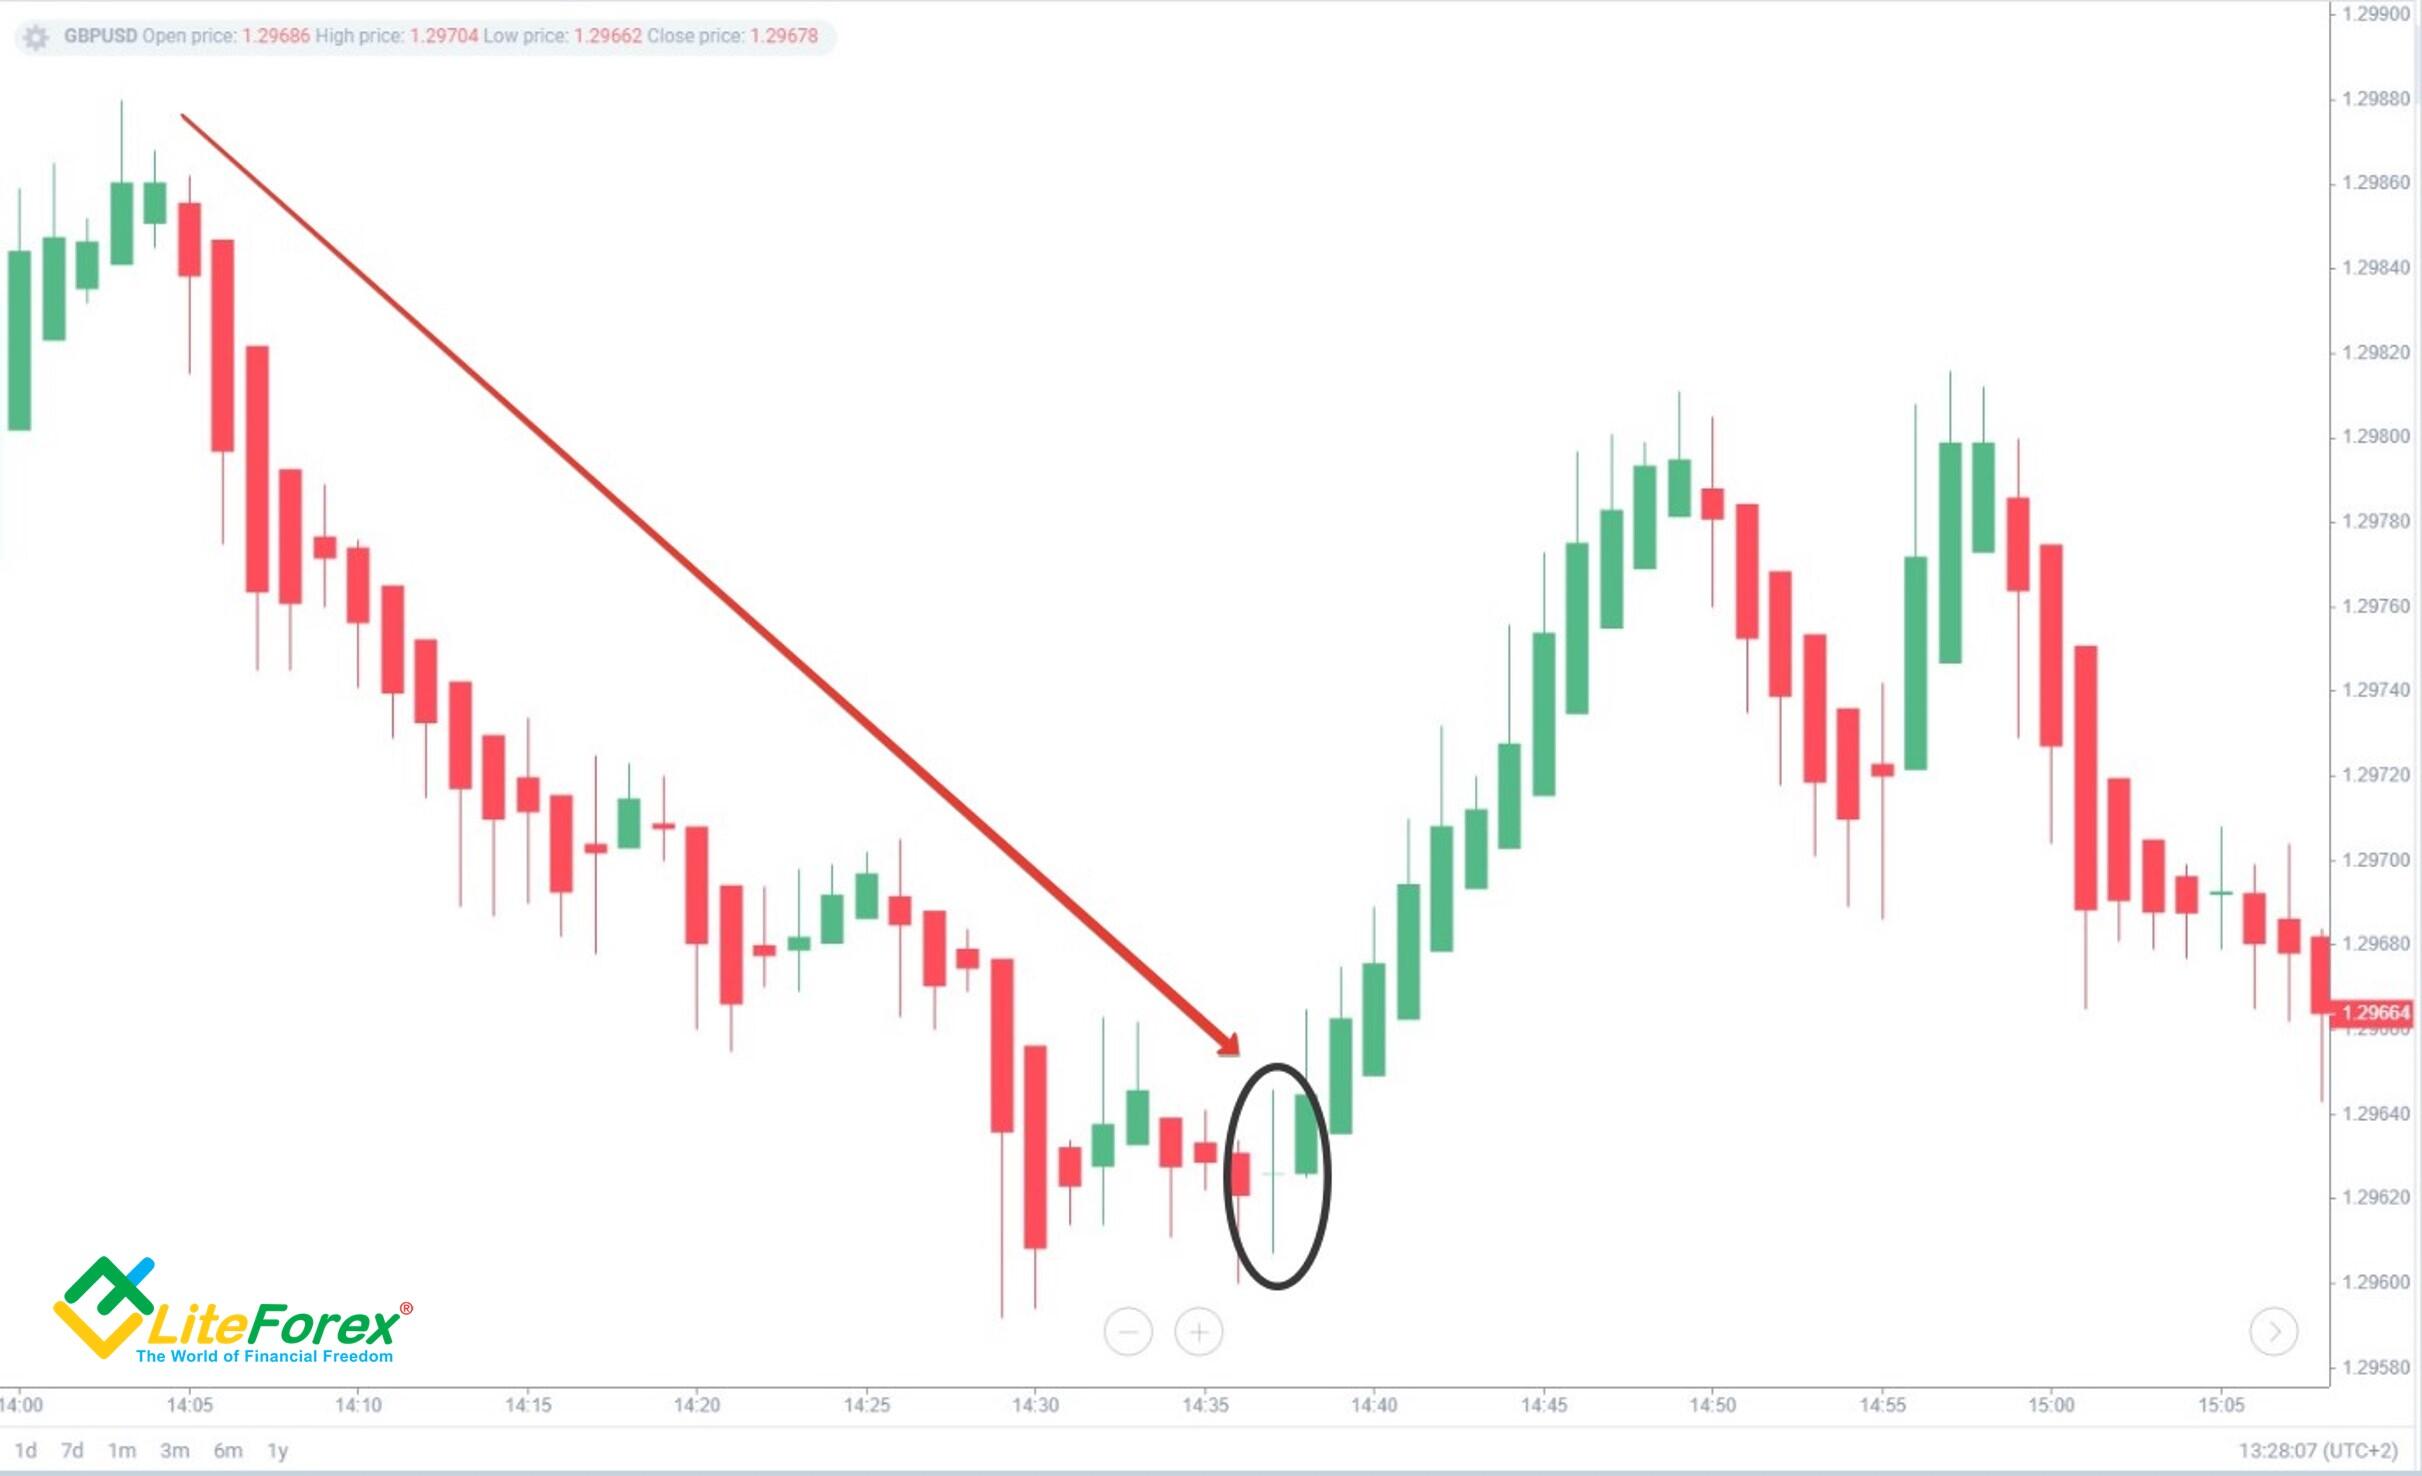
It is followed by a long Doji (black oval). Two reversal patterns in a row rarely happen. At the same time, they give enough confidence to go for an aggressive market entry.
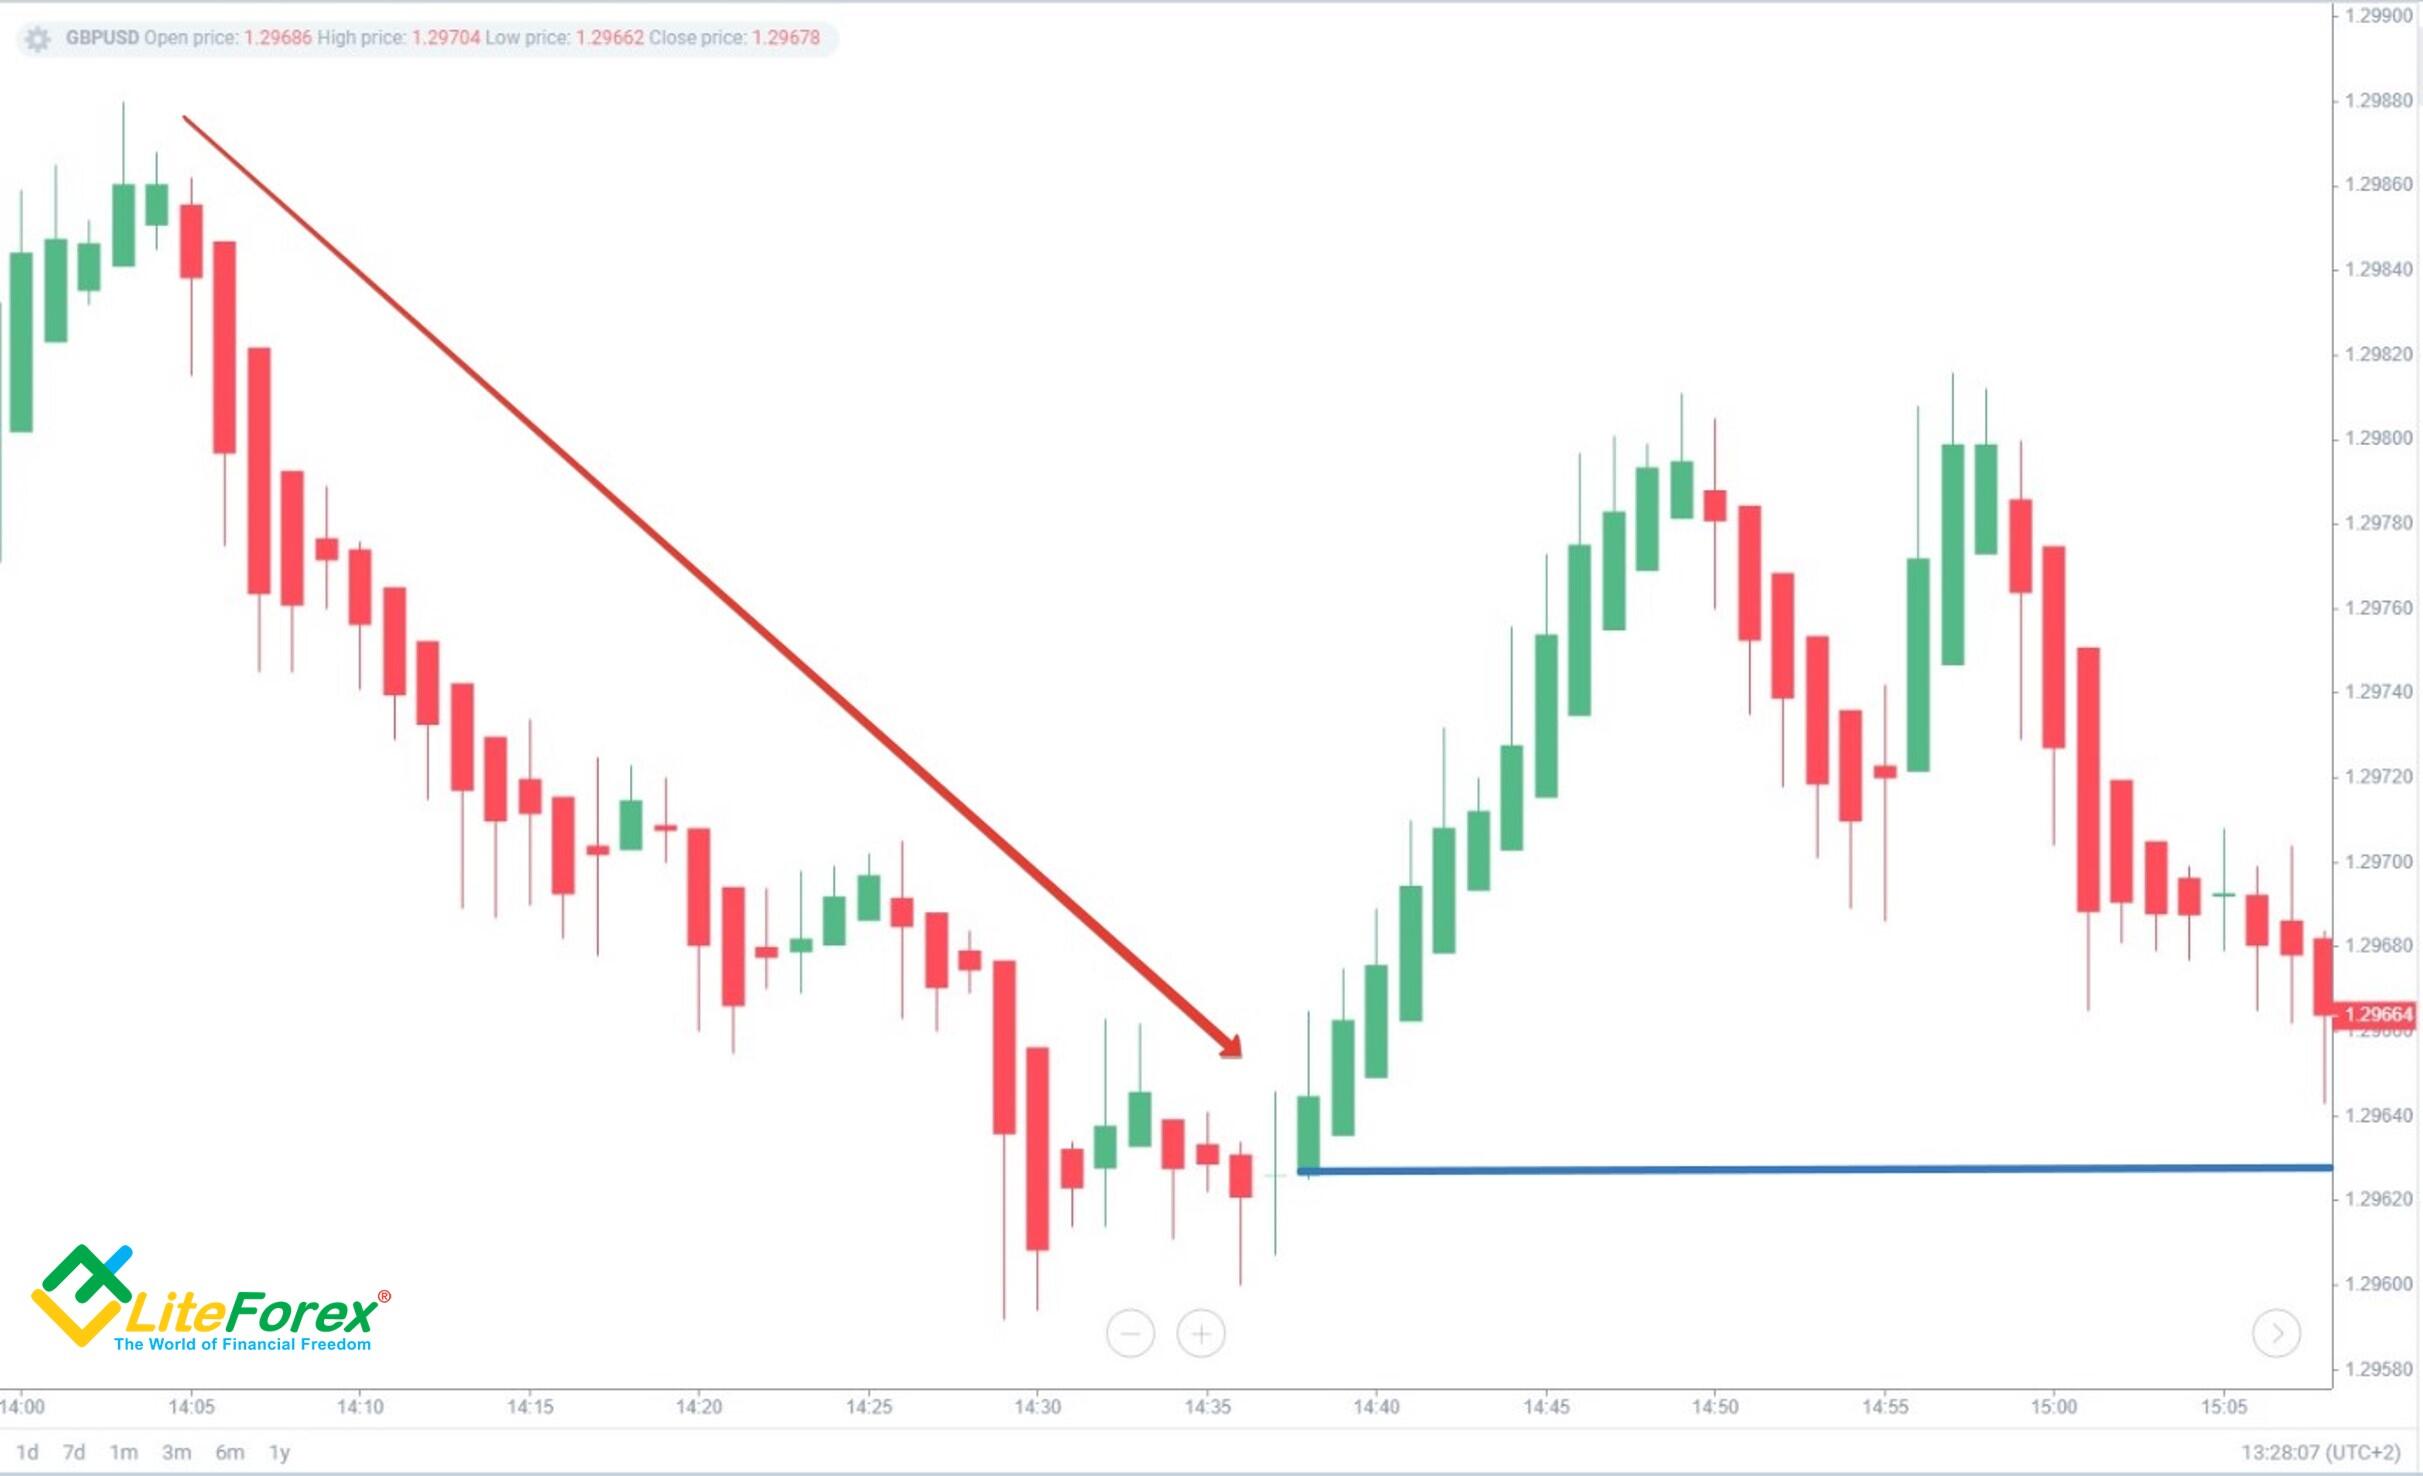
Step 4. Enter a buy position at the opening of the next candle after the Doji (blue line).
Step 5. Set a stop loss at the nearest local minimum of the Japanese candlestick. Optionally, set a trailing stop if it fits your risk management system to avoid losing money rapidly.
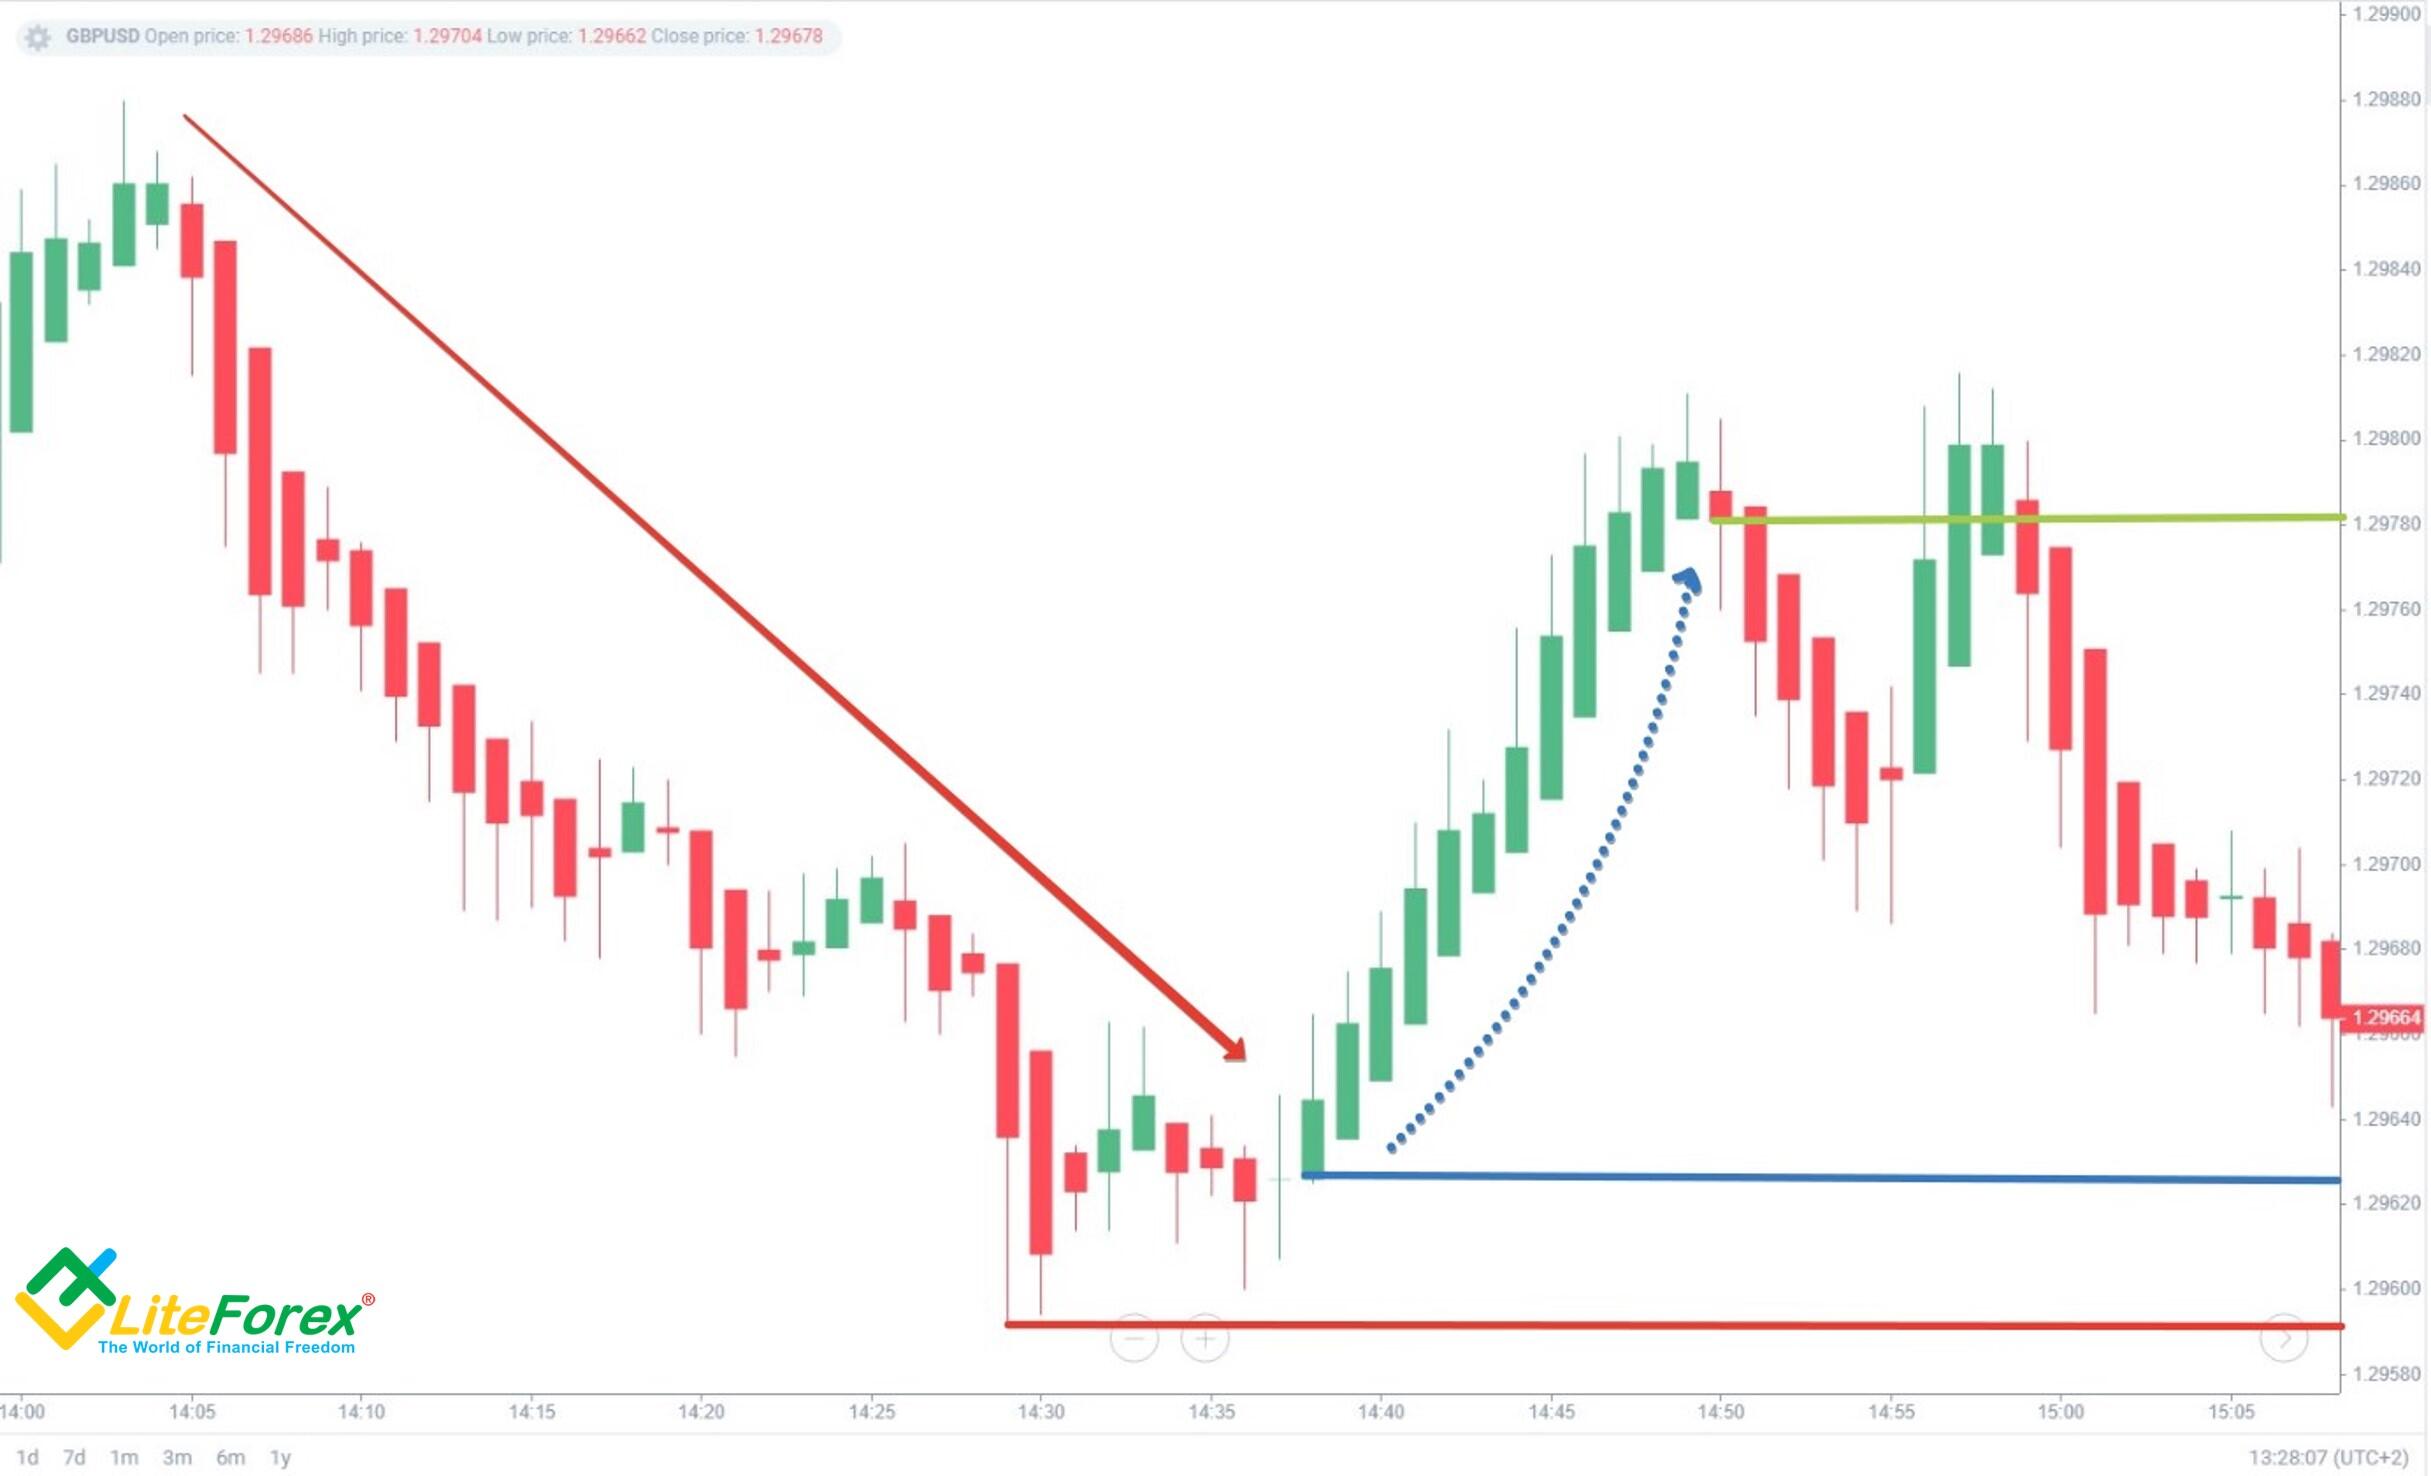
Step 6. In the classic Heiken-Ashi strategy, exit the market when there is located at the close of the candlestick chart the first downward candle. In our case, the first red bar is also a sign of a trend reversal. The tails are long compared to the body on either side, which indicates a battle between bulls and bears. So, after the bar closes, exit the market with a good profit.
Heiken-Ashi Scalping Strategy
Smoothing makes the HA charts appear uniform, which is why choosing to use Heiken-Ashi is great for scalping.
Heiken-Ashi's scalping strategy involves a very simple analysis. In particular, if the next bar forms in the desired direction by the Price Action signal, it’s enough to enter. Let's look at the example of the AUDUSD currency pair.
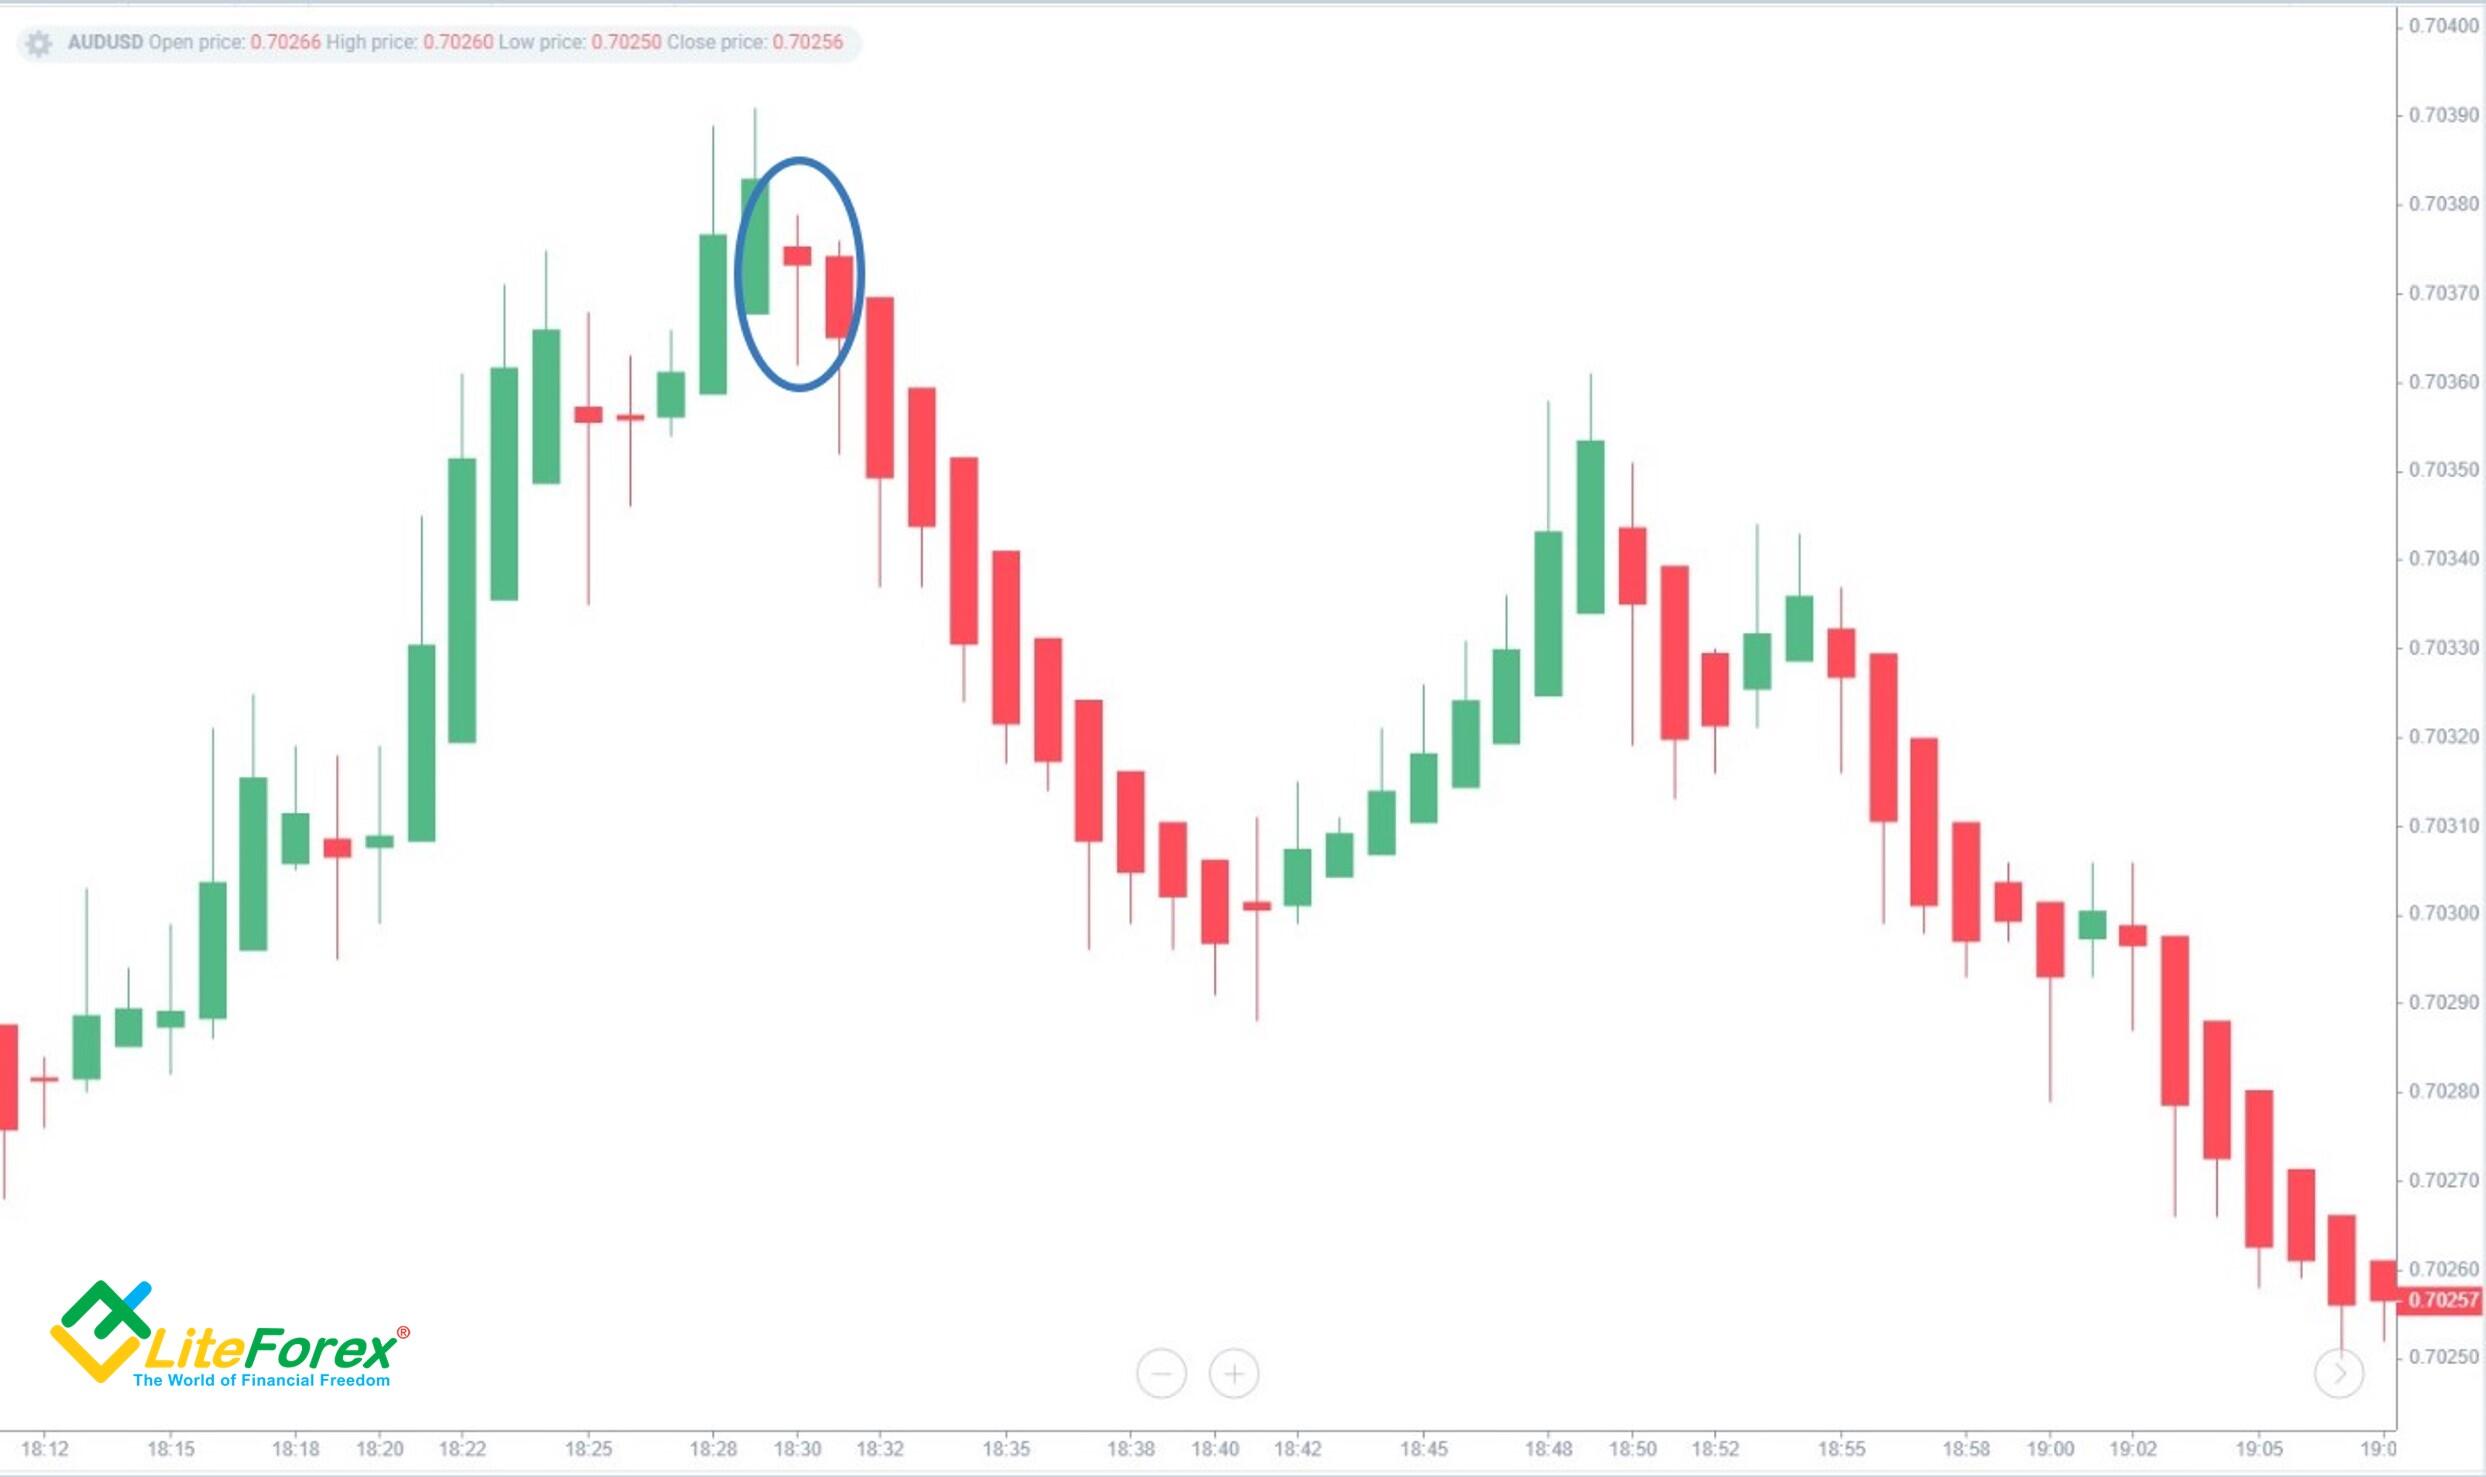
There is a downtrend after a strong and long uptrend, and the lower tail is much larger than the upper one (blue circle). This can be an indirect signal for a trend reversal. Note that a few bars before, the situation was pointing to a reversal, but the trend continued for some time. In Heiken-Ashi scalping, such situations aren’t rare. So, when trading, you should set stop losses close to the position’s opening level and strictly follow your money management strategy.
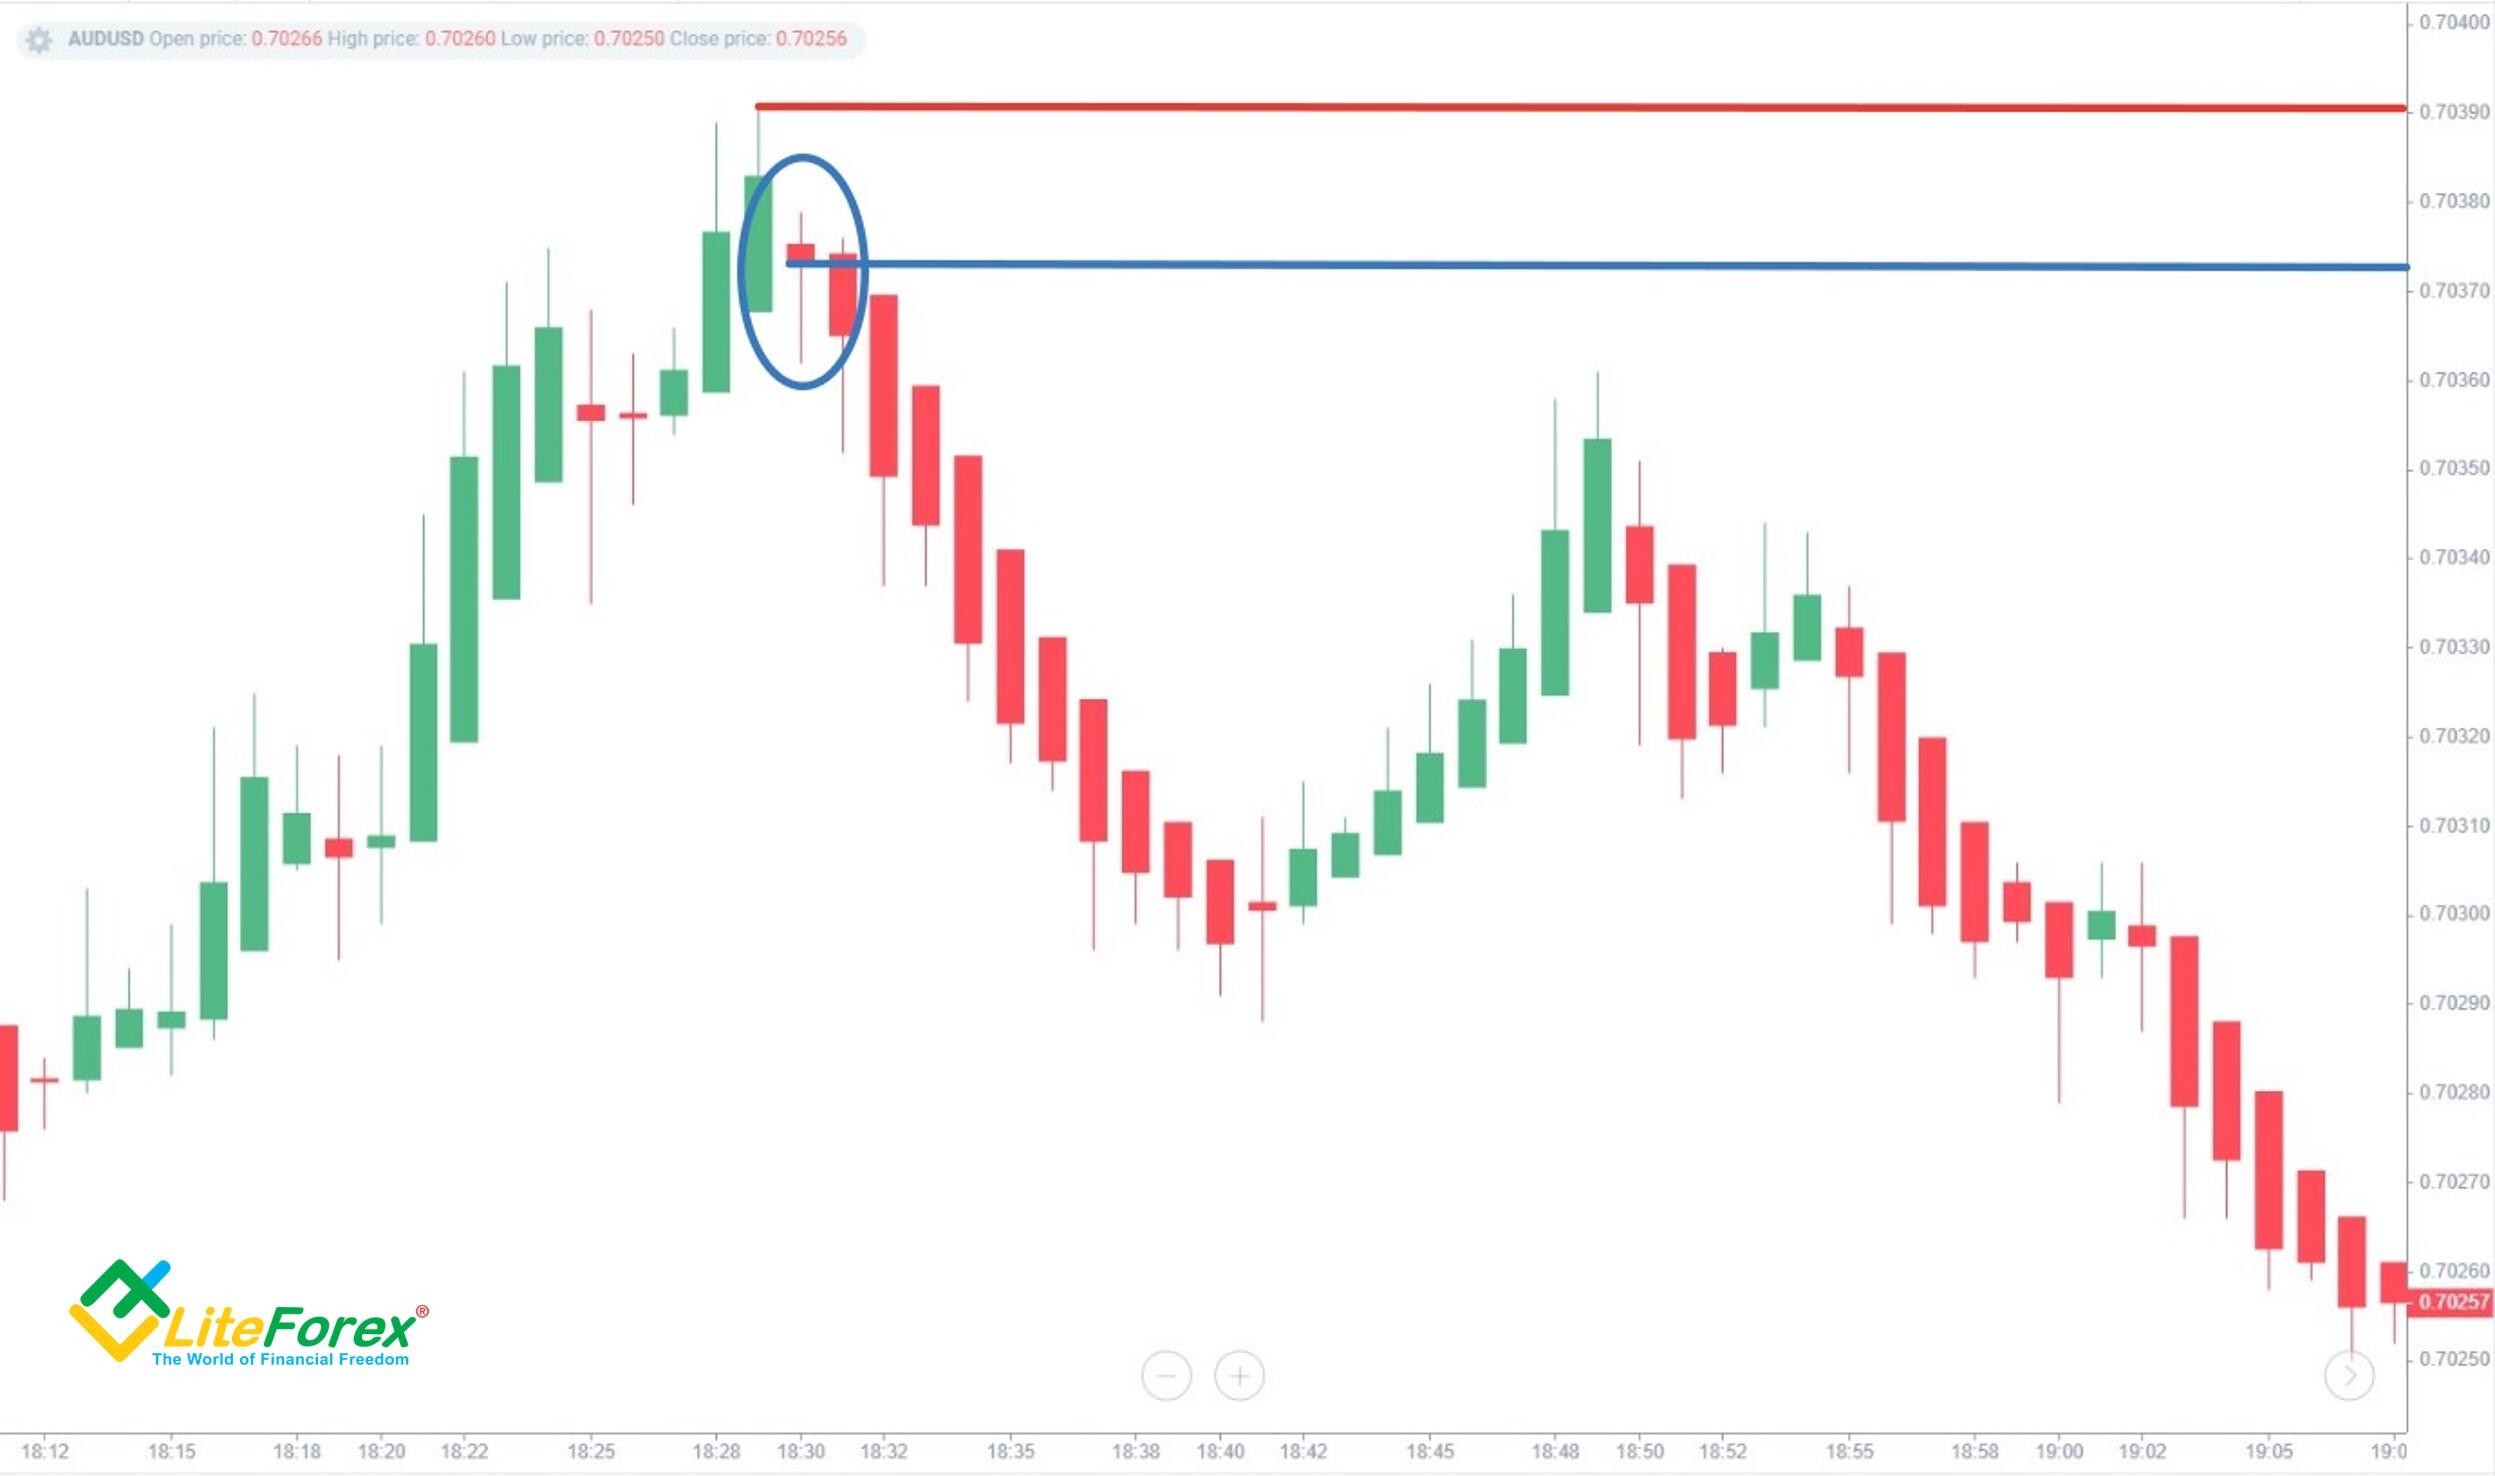
As the next candle opens the selling pressure rises, and it is a good time to enter a sell trade (blue line). Set stop loss at the nearby Heikin Ashi high (red line). Also, if the local maximum is far from the opening price, set the stop to a level lower.
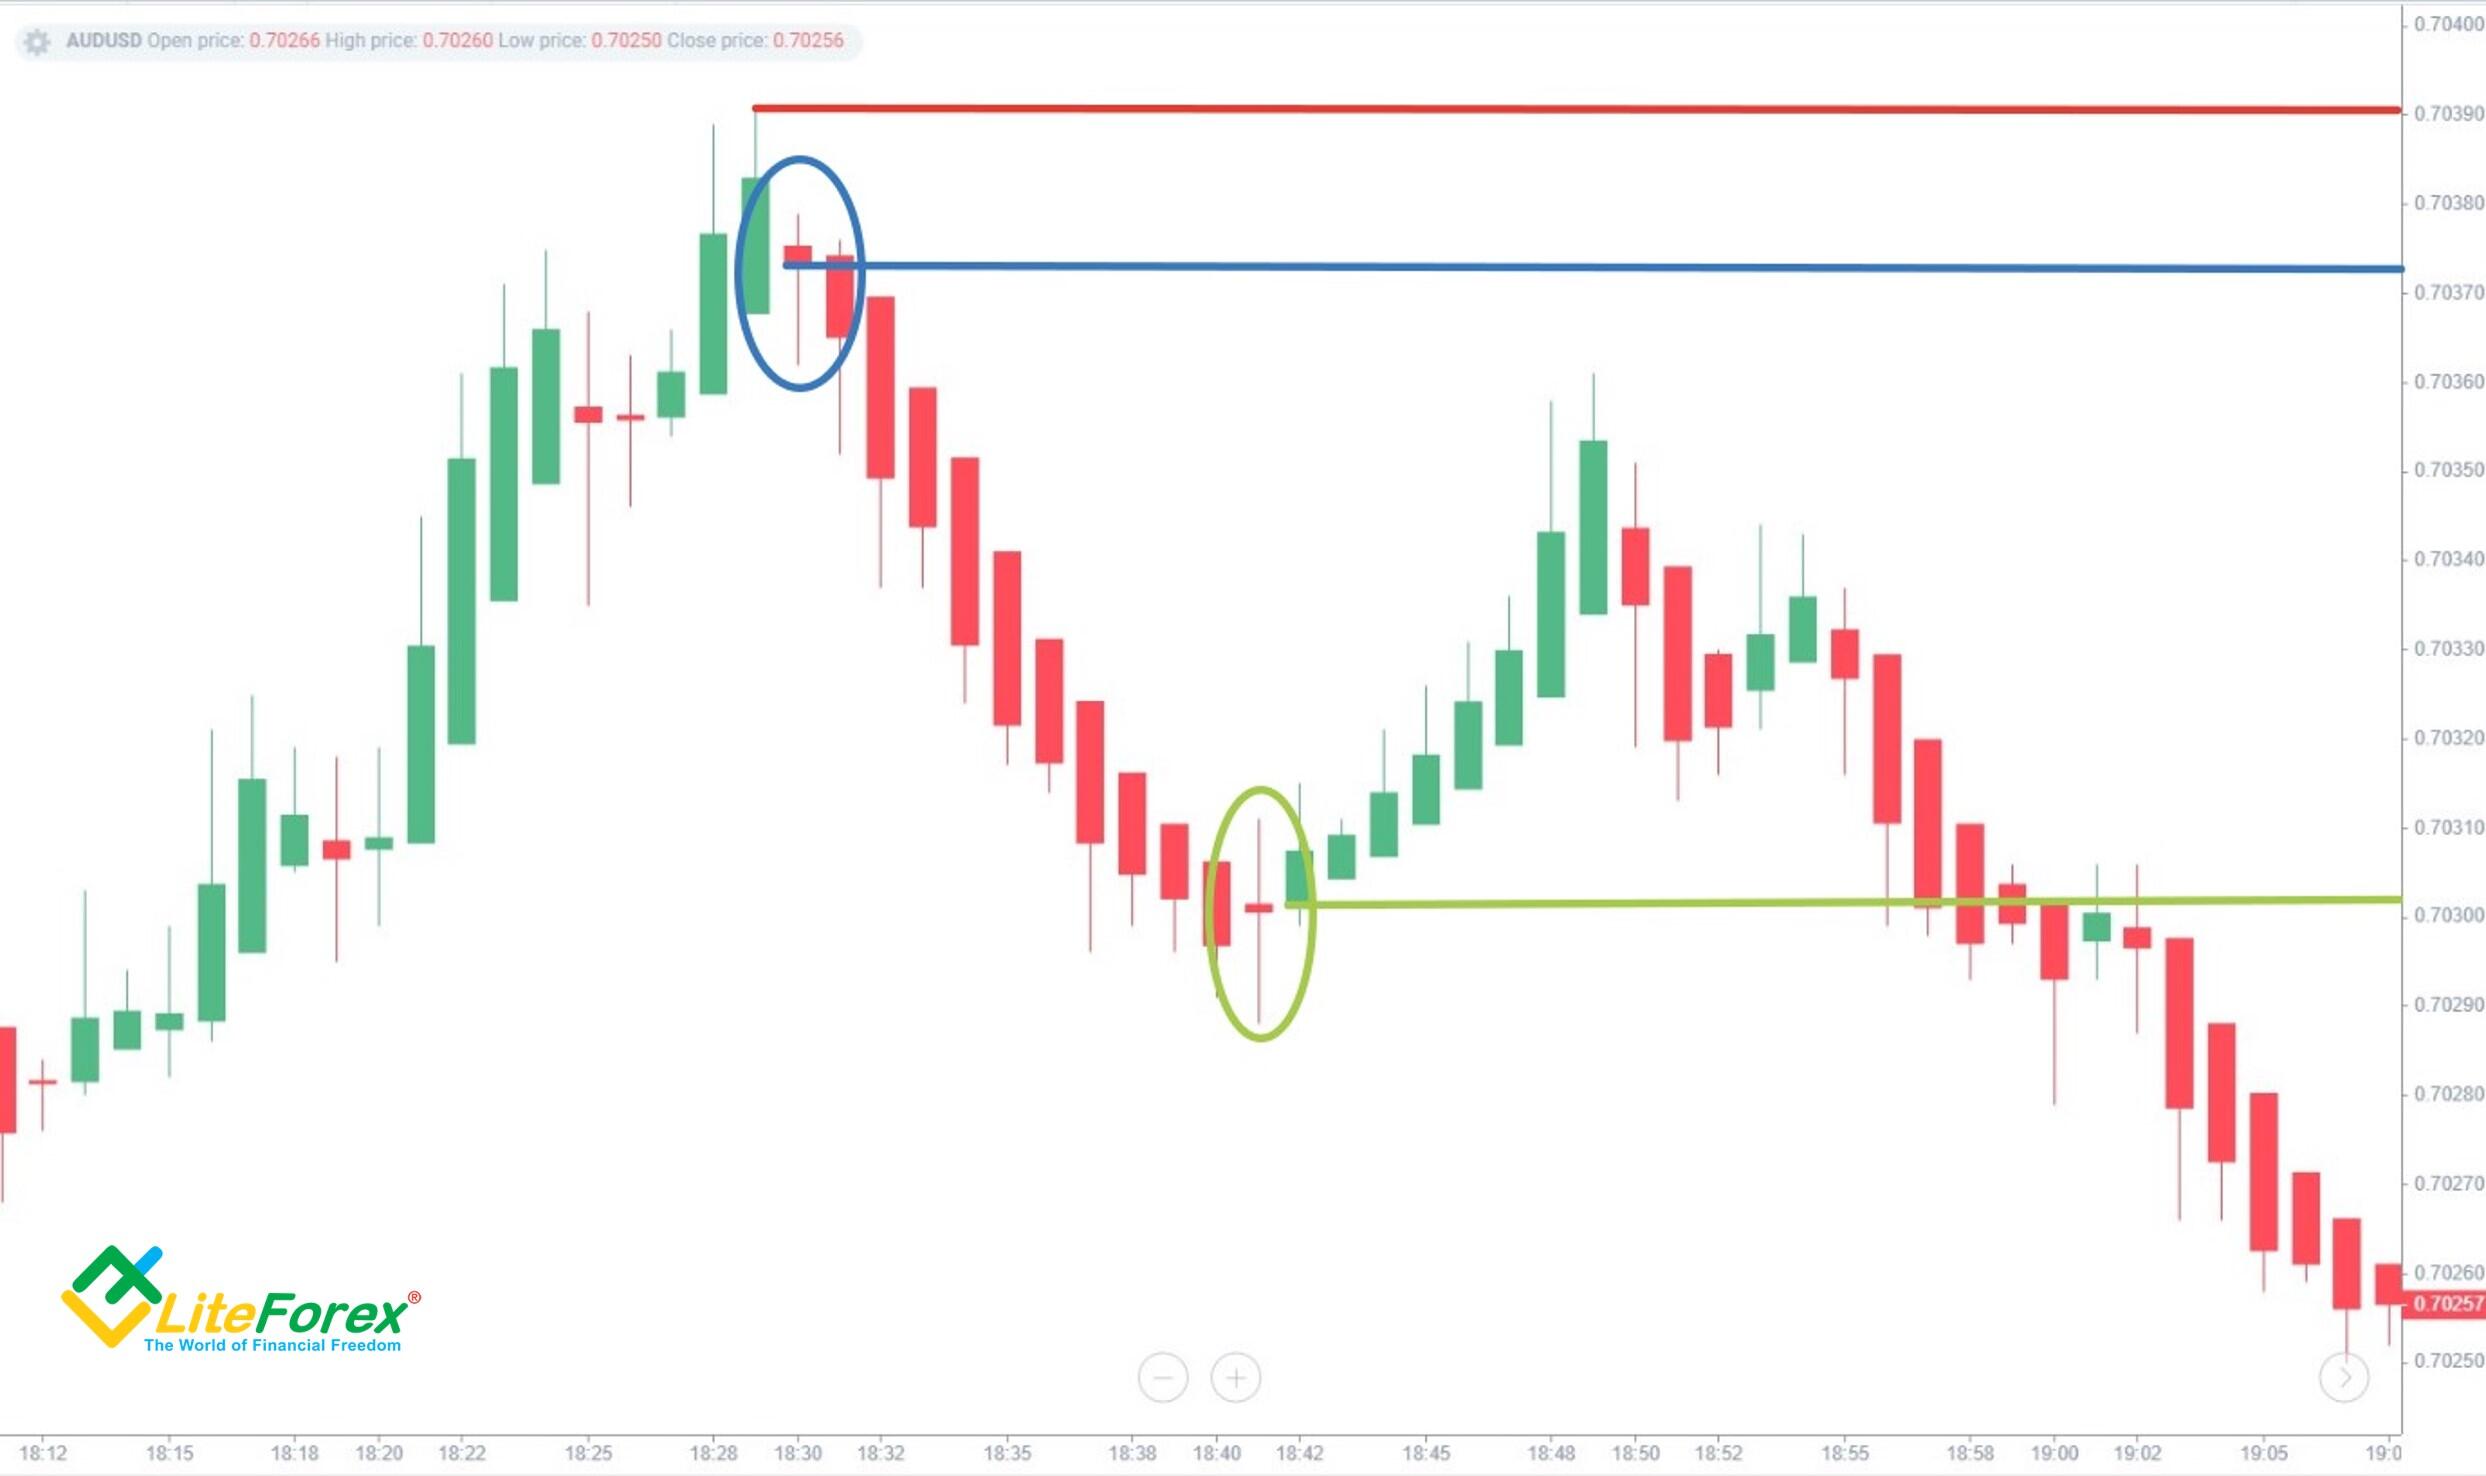
As the trend develops, the HA-candles’ bodies slowly increase and gradually decrease before the downward movement ends. At last, we can see a Doji. Taking this signal into account, exit the market with a profit at the opening of the next candle.
Ichimoku and Heiken-Аshi
The strategy for swing trading Heiken-Ashi is a combination of the Ichimoku charting method and the HA candlestick analysis. If you’re not familiar with Ichimoku, I recommend reading the "Ichimoku Cloud Indicator in Forex Explained" article. This indicator is self-sufficient for trading and offers a set of signals for successful trading. Heiken-Ashi formula only helps to filter out useless price noise and eliminate false signals. Together, these instruments work well on any currency pair. The optimal timeframe is H4 or similar ones. For successful trading, I suggest using the Ichimoku Kinko Hyo indicator standard settings 9, 26, 52.
Conditions for opening a buy trade are:
The bar exists from the Kumo cloud and closes above it.
Tenkan Sen exceeds Kijun Sen.
Chico Span is above the actual price chart in an upward trend.
Senkou Span A exceeds Senkou Span B.
- The Heiken-Ashi has a green candle.
Conditions for opening a sell trade are:
The bar exits the Kumo cloud down and closes below it.
Tenkan Sen drops below Kijun Sen.
Chico Span is below the actual price chart in a strong downtrend.
Senkou Span A is below Senkou Span B.
- The Heiken-Ashi is represented with red candlesticks.
Stop loss is usually set at the nearest local minimum of the Japanese candlestick. Since this Heiken-Ashi strategy involves trend following, consider a trailing stop.
The exit from the market takes place in two cases:
Triggered trailing stop.
Tenkan Sen and Kijun Sen cross in the opposite direction.
Let's take EURJPY as an example.
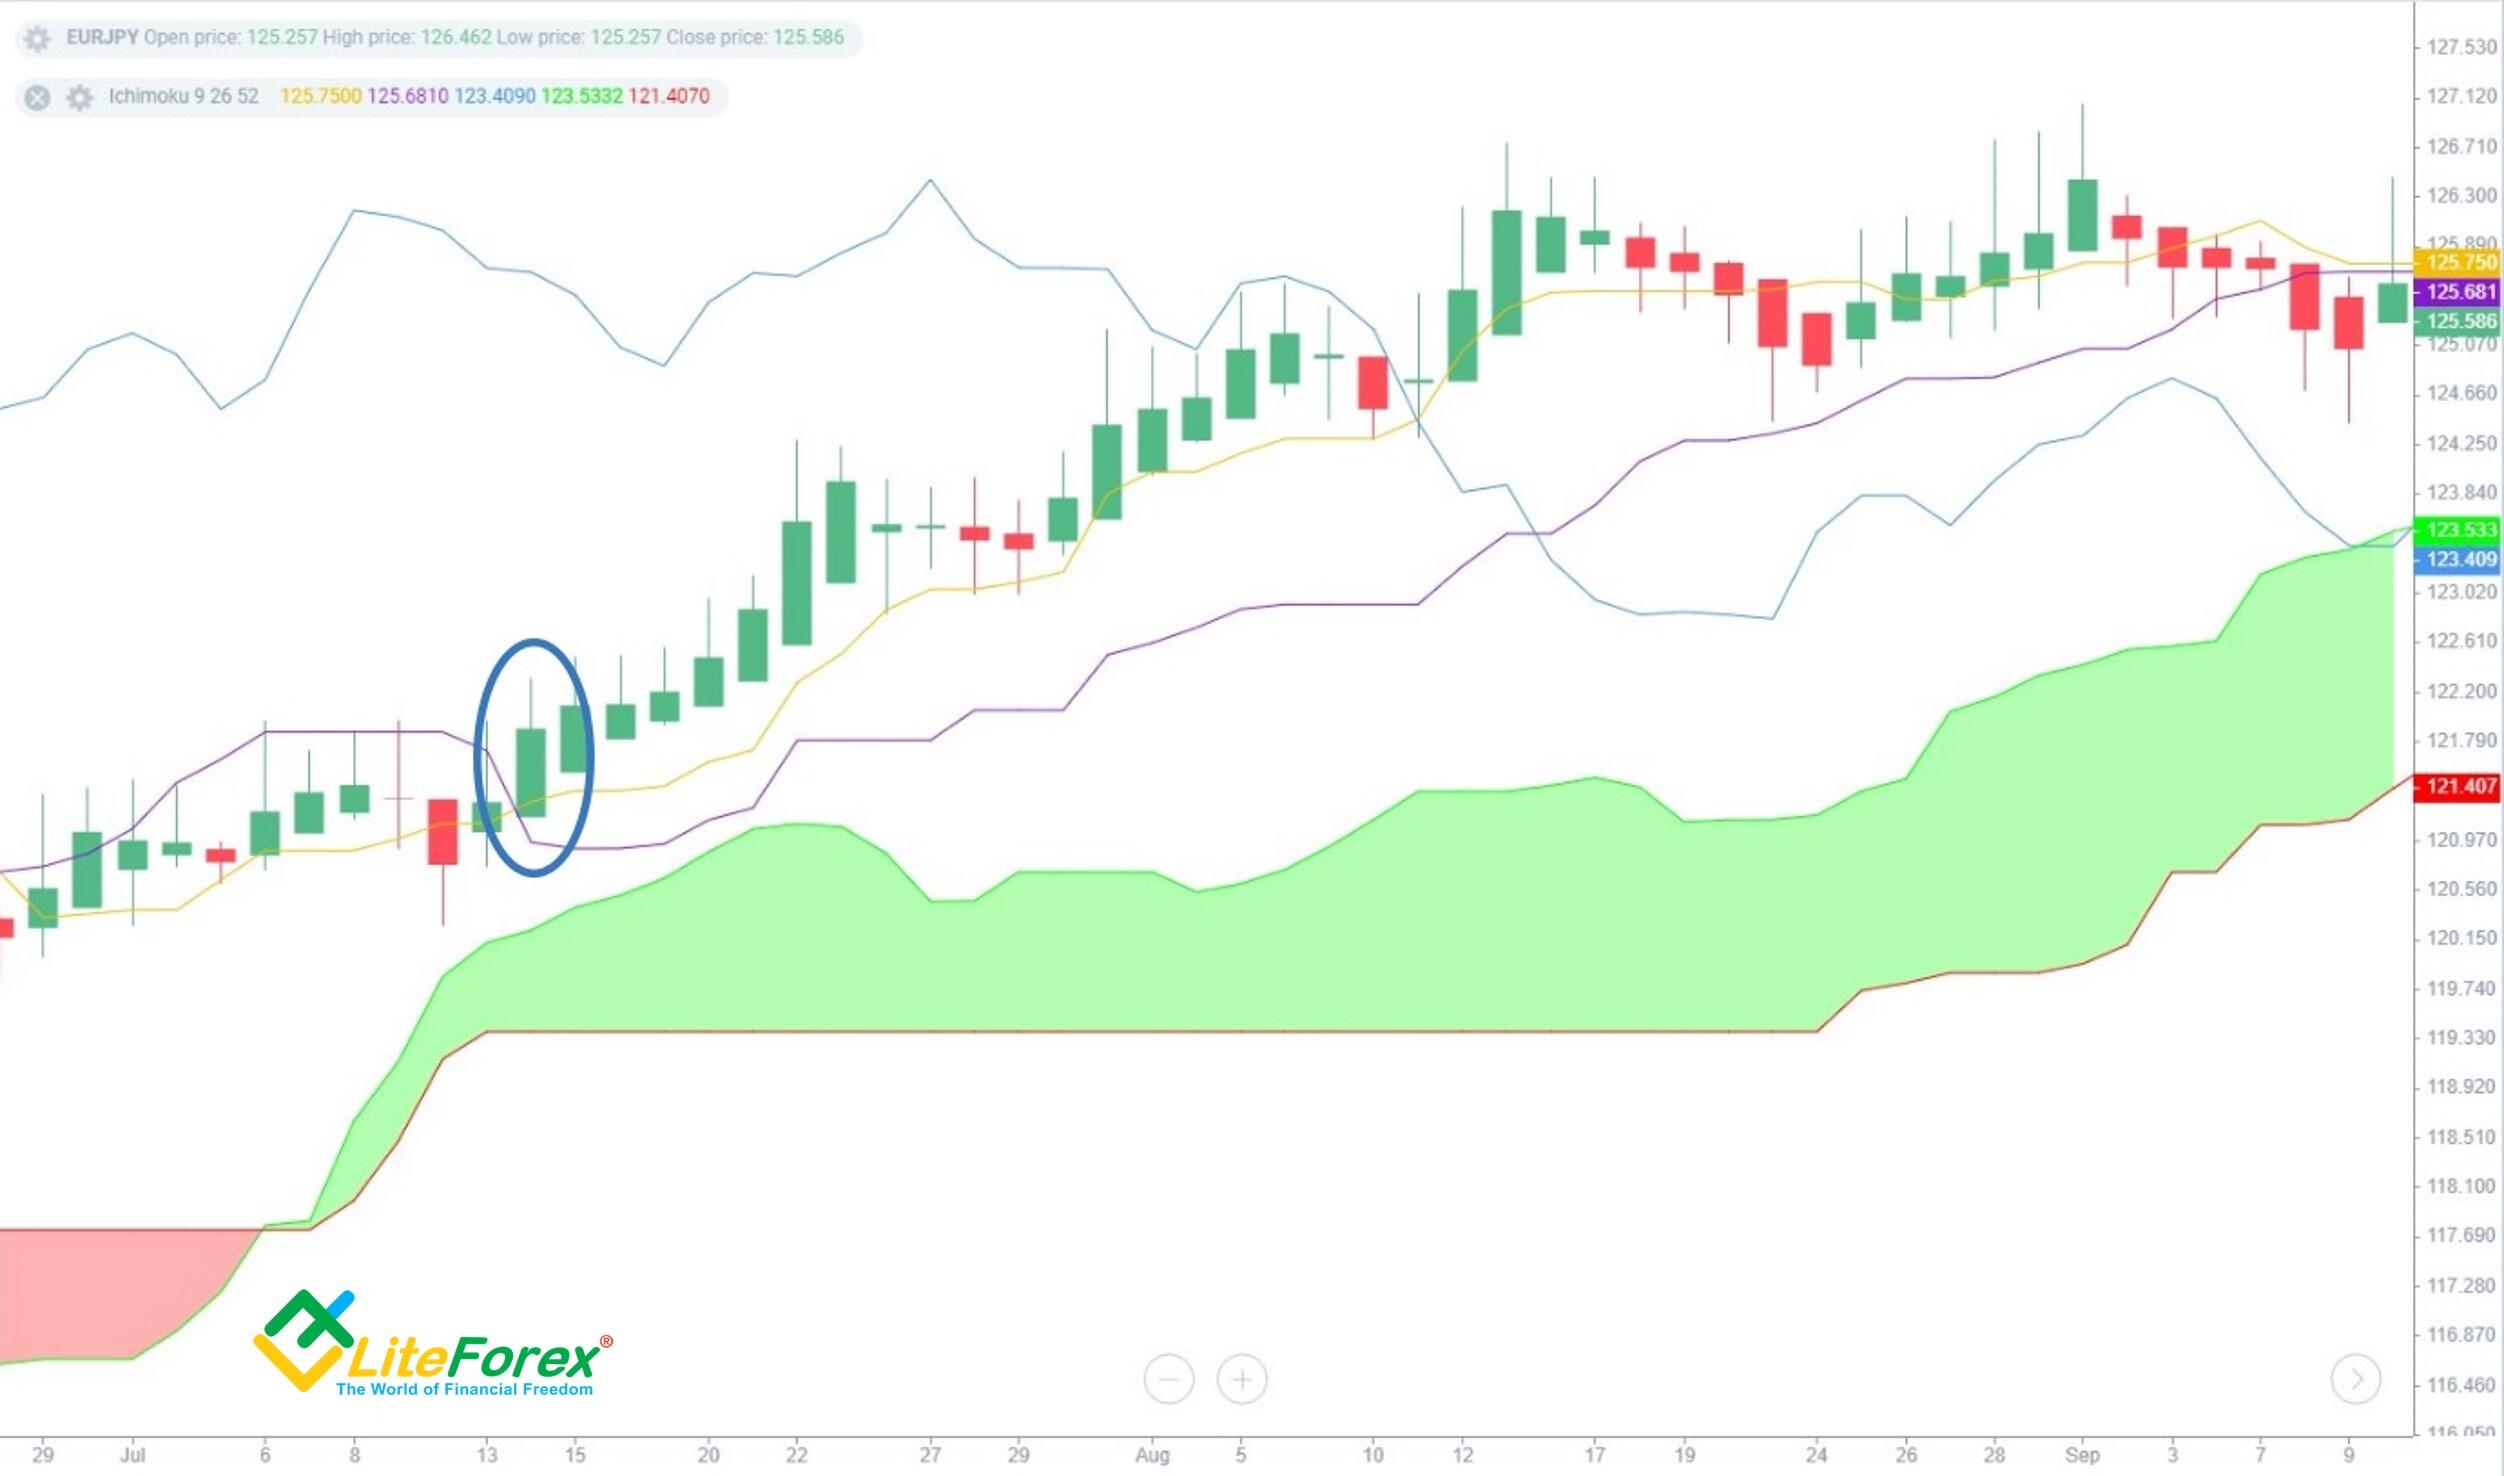
Pay attention to the blue oval on the chart. The bar is above the Kumo cloud. Tenkan Sen (yellow curve) exceeds Kijun Sen (purple curve).
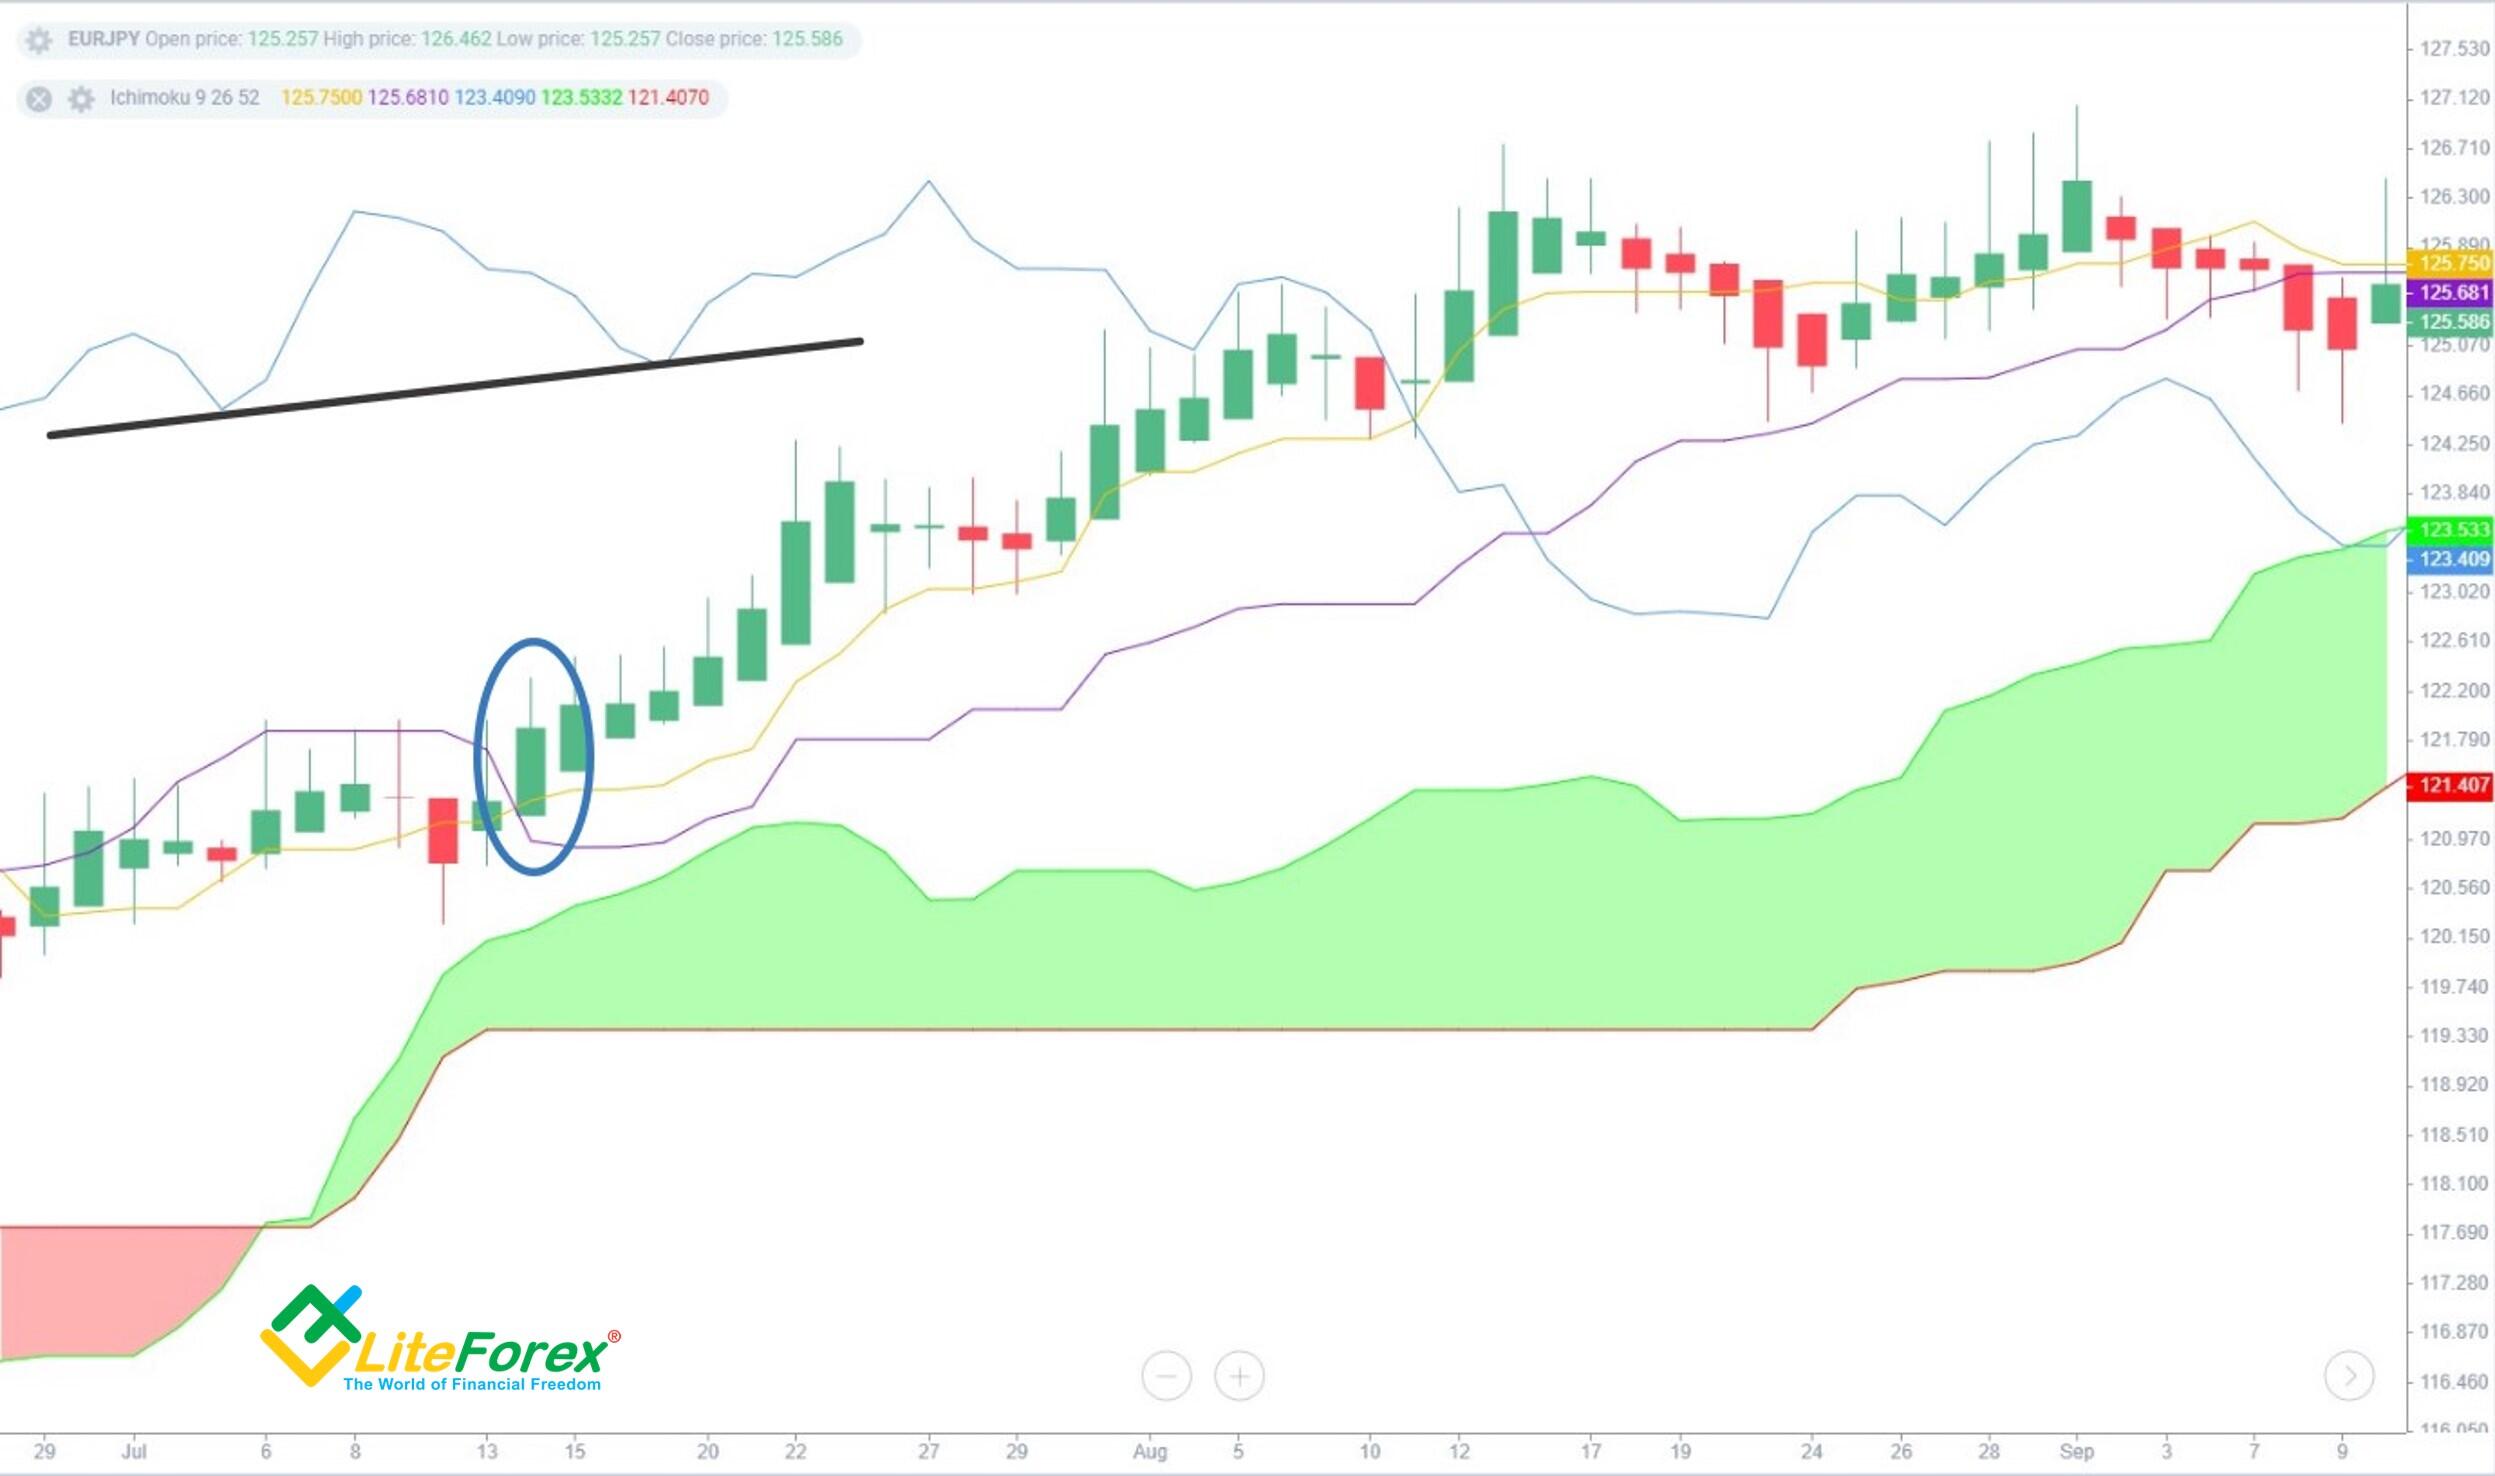
Chico Span (blue line) is above the bar and directed upwards. To show that the Chico Span lows are rising, I connected them with a black line. Senkou Span A (green curve) exceeds Senkou Span B (red curve). The Heiken-Ashi is depicted with the green candle.
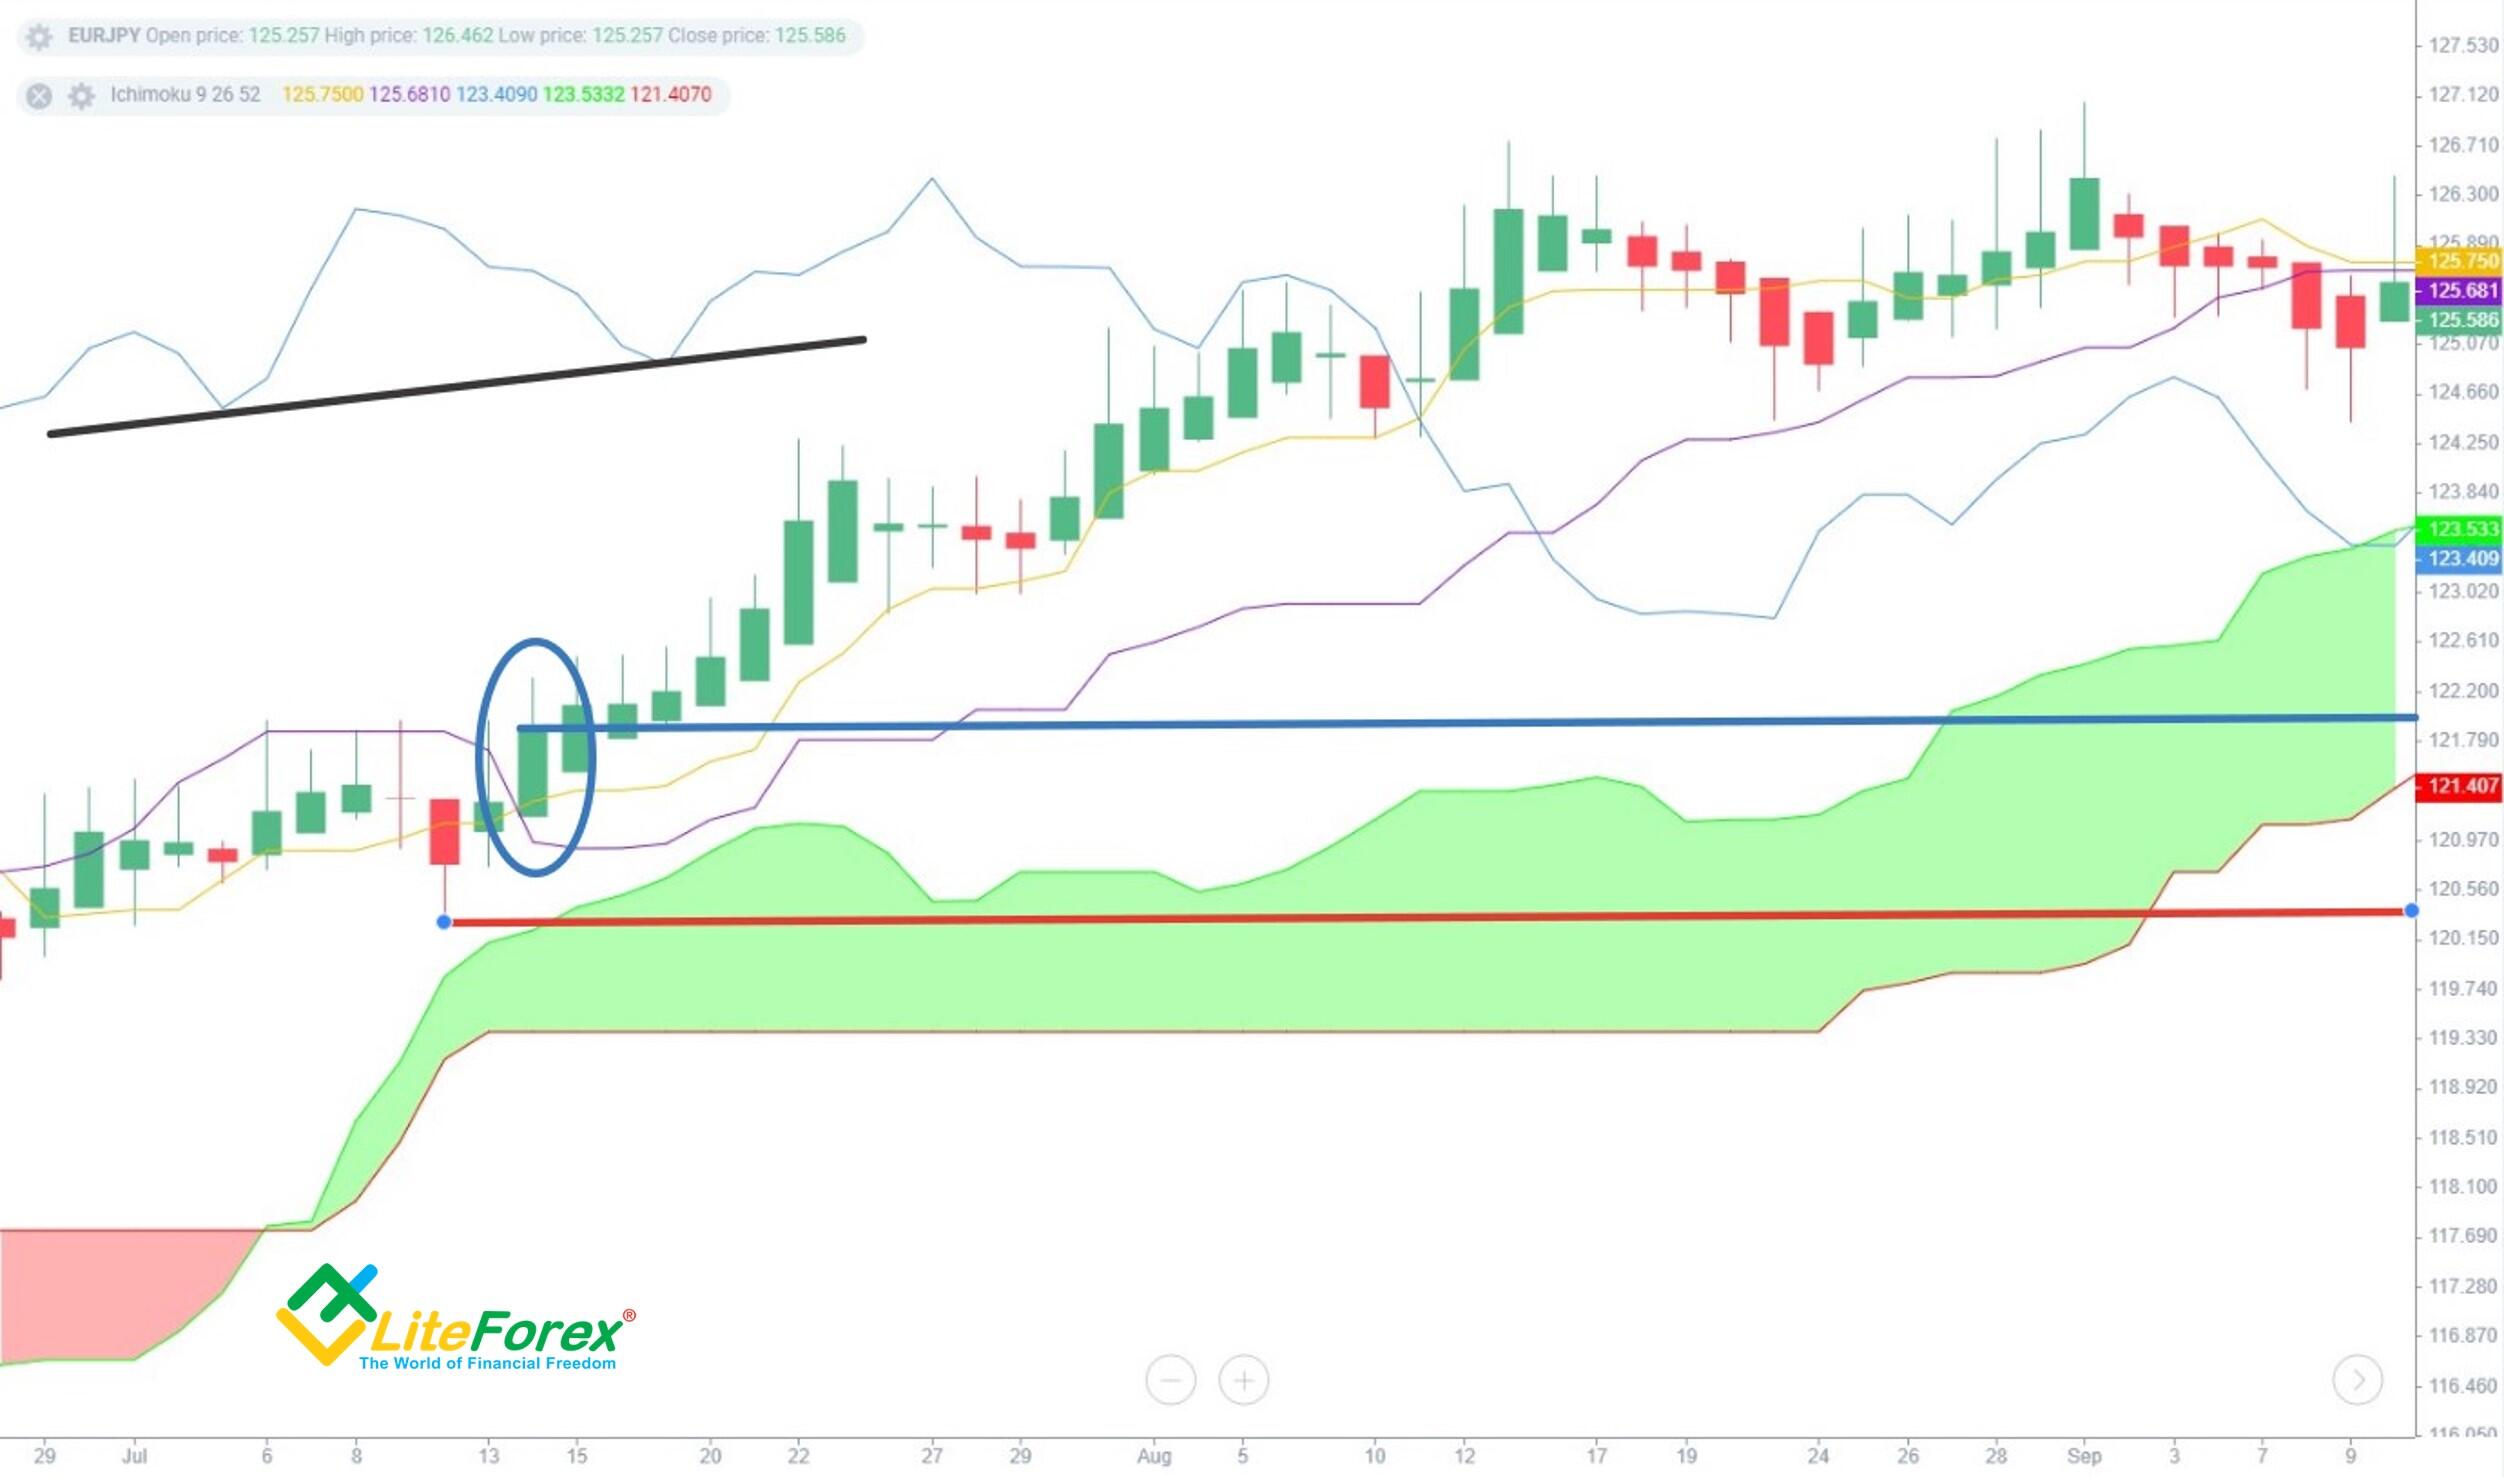
Since the buying pressure begins to rise and all conditions for a buy trade are met, open a position at the Heikin Ashi close to the bar marked with a blue oval (blue line). Set a stop loss at the closest Heikin Ashi low of the Japanese candlestick and a trailing stop with an offset (distance between the entry level and the stop loss).
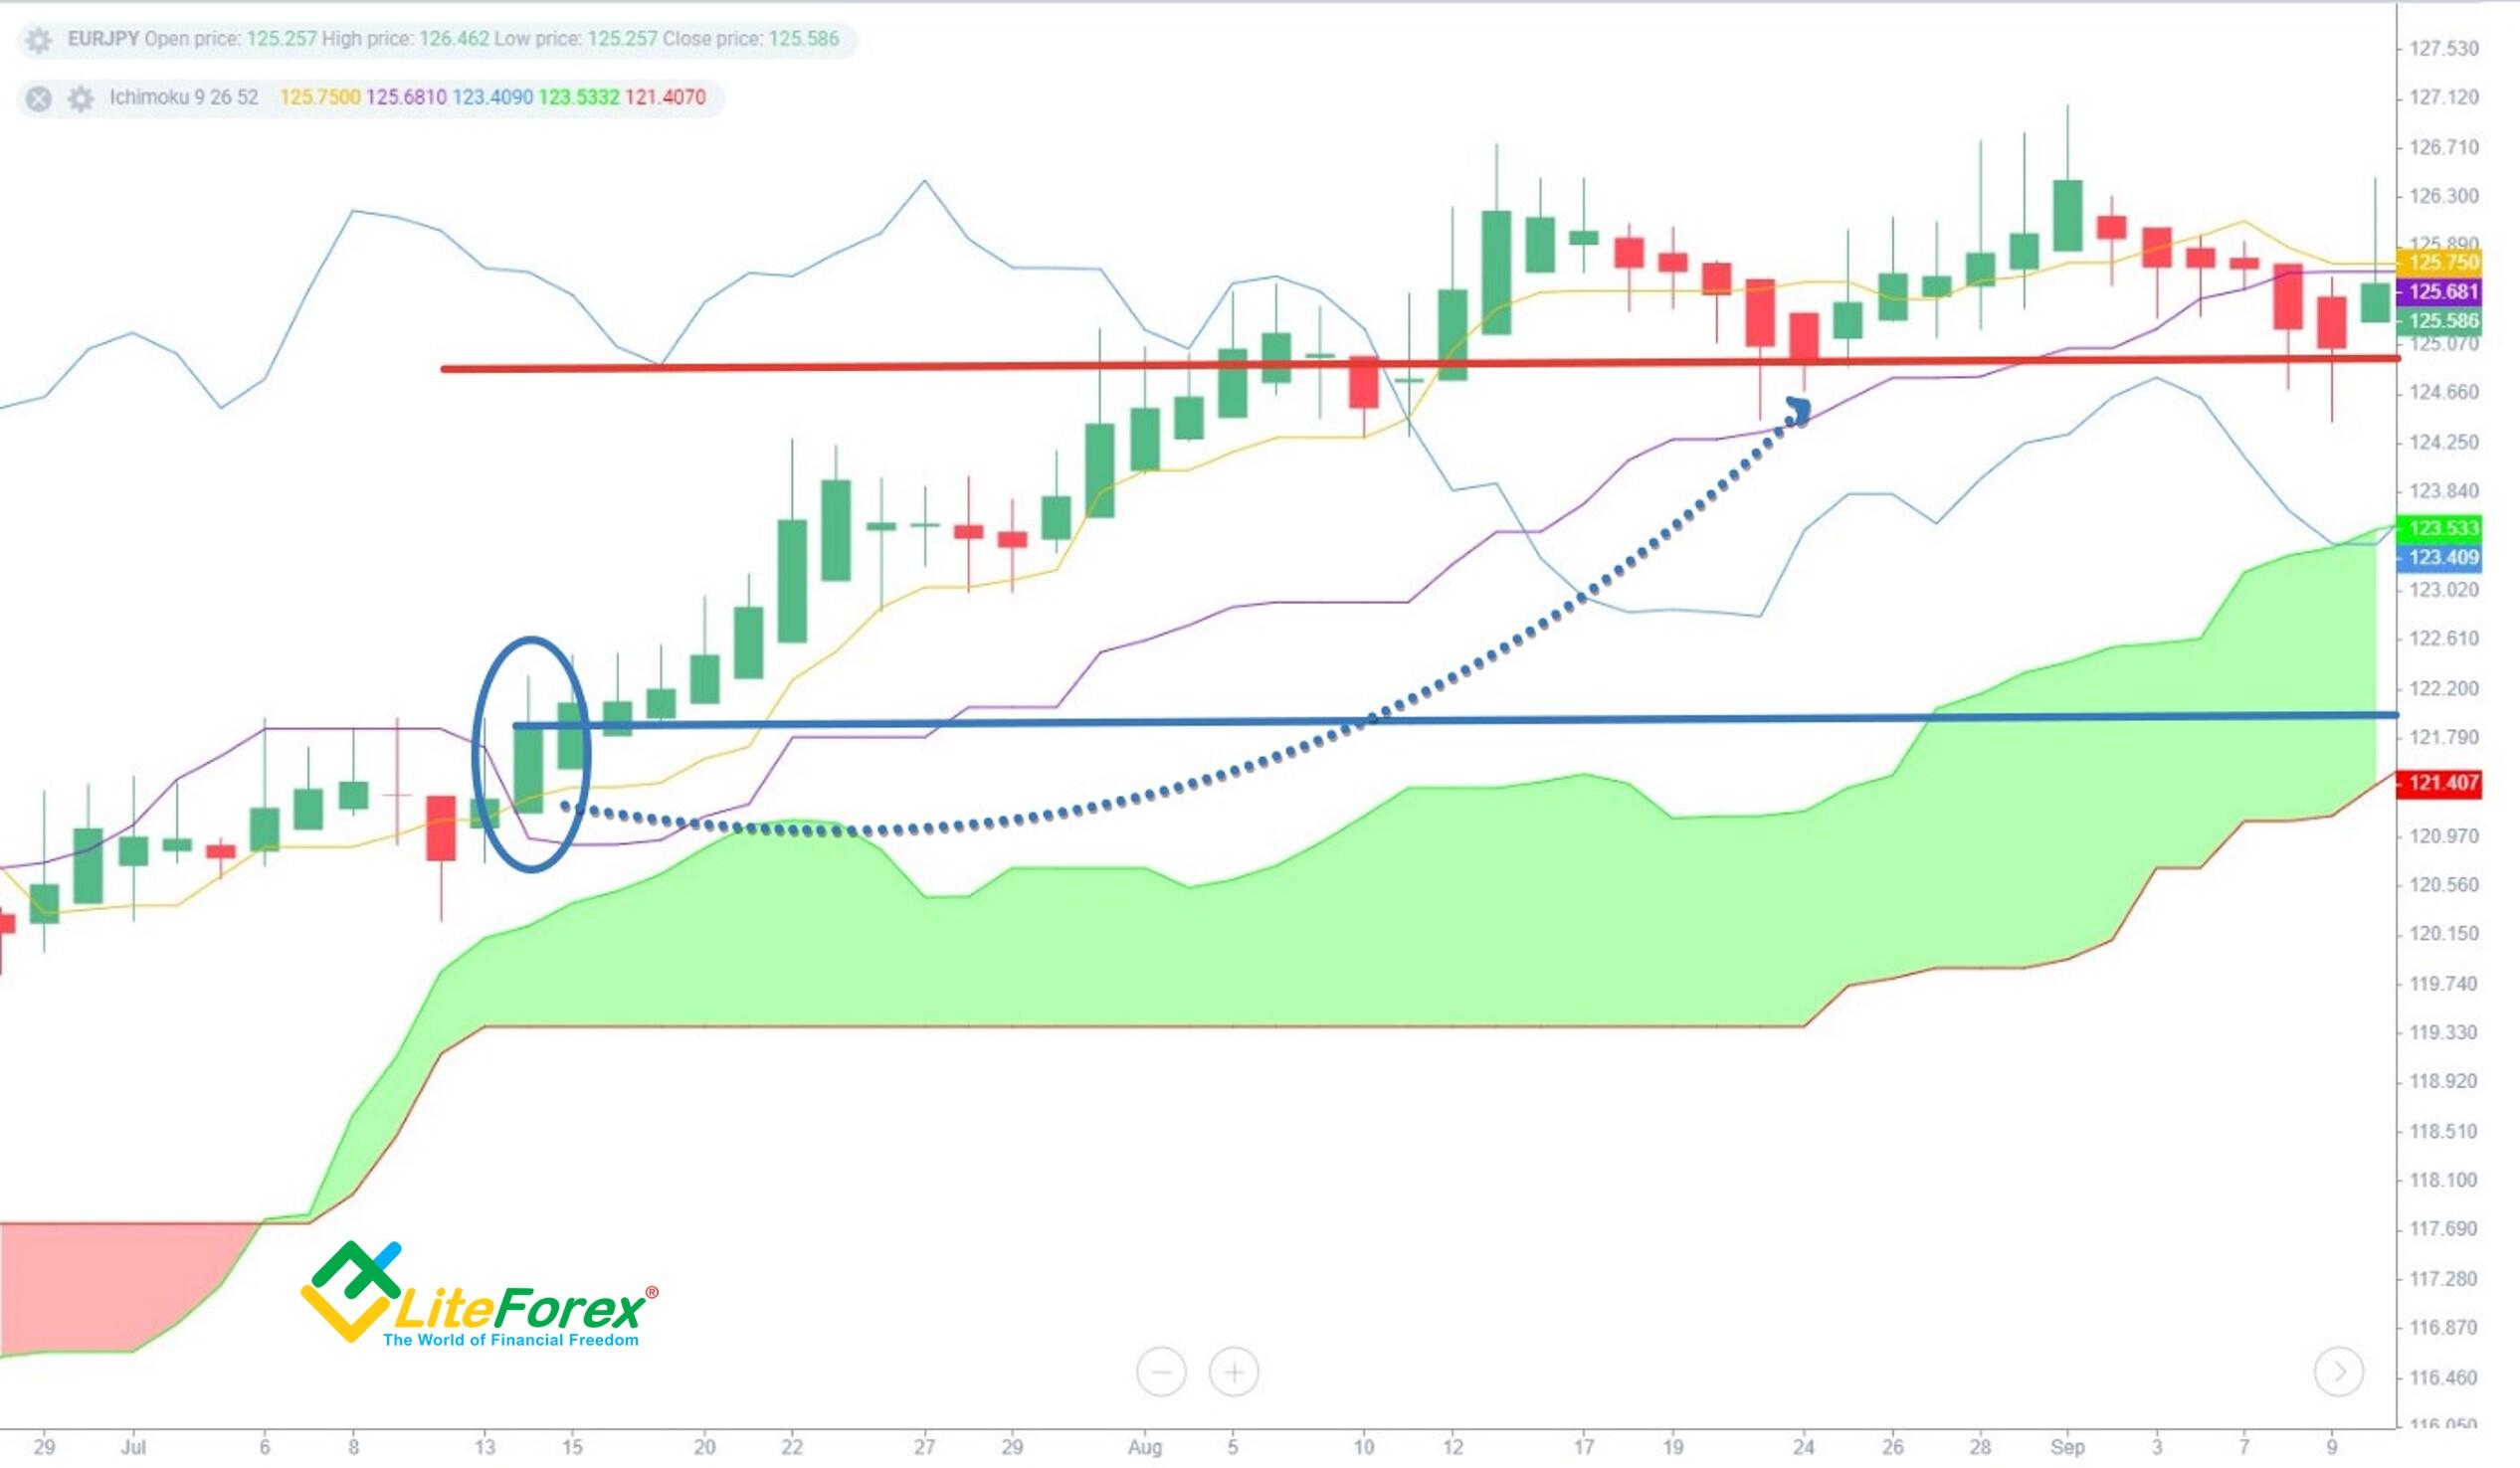
After a price rollback by a specified amount, a trailing stop is triggered. As a result, the long position is closed with a profit.
Start trading right now
How to use Heiken-Ashi Indicator With MT4
The Heiken-Ashi MT4 indicator is the standard set, so you don’t need to download it.
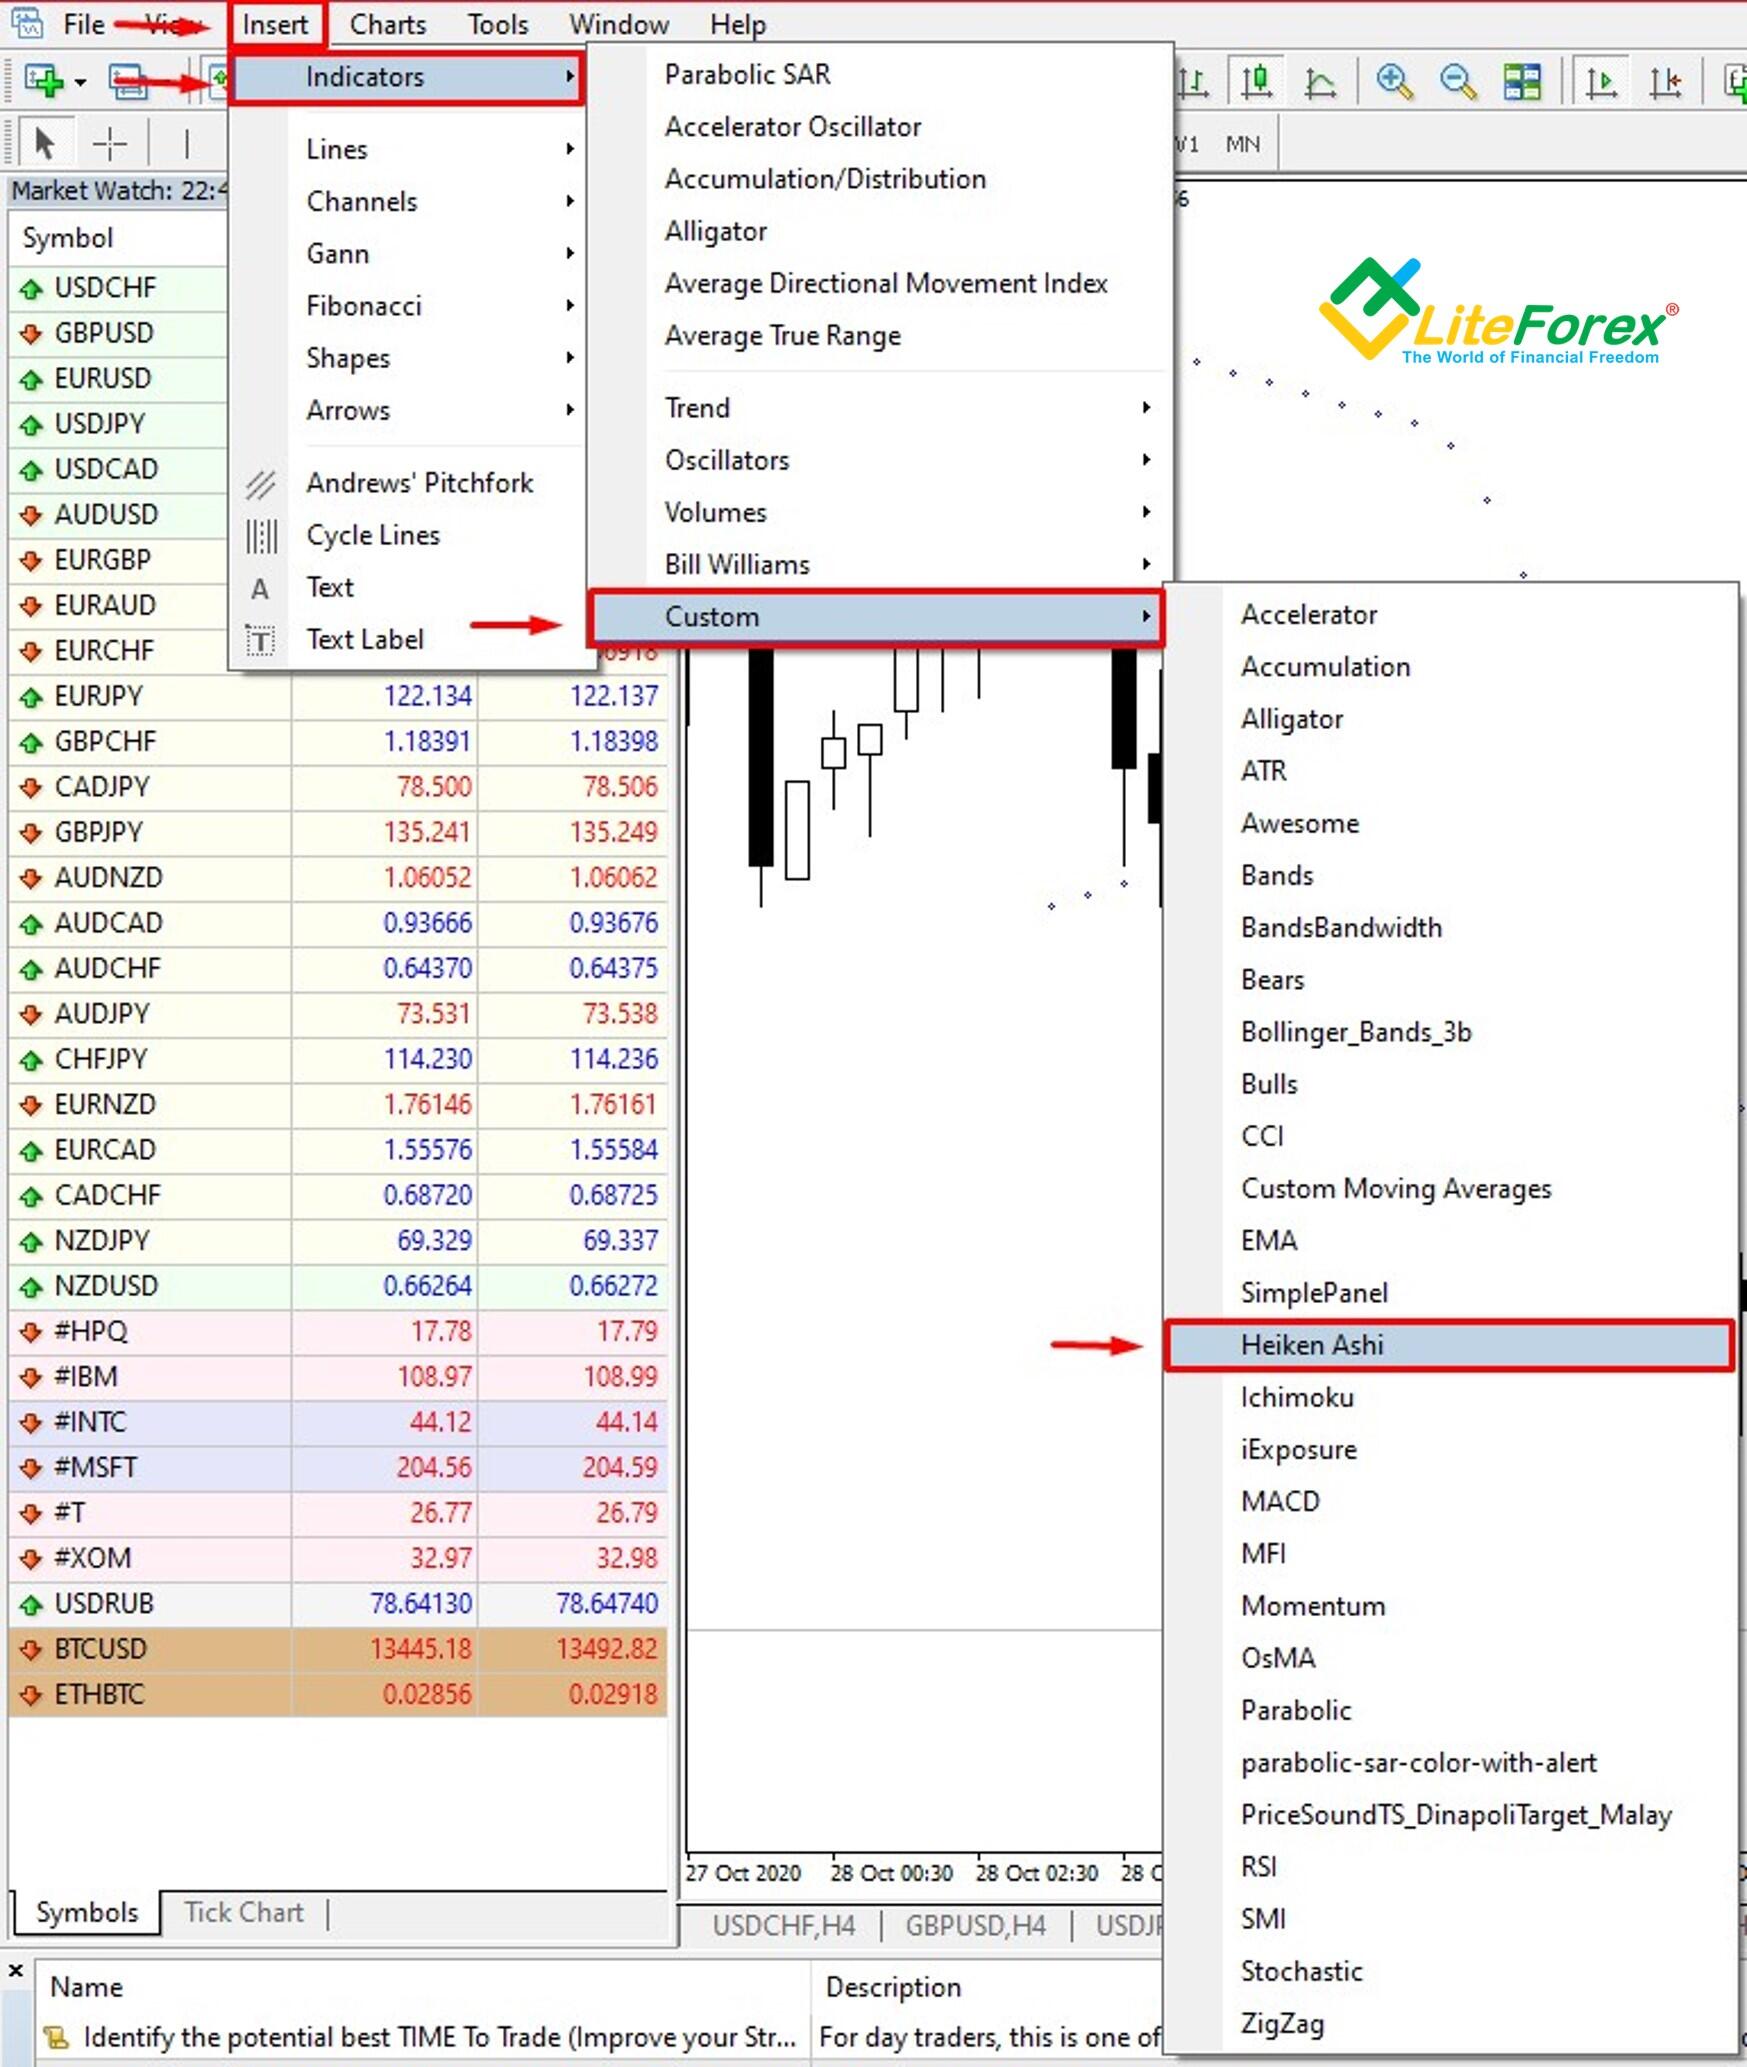
To add the indicator to the chart, open the View tab in the MT4 main menu. Select "Indicators" - "Custom" - "Heiken Ashi".
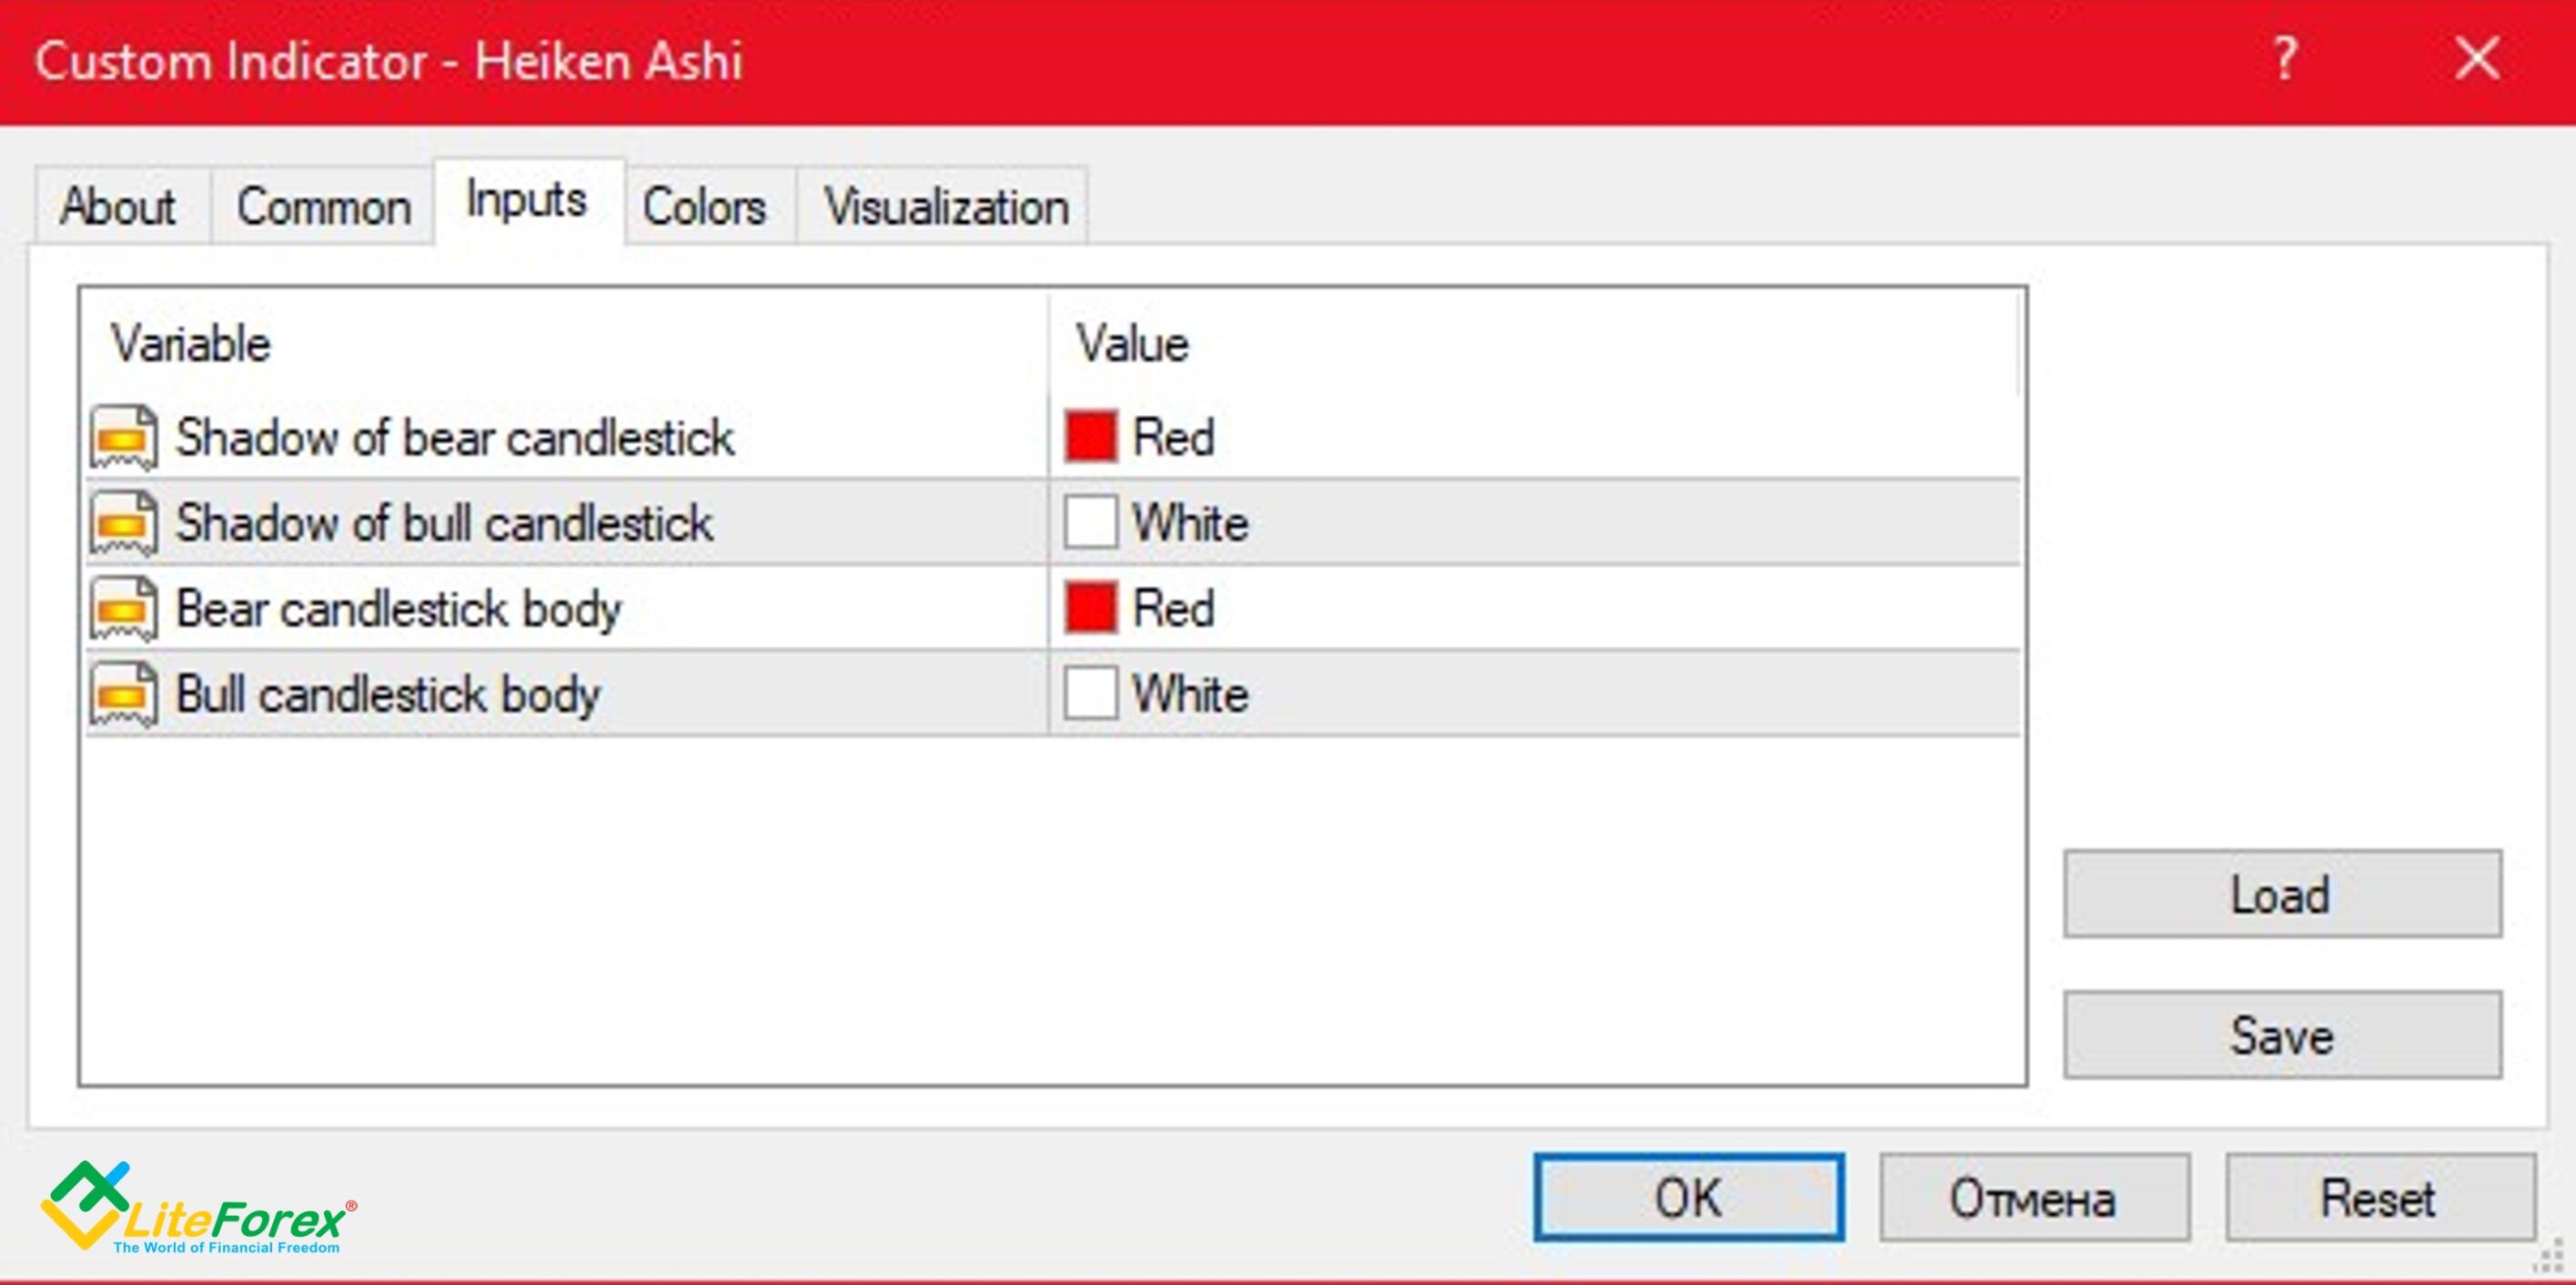
This will open the indicator settings. To add it to the chart with default parameters, click "OK". Most of the parameters are the same as for other indicators. I talked about them in detail in "Bollinger Bands Indicator in Forex Explained".
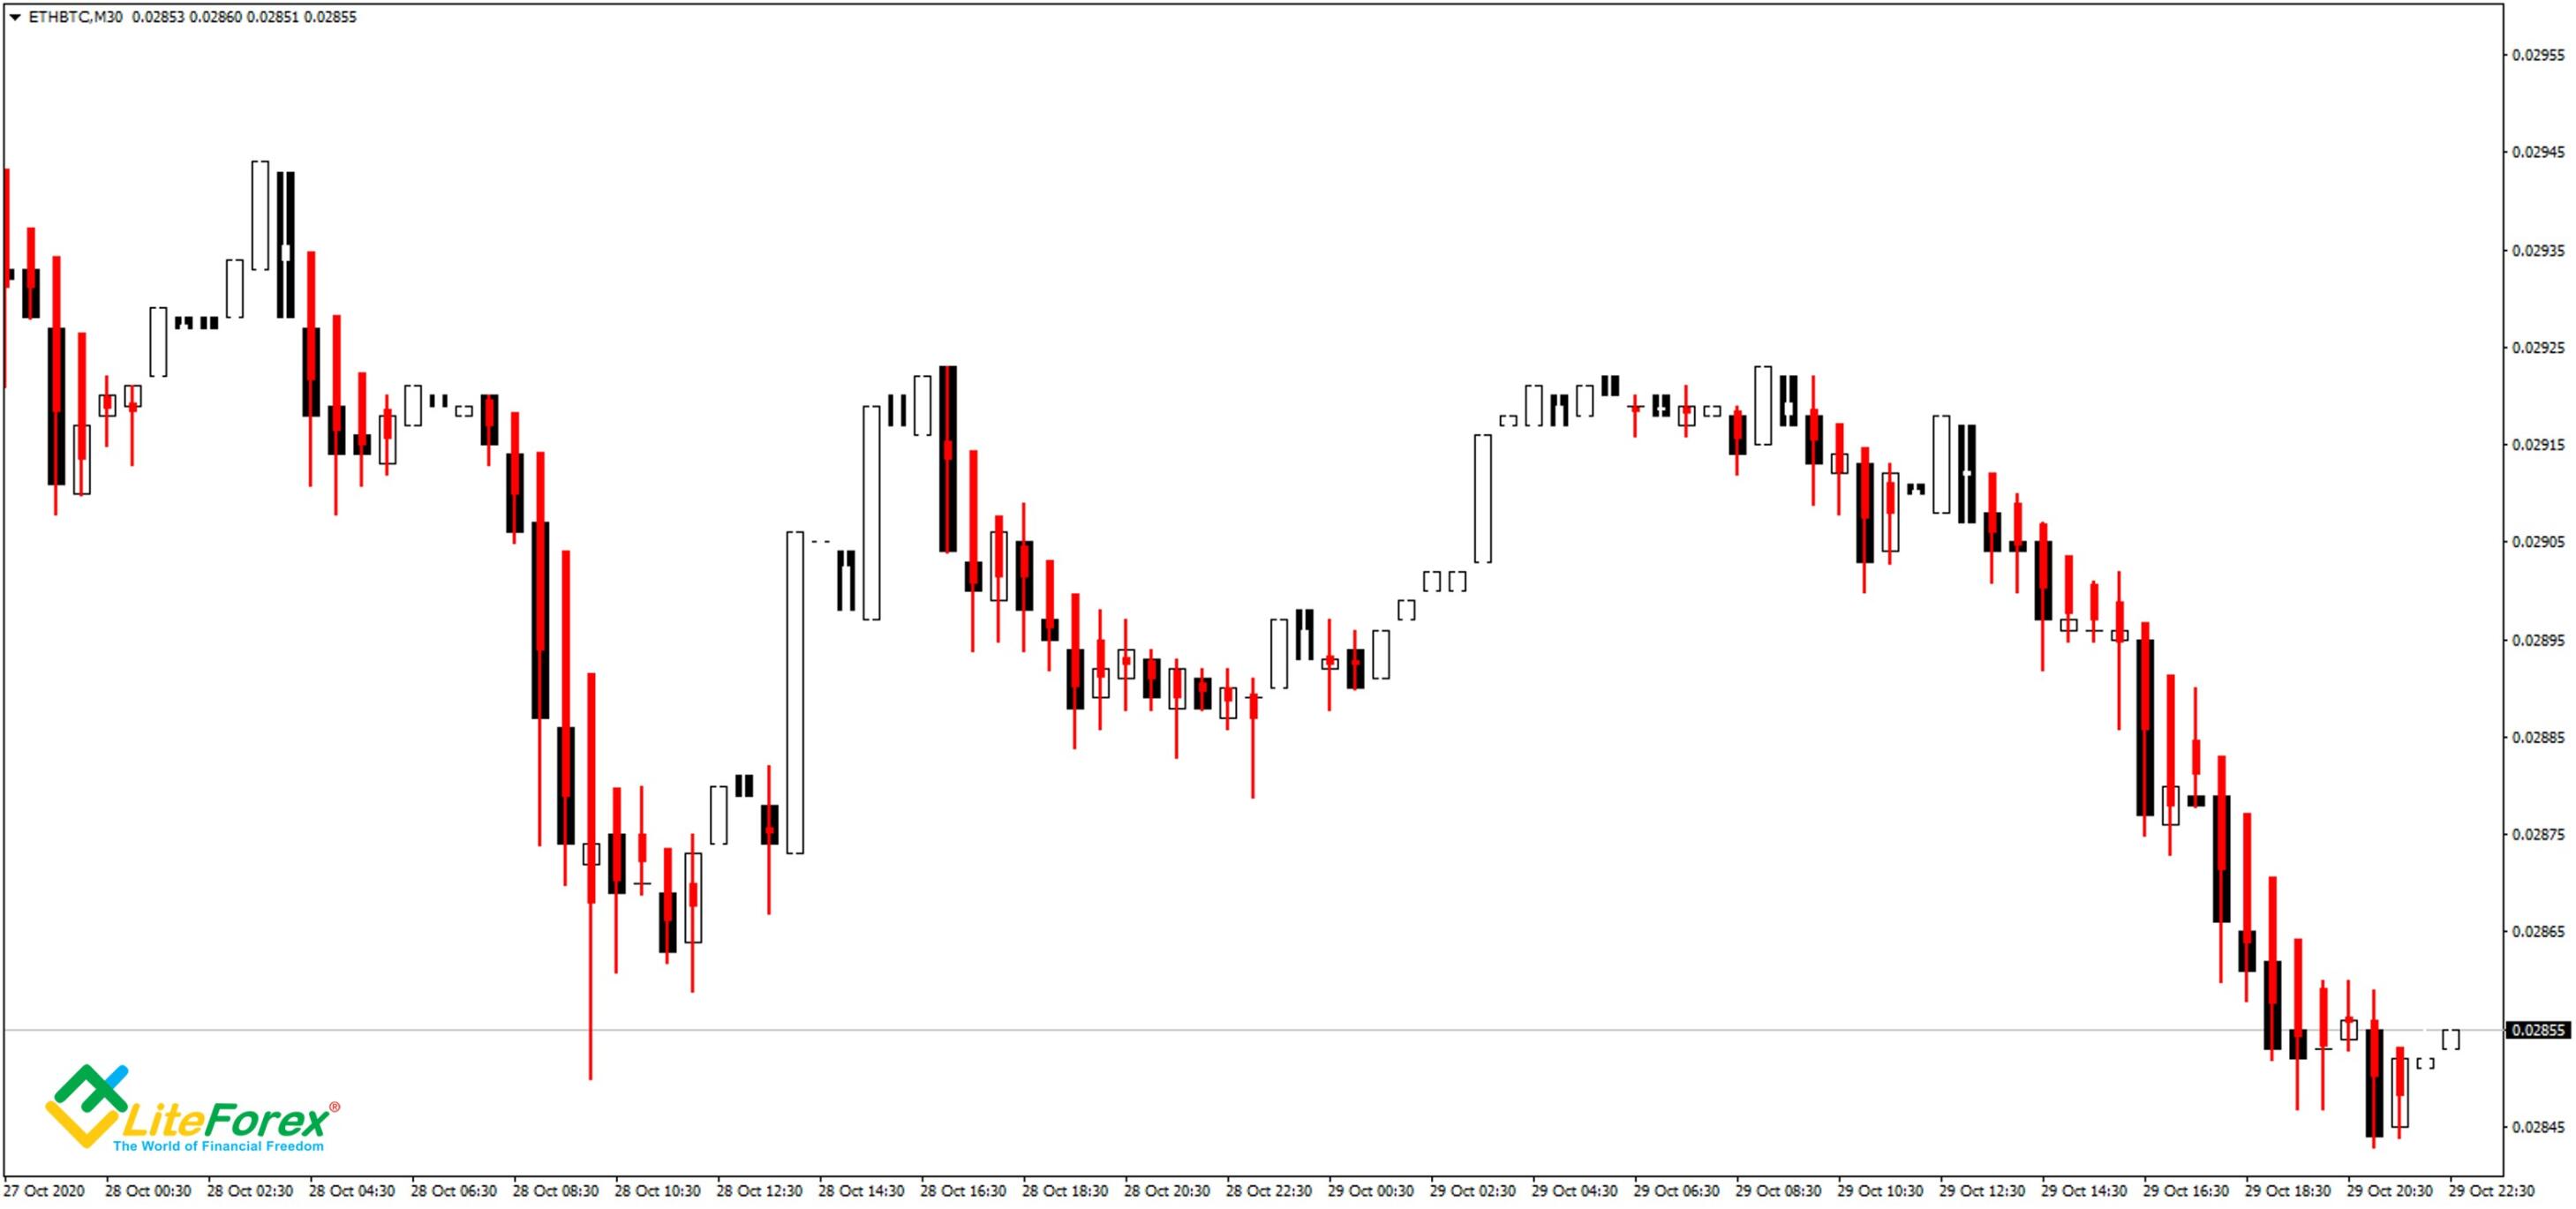
Now, let's see how to use the Heiken-Ashi indicator. By default, it’s shown over Japanese traditional candlesticks like in the image above. This isn’t very convenient since the indicator overlaps with the usual bars, not replacing them like in the online terminal.
Because of this, I recommend installing lines instead of candles.
Another peculiarity is setting green for bullish bars. If you use a black background, there is no need to change anything. With a white background, growing candles will merge. However, even with the right settings, I think the way that you use Heikin-Ashi charting tool becomes less informative. Because of it, I prefer using the LiteFinance terminal.
Benefits and Limitations
Let’s consider the pros and cons of Heiken-Ashi:
Pros | Cons |
The HA charts become clearer visually. The amount of market noise is much lower. | Due to its design, candles reflect the market with a slight lag. |
Easy to use | The number of candlestick patterns and Price Action signals is inferior to Japanese traditional candlesticks. |
Indicators based on Heiken-Ashi give less false signals. | Signals may lag more than on Japanese candlesticks. |
It makes it easy to trade on small timeframes, so it is great for scalping. |
|
HA candles can be used in almost any trading system. |
|
Heikin-Ashi vs Renko
In the image above, you can see that Renko chart fully realizes the goal of filtering out market noise. Renko bricks don’t show patterns like Japanese traditional candlesticks or take time into account. They react exclusively to price data changes in points for a certain period of time. The market picture is often visually different from Heiken-Ashi candles because Renko doesn’t consider sideways price movements. On the Renko chart, there are no black ovals for the market flat.
Renko’s huge disadvantage is that most indicators won’t show an accurate picture.
Find more information about Renko standard candlestick charts here.
Comparing the market noise filtering, Heikin-Ashi charts is a perfect balance of Renko chart and Japanese candlesticks. However, the ability to use Heikin-Ashi candlestick charts with indicators is a big plus.
Heikin-Ashi indicator FAQ
Heiken-Ashi charts is a smoothed version of Japanese traditional candlestick charts. Opening and closing points, as well as highs and lows, are determined by averaging the current and former bars’ values or taking the highest and lowest ones. This makes Heiken-Ashi less responsive to minor market fluctuations, although not fully reflecting the price data movement.
Each candle of the Heiken-Ashi chart shows a graphical depiction of the averaged Heikin Ashi open, Heikin Ashi close, max, and min Japanese candlesticks. We need to remember that Heikin Ashi means average bar in Japanese. Essentially, a usual Heikin Ashi chart is redrawn into a kind of moving average price, only using candlesticks.
Heiken-Ashi indicator is calculated based on four parameters. The opening price is a sum of the opening and closing prices of the previous HA candle divided by two. The HA close price is the result of the sum of the opening price, the HA close price of the current candle, the maximum and minimum values divided by four. The highs and lows are the highest and lowest values among the Heiken Ashi close and open bars’ prices and the extremum of the current Japanese candlestick.
I prefer more traditional trading strategies. First, I determine the trend. Then, using candlestick patterns, the changing candle shape, and technical analysis, I identify the pivot point. After a signal, I open a position. To lock profits, I use either a trailing stop or a trend reversal signal.
The easiest way is to open traditional charts in LiteFinance online terminal. It will immediately replace traditional Japanese candlesticks with smoothed ones. Also, you can add Heiken-Ashi indicator to MT4 as an indicator. However, smoothed Heiken-Ashi candles will overlap with regular ones. Therefore, the latter will have to be abandoned in favor of the price data line.
Heikin-Ashi candlestick chart is a trend indicator and can give false signals in the sideways trend. However, due to its design, the flat’s price noise is less noticeable compared to Japanese candlesticks, helping to avoid losing trades.
In MT4, Heiken-Ashi indicator is included in the standard set of technical tools, so it doesn’t need to be downloaded. To add it to the chart, open the "View" tab in the MT4 main menu. Select "Indicators" - "Custom" - "Heiken Ashi". After that, I recommend changing the chart to "line".
Intraday trading involves opening and closing multiple positions during the day. Therefore, to enter the market, it’s enough to receive at least two trend reversal signals. For instance, it can be a counter-trend candlestick and a candlestick pattern. Also, I recommend setting stops not too far from the opening level. Exit after a reversal signal, using a trailing stop, or after at least two counter-trend Heikin Ashi candles.
First, identify trends. Then, determine the current trend’s end by analyzing the structure of the Heikin Ashi candles. You can also use candlestick patterns, indicators, or figures of technical analysis. After opening a position, make sure to set a stop loss at the nearest extremum. Then, follow the trend closely and exit after a reversal signal or the start of a counter-trend price movements.
Summary
Japanese technical traders have made a big contribution to stock trading. Heikin-Ashi indicator is a prime example that even a very handy tool like candlesticks can be improved.
If your trading system often provides false signals due to market noise, Heiken-Ashi can be a solution. At the same time, don’t forget that smoothed Heikin Ashi candles are not an all-encompassing technical analysis tool. It should only be used with candlestick pattern analysis and additional indicators. In the article, we analyzed Ichimoku’s example, but I recommend experimenting on your own and trying Heikin-Ashi candlestick trading strategies with other ones that you’re familiar with. Consider including the ones already described in the LiteFinance blog! Subscribe and receive plenty of useful information first-hand from the best analysts and traders.
That's all.
Take care of yourself and your money!
Yours faithfully,
Michael @Hypov
The content of this article reflects the author’s opinion and does not necessarily reflect the official position of LiteFinance. The material published on this page is provided for informational purposes only and should not be considered as the provision of investment advice for the purposes of Directive 2004/39/EC.