DiNapoli levels trading techniques: Dinapoli Target Malay, Price Sound TS, and Dinapoli Targets indicators
Dear friends!
In the training series devoted to the NeoWave theory, I many times referred to the Fibonacci relations and used the Fibo retracements to identify the Elliott waves. Today, I suggest considering Fibonacci levels based on the trading system developed by a professional trader, author, and well-known speaker, Joe DiNapoli, who achieved in trading everything that most traders can only dream of.
Joe DiNapoli’s trading success mostly results from his own trading system. DiNapoli managed to develop an absolutely amazing strategy that combines lagging and leading indicators, which provide together timely and very accurate signals. His trading system is based on Fibonacci levels. However, Joe DiNapoli applied the Fibo levels in such an unusual way that the levels he developed were later called DiNapoli levels.
Today, I will cover in detail all the peculiarities of the DiNapoli trading system so that you can try in practice on your own.
The basic concepts of the DiNapoli trading technique
As I have already said, the DiNapoli levels trading method is based on the Fibonacci levels. However, it employs the simplest horizontal levels: 38.2%, 50%. 61,8%, and 100%. With a bullish trend, lines are drawn from top to bottom, with a bearish trend - from bottom to top. Before I move on to the practice section, I would like to explain the main principles and concepts that we will need in trading with DiNapoli levels.
- Market swing - distance from the beginning to the end of the price movement, or, in other words, the trend. The DiNapoli levels are plotted on the swing. You can find out in the analysis that the price changes its high or low after the correction. In this case, you should increase the swing, i.e move the 100% level to the new endpoint.
- Focus point – the level, the correction starts from, that is built after the last price move in the trend direction. There may be multiple points on the chart in one swing zone. When an extremum changes, another focus point appears on a chart, it doesn’t replace the old one.
- Reaction – a quite popular trading term that means finished correction in a trend movement. Several reactions may form in a single swing.
- Fibo node - price chart point, at which the correction movement ends. Joe DiNapoli advised working only with nodes found between 38.2% and 61.8% of the previous trend. ll nodes located below 38.2% are too weak, while the ones exceeding 61.8% are too strong (meaning a trend may not recover).
- Target levels – levels where the position will be closed. These are common Fibonacci extensions 161.8% and 261.8%, extended to the last correction. We shall set take profits at these levels.
Basic principles of the DiNapoli method
The DiNapoli trading system suggests following a few mandatory rules:
- The number of swings on the chart is always equal to the amount of focus numbers.
- Reactions are always located to the left of the focus numbers they are connected with.
- A focus number is connected to a reaction if it is the highest price point after the reaction in a bull trend. Accordingly, the focus number will be the lowest point in the downtrend.
- The higher the timeframe, the lesser the number of reactions. When the price detects a strong resistance/support, you are able to find necessary reactions and swings that are not displayed on higher timeframes by using lower ones.
Let us see how the DiNapoli levels are detected in practice on the example of the BTCUSD chart.
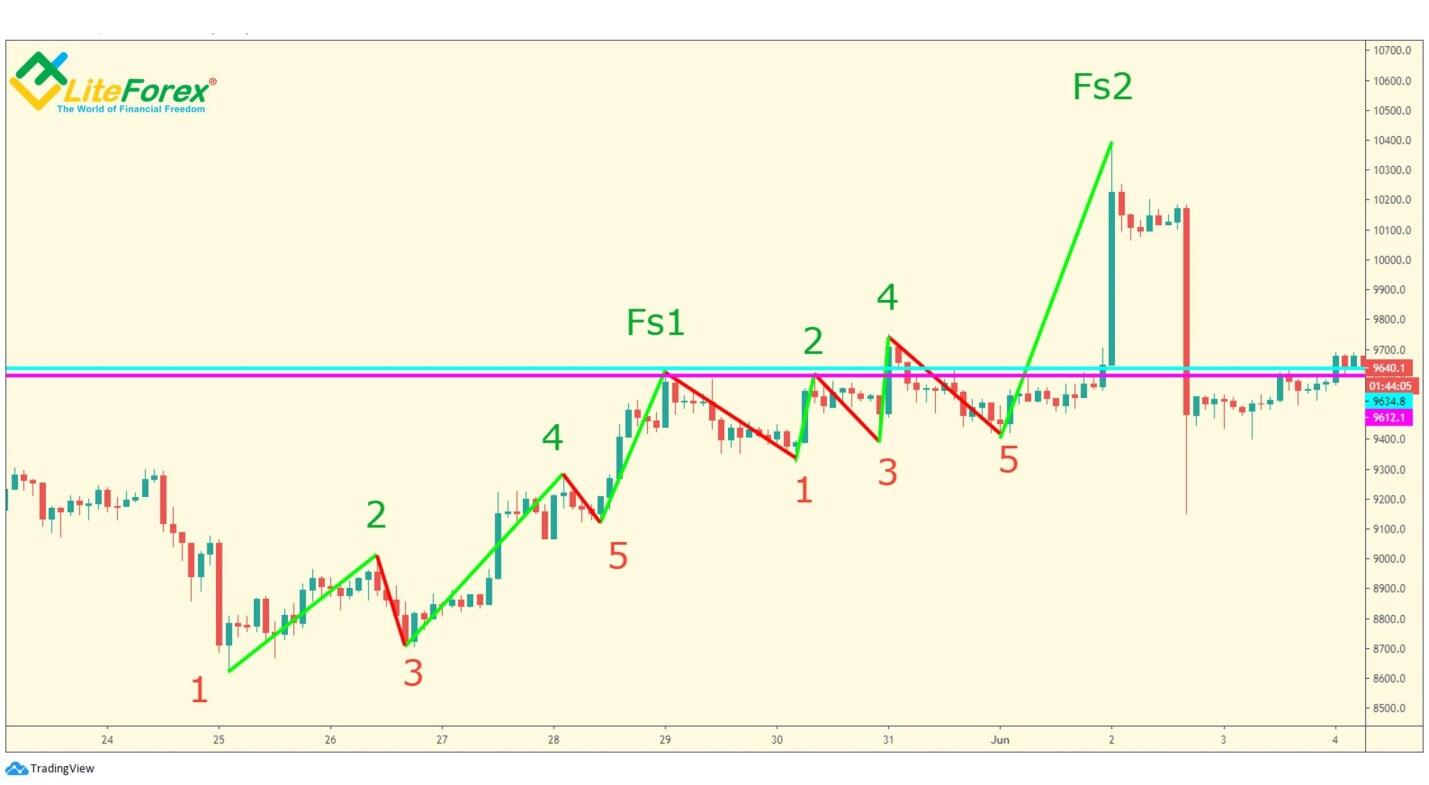
The green lines in the chart mark the sections where the price moves in the trend direction (I will call them mini-swings). The red lines mark reactions or corrections, whose endpoints (Fibo nodes) are marked with red numbers. The combination of mini swings and reactions form a market swing that ends with a focus point marked in the chart with the label “Fs1”. When I wrote that a swing can include several focus points, I meant the extreme points of mini swings. When analyzing the first focus point was the left-most top number 2, which was followed by the reaction market with number 3. After that, the price break through the high, and so, the swing continued developing. At the end of the second mini-swing on the left number 4, there formed the next focus point (5), which was followed by the correction number 5. The second focus point replaced the first one. Finally, we got the ultimate true focus point Fs1, after which the next swing started. As the price failed to break through the local high (the pink line that marks the level of mini-swing 2 is below the turquoise line that marks the local high Fs1). Next, there forms the next swing that is composed of a few mini-swings and ends with the focus point that is labeled “Fs2” in the chart.
Construction of DiNapoli levels
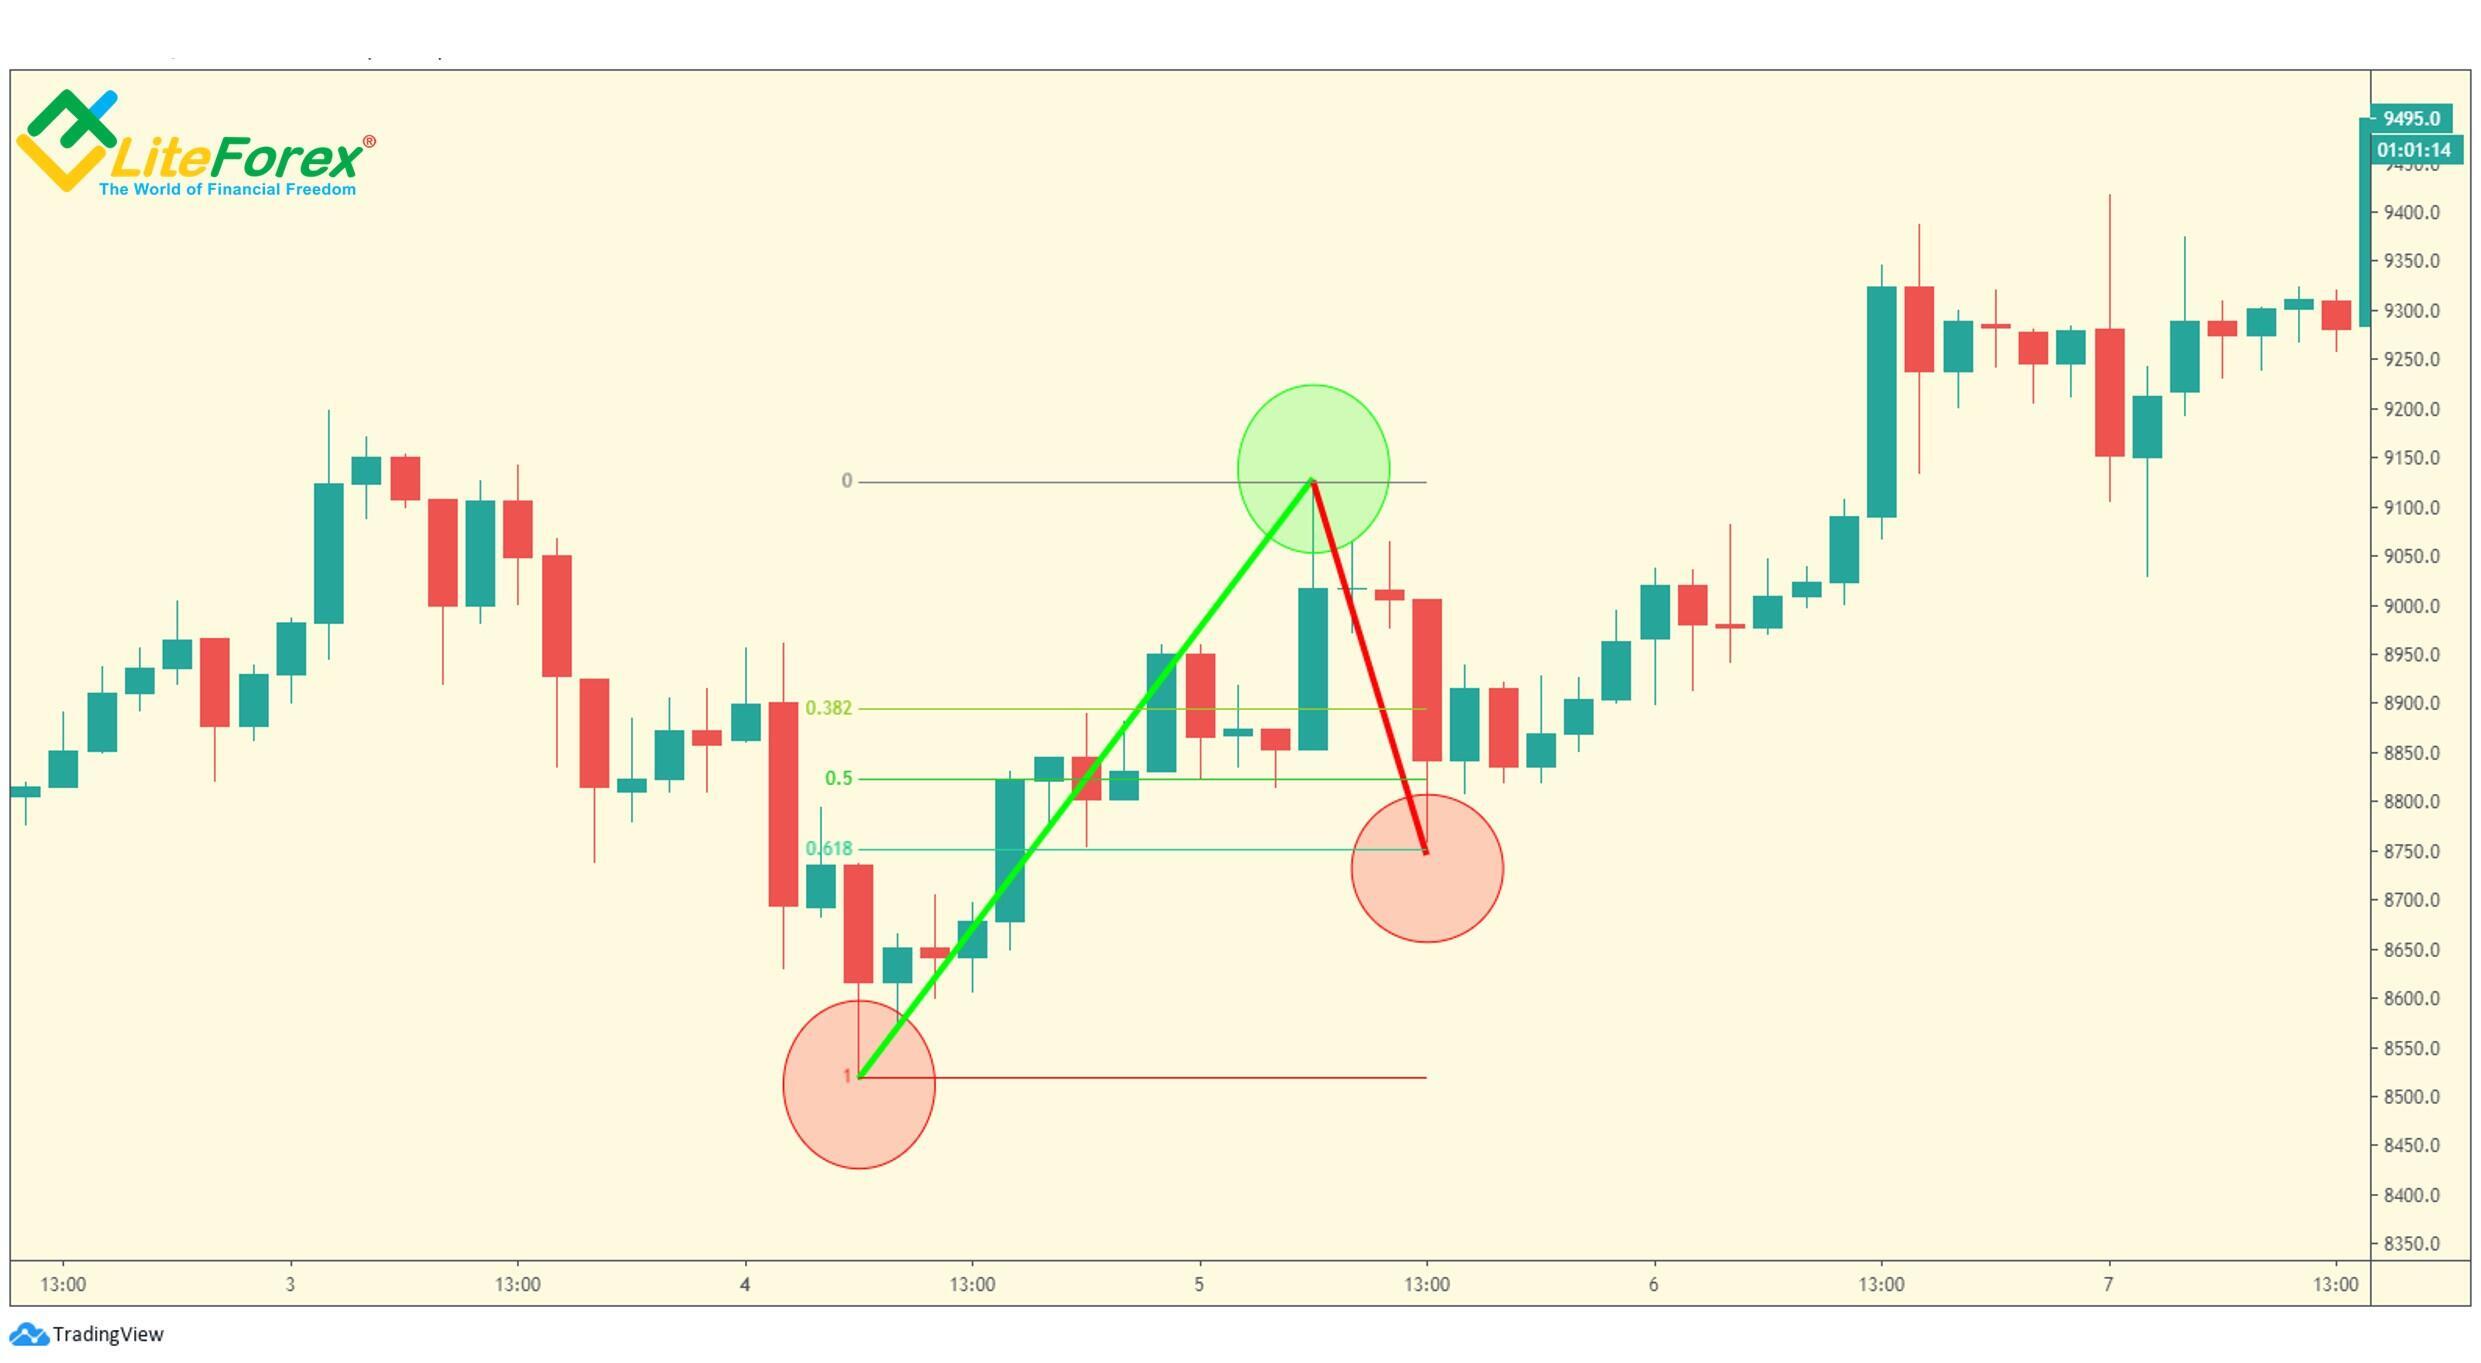
The red circle in the chart marks the beginning of the swing, the local low price point. Next, we identify the local high, it is marked with a green circle in the chart. This point is the focus point now. The swing is followed by a reaction that ends at the next local low marked with the right red circle in the chart. We need the following Fibonacci levels to build DiNapoli levels: 0%, 38.2%, 50%, 61.8% и 100%. The levels are arranged form 0% to 100% in the direction of the current trend. For an uptrend, level 0% is set at the focus point, and level 100% is at the beginning of the swing. In a bear trend, the levels are arranged in the opposite order. Note that the reaction ranges about 61.8% of the swing in terms of price. Therefore, the reaction is also considered in the analysis.
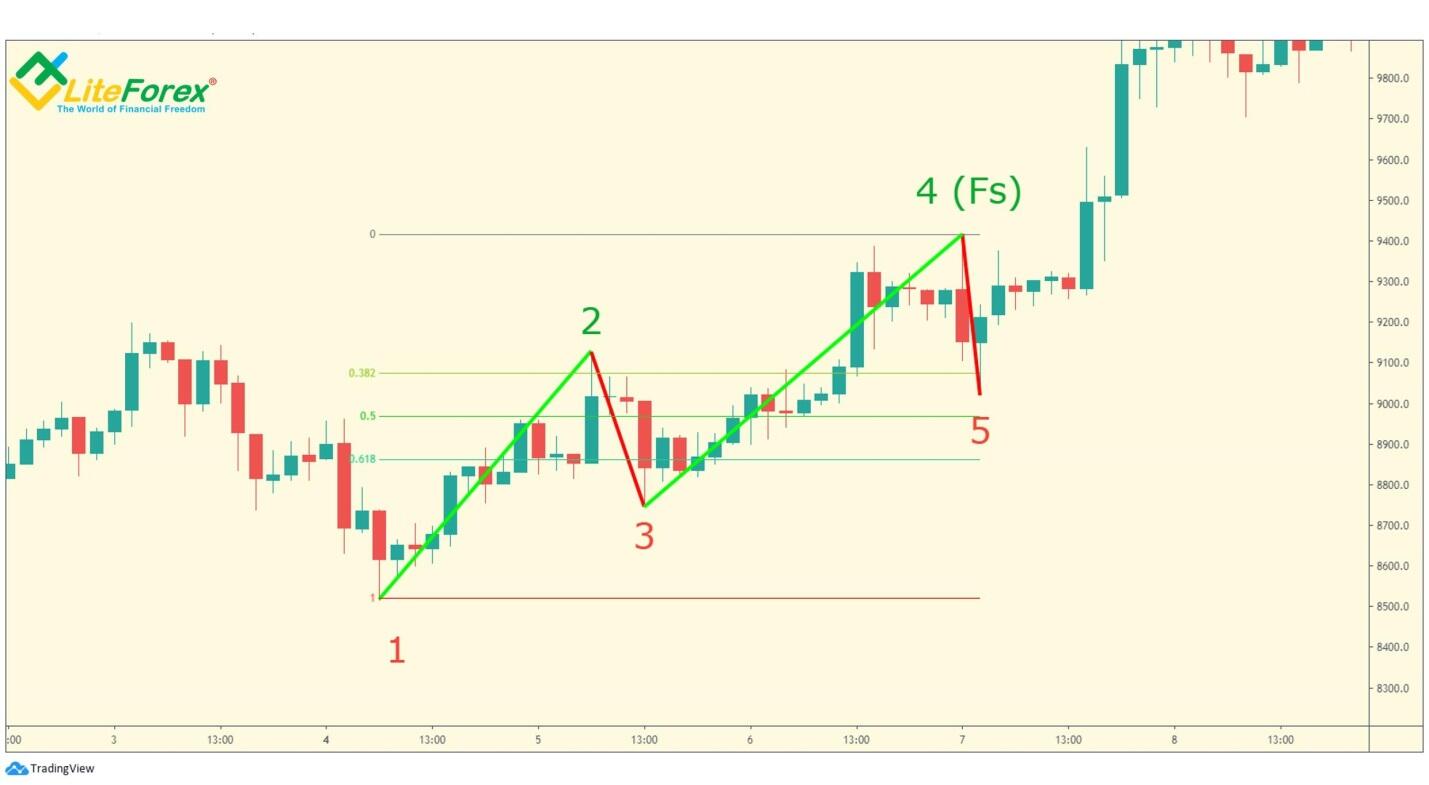
In further analysis, we identify the swing extension to the next local high labeled with “4 (Fs)”. The previous swing we analyzed is an element of the new, extended one. It is marked with numbers 1,2, and 3 in the chart. Remember, “Fs” means that the next local high is the focus number. By the way, to determine the DiNapoli levels, entry, and exit points, you can employ standard tools in the terminals. For example, The Fibonacci levels are found in almost all on-line trading platforms, including LiteFinance. Alternative tools are special indicators. The most popular DiNapoli levels indicators are:
- Dinapoli Target Malay is a simple technical tool, which attaches
- Dinapoli targets metatrader 4 indicator. This is another DiNapoli levels indicator, it is similar to the previous indicator, easy to set up and user-friendly.
- Price Sound TS Dinapoli Forex indicator. It is an analog of the previous indicator that displays Fibonacci levels in different colors and displays the distance of the current asset price from each of the levels. Additionally, the TS Sound trading indicator notifies the user of a trading signal with a text notification and a sound signal.
Construction of DiNapoli levels extensions
DiNapoli levels trading method is also based on the Fibonacci extensions grid. I will explain how to construct the grid. The common grid uses the levels of 0%, 100%, 161.8%, 261.8%. They are the levels of exiting the position or the target points for setting a take profit.
The extensions grid is constructed according to the following rules:
- For a bull trend, level 0% is at the low of the reaction, the next levels are above it.
- For a bear trend, level 0% is at the high of the reaction, the next levels are below it.
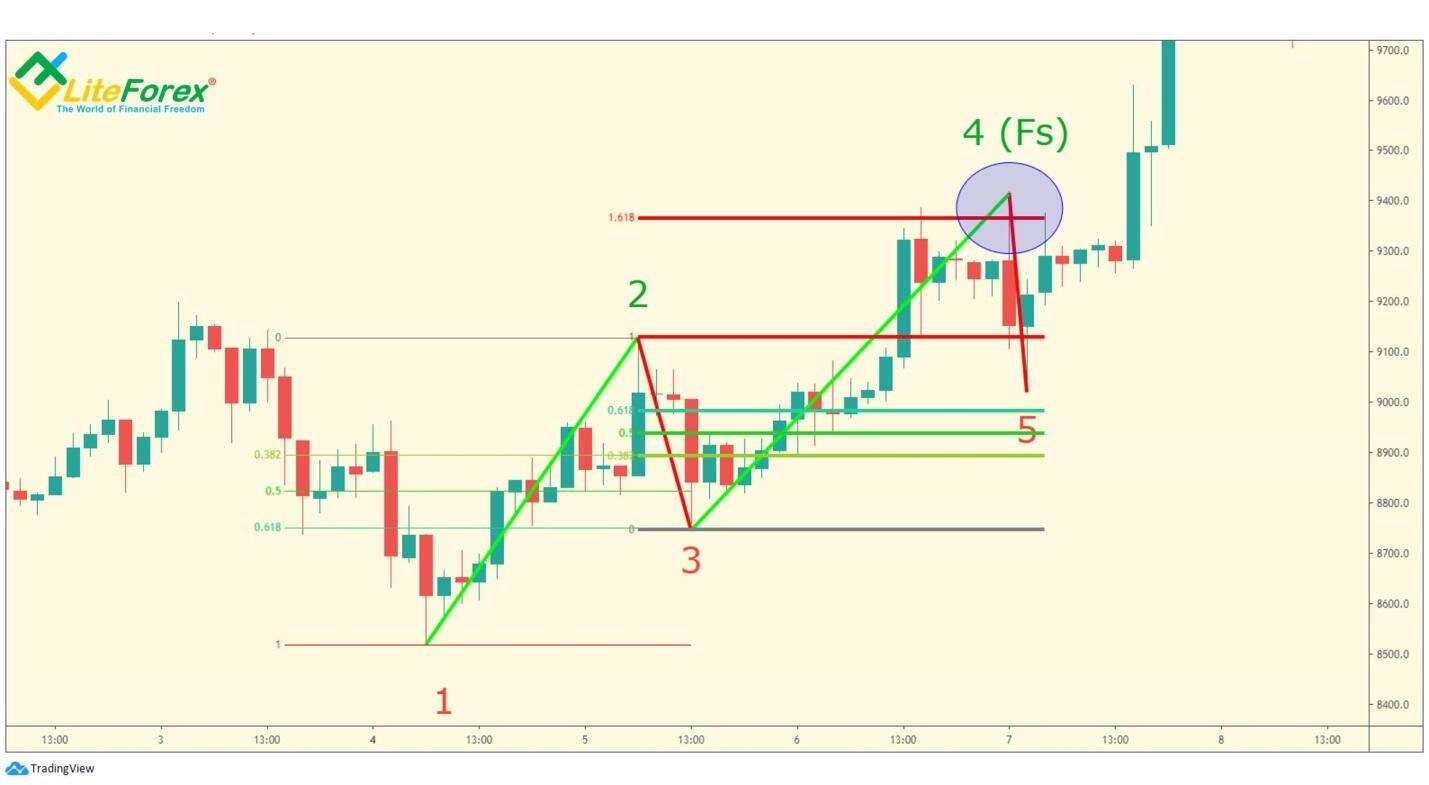
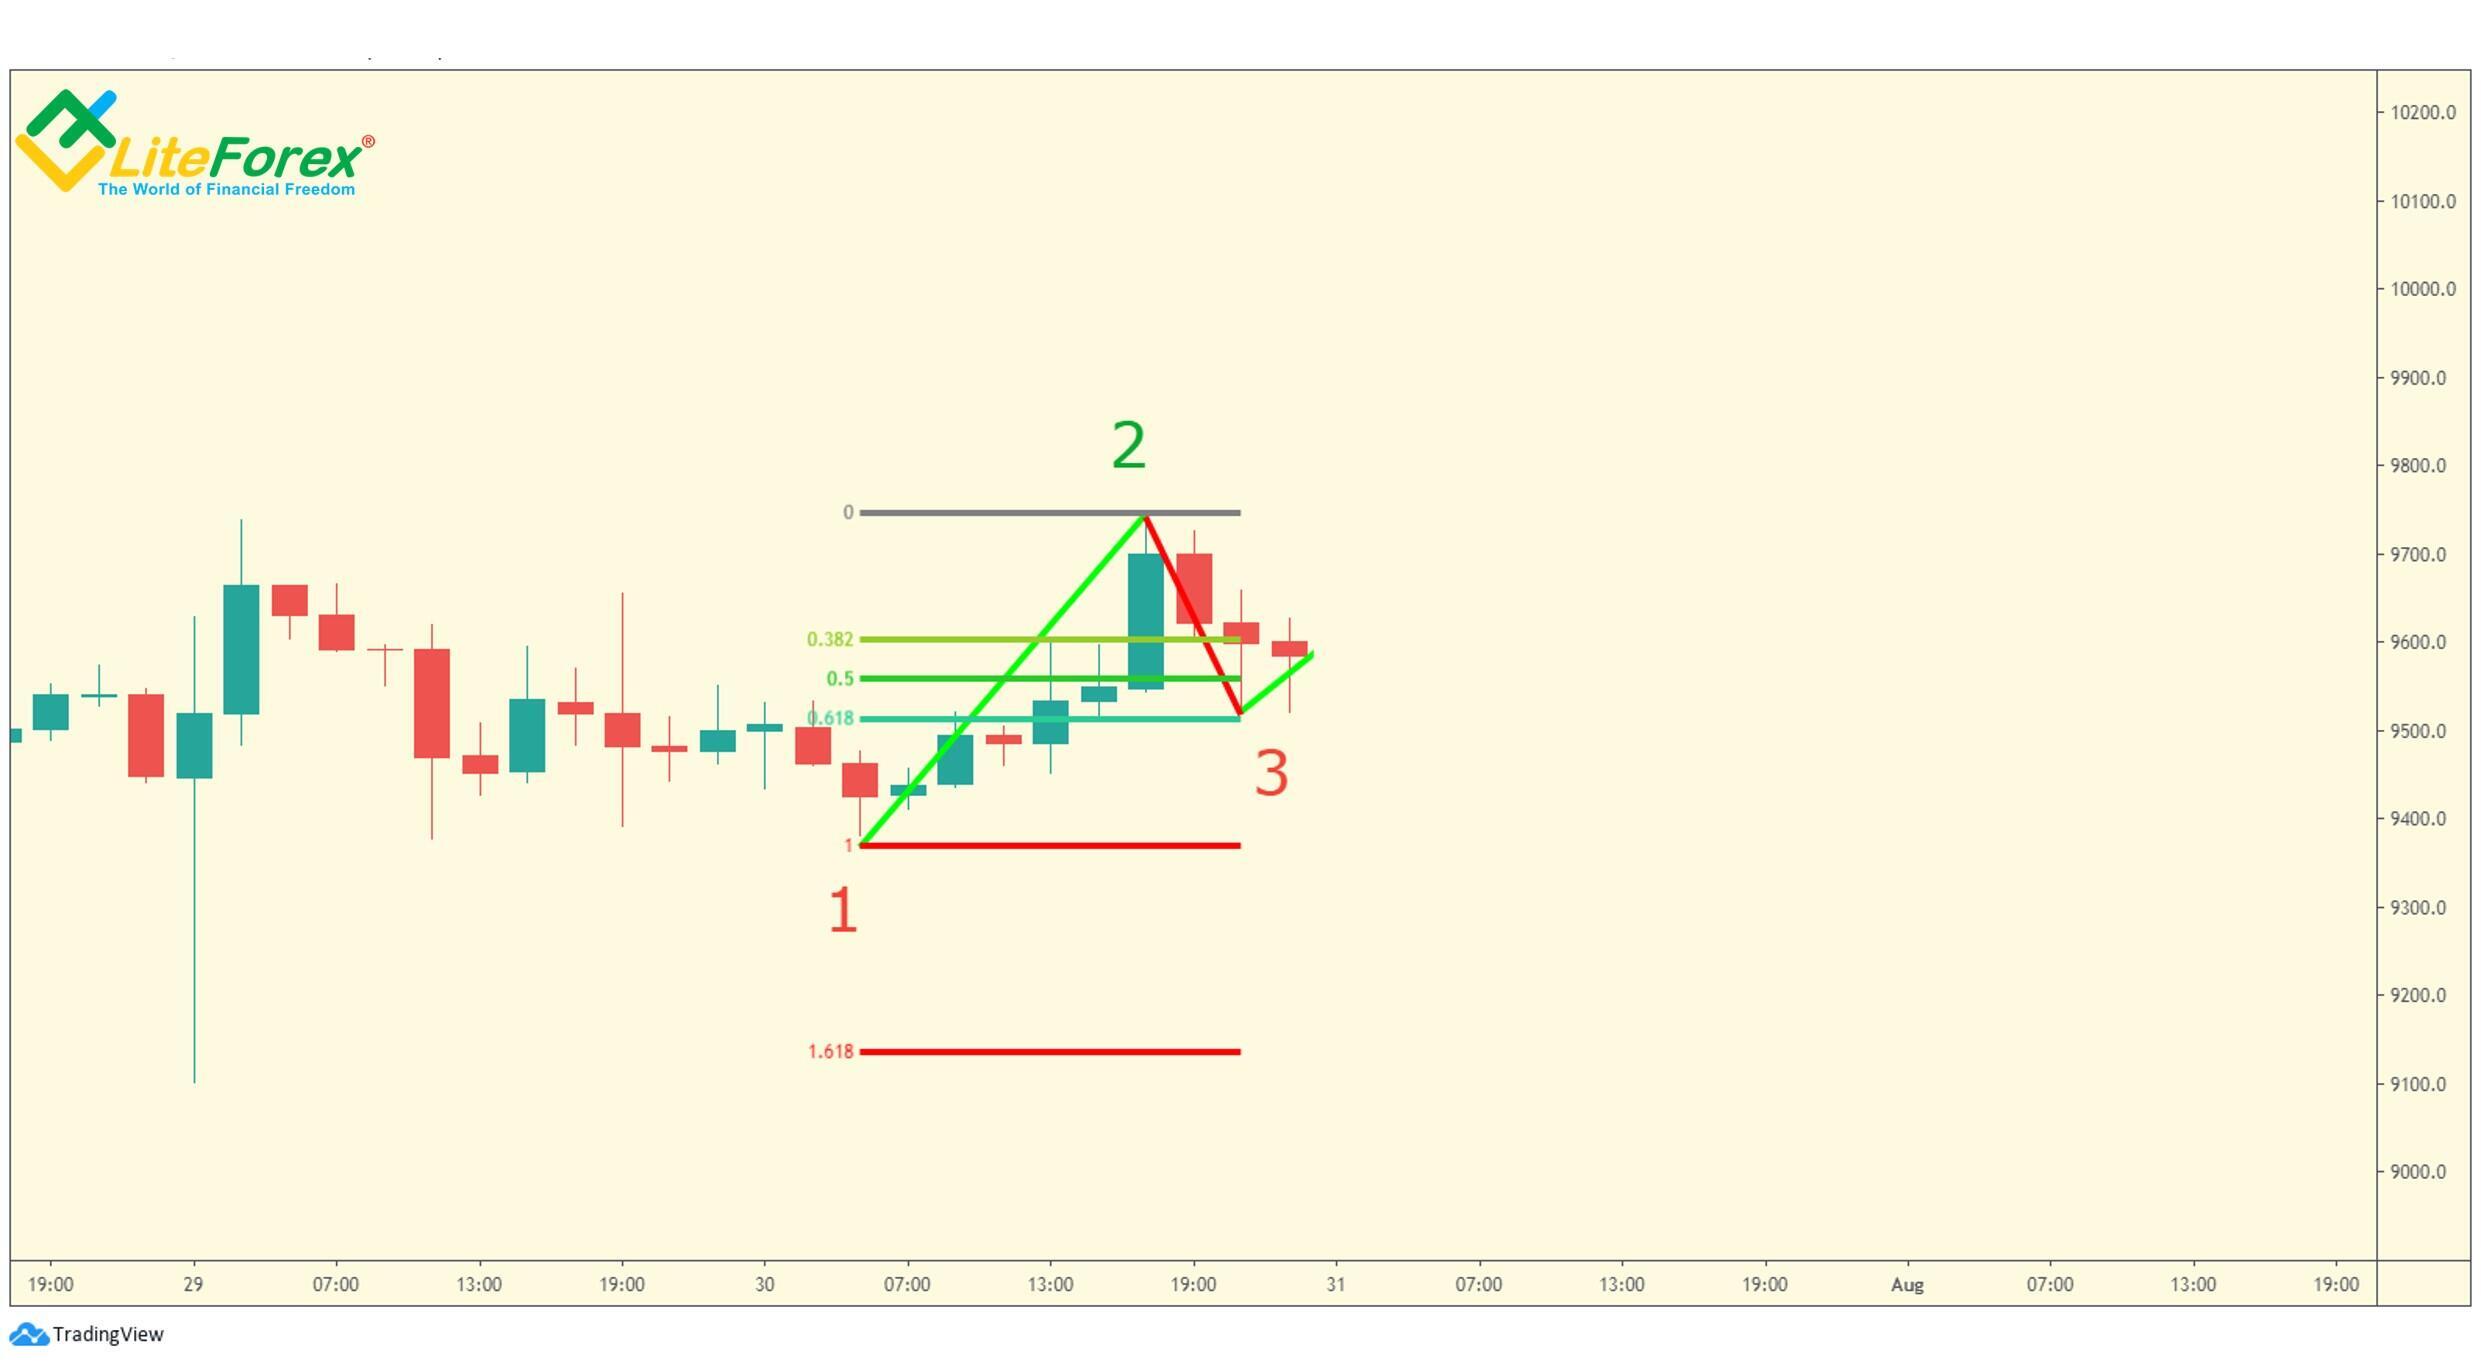
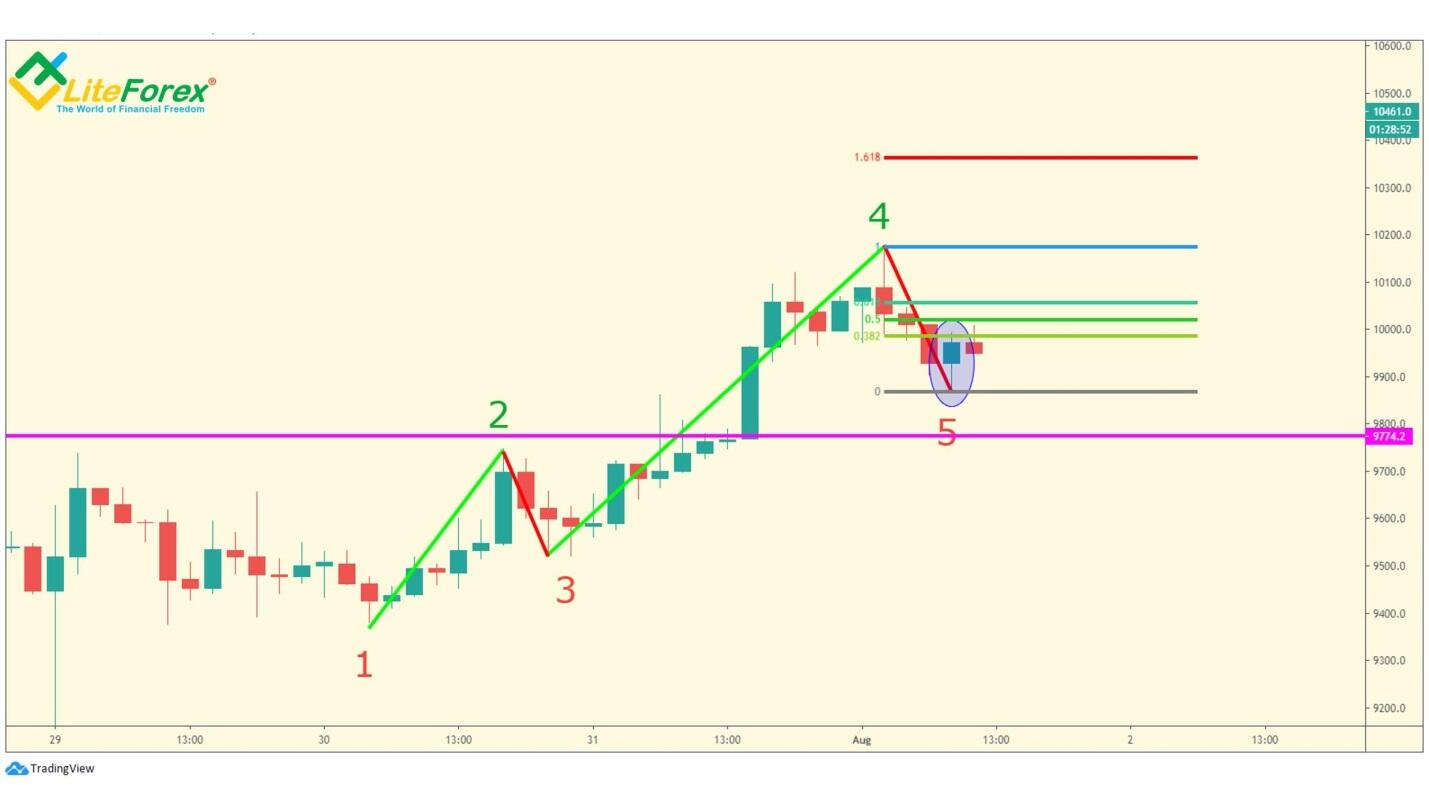
The above chart displays an example of the DiNapoli extensions grid. We should go through the following steps. After the reaction to the preceding swing has formed (it is marked 3 in the chart), we check its authenticity. As the price reaction retraces the first swing by 61.8%, we can take it into account and draw the extension levels stating form it. I marked the extension lines with thicker lines in the chart. Level 161.8% of the first swing is the first target point for a take profit. As you from the Bitcoin chart, once the price reaches this level, it rolls back, a new reaction starts forming. If the price went further, we would use the second target level for a take profit, level 261.8%.
DiNapoli Levels trading strategies
The DiNapoli trading strategies can be basically divided into two types:
- Aggressive. The most popular techniques are the Bushes and Bonsai strategies.
- Conservative strategies include the Minesweeper A and Minesweeper B methods.
Let study each of these methods in more detail.
Bonsai trading strategy
This method suggests that the price should roll back from the level of 38.2% and the already formed swing. The trade is entered when the price goes through level 38.2%. A stop loss is set at a distance less or equal to the Fibo level of 50%. A take profit is set at the Fibonacci level of 161.8%.
Let me explain the Bonsai trading strategy on an example.

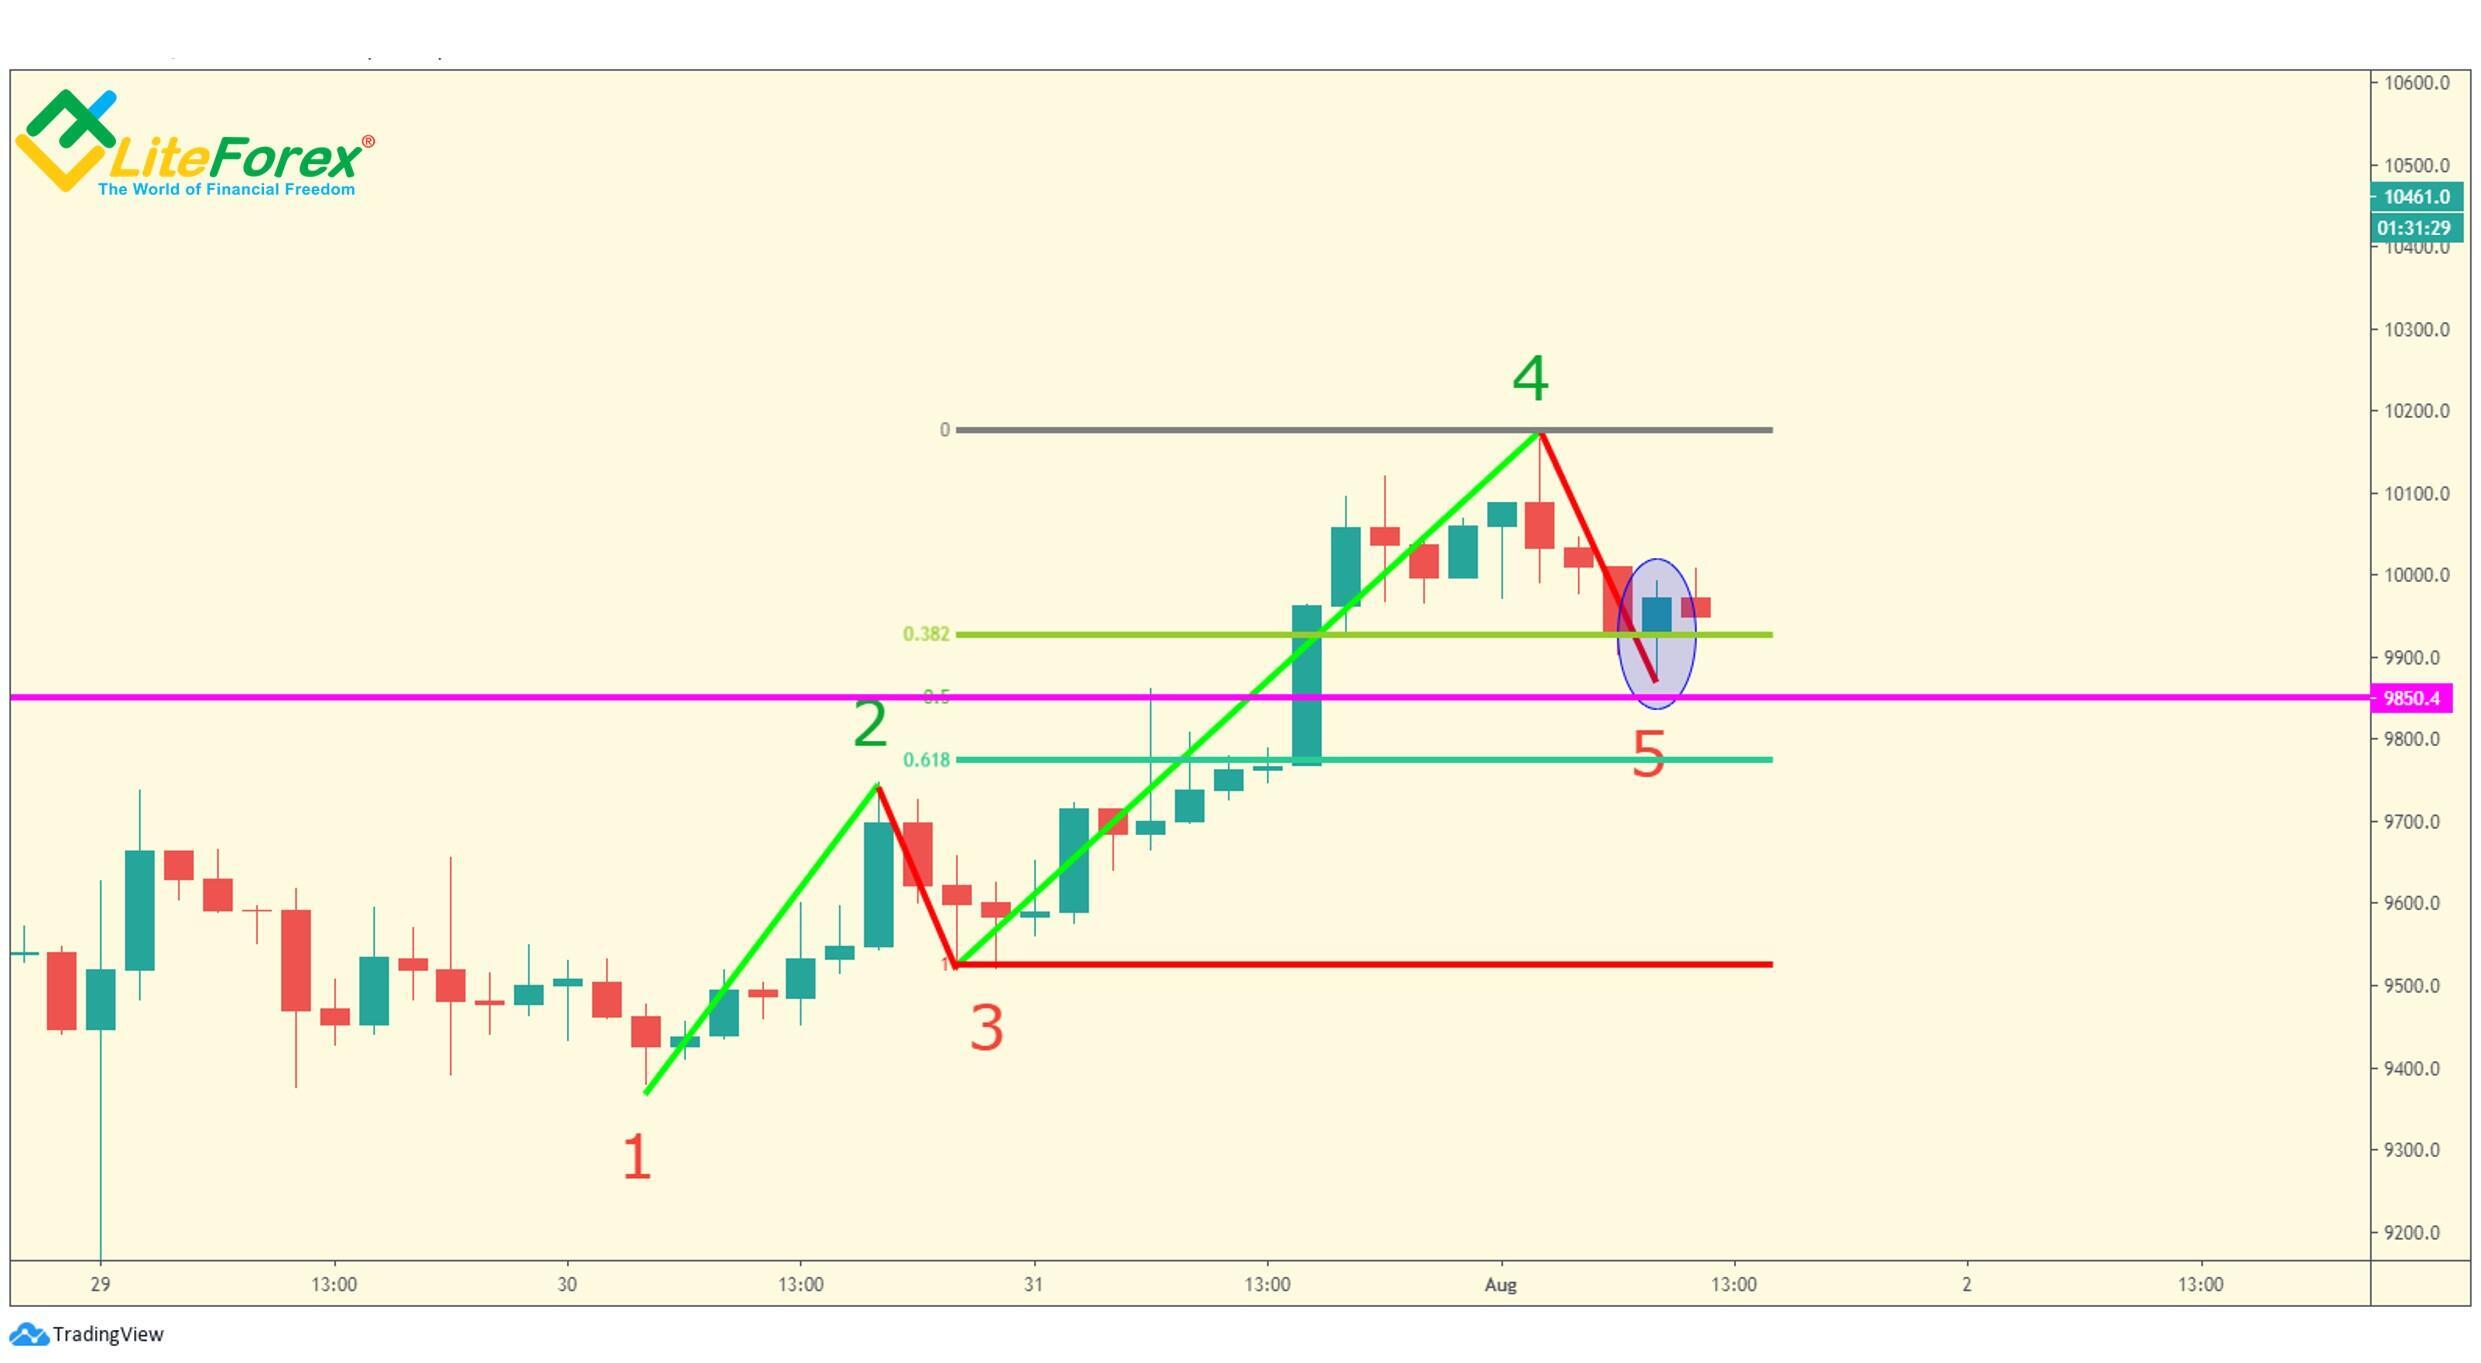
The BTCUSD chart above displays the swing, whose end is marked by number 2. It is followed by the reaction market 3. According to the Bonsai trading method, we presume that the price will retrace from level 38.2%. At this level, we put a long entry once the bar meets level 38.2% (the entry point is marked with the blue circle in the chart). After that, we set a stop loss at the Fibonacci level of 50% (the horizontal pink line).

To identify the target point, we shall draw the DiNapoli extensions grid, starting from the end of the reaction to the focus number of the first swing. The target zone is around level 161.8% of this grid (the red horizontal line in the chart).
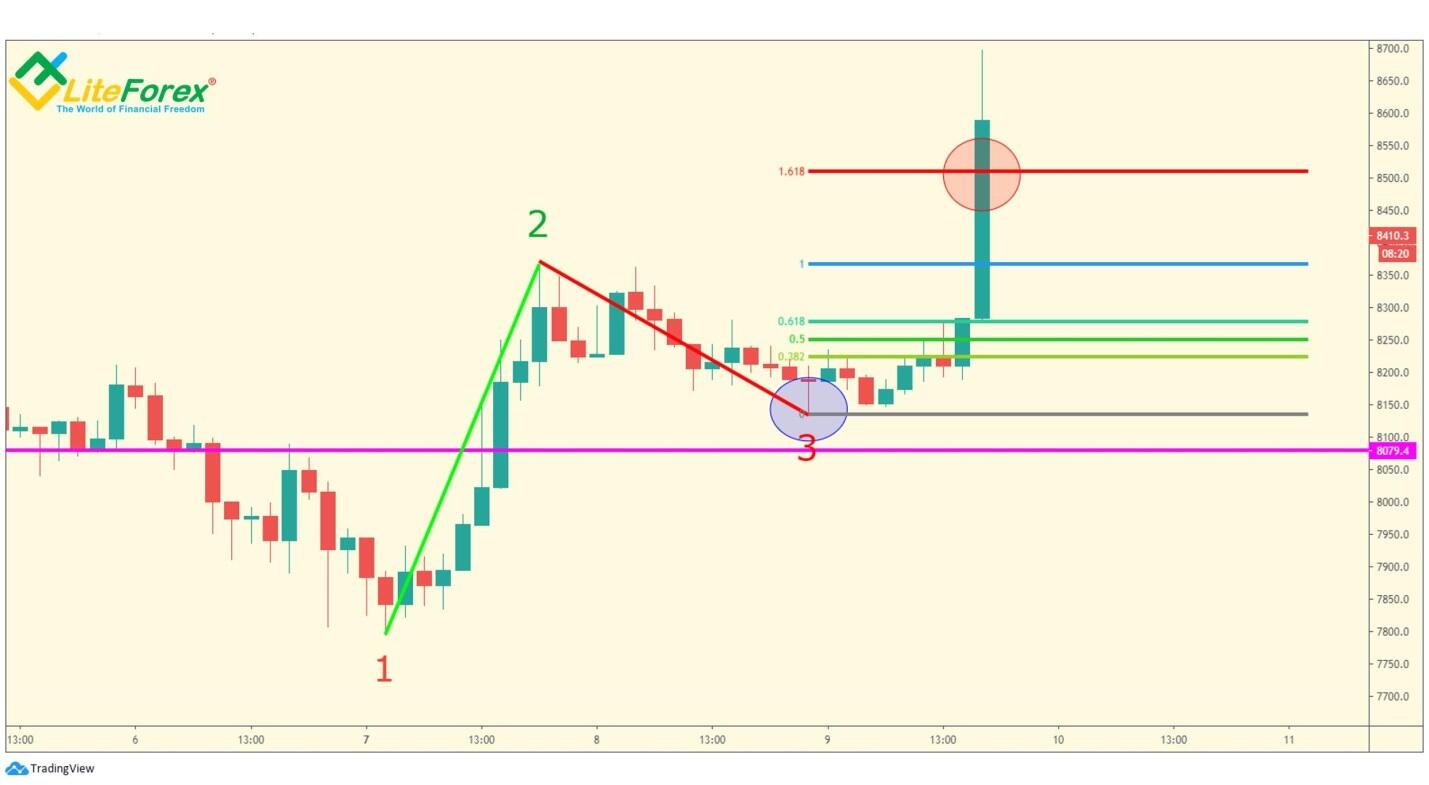
When the price hits level 161.8% take the profit by exiting the trade (the exit point is marked with the red oval in the chart).
The Bushes trading strategy
The DiNapoli Bushes trading strategy is very similar to the Bonsai DiNapoli strategy. A trade is entered when the price crosses the level of 38.2%, a take profit is set at level 161.8%. A stop loss is placed further than the level of 50%. It is usually set around the level of 61.8%.

The chart displays the swing from the previous example. According to the Bushes DiNapoli strategy, the price should roll back from level 38.2%, so, we place an entry here (the blue circle). Next, we set a stop loss at the level of 61.8% (the pink horizontal line).
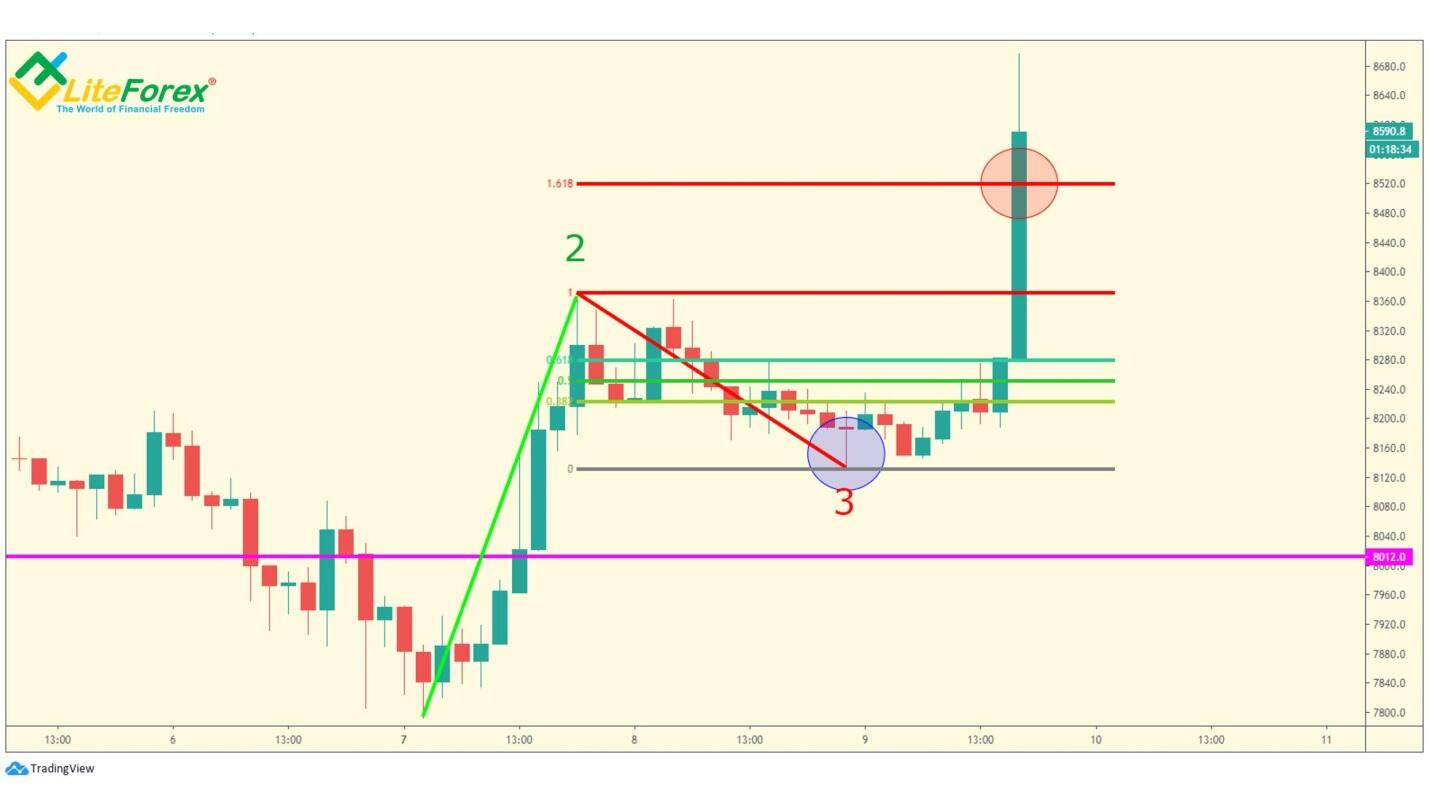
When the price reaches the level of 161.8% the DiNapoli extensions grid, we exit the trade (the red circle in the chart.
DiNapoli Minesweeper A and Minesweeper B strategies
A more conservative and less risky strategy Minesweeper A also suggests entering a trade at the end of the corrective move. However, the trading itself is conducted using safety measures. First, we expect until the first reaction finishes, and there forms the next swing and the second reaction that should end higher than the first reaction in an uptrend, and lower than the first one in a downtrend. When the second reaction completes, we enter a trade. An entry is put immediately after the reaction end when the price goes back in the direction of the main trend. We check if the correction has finished using the second Fibo grid drawn from the beginning to the end of the second swing. The price should break through level 38.2% and consolidate below (in an uptrend) or above (in a downtrend). A stop loss is placed close to the local low (high), and a take profit is at the level of 161.8%, or at 261.8% in case of a sharp price movement.
In the case with Minesweeper B, the position is opened in the way as in the previous strategy, but the position is opened after the third reaction is formed.
Employing the above strategies, we got infrequent market entries. Besides, the trend is not always developing long enough so that could form three corrections, whose price range is between 38.2% and 61.8%. On the other hand, this allows us to sort out false signals, in which the price correction does not become a continuation of a trend.
Let us see how the Minesweeper A trading strategy works on the example.
First, we check the authenticity of the first reaction. Its final point (number 3) is a little higher than level 61.8%. Therefore, this reaction is the first one.
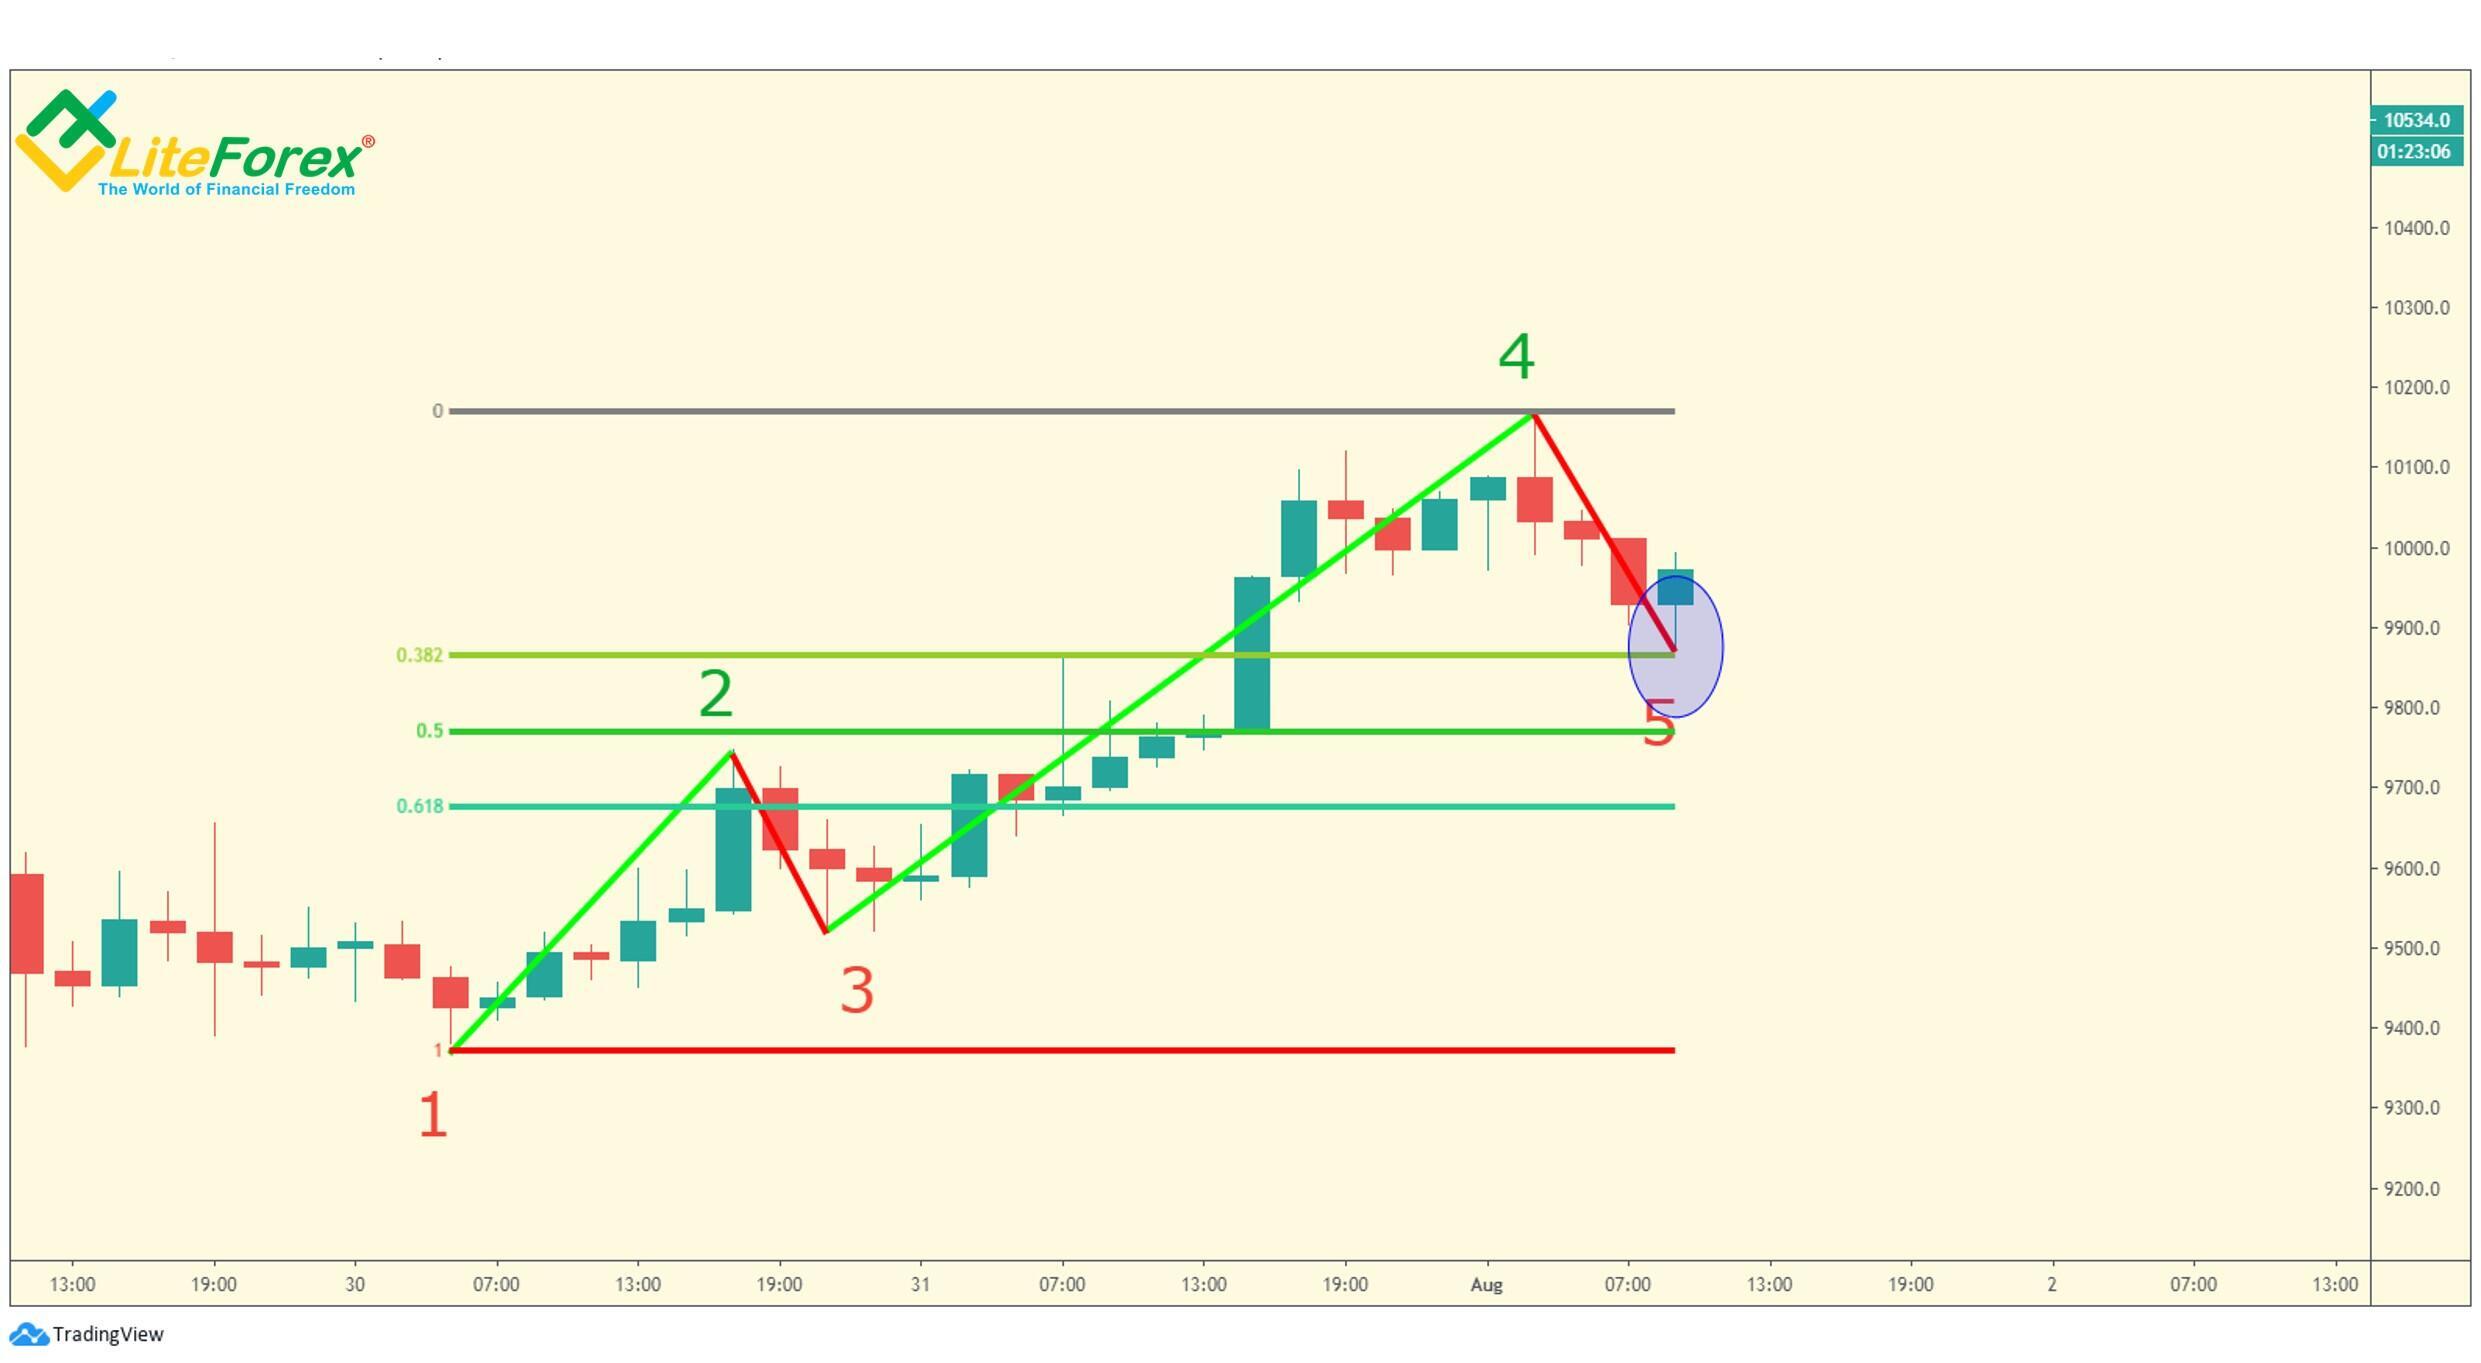
After there form the second swing and the following reaction, we see that the second reaction reaches the level of 38.2% of the entire formation (the blue circle in the chart), and so, can also take it into account.
Having generated the Fibo grid from the beginning to the end of the second swing, we see that the bar circled with the blue oval ends at level 38.2%. Presumably, the price has consolidated at level 38.2%, so we can enter a trade. As the reaction has advanced almost to a level of 50%, we set a stop loss at the level of 61.8% (the pink horizontal line in the above chart).
The target point is, as usual, at the level of 161.8%, counted from the presumed endpoint of the reaction, in the direction of the main trend. It is marked with the red line in the chart.

When the price reaches level 161.8% and stops rising, we exit the trade.
That is all I wanted to write in terms of theory. As you see, trading the DiNapoli levels is quite comprehensive and easy to use. It will suit both the beginner and professional traders. For traders, who do not have enough willingness or time for the manual building of levels, there are DiNapoli levels indicators. They ensure the automatic formation of the relevant levels and marking of the chart, which will obviously help the beginner (and not only) Forex traders all the world.
DiNapoli levels indicators
This section will deal with how to install, custom, and use the three free DiNapoli indicators I mentioned in this article. They do not require special software.
- Dinapoli Target Malay
- Price Sound TS Dinapoli
- Dinapoli targets MetaTrader 4 indicator
Dinapoli Target Malay indicator
The Dinapoli Target Malay indicator is a simple, user-friendly indicator suitable for all investors. It is a trend indicator. It is a trend indicator that displays the DiNapoli levels attached to the chart as solid horizontal lines.
How to install the Dinapoli Target Malay indicator?
Step 1. Download free indicator via this link.
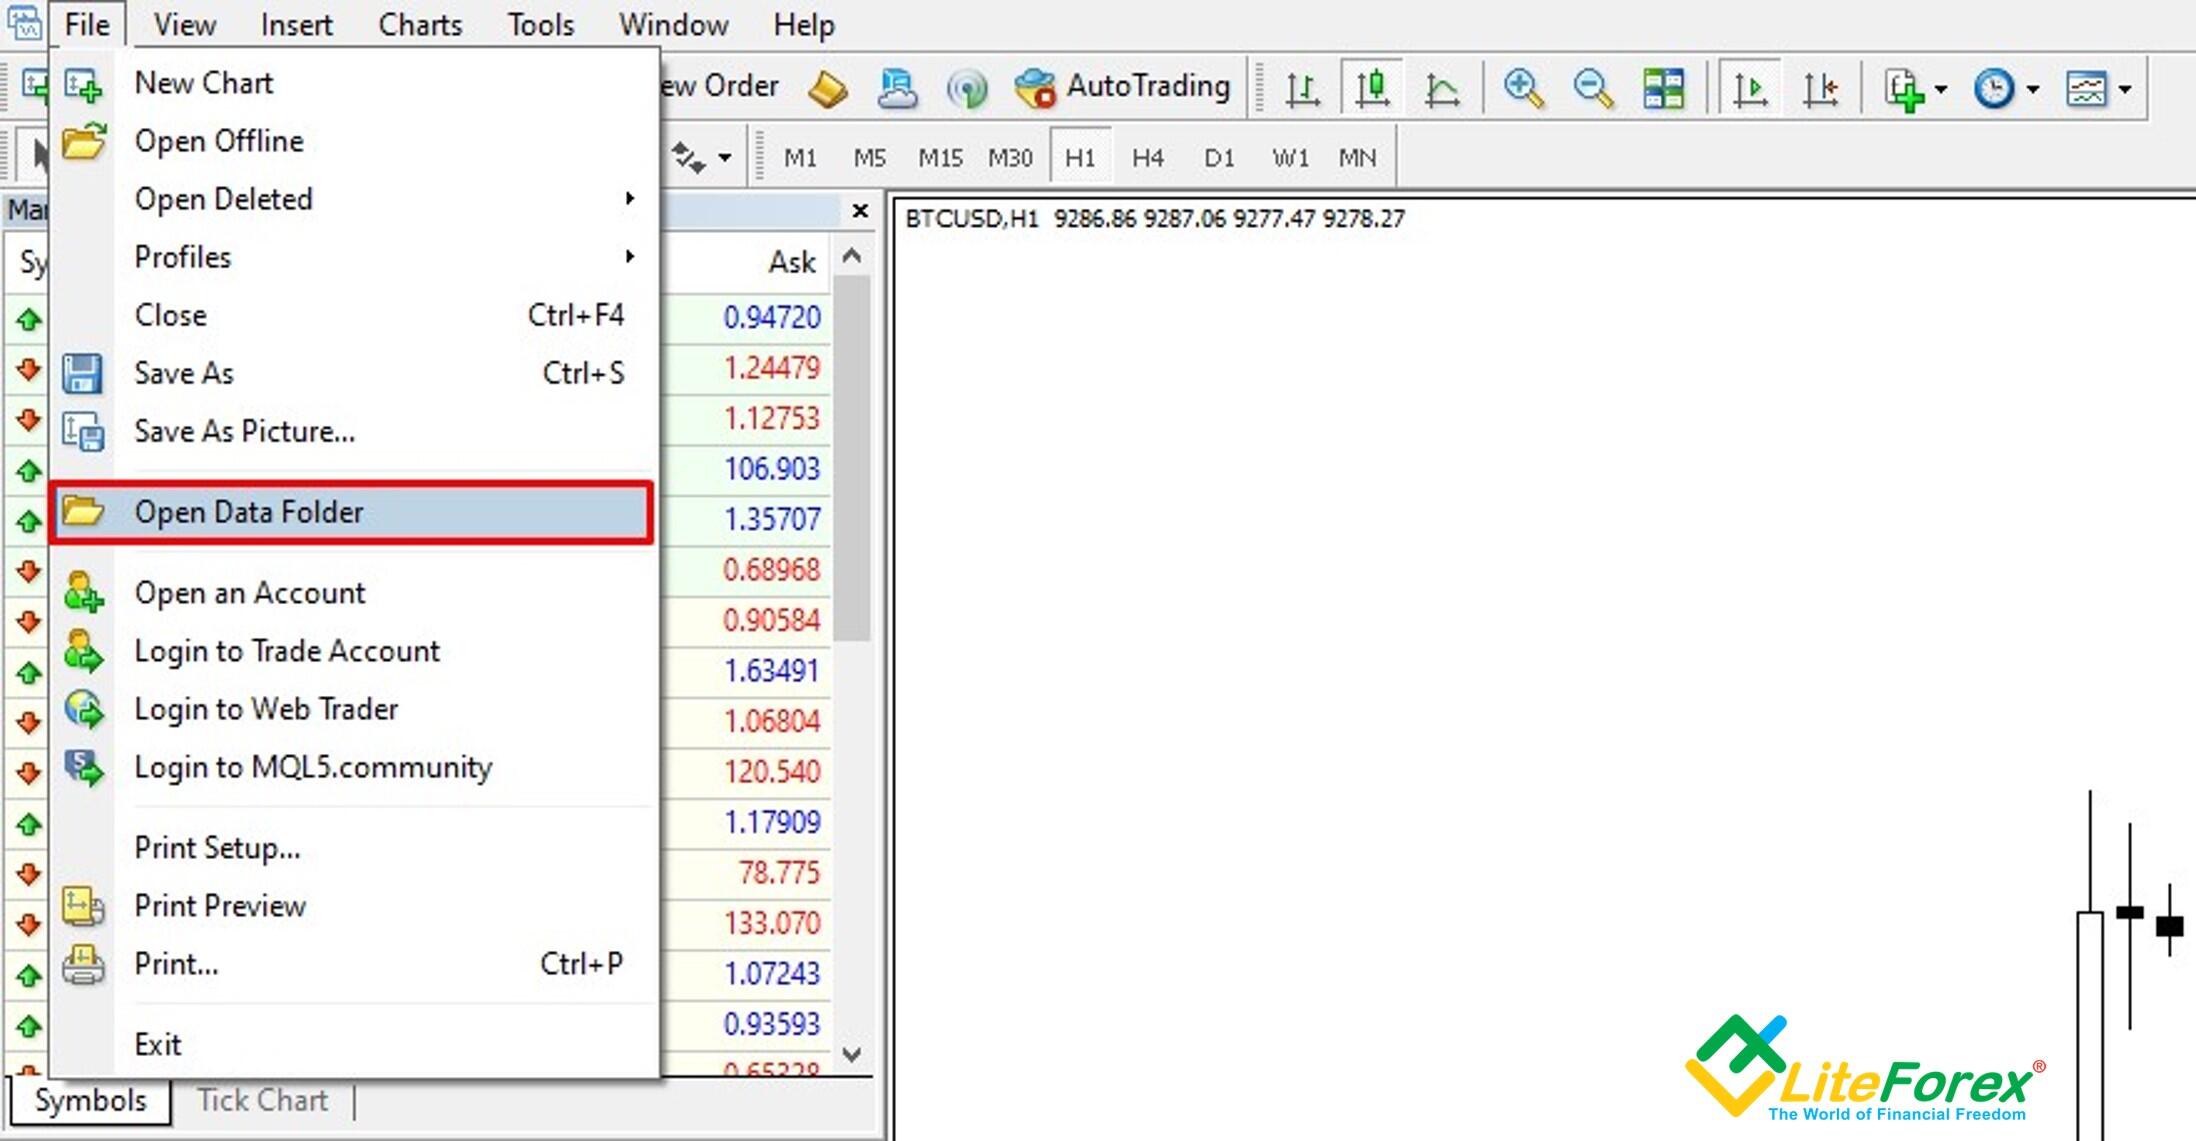
Step 2. Open the File tab in the upper menu of the MetaTrader4 and click on the Open Data Folder tab.
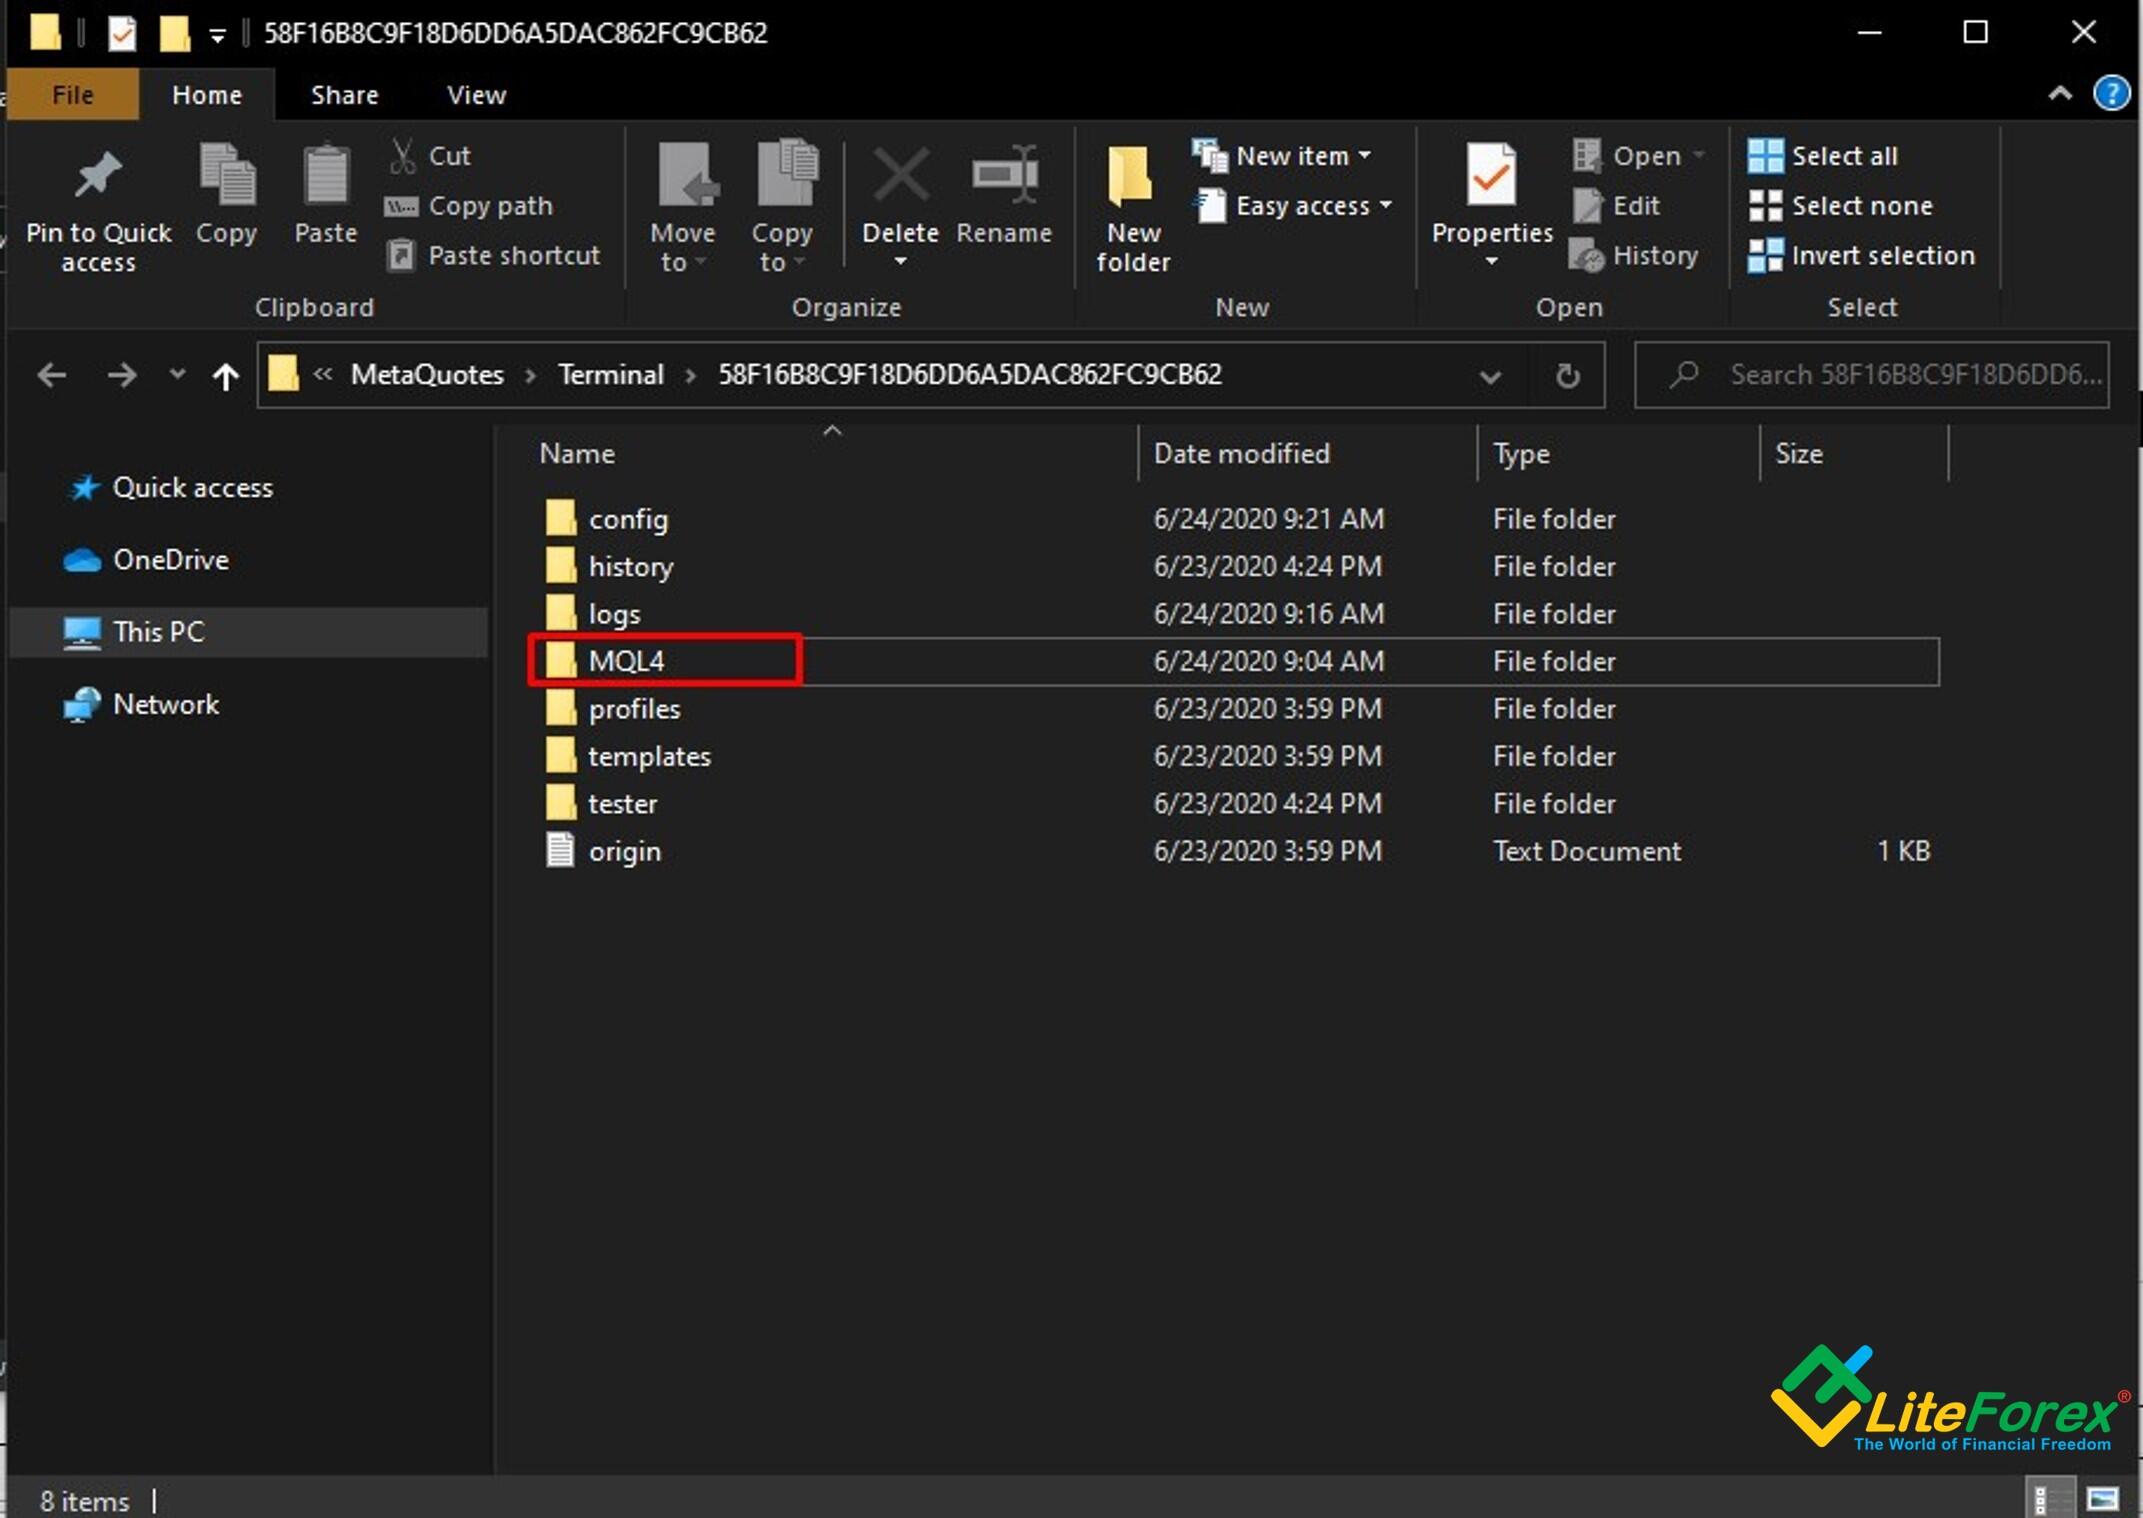
The Explorer with the destination folder will open. Select the MQL4 folder.
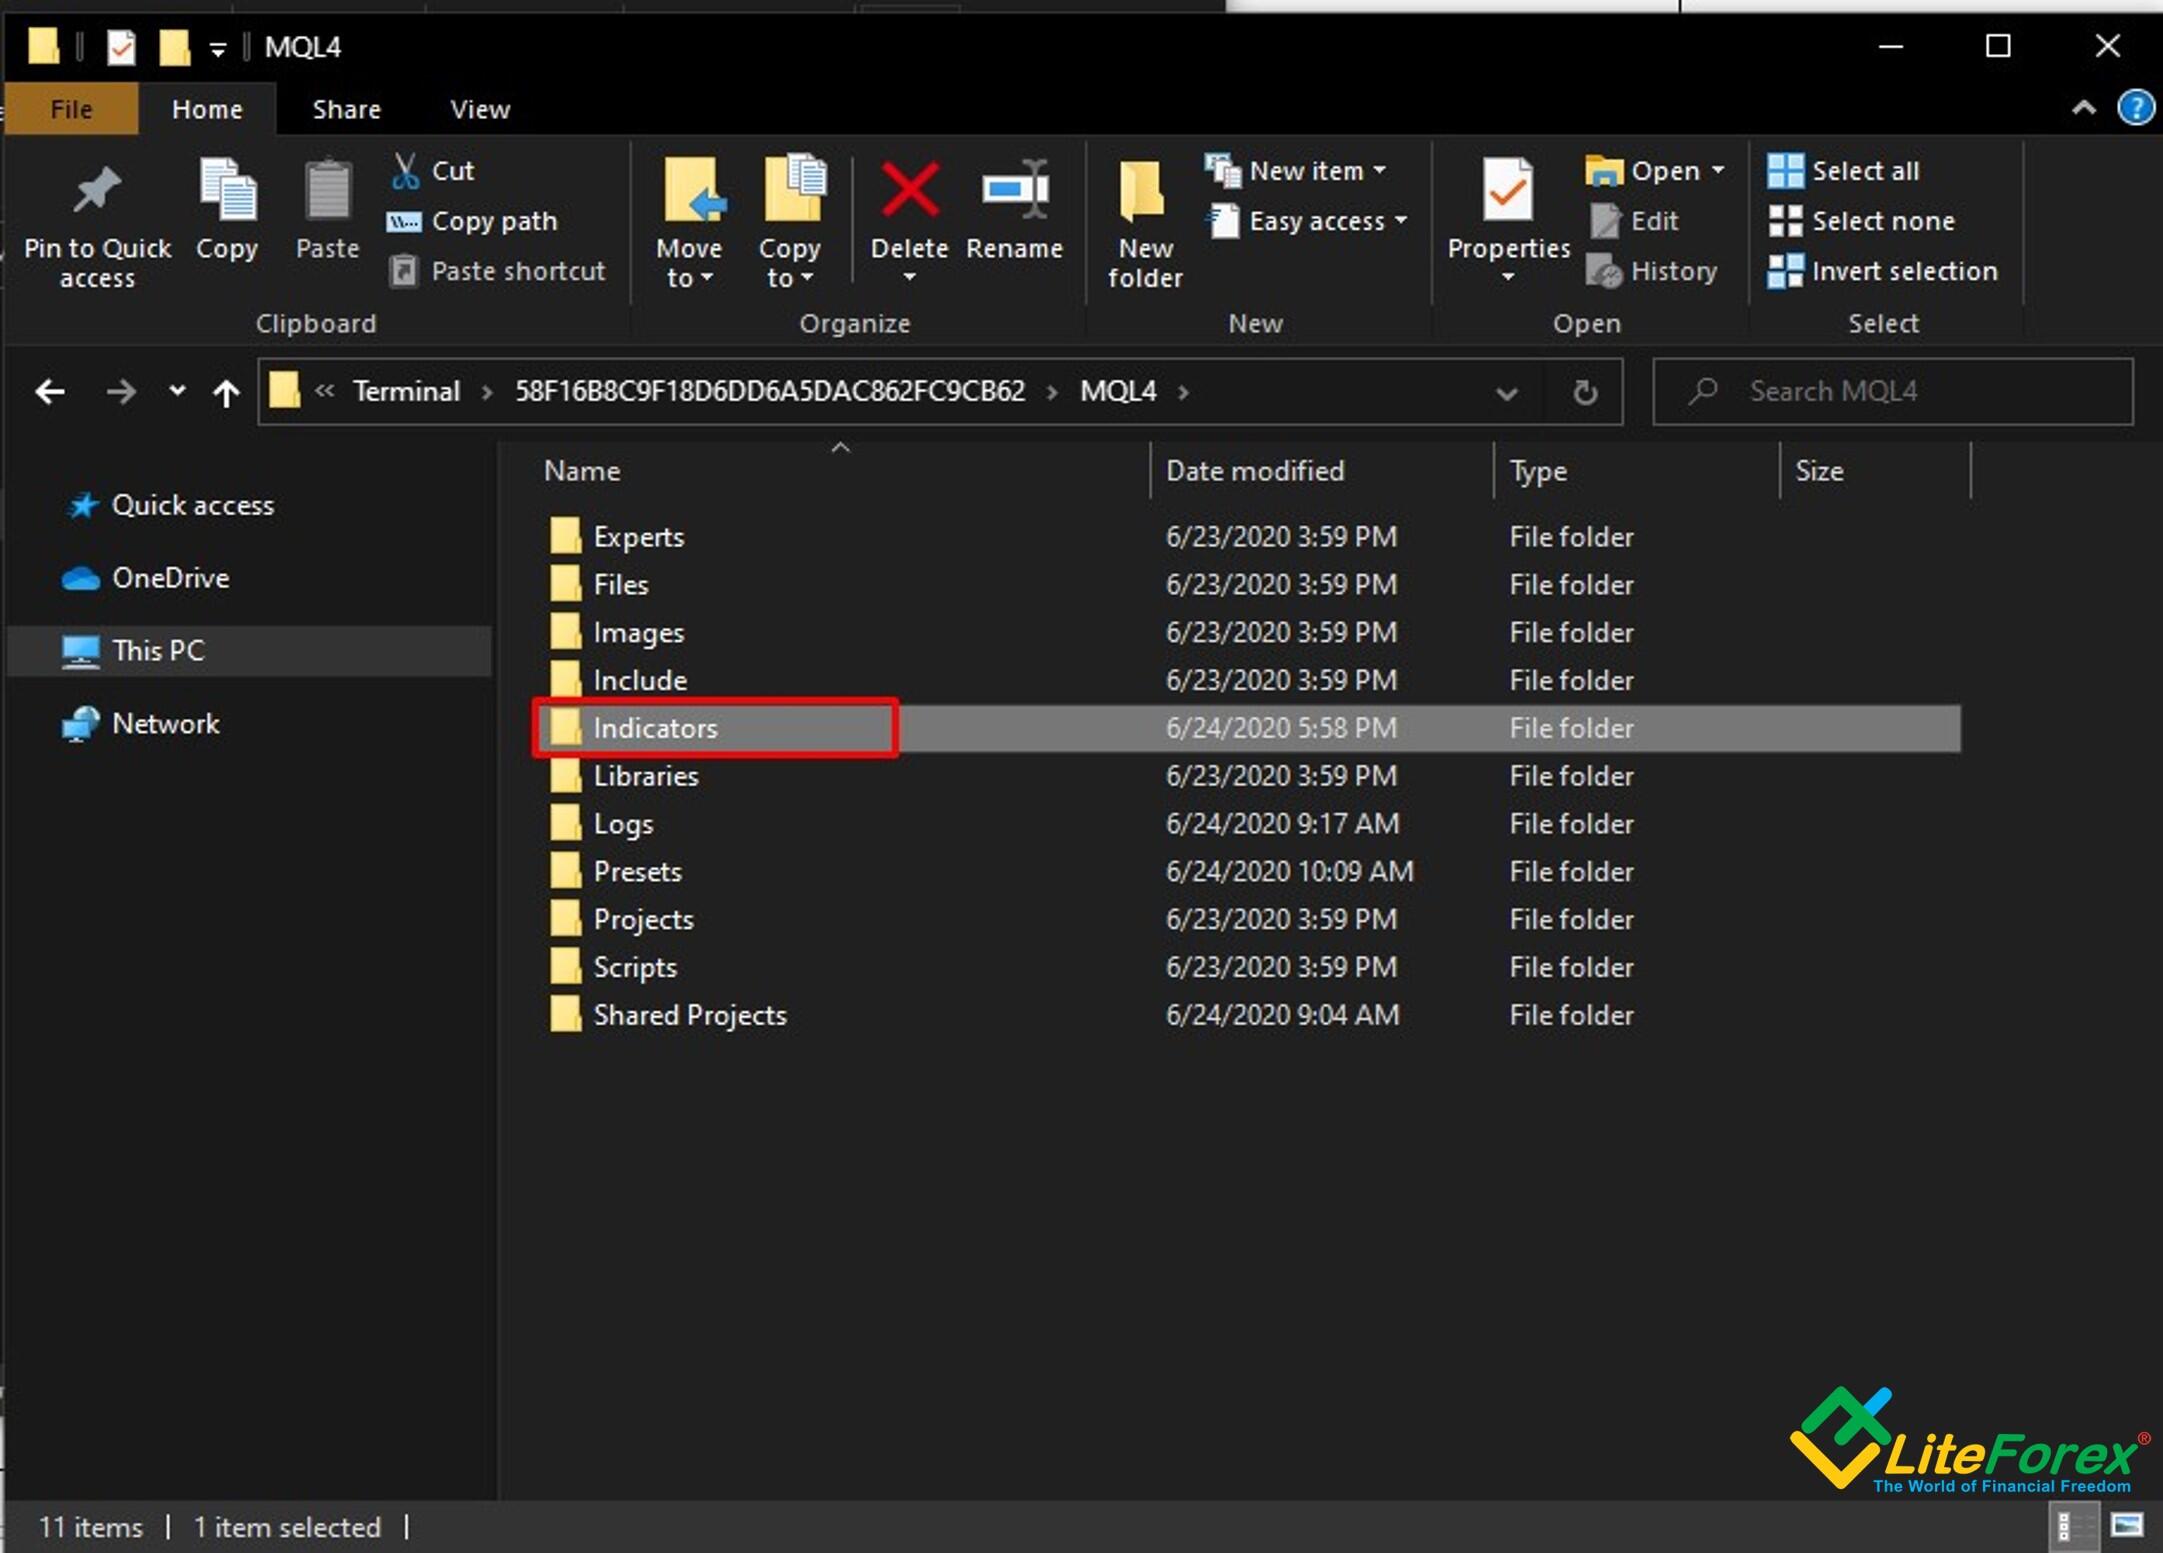
Next, open the Indicators folder.
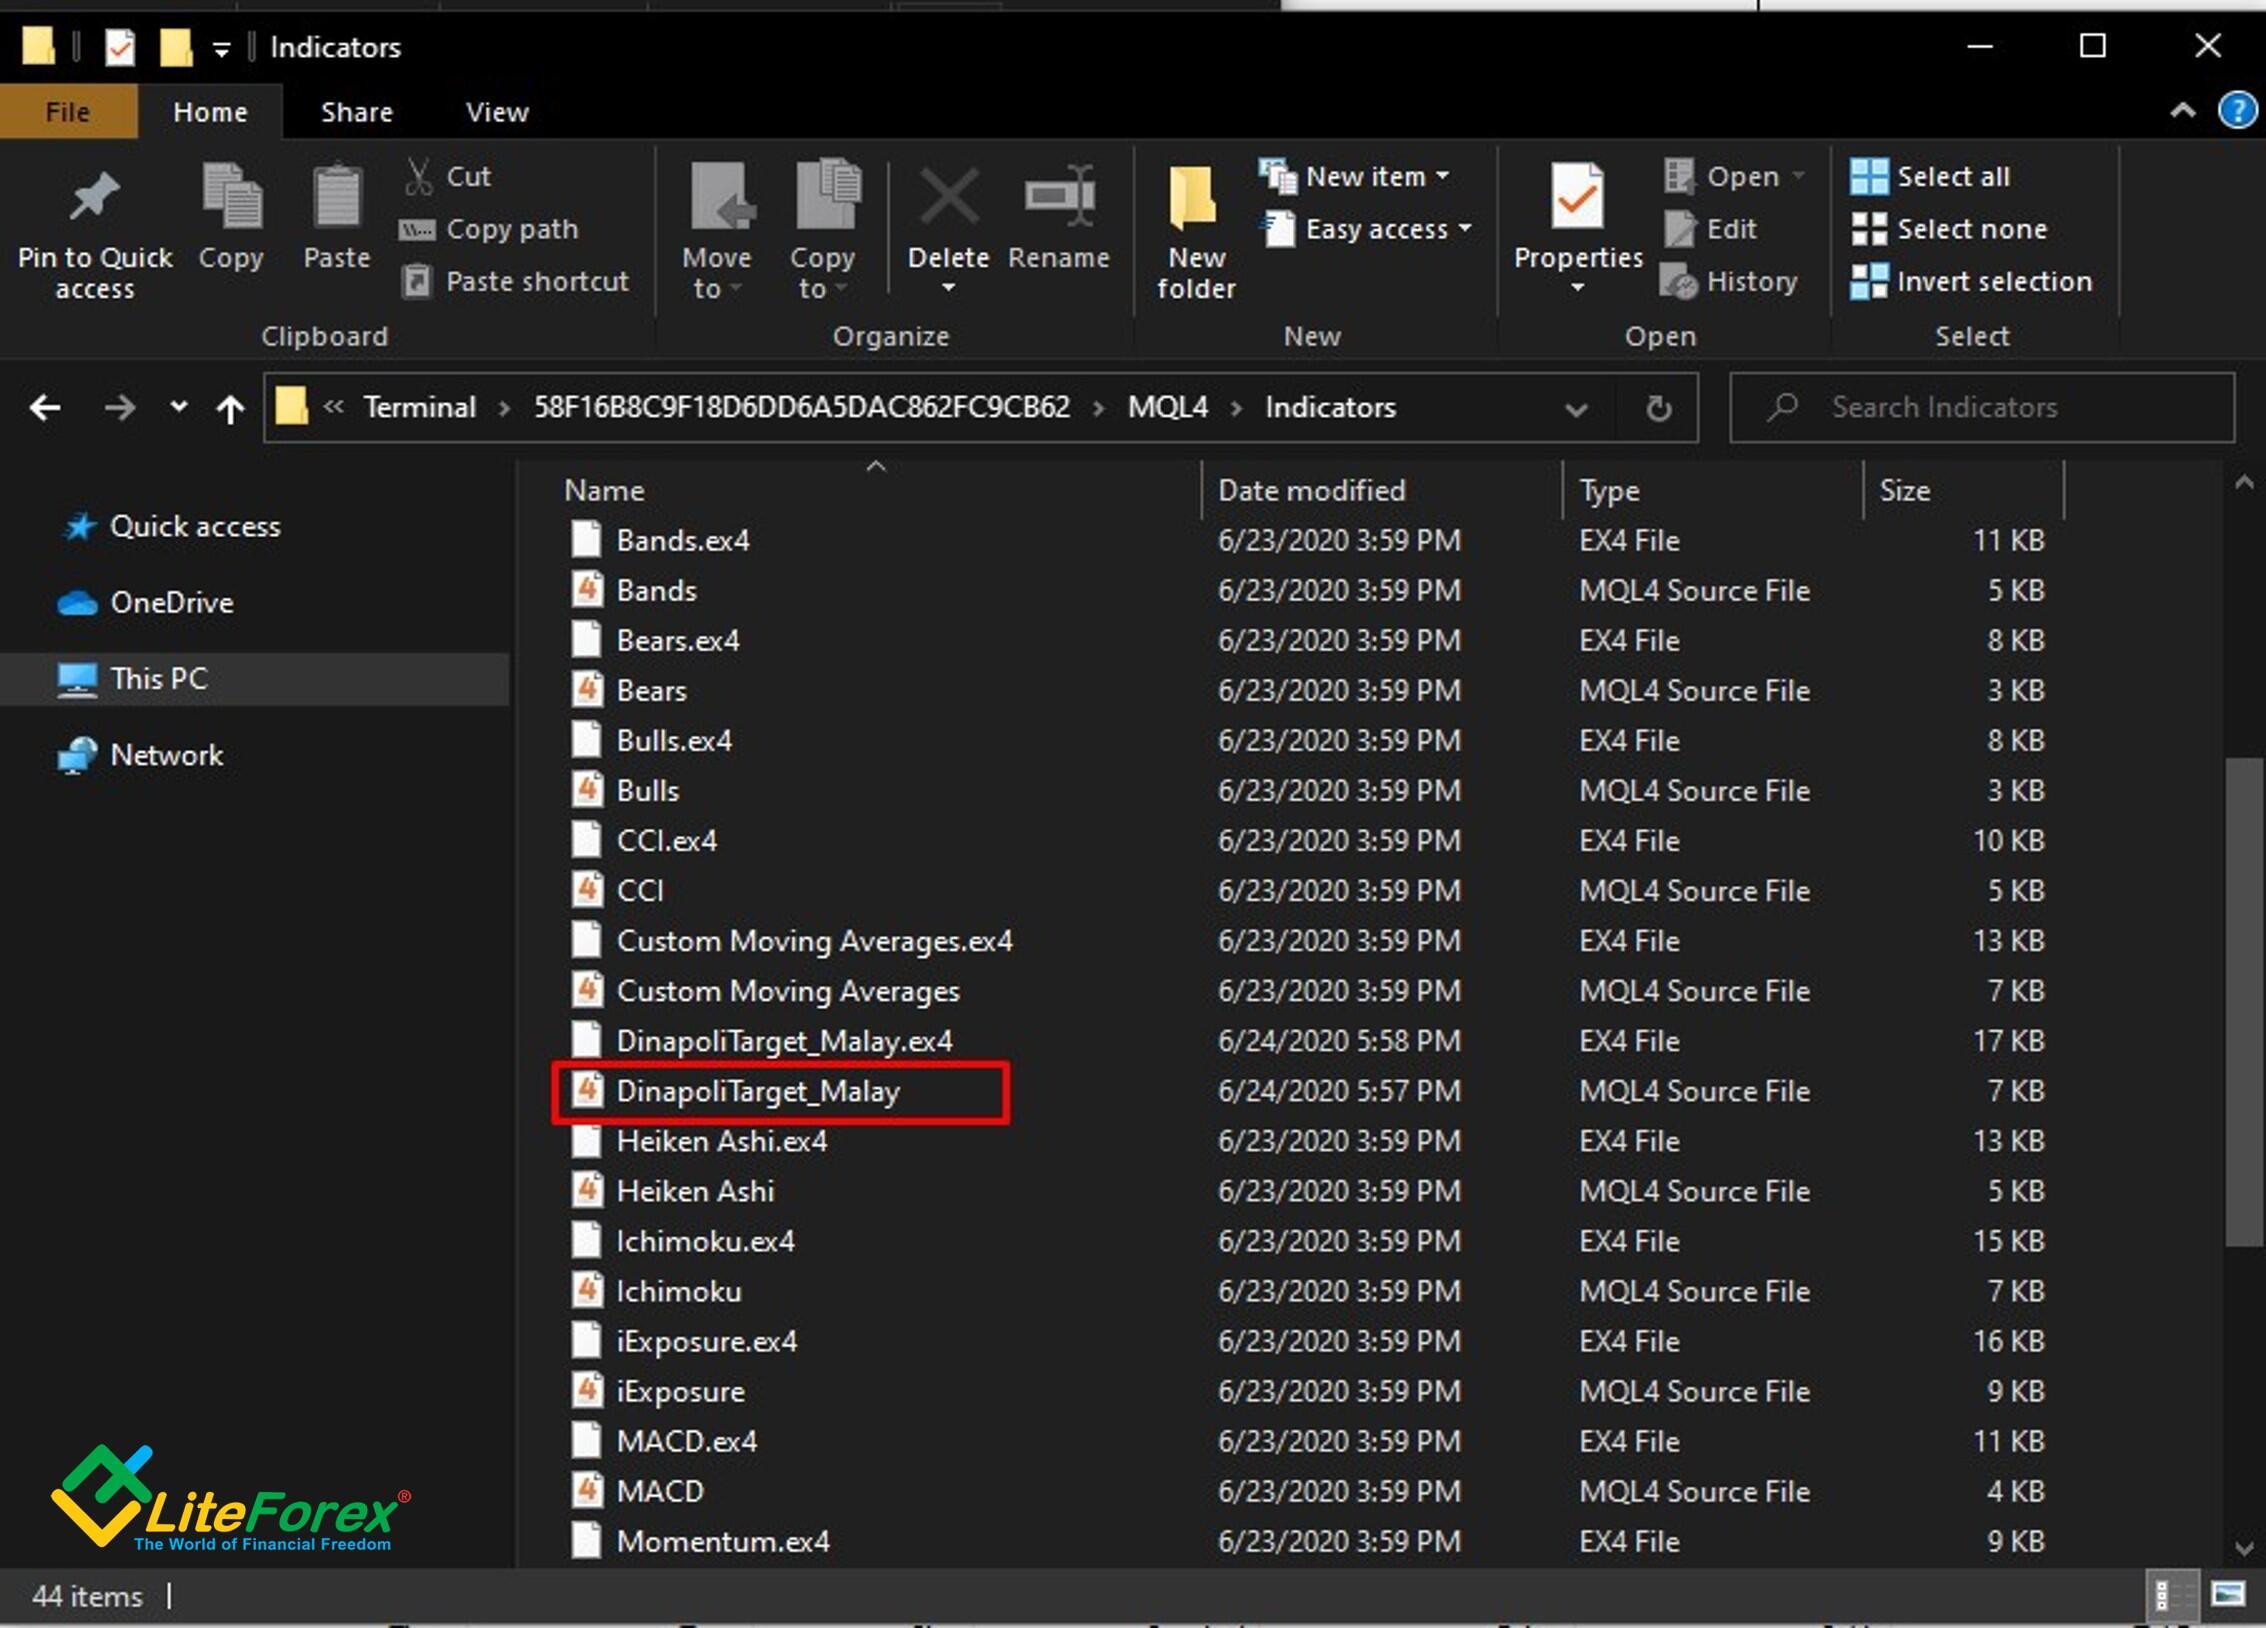
Step 3. Copy and paste the file DinapoliTarget_Malay.mq4 that you have downloaded at the first step and extracted, next restart your MetaTrader platform.
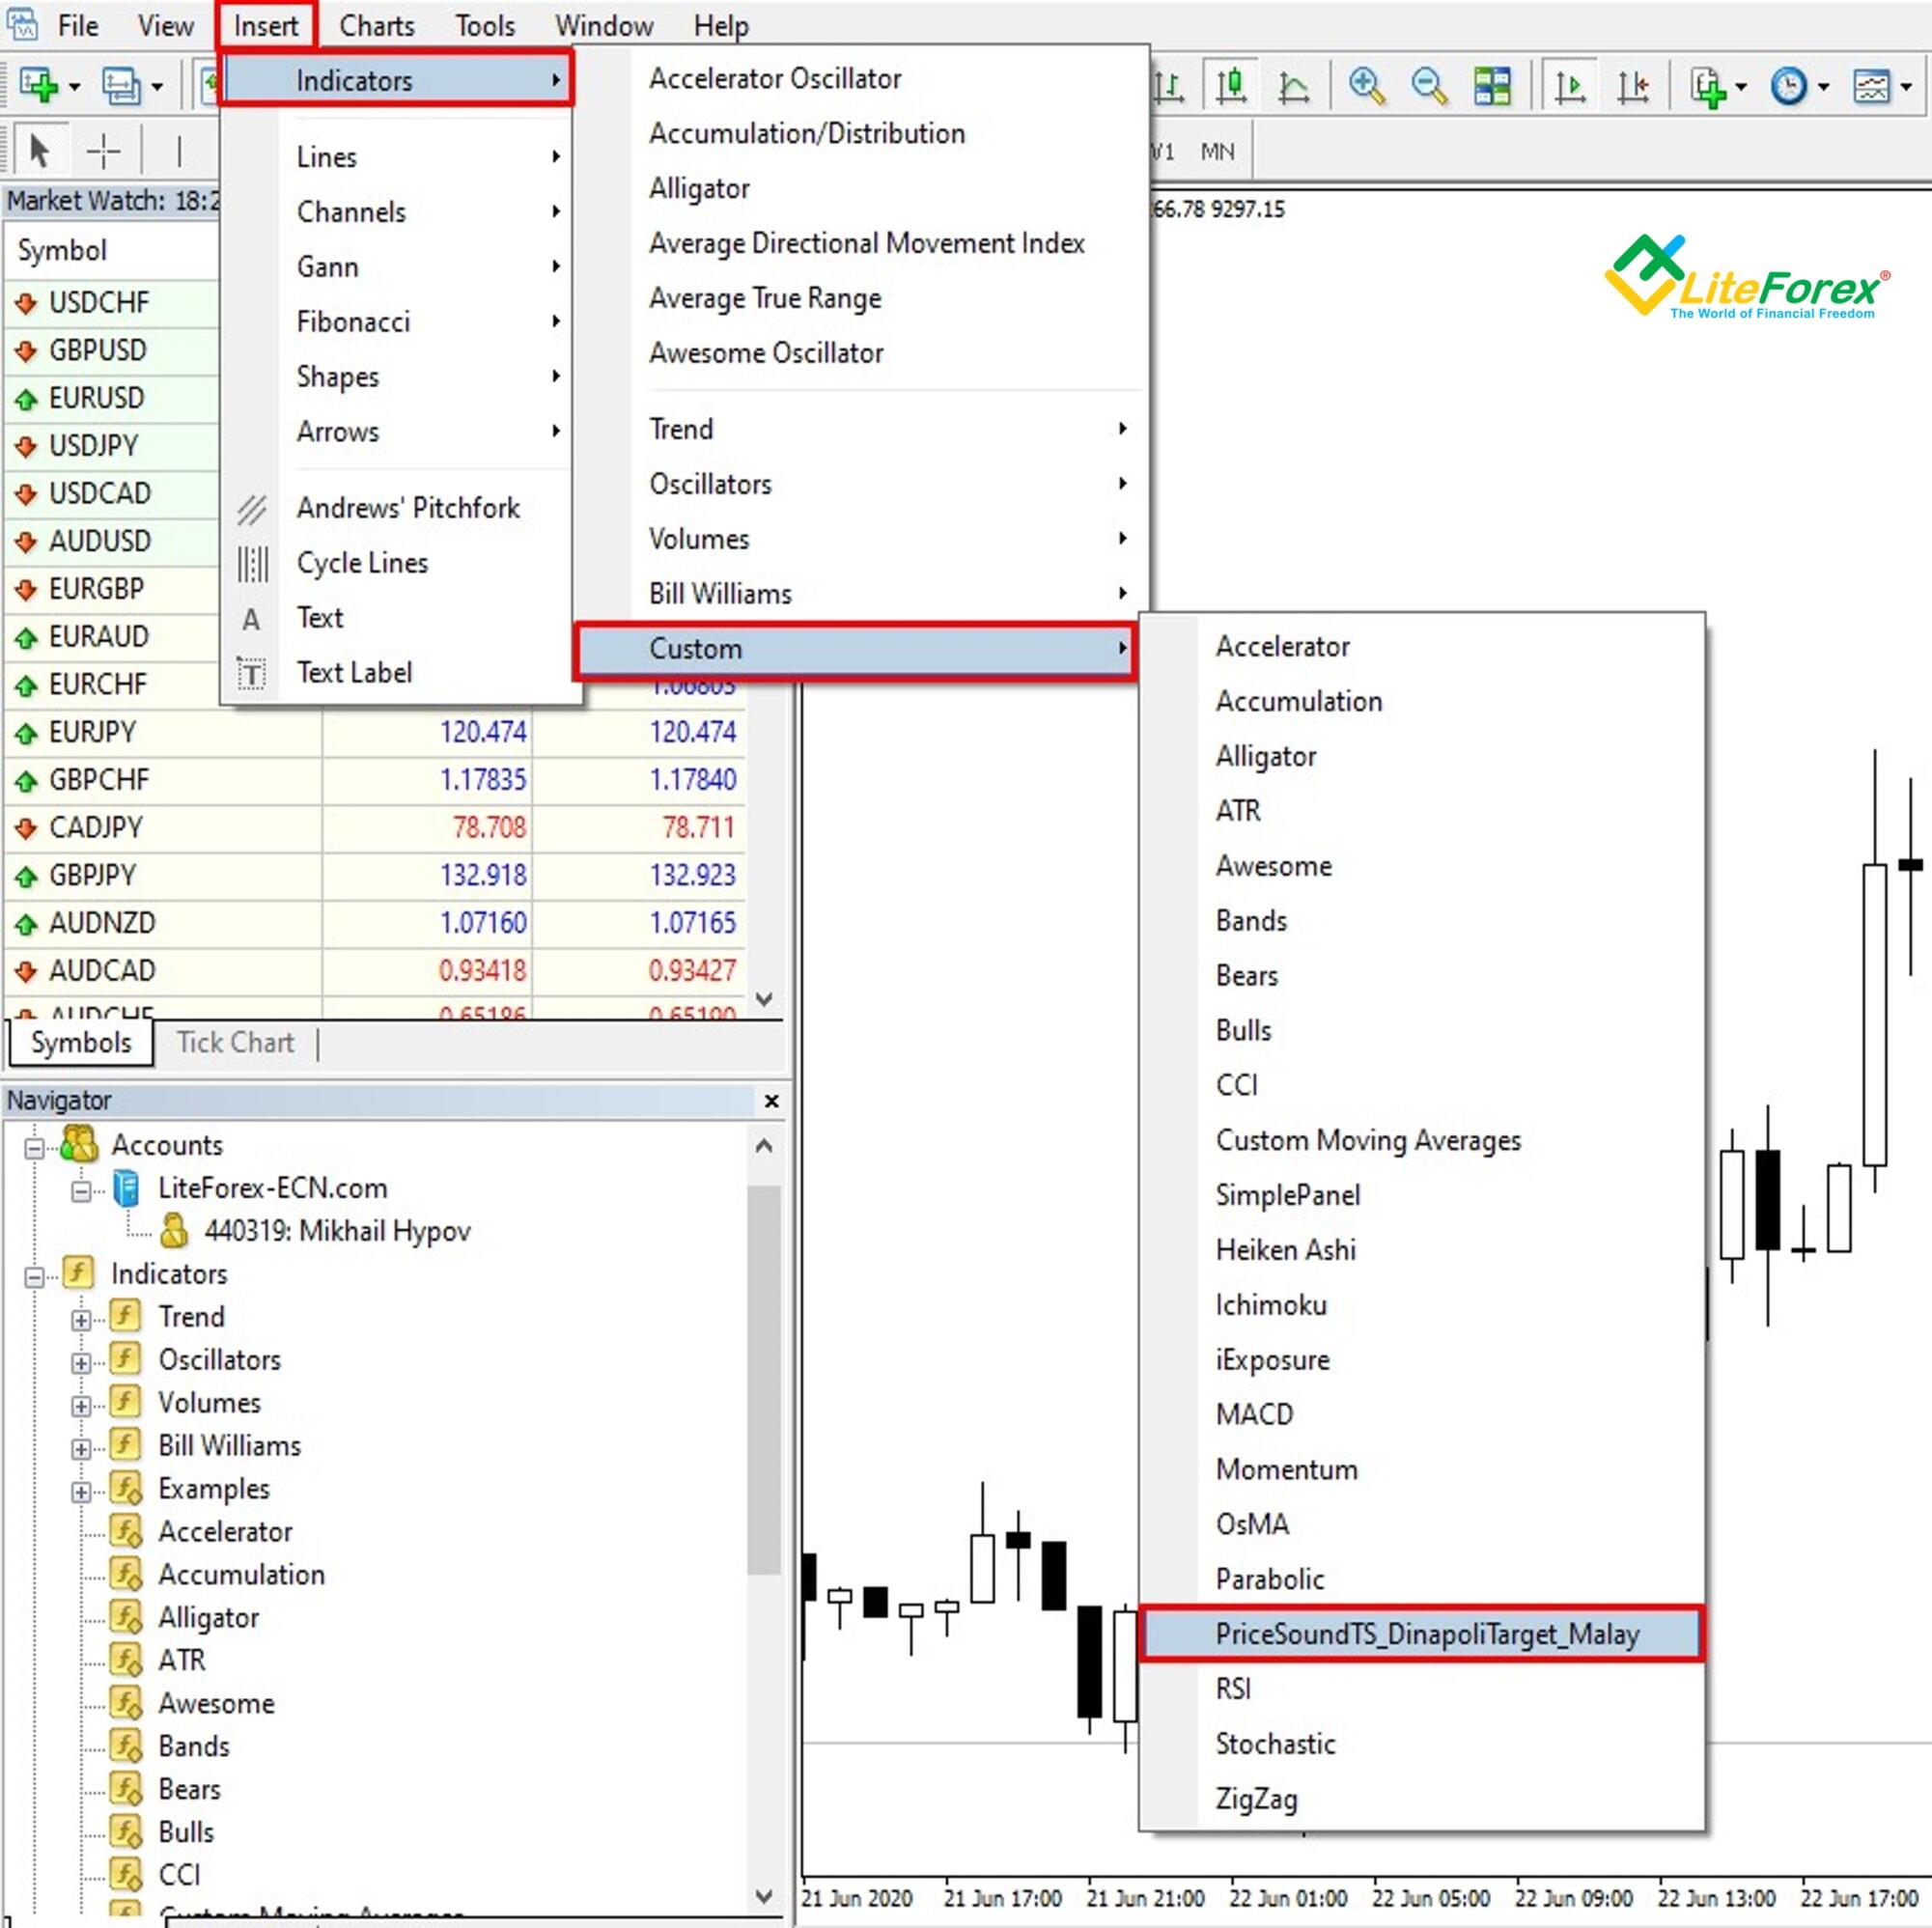
Step 4. Open the chart where you want to install the indicator. In our example, it is the BTCUSD chart. Click on the Insert tab in the upper menu of the chart. Next, open the Indicators tab and click on the Custom menu. Select the indicator you have installed. In our case, it is DinapoliTarget_Malay.

You will see the indicator window. Click on the OK button and run the indicator with the default settings, which is ready for work.
Custom Dinapoli Target Malay
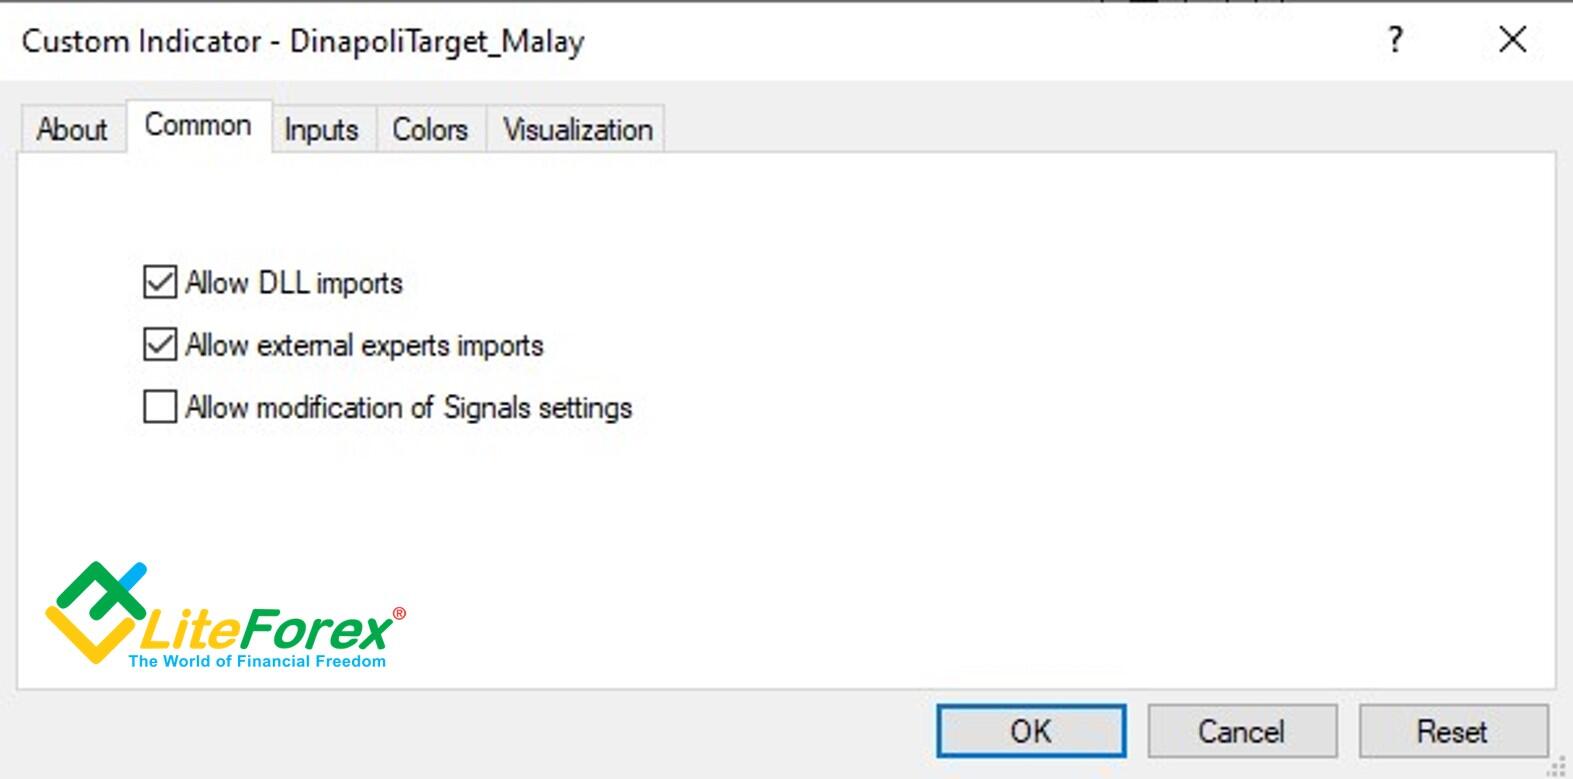
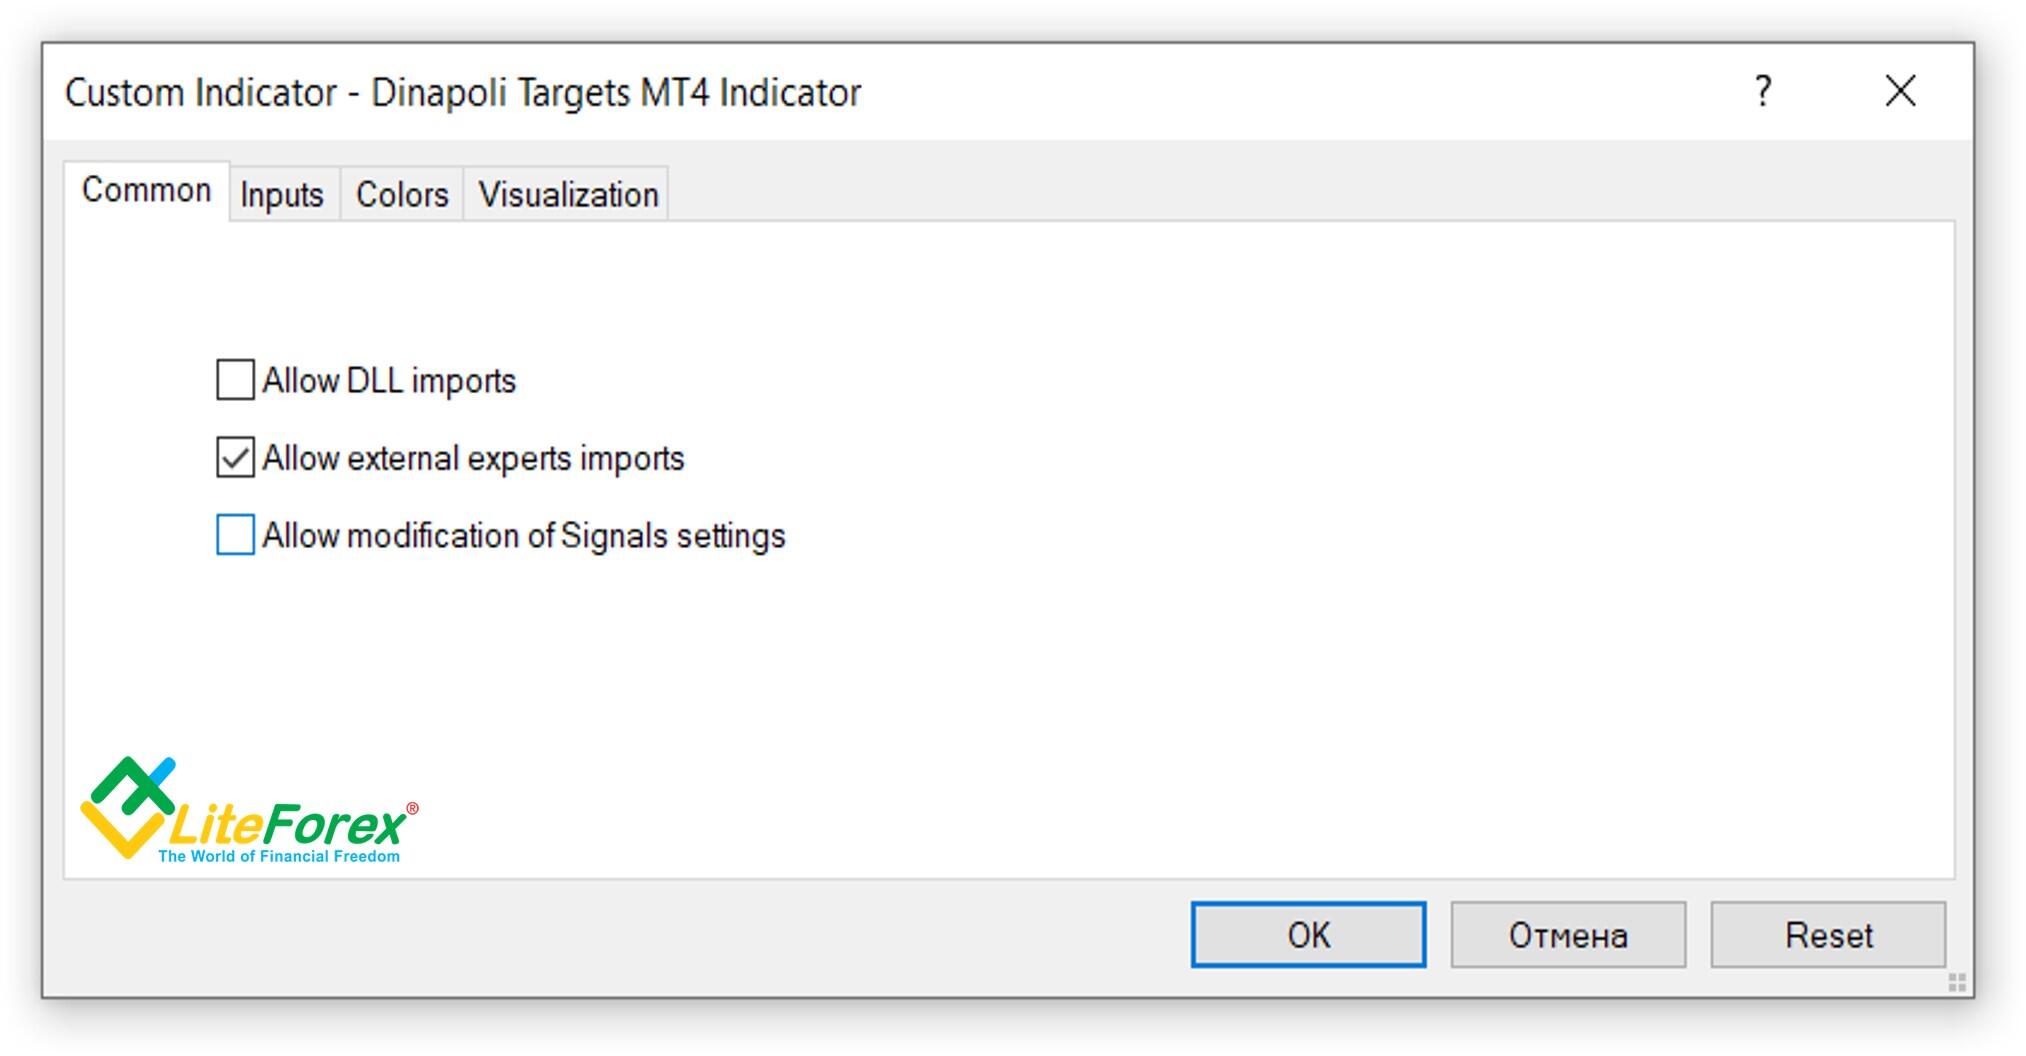
In the Common settings, you can enable and disable permissions available for the indicator.

There are more settings in the Inputs tab. You can change the values of the variables, enable and disable different functions. I will present the full list of the Dinapoli Target Malay indicator functions below.
- barn – the number of bars that indicator analyzes.
- Length – the number of bars that compose impulse wave (the wave's length).
These two parameters are perhaps the most important as they determine the indicator’s sensitivity.
Next, there are two parameters that define the exterior of the indicator elements and sound alerts of the indicator:
SoundsAlertMode - enables and disables sound alerts;
targets - enables and disables the visual display of the target.
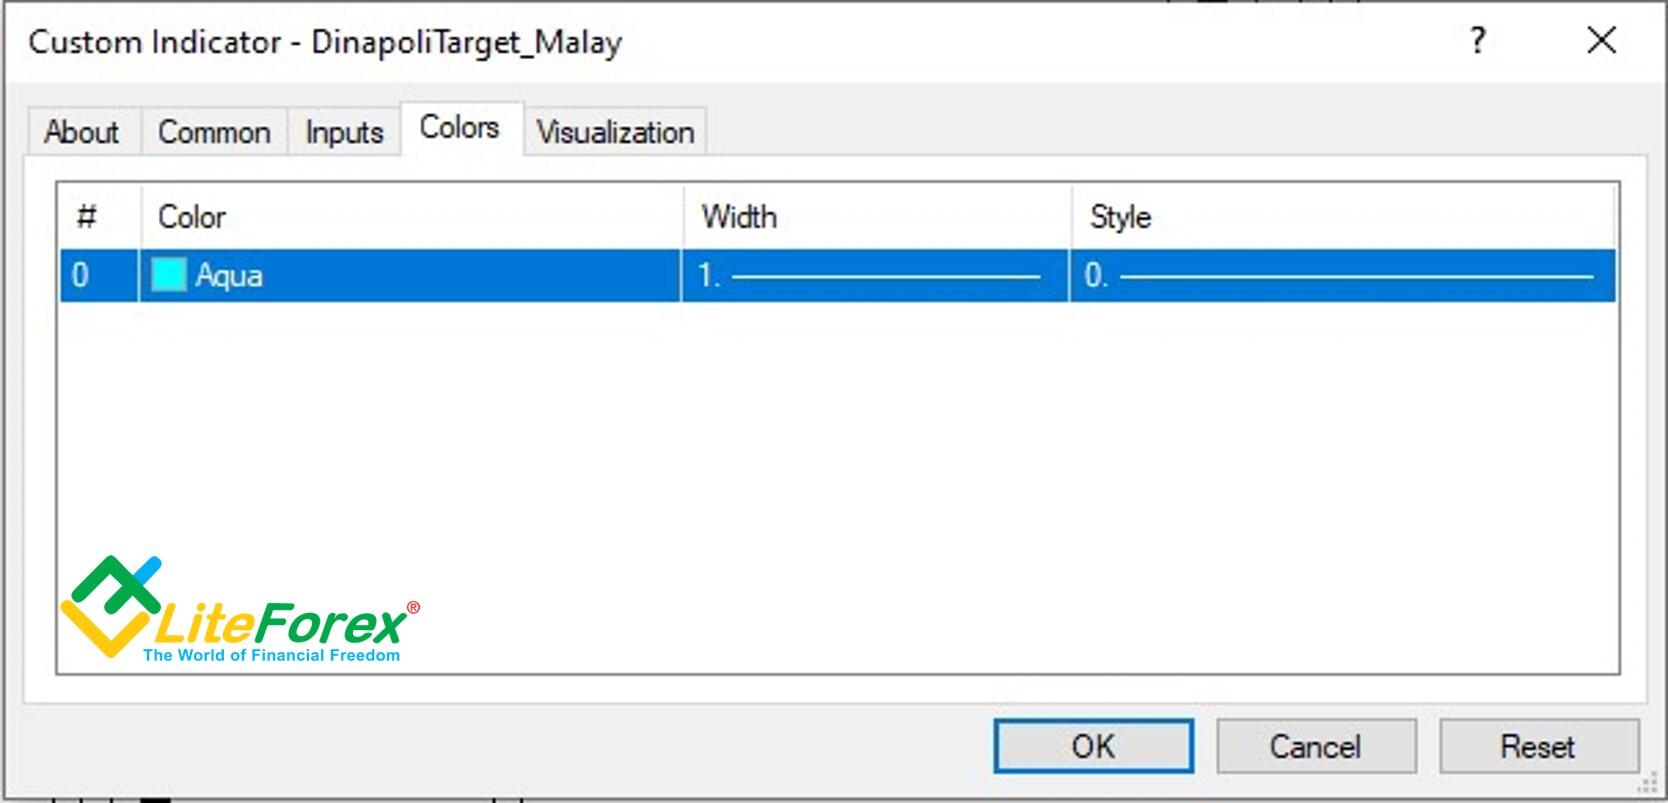
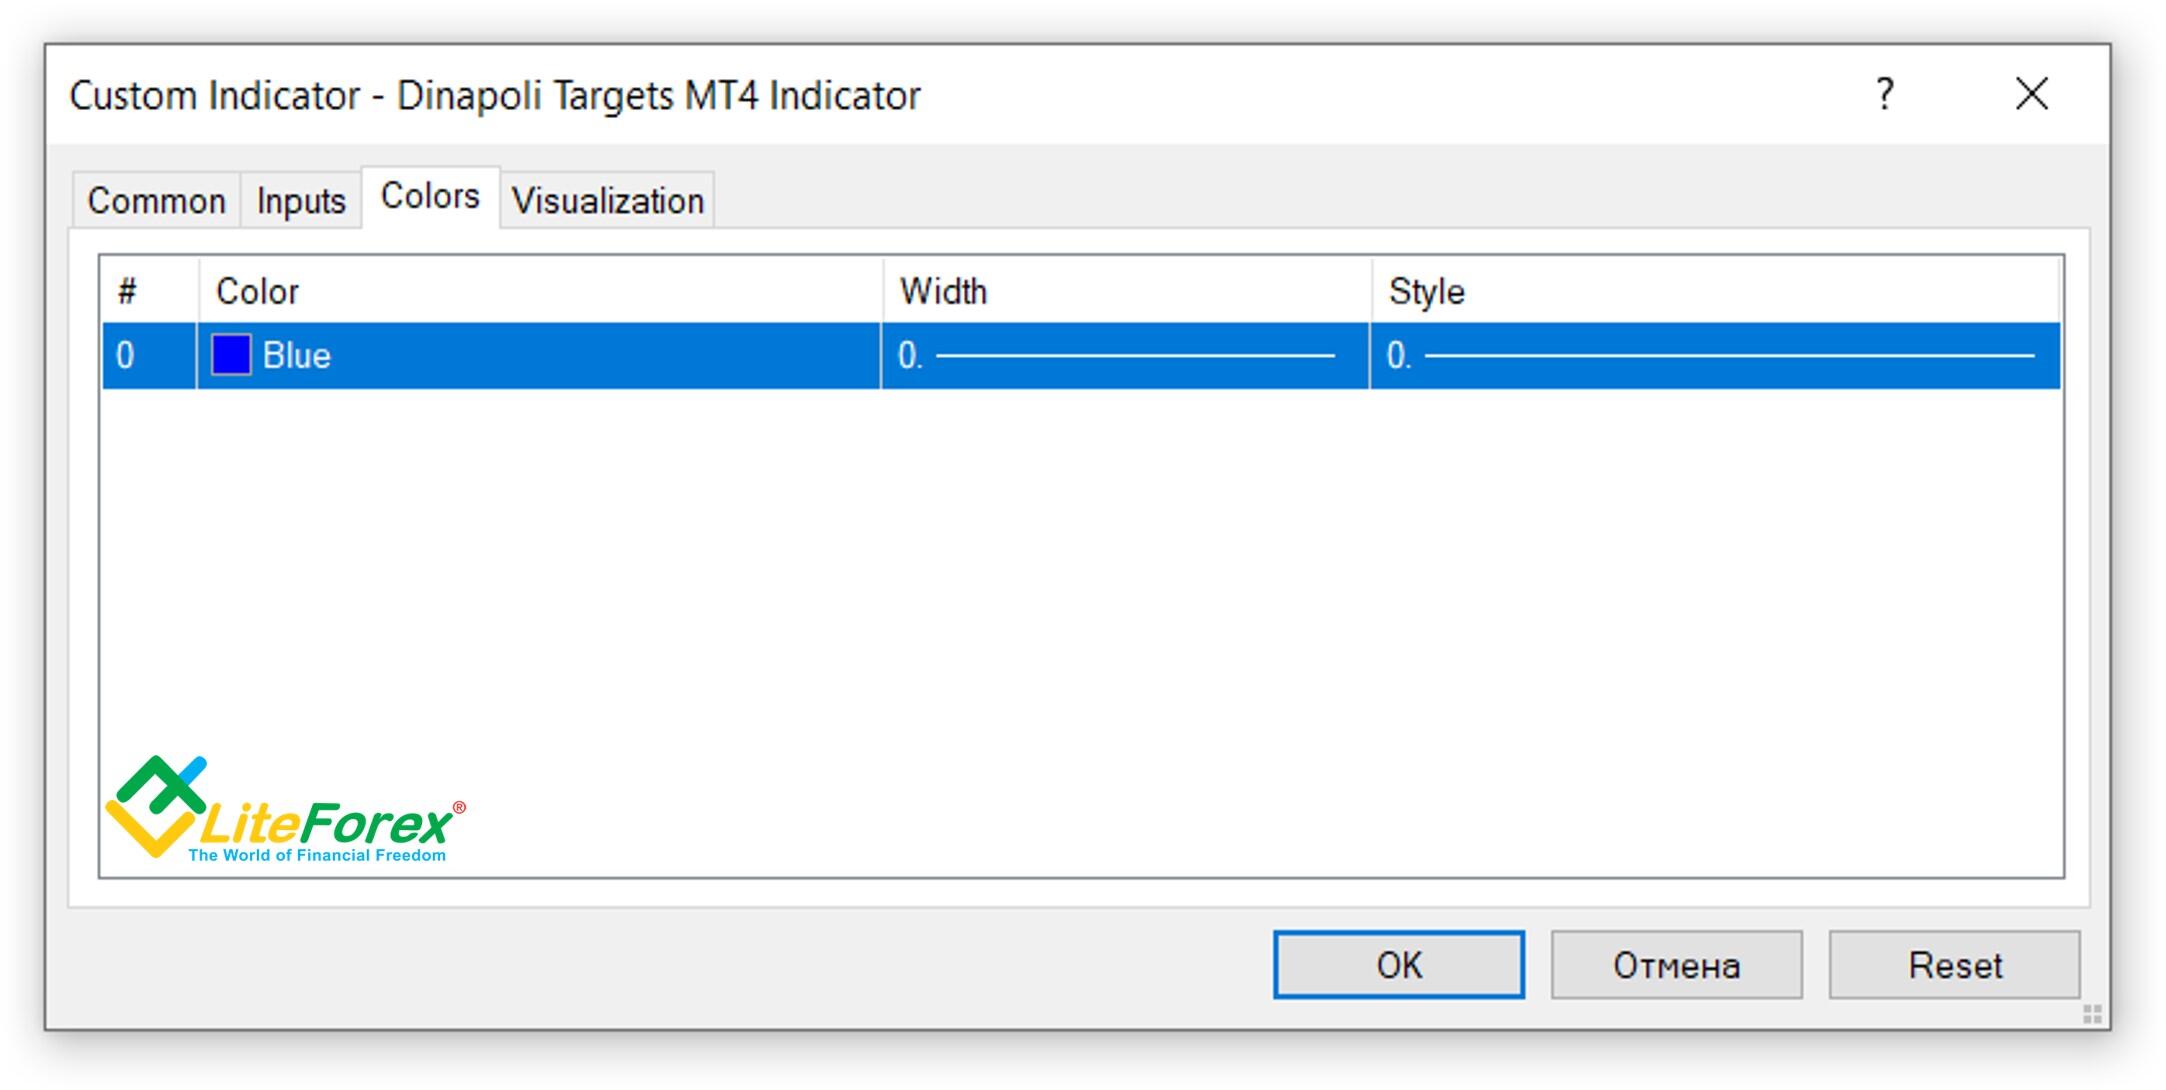
In the Colors tab, you can change the color of the line that shows the swings and the reactions.

In the Visualization tab, you can enable or disable the indicator’s display in the data window. Besides, you can select timeframes, for which the indicator will be displayed. Dinapoli Target Malay will equally suit all timeframes.
Trading with Dinapoli Target Malay

Now, let us look at the indicator with default settings in the chart. Horizontal lines mark Fibonacci levels, which I wrote about in the theoretical section devoted to the DiNapoli levels. The thin diagonal turquoise line marks swings and reactions (corrections).
The red line marks the level of a stop loss suggested by the indicator in the case of a less risky trading strategy.
The beige line marks the entry level.
Next, there are DiNapoli levels that mark presumed targets.
The main flaw of this indicator is that it is lagging. It is clear from the above chart that the price chart goes much lower than the suggested targets, but, as the reaction goes on, there are not yet defined relevant levels to trade.
The advantage of his indicator is that it is simple and user-friendly. A small number of settings and functions will be good for a newbie or for a user, who uses the Dinapoli Target Malay mt4 indicator for additional confirmation of trading entries or exits.
Dinapoli targets metatrader 4 indicator
Forex Dinapoli targets metatrader 4 indicator is very similar to the previous one, I described above, both in terms of settings and the appearance. The difference is that the DiNapoli levels are not the thick solid line but a dotted line, and the visualization of reactions and swing has been removed from the chart.
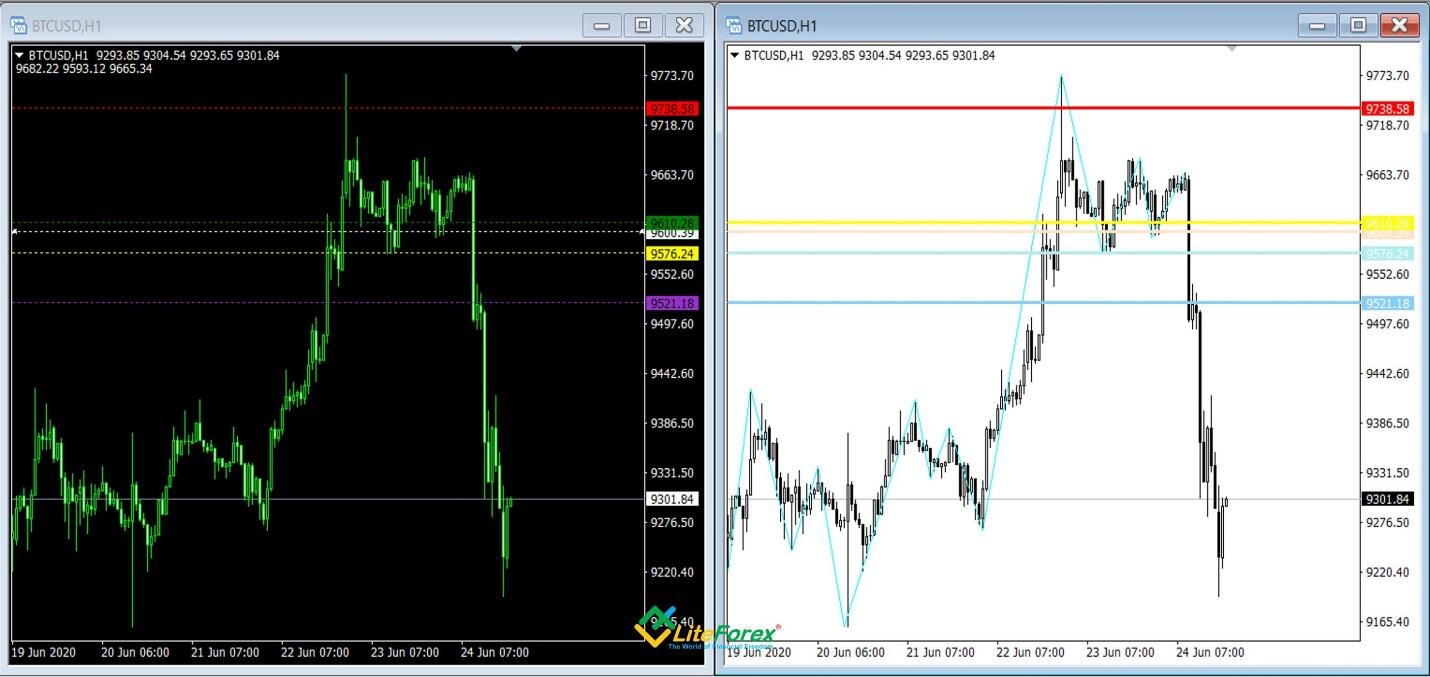
There are two identical BTCUSD charts above, for you to compare. Dinapoli targets metatrader 4 is on the left. Dinapoli Target Malay, which I described first, is on the right. As you see, there are no significant differences between them, except for simplified visualization.
How to install Dinapoli targets metatrader 4 indicator?
Download the indicator archive here and extract the download file. Next, go through the same algorithm as I described for the previous indicator above. Do not forget to restart your MetaTrader terminal, to see the new tool in the list of indicators.
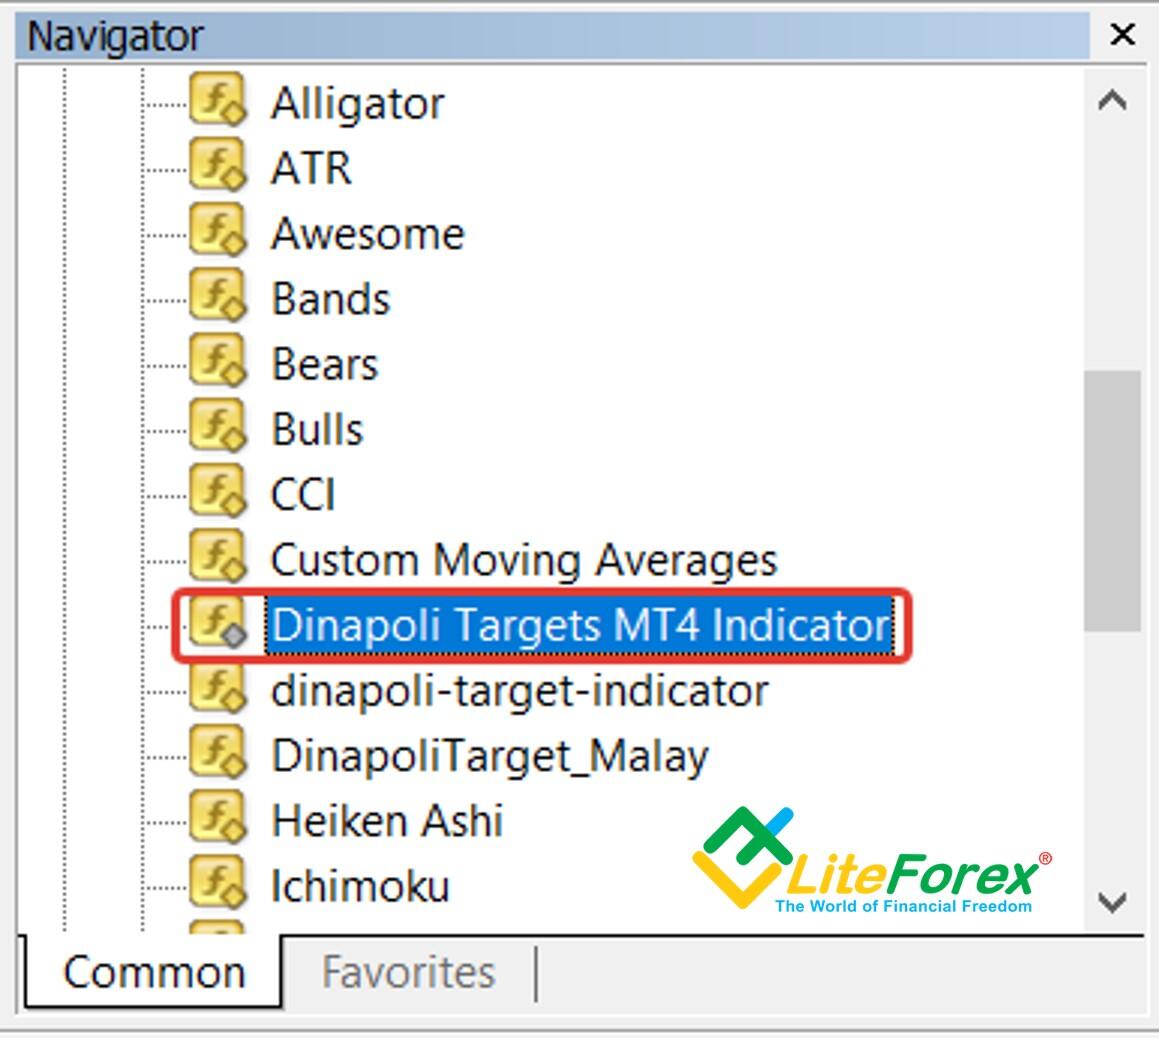
By the way, you can paste the indicator via the Navigator menu, where, in the indicators’ list, you open the Indicators folder and, next, the Examples sub-folder. If everything has been done right, the downloaded indicator will be on this list.
Custom Dinapoli targets metatrader 4 indicator
Next, when you have opened the chart window, open the indicator’s settings by double-clicking the left mouse button on the indicator’s icon. It will open the custom window. If you click on the OK button, you will run the indicator with the default settings. There is nothing new in the Common and Visualization tabs.
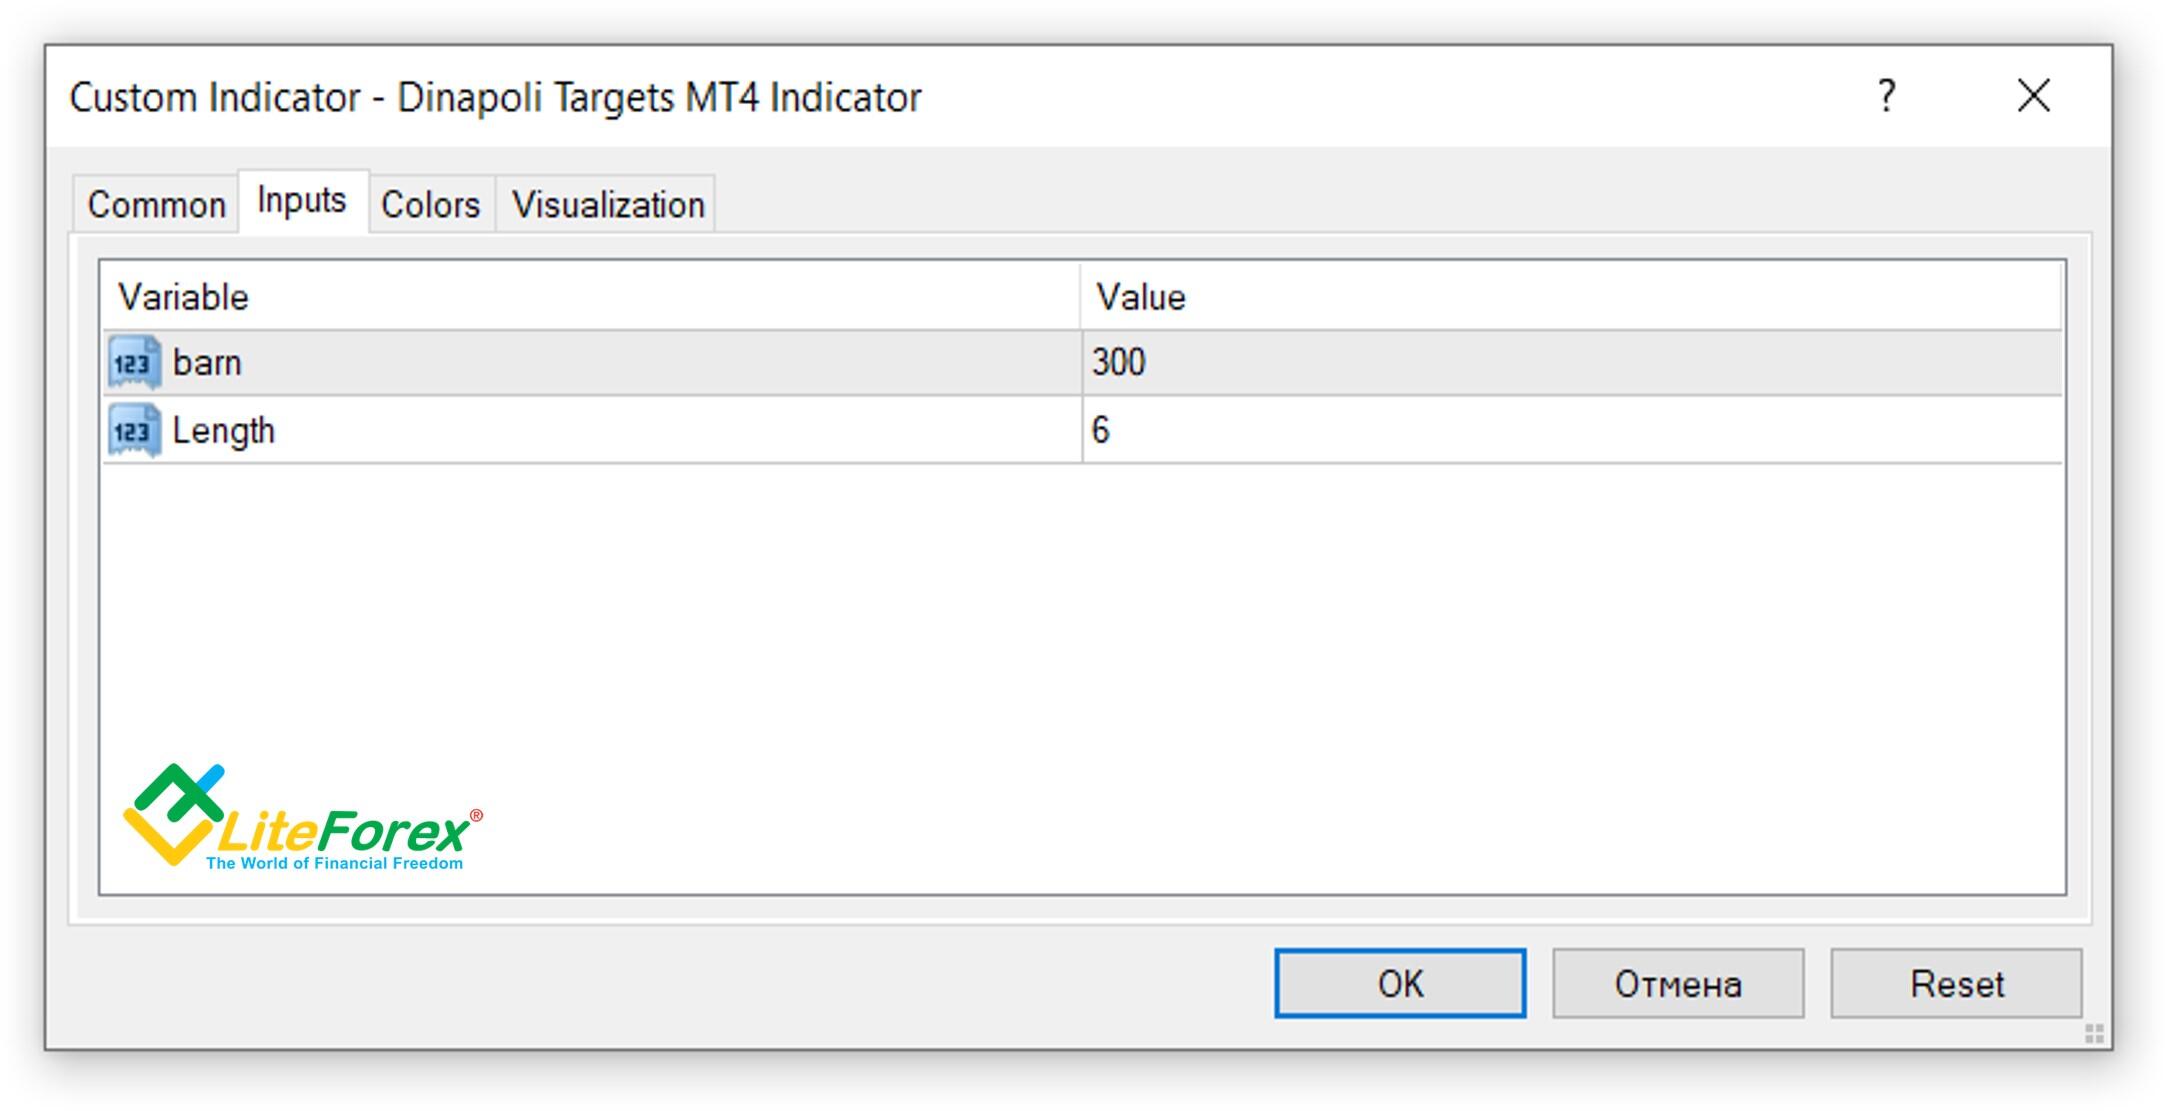
In the Inputs tab, there are even fewer parameters. Unlike the Dinapoli Target Malay, the Dinapoli targets metatrader 4 indicator offers two custom only two parameters affecting the indicator sensitivity:
- barn – the number of bars that indicator analyzes.
- Length – the number of bars that compose impulse wave (the wave's length).
The Colors tab should have been able to set the parameters of the line marking the swings and reactions, like in the DinapoliTarget Malay settings. However, this line is not displayed in the chart despite any changes in the visualization parameters. I do not know if it was done deliberately by the developers or it is a technical flaw.
How to trade with Dinapoli targets metatrader 4 indicator?

The above figure displays the BTCUSD chart with the Dinapoli targets metatrader 4 indicator. I may have noticed that I applied an unusual for me black-and-green theme. This is because the entry level is white by default, and you cannot see this line against the white background. Nonetheless, it is as easy to use this indicator as the previous one. Simple settings and deliberate minimalism in visualization suggest that Dinapoli targets metatrader 4 indicator should be used as a supplementary tool together with other forex technical indicators. The Dinapoli targets metatrader 4 (like the DinapoliTarget_Malay) suggests the following trading algorithm. The white line marks the entry level. To understand the direction of the trend, we analyze the location of the levels relative to the entry point. If they are above the white line, we enter long trades, if the level is below, we enter short trades. Therefore, the red dotted lines, like in the previous example, marks the suggested level for a stop loss. But I would set a buffer of a few pips from this level. The targets are set according to your trading strategy, or you can take the profit in parts at each of the levels marked with the green, yellow, and purple dotted lines. There are relatively few false signals.
Price Sound TS Dinapoli indicator
The Forex indicator Price Sound TS Dinapoli is an improved modification of the DinapoliTarget_Malay. It has more functions in terms of visualization and sound notifications.
How to install Price Sound TS Dinapoli?
Step 1. Download the archive via this link and unpack the file.
Step 2. Go through the algorithm described in the section devoted to Dinapoli Target Malay. Copy and paste the files Price Sound TS Dinapoli.ex4 and Price Sound TS Dinapoli.mq4 into the Indicators folder and restart the MetaTrader platform.
After the rest, open the Insert tab and select the Indicators folder. Next, go to the Custom tab and click on the Price Sound TS Dinapoli.
Custom Price Sound TS Dinapoli
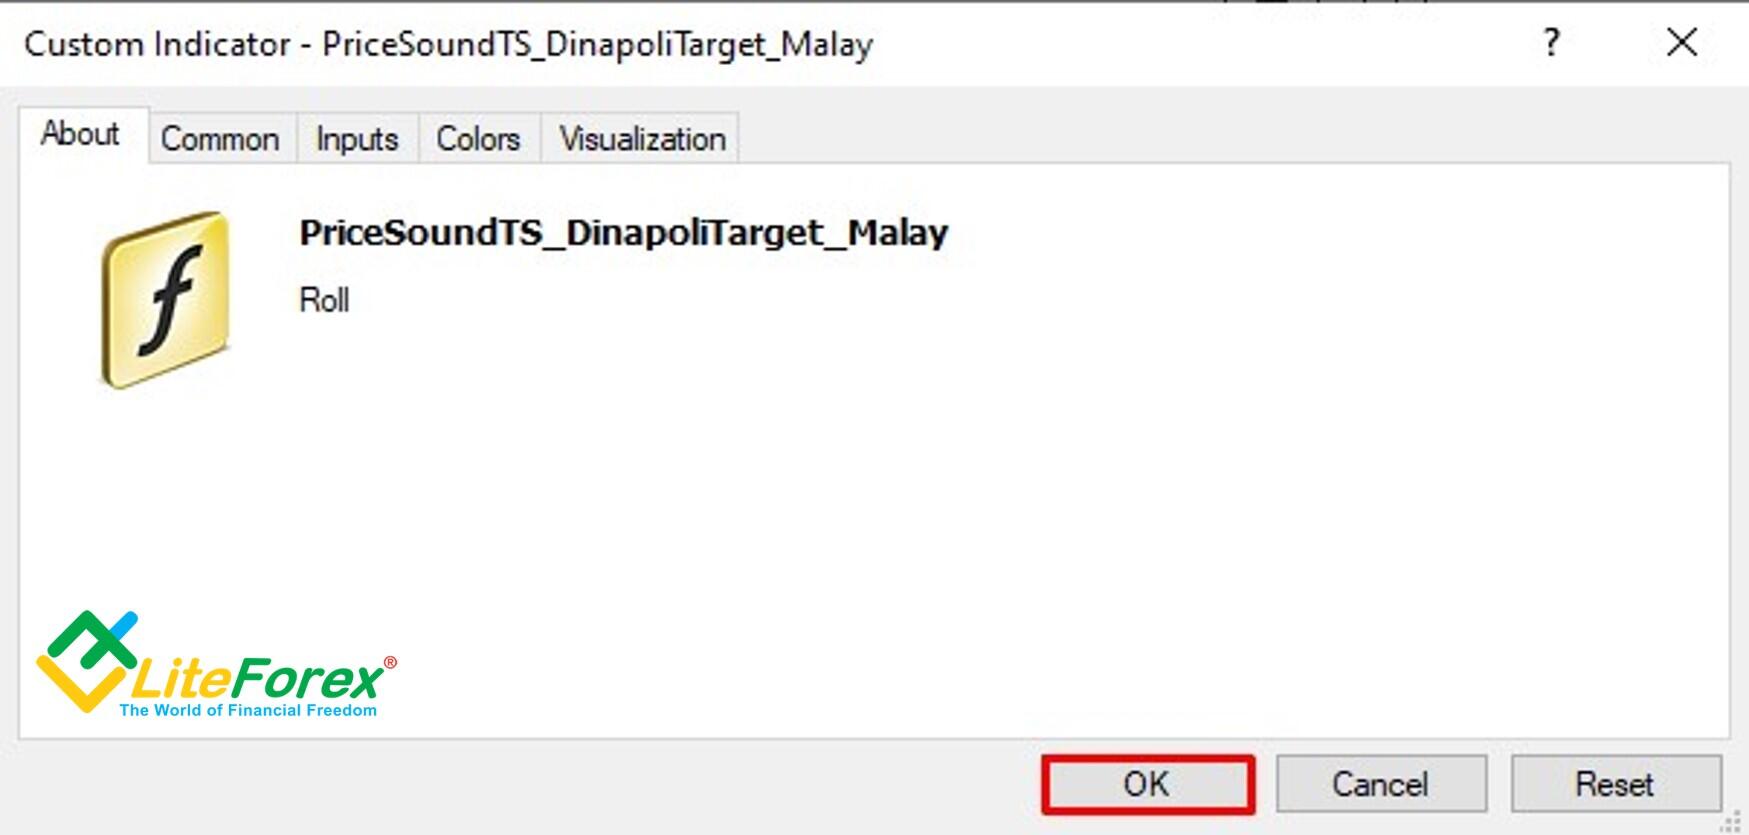
There will open the custom indicator window. If right away click on OK, you will launch the indicator with the default settings. Like with the previous DiNapoli indicators, you can adjust the permissions for the indicator in the Common tab, the visualization in the data window and the timeframes used can be changed in the Visualization tab. The DiNapoli levels can be used in any timeframes.
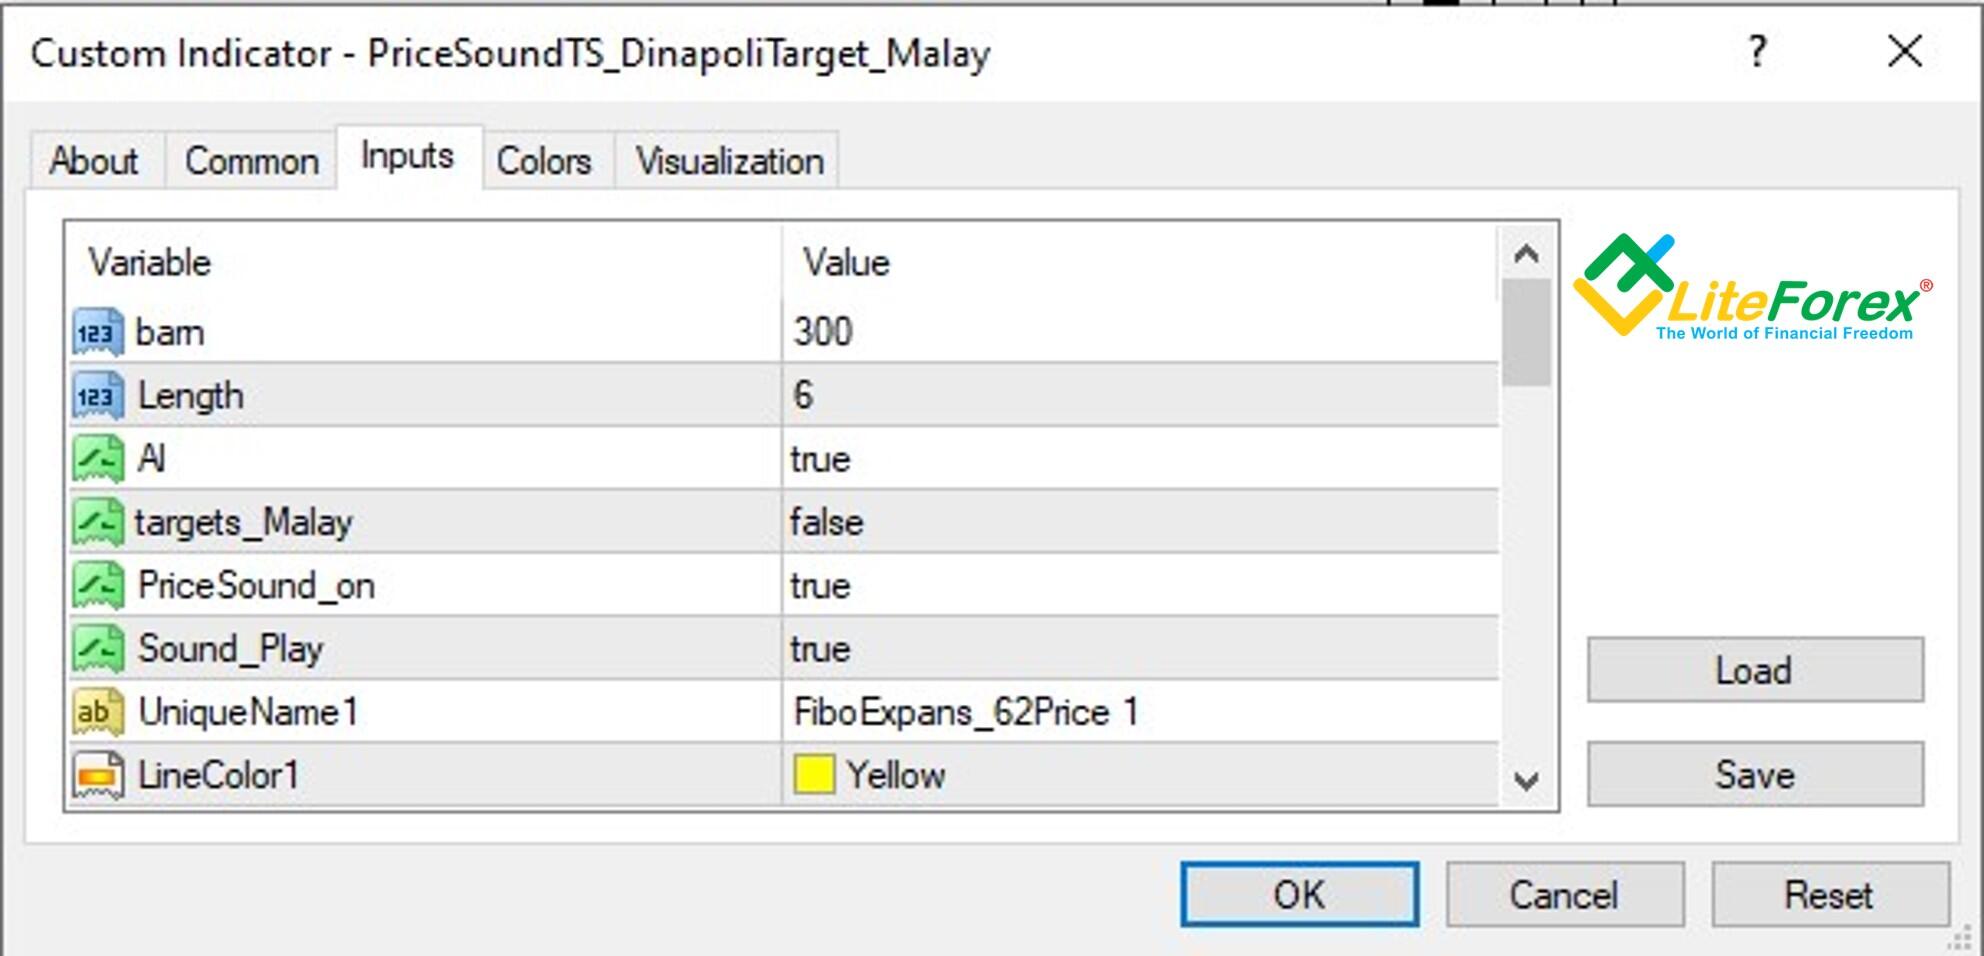
The main settings can be changed in the Inputs tab. The Price Sound TS Dinapoli has quite many settings affecting mainly the visual component, compared to the previous modifications of the DiNapoli levels indicators.
The full list of the settings that you can change is below:
- Barn – the number of bars that the indicator analyzes;
- Length – the number of bars that compose the impulse wave (the wave's length);
- Al – enables and disables sound alerts;
- targets_Malay – enables and disables the visual display of targets;
- PriceSound_on - enables and disables PriceSound on mode;
- Sound_Play – switches the sound on and off;
- Ind_levels - enables and disables the indication of the Fibonacci extensions level;
- Ind_Bar – number of bars of the shift for the pips indication;
- DistPips – the distance from the image of the pips number to the corresponding trend line;
- FexpansColor_levels – the color of the Fibonacci levels;
- Name_Fexpans – the name of the Fibonacci levels.
Parameters of the first trendline:
- UniqueName1 – name;
- LineColor1 – color;
- LineWidth1 – width;
- Sound1 – the name of the sound file;
You set the parameters of the second, third, and fourth trendlines in the same way. You only change the number of the variable. For example, the name of the second trendline will be UniqueName2, its color– LineColor2, and the width of the second trendline is specified in the LineWidth2 box.

Unlike the Dinapoli targets metatrader 4, the Price Sound TS Dinapoli allows you to adjust the color, thickness, and visualization style of the line that shows swings and reactions. All the specified parameters will be applied to the visual components in the chart.
How to trade with Price Sound TS Dinapoli?
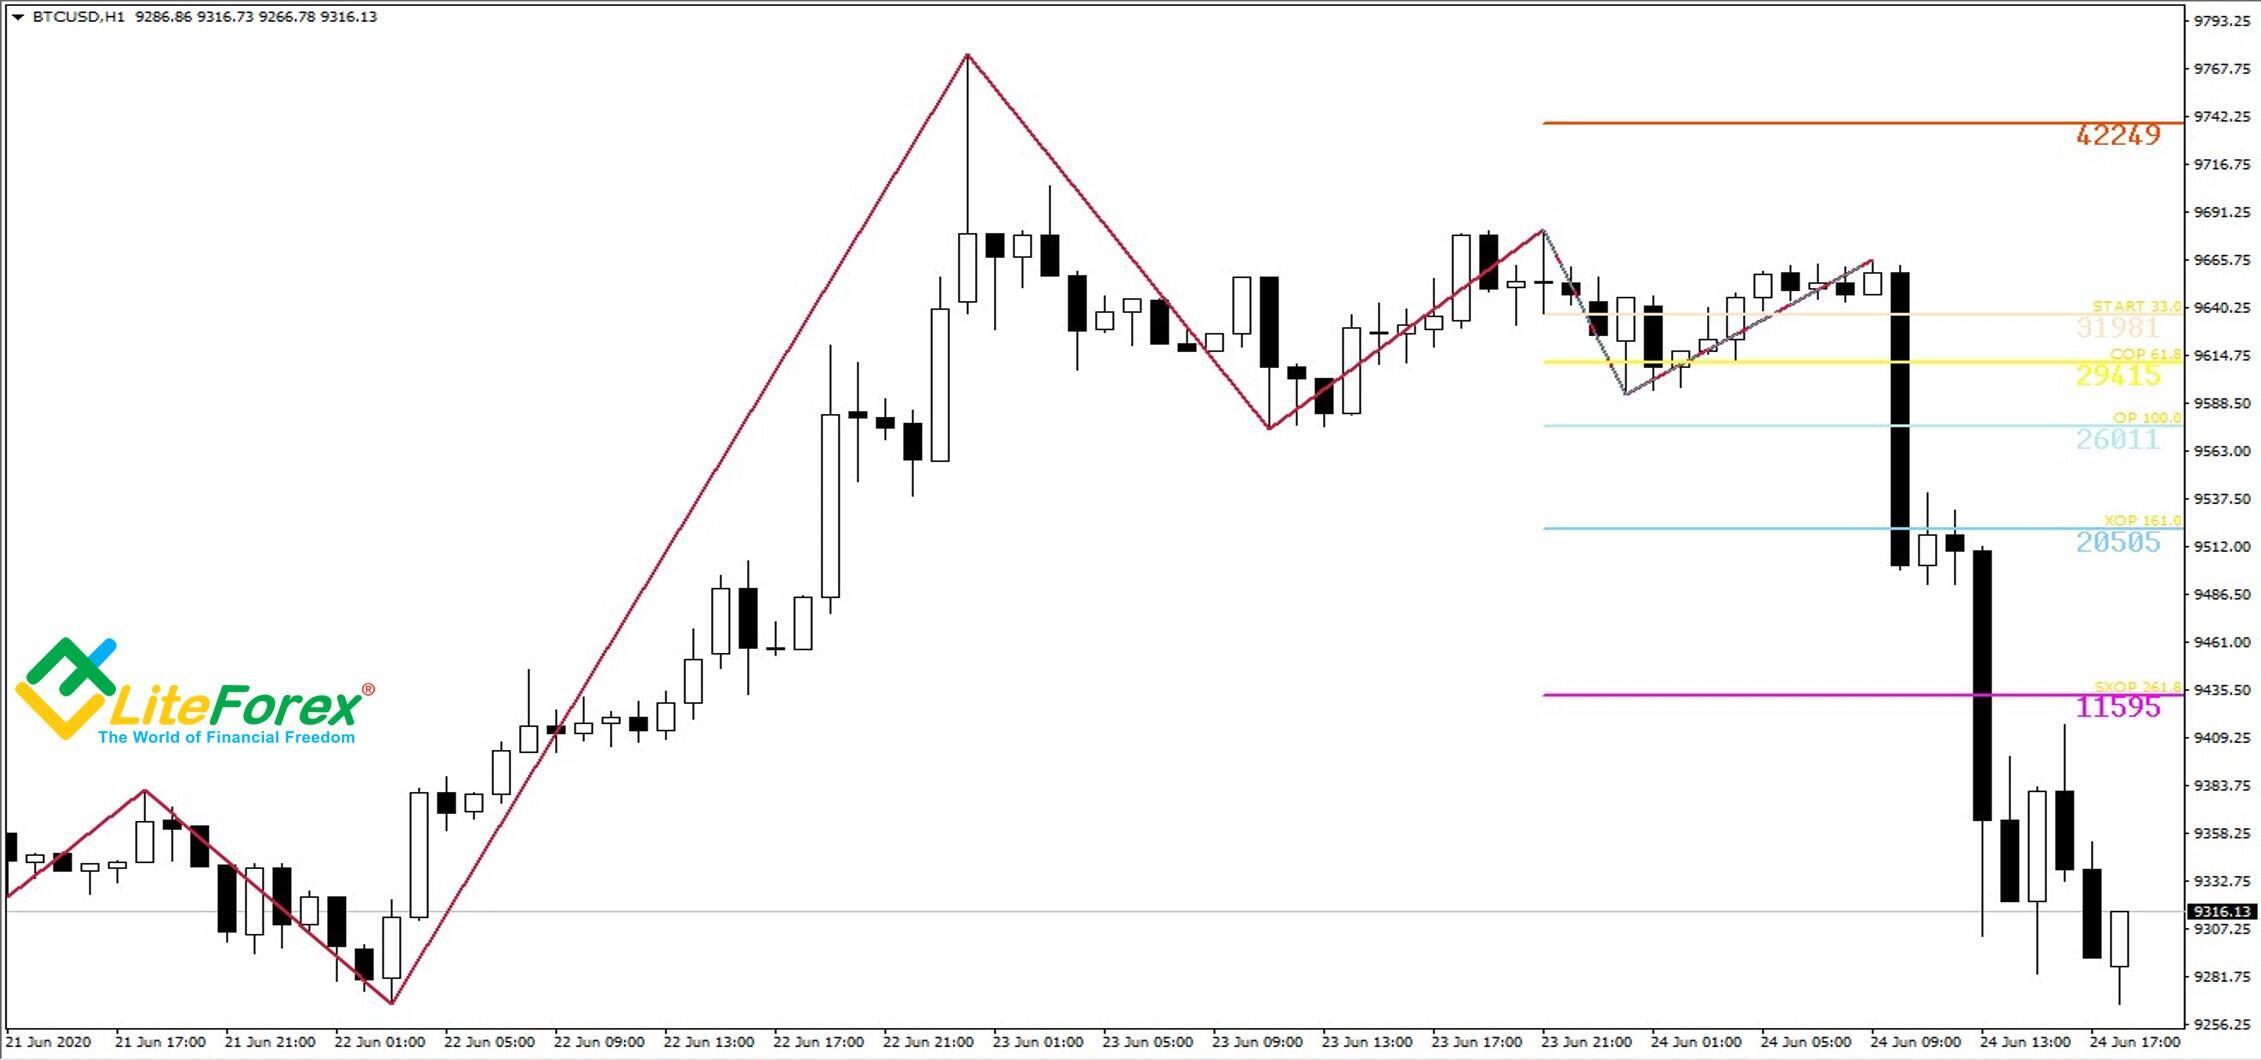
The above figure displays the Price Sound TS Dinapoli indicator with the default settings. The red diagonal lines marks swings and reactions. Horizontal lines are the Fibonacci levels. The labels corresponding to each level are displayed above the levels. The big numbers below indicate the distance of each level to the current price in pips. A big advantage of the Price Sound TS Dinapoli levels indicator is the advanced visualization settings and additional sound alerts when each of the key levels is reached. The information is arranged on the screen more compactly, it doesn’t overload the chart. The text marks on the levels will make it easy for a beginner to navigate. Another specific feature of the Price Sound TS Dinapoli is a super-extended target point, SXOP (super expanded objective point), which corresponds to the Fibonacci level of 268.1%. In the earlier DiNapoli levels indicators, this level wasn’t highlighted.
That is all I wanted to write about the DiNapoli levels trading indicators. After you read this article, I recommend you to apply all the theory you learned to practice and test the DiNapoli levels trading strategies and indicators on the trading assets you prefer. You can do it right here, on the LiteFinance website. The LiteFinance broker uses MT4 and MT5 trading terminals, for which you can free download all the DiNapoli indicators I covered in this article. But, for a better understanding of the DiNapoli levels trading technique, I highly recommend starting the practice with a simple Fibonacci grid.
I wish you good luck and good profits!
P.S. Did you like my article? Share it in social networks: it will be the best "thank you" :)
Ask me questions and comment below. I'll be glad to answer your questions and give necessary explanations.
Useful links:
- I recommend trying to trade with a reliable broker here. The system allows you to trade by yourself or copy successful traders from all across the globe.
- Use my promo code BLOG for getting deposit bonus 50% on LiteFinance platform. Just enter this code in the appropriate field while depositing your trading account.
- Telegram chat for traders: https://t.me/litefinancebrokerchat. We are sharing the signals and trading experience
- Telegram channel with high-quality analytics, Forex reviews, training articles, and other useful things for traders https://t.me/litefinance
Price chart of BTCUSD in real time mode
The content of this article reflects the author’s opinion and does not necessarily reflect the official position of LiteFinance. The material published on this page is provided for informational purposes only and should not be considered as the provision of investment advice for the purposes of Directive 2004/39/EC.